70032 - university of adelaide
TRANSCRIPT

PUBLISHED VERSION
Crismani, Wayne Matthew; Kapoor, Sanjay; Able, Jason Alan Comparative transcriptomics reveals 129 transcripts that are temporally regulated during anther development and meiotic progression in both bread wheat (Triticum aestivum) and rice (Oryza sativa), International Journal of Plant Genomics, 2011; 2011:Article ID 931898.
Copyright © 2011 Wayne Crismani et al.
This is an open access article distributed under the Creative Commons Attribution License, which permits unrestricted use, distribution, and reproduction in any medium, provided the original work is properly cited.
http://hdl.handle.net/2440/70032
PERMISSIONS
http://www.hindawi.com/journals/ijpg/guidelines/
Open Access authors retain the copyrights of their papers, and all open access articles are distributed under the terms of the Creative Commons Attribution license, which permits unrestricted use, distribution and reproduction in any medium, provided that the original work is properly cited.
17th May 2013

Hindawi Publishing CorporationInternational Journal of Plant GenomicsVolume 2011, Article ID 931898, 9 pagesdoi:10.1155/2011/931898
Research Article
Comparative Transcriptomics Reveals 129 Transcripts ThatAre Temporally Regulated during Anther Development andMeiotic Progression in Both Bread Wheat (Triticum aestivum)and Rice (Oryza sativa)
Wayne Crismani,1, 2 Sanjay Kapoor,3 and Jason A. Able1
1 School of Agriculture, Food & Wine, The Waite Research Institute, The University of Adelaide, Waite Campus, PMB1, Glen Osmond,SA 5064, Australia
2 Station de Genetique et Amelioration des Plantes, INRA, Centre de Versailles Grignon, Route de Saint-Cyr, 78026 Versailles, France3 Interdisciplinary Center for Plant Genomics and Department of Plant Molecular Biology, University of Delhi, South Campus,Benito Juarez Road, New Delhi 110021, India
Correspondence should be addressed to Jason A. Able, [email protected]
Received 24 June 2011; Accepted 9 August 2011
Academic Editor: Pierre Sourdille
Copyright © 2011 Wayne Crismani et al. This is an open access article distributed under the Creative Commons AttributionLicense, which permits unrestricted use, distribution, and reproduction in any medium, provided the original work is properlycited.
Meiosis is a specialised type of cell division in sexually reproducing organisms that generates genetic diversity and preventschromosome doubling in successive generations. The last decade has seen forward and reverse genetic approaches identifyingmany genes in the plant kingdom which highlight similarities and differences in the mechanics of meiosis between taxonomickingdoms. We present here a high throughput in silico analysis, using bread wheat and rice, which has generated a list of 129transcripts containing genes with meiotic roles and some which are currently unknown.
1. Introduction
Since its inception over a decade ago, microarray technologyhas significantly increased its application-base and popular-ity. Initially developed to measure expression levels of giventranscripts, microarrays provide a snapshot of the dynamiccellular transcriptomes which have been extracted from anisolated tissue-type. A common application of this technol-ogy is the comparison of the same tissue-type at the samestage of development between an experimental treatment ordiseased tissue compared to a wild-type control. However,data from tissue time-courses/developmental series can alsobe generated with microarrays and have been reported inseveral species investigating different biological processes.
Meiosis is one such biological process and results in theformation of four genetically unique gametes, hence promot-ing genetic variation. Furthermore, meiosis is essential insexually reproducing organisms as it prevents chromosome
doubling in successive generations. Using microarray orSOLiD RNA-seq platforms, various studies have investigatedthe meiotic transcriptomes (often time-course experiments)in a variety of kingdoms. Examples include yeast (Saccha-romyces cerevisiae) [1], Drosophila [2], Caenorhabditis elegans[3], rat (Rattus rattus) [4], mouse (Mus musculus) [5], breadwheat (Triticum aestivum L.) [6], and, more recently, rice(Oryza sativa L.) [7] and Arabidopsis (Arabidopsis thalianaL.) [8].
While our understanding of meiosis in some nonplantsystems such as budding yeast is extensive, our knowledgeof meiosis in plants is less advanced. Nonetheless, in thepast 10 years (further to what has been achieved in Ara-bidopsis and rice), there has been an ongoing research efforttowards building our knowledge across several different plantspecies, including barley (Hordeum vulgare L.) [9], wheat(T. aestivum) [10–12], maize (Zea mays L.) [13], and tomato(Solanum lycopersicum L.) [14]. With some exceptions

2 International Journal of Plant Genomics
(for example, where a gene has been plant-specific), suchstudies have concentrated on determining the function ofone or two genes, that had been previously studied innonplant systems, using reverse genetics. However, a studyby Crismani et al. [6] detailing the first report investigatingthe meiotic transcriptome in any plant enabled analysis at agenome wide scale determining what genes were meioticallyregulated across the extensive time-course examined. Theplant in that study, bread wheat, is an allohexaploid withthe genome being approximately 35 and 110 times thesize of the rice and Arabidopsis genomes, respectively.Significantly, the Crismani et al. [6] study identified 142transcripts (from a clustered subset of 350 transcripts) thatwere meiotically regulated but novel (when compared toall publically available sequence in the NCBI database atthat time). More recently, in rice, the male gametophytehas also been examined using microarray technology [7].This study identified a cluster of 372 transcripts that hada distinct meiotic-specific expression profile, from which117 are either hypothetical/expressed or novel sequenceswith no annotations. Consequently, these two highlightedstudies have facilitated the identification of many novel (andknown) candidates that could be targeted for functionalcharacterisation during meiosis in these species.
With these datasets being publically available, this shortcommunication highlights that by comparatively analysingthe wheat and rice meiotic transcriptomes, 129 transcriptsthat are common between these species during male gameto-phyte development have been identified. Further, expressionanalysis of 12 randomly selected transcripts (from the 129)between the two species revealed that seven had a correlationcoefficient >0.6. Given the accessibility to rice mutant stocksand also putative homologues in Arabidopsis, this makes foran attractive approach in identifying the phenotype resultingfrom gene knockouts which would otherwise be a significantundertaking to achieve in bread wheat.
2. Materials and Methods
2.1. Microarray Datasets. Only two microarray datasetscurrently exist on the Gene Expression Omnibus database(http://www.ncbi.nlm.nih.gov/geo/), which represent anextensive time-course through male gametophyte develop-ment in cereals. The production of both the wheat [6]and rice [7] datasets has been described previously. Theseven stages of wheat previously examined were premeiosis,leptotene to pachytene (LP), diplotene to anaphase I (DA),telophase I to telophase II (TT), tetrads (T), immature pollen(IP), and mature anthers (MAN) [6]. As the rice time-coursematerial hybridised to the GeneChip Rice Genome Arrayswas less detailed than the dataset from the wheat time-course, particular stages of the wheat dataset were excludedfrom the analysis or pooled, where appropriate. The fourstages of male gametophyte development available for ricewere premeiosis (PM), meiosis (M), single-celled pollen(SCP) otherwise herein referred to as immature pollen (IP)(comparable to the wheat IP stage), and trinucleate pollen(TPA) otherwise herein referred to as mature anthers (MAN)(comparable to the wheat MAN stage).
2.2. Data Reduction. The two datasets are very large withthe wheat chip containing 60,703 probe sets and the ricechip 57,381 probe sets. To create a subset of transcriptsenriched for potential meiotic transcripts, the two datasetswere reduced significantly. For rice, t-tests were performedbetween PM and M from the microarray data to iden-tify transcripts that were regulated by anther progressionthrough meiosis. Probe sets were selected that had a cor-rected P value smaller than 0.05 between PM and M inaddition to a log base 2 RMA-normalised value greater thanfive in at least one of the PM or M microarrays.
For wheat, as the previously reported microarray exper-iment separated meiotic stages specifically, data from a poolof material as broad as “meiotic” did not exist. To create asubset of data comparable to the rice PM versus M subset,t-tests were performed individually between the three PMreplicates and the three replicates from the meiotic stages:LP, DA, and TT. The transcripts were then refined to onlyinclude those with a log base 2 RMA-normalised intensitygreater than five in at least one of the microarrays hybridisedwith cRNA from the meiotic stages; PM, LP, DA, or TT.The results were then pooled. Therefore, transcripts whichwere expressed significantly different in more than one ofthe wheat t-tests were only included in the dataset once, thuscreating a nonredundant dataset.
2.3. Sequence Retrieval, Further Data Filtration, and Tran-script Annotation. The program—Fast tricks with FASTA—a useful bioinformatics tool (Dr. Ute Baumann, AustralianCentre for Plant Functional Genomics, Adelaide, unpublisheddata) was used to retrieve the subset of sequences for therice and wheat meiotically regulated transcripts from wholechip sequences. A database was created with the rice and thewheat subset sequences. To identify the transcripts within thewheat and rice subsets that shared strong sequence similarity(E value < e−30) in addition to being meiotically regulated,Basic Local Alignment Search Tool (BLAST) analyses wereperformed between the two subsets of transcripts. The wheatand rice reduced datasets were reciprocally BLASTed againstone another using both nucleotide BLAST (BLASTn) and atranslated nucleotide BLAST (tBLASTx). The most similarhit was added to the further refined subsets of data for eachquery, given that they had occurred at a significance levelbelow the set threshold. Transcripts which appeared as themost similar hit for more than one query were only includedonce. Annotations for the transcripts were retrieved fromthe NCBI database by using a batch BLAST program witha translated nucleotide database search using a translatednucleotide query (BLASTx) and tBLASTx to simultaneouslyidentify annotated sequences (cutoff E value < e−20).
2.4. Comparative Expression Profiling. The meiotically reg-ulated data from the wheat and rice datasets was thencentred by removing the average expression intensity valuefor a given transcript across their respective time-course.This removes the absolute values and replaces them witha movement about their average expression over the time-course with respect to doubling or halving their expressionlevels as the RMA-normalised data is presented as log base 2.
International Journal of Plant Genomics 3
Wheat chip
t -tests t -tests
Rice chip
497
125/83
129/82
wheat
Query
QueryDatabase
Database
7410 rice sequences
104 sequences
(t)BLASTx 129annotation
retrieval
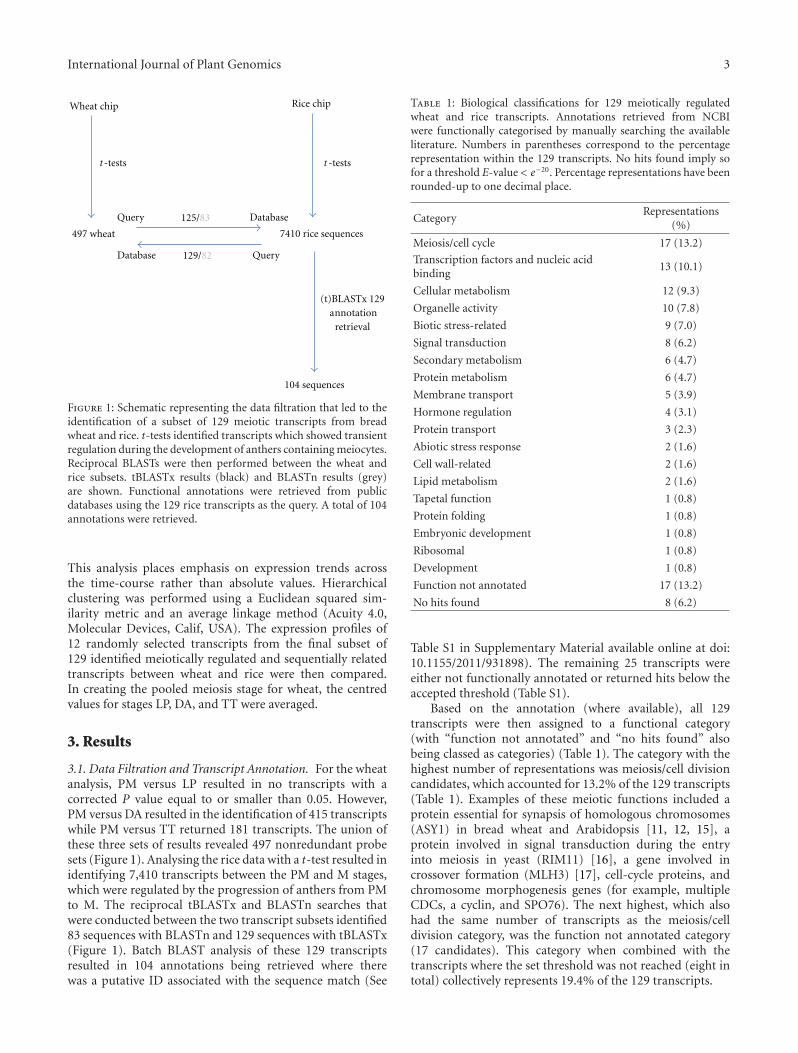
Figure 1: Schematic representing the data filtration that led to theidentification of a subset of 129 meiotic transcripts from breadwheat and rice. t-tests identified transcripts which showed transientregulation during the development of anthers containing meiocytes.Reciprocal BLASTs were then performed between the wheat andrice subsets. tBLASTx results (black) and BLASTn results (grey)are shown. Functional annotations were retrieved from publicdatabases using the 129 rice transcripts as the query. A total of 104annotations were retrieved.
This analysis places emphasis on expression trends acrossthe time-course rather than absolute values. Hierarchicalclustering was performed using a Euclidean squared sim-ilarity metric and an average linkage method (Acuity 4.0,Molecular Devices, Calif, USA). The expression profiles of12 randomly selected transcripts from the final subset of129 identified meiotically regulated and sequentially relatedtranscripts between wheat and rice were then compared.In creating the pooled meiosis stage for wheat, the centredvalues for stages LP, DA, and TT were averaged.
3. Results
3.1. Data Filtration and Transcript Annotation. For the wheatanalysis, PM versus LP resulted in no transcripts with acorrected P value equal to or smaller than 0.05. However,PM versus DA resulted in the identification of 415 transcriptswhile PM versus TT returned 181 transcripts. The union ofthese three sets of results revealed 497 nonredundant probesets (Figure 1). Analysing the rice data with a t-test resulted inidentifying 7,410 transcripts between the PM and M stages,which were regulated by the progression of anthers from PMto M. The reciprocal tBLASTx and BLASTn searches thatwere conducted between the two transcript subsets identified83 sequences with BLASTn and 129 sequences with tBLASTx(Figure 1). Batch BLAST analysis of these 129 transcriptsresulted in 104 annotations being retrieved where therewas a putative ID associated with the sequence match (See
Table 1: Biological classifications for 129 meiotically regulatedwheat and rice transcripts. Annotations retrieved from NCBIwere functionally categorised by manually searching the availableliterature. Numbers in parentheses correspond to the percentagerepresentation within the 129 transcripts. No hits found imply sofor a threshold E-value < e−20. Percentage representations have beenrounded-up to one decimal place.
CategoryRepresentations
(%)
Meiosis/cell cycle 17 (13.2)
Transcription factors and nucleic acidbinding
13 (10.1)
Cellular metabolism 12 (9.3)
Organelle activity 10 (7.8)
Biotic stress-related 9 (7.0)
Signal transduction 8 (6.2)
Secondary metabolism 6 (4.7)
Protein metabolism 6 (4.7)
Membrane transport 5 (3.9)
Hormone regulation 4 (3.1)
Protein transport 3 (2.3)
Abiotic stress response 2 (1.6)
Cell wall-related 2 (1.6)
Lipid metabolism 2 (1.6)
Tapetal function 1 (0.8)
Protein folding 1 (0.8)
Embryonic development 1 (0.8)
Ribosomal 1 (0.8)
Development 1 (0.8)
Function not annotated 17 (13.2)
No hits found 8 (6.2)
Table S1 in Supplementary Material available online at doi:10.1155/2011/931898). The remaining 25 transcripts wereeither not functionally annotated or returned hits below theaccepted threshold (Table S1).
Based on the annotation (where available), all 129transcripts were then assigned to a functional category(with “function not annotated” and “no hits found” alsobeing classed as categories) (Table 1). The category with thehighest number of representations was meiosis/cell divisioncandidates, which accounted for 13.2% of the 129 transcripts(Table 1). Examples of these meiotic functions included aprotein essential for synapsis of homologous chromosomes(ASY1) in bread wheat and Arabidopsis [11, 12, 15], aprotein involved in signal transduction during the entryinto meiosis in yeast (RIM11) [16], a gene involved incrossover formation (MLH3) [17], cell-cycle proteins, andchromosome morphogenesis genes (for example, multipleCDCs, a cyclin, and SPO76). The next highest, which alsohad the same number of transcripts as the meiosis/celldivision category, was the function not annotated category(17 candidates). This category when combined with thetranscripts where the set threshold was not reached (eight intotal) collectively represents 19.4% of the 129 transcripts.

4 International Journal of Plant Genomics
PM LP DA TT T IP MAN
10
>−1.5 <1.5
(a)
3
2
1
0
−1
−2
−3
−4
−5PM LP DA TT T IP MAN
(b)
PM LP DA TT T IP MAN
2
1.5
1
0.5
0
−0.5
−1
−1.5
−2
(c)
Figure 2: Hierarchical clustering of 125 wheat transcripts that were regulated over the progression of meiosis. The expression profiles of 125transcripts (rows) were grouped across seven anther stages (columns) in a heat map (a). Similar expression profiles are clustered together asindicated by the dendrogram. The expression profiles of two clusters that are preferentially expressed in early meiosis which display similarexpression profiles are highlighted in blue on the dendrogram. These clusters representing 28 and 20 transcripts are also shown separatelyin (b) and (c), respectively. Premeiosis (PM), leptotene–pachytene (LP), diplotene–anaphase I (DA), telophase I–telophase II (TT), tetrads(T), immature pollen (IP), mature anthers (MAN). Expression values (indicated by green through to red in colour) are centred, log base 2,RMA-normalised values.
Also of note was the category classified as transcriptionfactors and nucleic acid binding, which included severalproteins that are broadly defined as zinc fingers (Table 1,Table S1). The category classifications of the remaining74 transcripts included but were not limited to cellular,secondary, and lipid metabolism through to biotic andabiotic stress related annotations (Table 1, Table S1).
3.2. Comparative Expression Profiling. Transcripts with sim-ilar expression profiles were clustered together using hierar-chical clustering using both the wheat (125) and rice (129)transcript datasets (Figures 2 and 3). This resulted in theidentification of a number of interesting clusters in wheat(Figure 2). A group of 28 transcripts from the wheat datasetwere expressed at higher levels during the majority of meiosiswhen compared to the other stages examined (Figure 2(b)).Several of these transcripts showed strong sequence similar-ities to histones and chromatin remodelling factors, proteinscontrolling cell cycle, recombination, and synapsis. Another
cluster of interest with 20 transcripts was also expressedpreferentially in premeiosis but was downregulated at agreater rate than the cluster aforementioned (Figure 2(c)).This cluster contained putative homologues of proteinsinvolved in crossover formation, cell division, microtubulefunction, and chromatin remodelling.
Similarly, two distinct clusters were observed from therice dataset (Figure 3). Indeed, these clusters (totalling 46transcripts) were even more pronounced in rice (Figures 3(b)and 3(c)). However, the annotations of these 46 transcriptsfrom rice identified fewer transcripts that can easily beassociated with meiotic functions when compared to thewheat transcripts. The first distinct rice cluster, which wasrepresented by only seven transcripts, contained OsPAIR2(essential for synapsis in rice [18]), putative homologuesof a PIWI domain containing protein (germline-specificRNAi components), and a cyclin (Figure 3(b)). Within thesecond rice cluster, 39 transcripts showed higher levels ofexpression during the premeiotic and meiotic stages and thenlower transcript levels in the remaining two stages of IP and

International Journal of Plant Genomics 5
PM M IP MAN
>−1.5 <1.5
0 1
(a)
PM M IP MAN
6
4
2
0
−2
−4
(b)
PM M IP MAN
6
4
2
0
−2
−4
−6
(c)
Figure 3: Hierarchical clustering of 129 rice transcripts that were regulated over the progression of meiosis. The expression profiles of 129transcripts (rows) were grouped across four anther stages (columns) in a heat map (a). Similar expression profiles are clustered together asindicated by the dendrogram. The expression profiles of two clusters that are preferentially expressed in premeiotic and/or meiotic stageswhich display similar expression profiles are highlighted in blue on the dendrogram. These clusters representing 7 and 39 transcripts arealso shown separately in (b) and (c), respectively. Premeiosis (PM), meiosis (M), immature pollen (IP), mature anthers (MAN). Expressionvalues (indicated by green through to red in colour) are centred, log base 2, RMA-normalised values.
MAN (Figure 3(c)). Some of these rice transcripts showedsimilarity to genes that have roles in chromatin remodelling.
To determine whether a relationship between the expres-sion profiles of selected transcripts from wheat and riceexisted, 12 randomly selected transcripts from the dataset of129 meiotically regulated and sequentially related transcriptswere compared. While the correlation coefficient valuesbetween the wheat and rice expression profiles varied forthese 12 transcripts, both a positive correlation as high as0.91 and a moderate-high negative correlation of −0.79 wererecorded. In total, seven out of the 12 transcripts shared acorrelation coefficient stronger than 0.6 (Figure 4).
To extend the utility of this study outside of two impor-tant cereal species, we also identified putative homologuesin Arabidopsis and Poplar (Populus trichocarpa Torr. & A.Gray) for a select number of transcripts from wheat andrice. An electronic fluorescent pictograph (eFP) browser(http://bbc.botany.utoronto.ca/efp/cgi-bin/efpWeb.cgi/) wasthen used to provide an indication as to whether the tran-scripts showed preferential expression in meiotic material ineither of these additional plant species. Several transcripts
(including ASY1) showed preferential expression in repro-ductive organs (buds in Arabidopsis and catkins in P.trichocarpa). For example, primary gene ID numbers includ-ing At1g01280, At1g02050, and At1g67370 (ASY1) showpreferential expression in Arabidopsis buds at or nearmeiosis. Similar results are seen in male meiotic tissue(male catkins) of the respective putative P. trichocarpahomologues (Ptpaffx.202268.1.S1 at, Ptpaffx.202128.1.S1 atand Ptpaffx.153910.1.a1 at, resp.). However, numerous tran-scripts showed patterns with stronger expression in vegeta-tive tissues (e.g., primary gene ID numbers; At1g05010 andthe respective Poplar homologue, Ptp.5158.1.S1 at).
4. Discussion
4.1. Data Filtration. The wheat and rice data filtrationmethod used to identify transcripts putatively having meioticroles resulted in very different numbers being obtained;497 and 7,410, respectively. As previously mentioned, thewheat genome has not yet been sequenced, and while thegenome size varies considerably between these two species

6 International Journal of Plant Genomics
2
1.5
1
0.5
0
−0.5
−1
−1.5
−2
−2.5
1 2 3 4
(0.84)
TaAffx.92467.1.S1 atOs.10258.1.S1 at
(a)
5
4
3
2
1
0
1
3
4
5
−
−−−
−2
1 2 3 4
(0.87)
Ta.2860.1.S1 at
Os.12974.1.S1 at
(b)
3
2
1
0321 4
−1
−2
−3
−4
(0.69)
Ta.25330.1.A1 at
Os.11631.1.S1 at
(c)
−2.5
−2
−1.5
−1
−0.5
0
0.5
1
1.5
1 2 3 4
(0.76)
Ta.8998.1.S1 at
Os.11668.1.S1 at
(d)
−2
−1.5
−1
−0.5
0
0.5
1
1.5
2
1 2 3 4
Ta.425.2.S1 at
Os.12268.1.S1 at
(0.14)
(e)
−2
−1.5
−1
−0.5
0
0.5
1
1.5
Ta.8976.1.S1 at
Os.11407.1.S1 at
(0.13)
1 2 3 4
(f)
Figure 4: Continued.

International Journal of Plant Genomics 7
−3
−2
−1
0
1
2
3
1 2 3 4
Ta.485.1.A1 at
Os.14415.1.S1 a at
(−0.72)
(g)
−2
−1.5
−1
−0.5
0
0.5
1
1.5
2
Ta.11621.1.A1 at
Os.15548.1.S1 at
(0.66)
1 2 3 4
(h)
−2.5
−2
−1.5
−1
−0.5
0
0.5
1
1.5
Ta.4989.1.S1 at
Os.15551.1.S1 at
(−0.74)
1 2 3 4
(i)
−2
−1.5
−1
−0.5
0
0.5
1
1.5
2
1 2 3 4
Ta.6205.1.S1 at
Os.15696.1.S1 a at
(0.91)
(j)
−1.5
−1
−0.5
0
0.5
1
1.5
Ta.6973.2.S1 at
Os.16956.1.S1 s at
(0.79)
1 2 3 4
(k)
−2.5
−2
−1.5
−1
−0.5
0
0.5
1
1.5
2
Ta.6507.1.S1 at
Os.17268.1.S1 at
(−0.79)
1 2 3 4
(l)
Figure 4: The correlation of 12 randomly selected, meiotically regulated expression profiles identified from the wheat and rice datasets. Bluediamonds and orange squares represent the wheat and rice transcripts, respectively. Numbers in parentheses represent the correlation coeffi-cient between the two expression profiles. Expression values on the Y-axes are centred, log base 2, RMA-normalised values. Stages of antherdevelopment are displayed on the X-axes as 1 to 4, which represent premeiosis, meiosis, immature pollen, and mature anthers, respectively.

8 International Journal of Plant Genomics
and the gene number will also be variable, the large observeddifference must be accounted to something else. Most likely,this is due to two independent research groups beingresponsible for the harvesting and staging of collected wheatand rice anthers that were subsequently used in the arrayexperiments previously reported [6, 7]. t-tests between themeiotic tissues and IP or MAN were excluded from theanalysis as IP and MAN have very different profiles at thetranscript level with the vast majority of the genome beingtemporally regulated during these stages. Including thesestages would have resulted in an overestimation of probe setsthat are involved in meiosis during the development of themale gametophyte.
The reciprocal BLASTs between the 497 and 7,410 wereexpected to return approximately the same number of hits asthe majority of genes in rice would have a wheat homologuebased on both sequence and function. This was found to bethe case with 125/83 returned for wheat to rice, while 129/82were returned for rice to wheat. However, microarrays cancontain probe sets designed against multiple noncontiguousESTs representing unique parts of a whole transcript fromone species. In the case where the homologous transcriptin the other species is represented by a full-length sequencein the database, a discrepancy will occur when using areciprocal BLAST. This becomes increasingly likely given thatthe wheat chip was designed as a “discovery chip” from thewheat ESTs which were present in the public databases in2004. The rice chip is a much closer representation of whatis the entire transcriptome in this plant species. Generally,however, there was only a discrepancy of one significanthit using BLASTn or four significant hits when using thetBLASTx program (Figure 1).
104 transcripts shared similarity with previously anno-tated sequences. The most common annotation wasmeiotic/cell-cycle. The two processes were pooled since theyare very difficult to uncouple as meiosis is a specialisedtype of cell cycle division. There are close to 50 meioticgenes in plants that have been identified and characterised todate [19], and the categorical data presented here includedonly two of these 50 or so meiotic genes, ASY1 and MLH3,in addition to various proteins related to cell cycle andchromatin remodelling. The inability to detect a higherpercentage of the 50 known meiotic genes suggests that,in wheat and rice at least, (1) the remaining known genesnot identified by this method have a more static expressionprofile than the transcripts that matched the selection criteriaused in this study; (2) they were not present on the wheatchip when developed and therefore were not detected; and/or(3) some of the sequences have not been conserved acrossspecies.
Significantly, from a gene discovery perspective, therewere 25 transcripts with no similarity to functionally char-acterised genes which potentially have roles as importantto meiosis as ASY1, MLH3, and chromatin remodelling.Other annotations such as roles in embryo developmentand tapetal-specific roles are consistent with the type ofbackground expression profiles detected in a meiotic time-course, especially as whole anthers were used in both thewheat and rice experiments [6, 7].
4.2. Comparative Expression Profiling. Hierarchical cluster-ing of the wheat and rice data subsets grouped transcriptswith similar expression profiles adjacent to one anotherin the dendrogram. When comparing species, there weresimilarities between the results produced in the heat mapclusters for wheat and rice despite the lower resolutionof the rice data set. Analysis of the clusters which arepreferentially expressed during meiosis did reveal an enrich-ment of meiotic/cell-cycle transcripts. Given that thereare approximately 50 known meiotic genes in plants andapproximately 41,000 genes predicted to be in the ricegenome (excluding transposable element related genes—seehttp://rice.plantbiology.msu.edu), this represents 0.12% ofthe genome. Therefore, the identification of ASY1, MLH3,and SPO76 alone in the wheat and rice datasets is approx-imately a 19-fold increase in meiotic transcript enrichmentthan the known genomic average.
The comparison of 12 randomly selected wheat/rice tran-scripts from the subset of 129 revealed that the expressionprofiles between more than half of these shared a correlationcoefficient greater than 0.6. This suggests that not all putativehomologues are expressed identically from the time theydiverged over the course of evolution. Nonetheless, thereare still common themes in the grasses and by analysingsequences across several species, this has been shown formany important genes involved in early meiosis [20].Other factors that must be taken into consideration whenconsidering the level of correlation that has been observedbetween the wheat and rice datasets investigated in this studyinclude the variation in staging between the species andalso the environmental conditions in which the plants weregrown before anther harvesting. Both of these, in additionto other factors, may have influenced the expression of theindividual transcripts analysed.
The cross-species expression analysis was furtherextended to include Arabidopsis and P. trichocarpa by usingthe eFP browser tool [21]. Analysis of putative Arabidopsisand P. trichocarpa homologues from selected wheat and ricetranscripts in the eFP browser revealed some commonalitiesbetween all four plant species. Such a finding suggeststhat the information generated from wheat and rice istransferrable not only reciprocally but also across frommonocotyledonous plants to dicotyledons (where sequenceand expression data exists). This infers that the results ofwhole genome screens in one plant species can be used as aguide for screening meiotic mutants in other plant species.In concluding, we propose that this list of 129 transcripts,with particular focus on the 25 novel transcripts, formthe basis of a reverse genetic screen for identifying genesinvolved in plant meiosis.
Acknowledgment
This research was supported by the Australian Govern-ment under the Australia-India Strategic Research Fund(AISRF)—a component of the Australian Scholarships ini-tiative, the Indian Government through the Department ofScience and Technology (DST), and the Molecular PlantBreeding Cooperative Research Centre (MPB CRC).

International Journal of Plant Genomics 9
References
[1] S. Chu, J. DeRisi, M. Eisen et al., “The transcriptional programof sporulation in budding yeast,” Science, vol. 282, no. 5389,pp. 699–705, 1998.
[2] J. Andrews, G. G. Bouffard, C. Cheadle, J. Lu, K. G. Becker, andB. Oliver, “Gene discovery using computational and microar-ray analysis of transcription in the Drosophila melanogastertestis,” Genome Research, vol. 10, no. 12, pp. 2030–2043, 2000.
[3] V. Reinke, H. E. Smith, J. Nance et al., “A global profile ofgermline gene expression in C. elegans,” Molecular Cell, vol. 6,no. 3, pp. 605–616, 2000.
[4] U. Schlecht, P. Demougin, R. Koch et al., “Expression profilingof mammalian male meiosis and gametogenesis identifiesnovel candidate genes for roles in the regulation of fertility,”Molecular Biology of the Cell, vol. 15, no. 3, pp. 1031–1043,2004.
[5] A. L. Y. Pang, W. Johnson, N. Ravindranath, M. Dym,O. M. Rennert, and W. Y. Chan, “Expression profiling ofpurified male germ cells: stage-specific expression patternsrelated to meiosis and postmeiotic development,” PhysiologicalGenomics, vol. 24, no. 2, pp. 75–85, 2006.
[6] W. Crismani, U. Baumann, T. Sutton et al., “Microarrayexpression analysis of meiosis and microsporogenesis inhexaploid bread wheat,” BMC Genomics, vol. 7, article 267,2006.
[7] P. Deveshwar, W. D. Bovill, R. Sharma, J. A. Able, and S.Kapoor, “Analysis of anther transcriptomes to identify genescontributing to meiosis and male gametophyte developmentin rice,” BMC Plant Biology, vol. 11, article 78, 2011.
[8] H. Yang, P. Lu, Y. Wang, and H. Ma, “The transcriptome land-scape of Arabidopsis male meiocytes from high-throughputsequencing: The complexity and evolution of the meioticprocess,” Plant Journal, vol. 65, no. 4, pp. 503–516, 2011.
[9] A. H. Lloyd, A. S. Milligan, P. Langridge, and J. A. Able,“TaMSH7: a cereal mismatch repair gene that affects fertility intransgenic barley (Hordeum vulgare L.),” BMC Plant Biology,vol. 7, article 67, 2007.
[10] S. Griffiths, R. Sharp, T. N. Foote et al., “Molecular charac-terization of Ph1 as a major chromosome pairing locus inpolyploid wheat,” Nature, vol. 439, no. 7077, pp. 749–752,2006.
[11] S. A. Boden, N. Shadiac, E. J. Tucker, P. Langridge, and J. A.Able, “Expression and functional analysis of TaASY1 duringmeiosis of bread wheat (Triticum aestivum),” BMC MolecularBiology, vol. 8, article 65, 2007.
[12] S. A. Boden, P. Langridge, G. Spangenberg, and J. A. Able,“TaASY1 promotes homologous chromosome interactionsand is affected by deletion of Ph1,” Plant Journal, vol. 57, no.3, pp. 487–497, 2009.
[13] W. P. Pawlowski, I. N. Golubovskaya, L. Timofejeva, R. B.Meeley, W. F. Sheridan, and W. Z. Cande, “Coordinationof meiotic recombination, pairing, and synapsis by PHS1,”Science, vol. 303, no. 5654, pp. 89–92, 2004.
[14] S. M. Tam, S. Samipak, A. Britt, and R. T. Chetelat, “Charac-terization and comparative sequence analysis of the DNA mis-match repair MSH2 and MSH7 genes from tomato,” Genetica,vol. 137, no. 3, pp. 341–354, 2009.
[15] S. J. Armstrong, A. P. Caryl, G. H. Jones, and F. C. H.Franklin, “Asy1, a protein required for meiotic chromosomesynapsis, localizes to axis-associated chromatin in Arabidopsisand Brassica,” Journal of Cell Science, vol. 115, no. 18, pp. 3645–3655, 2002.
[16] I. Rubin-Bejerano, S. Sagee, O. Friedman, L. Pnueli, and Y.Kassir, “The in vivo activity of Ime1, the key transcriptionalactivator of meiosis-specific genes in Saccharomyces cerevisiae,is inhibited by the cyclic AMP/protein kinase A signal pathwaythrough the glycogen synthase kinase 3-β homolog Rim11,”Molecular and Cellular Biology, vol. 24, no. 16, pp. 6967–6979,2004.
[17] N. Jackson, E. Sanchez-Moran, E. Buckling, S. J. Armstrong, G.H. Jones, and F. C. H. Franklin, “Reduced meiotic crossoversand delayed prophase I progression in AtMLH3-deficientArabidopsis,” EMBO Journal, vol. 25, no. 6, pp. 1315–1323,2006.
[18] K. I. Nonomura, M. Nakano, M. Eiguchi, T. Suzuki, andN. Kurata, “PAIR2 is essential for homologous chromosomesynapsis in rice meiosis I,” Journal of Cell Science, vol. 119, no.2, pp. 217–225, 2006.
[19] R. Mercier and M. Grelon, “Meiosis in plants: ten years of genediscovery,” Cytogenetic and Genome Research, vol. 120, no. 3-4,pp. 281–290, 2008.
[20] W. D. Bovill, P. Deveshwar, S. Kapoor, and J. A. Able, “Wholegenome approaches to identify early meiotic gene candidatesin cereals,” Functional and Integrative Genomics, vol. 9, no. 2,pp. 219–229, 2009.
[21] D. Winter, B. Vinegar, H. Nahal, R. Ammar, G. V. Wilson, andN. J. Provart, “An “electronic fluorescent pictograph” Browserfor exploring and analyzing large-scale biological data sets,”PLoS ONE, vol. 2, no. 8, article e718, 2007.