researchdirect.westernsydney.edu.au7054/... · ii - ii - ii improving the retention of first year...
TRANSCRIPT

i - i - iI m p r o v i n g t h e R e t e n t i o n o f F i r s t Y e a r S t u d e n t s P a g e i
IMPROVING THE RETENTION OF
FIRST YEAR STUDENTS
GRAHAM BISHOP
A thesis submitted in fulfilment of the requirements for the
Degree of Master of Engineering (Hons)
University of Western Sydney
2007

ii - ii - iiI m p r o v i n g t h e R e t e n t i o n o f F i r s t Y e a r S t u d e n t s P a g e i i
IMPROVING THE RETENTION OF FIRST YEAR STUDENTS
Graham Bishop, UWS
M.Eng Thesis 2007
Abstract
The thesis compares student attrition rates in two UWS Schools for 2004 and 2005. It
analyses possible reasons why students discontinue and identifies strategies and
approaches to improving the quality of the teaching and learning environment for these
students. The thesis focuses on the retention of first year students in the School of
Engineering at the University of Western Sydney.
Low retention rates are costly to the university, leading to inefficient use of resources,
failure to fulfil student aspirations, and intervention between the university and the
student. In each chapter, the thesis addresses student retention, satisfaction and
performance and the interrelation between them and outlines the measures taken by the
School of Engineering to improve these measurements for students commencing in
2006 and proposes many recommendations for further improvements in subsequent
years.
Each chapter addresses these issues by following the student pathway, commencing
with the student leaving High School and entering their chosen university and course of
study. At each stage, the relevant issues are addressed which have a direct or indirect
impact on student retention, satisfaction and performance. Use is made of reports and
papers published by universities and organisations, as outlined in the Literature Review.
The research questions provide data through the results obtained from surveys.
Typical Retention Rates are 75% for UWS, 81% for the Sector, 76% for the New
Generation Universities (NGUs) and 62% for the School of Engineering on which this
research is focussed. This thesis confirms the research from many countries that closely
links student retention with the quality of teaching and learning. Key issues are:
• a sound first year student orientation and welcome by staff; encountering
efficient, effective and accurate student administrative systems;

iii - iii - iiiI m p r o v i n g t h e R e t e n t i o n o f F i r s t Y e a r S t u d e n t s P a g e i i i
The introduction of a more effective and tailored orientation program in
2007 attracted, at UWS School of Engineering, 92% attendance and
greater awareness by the students of their study program and the
available support services;
• having student queries responded to promptly and effectively;
The introduction of a First Year Coordinator in 2007 proved to be well
received, with a significant number of students having prompt responses
to their queries, as compared with previous years;
• clear expectations management about services and key academic issues like
assessment;
the marketing of UWS Engineering programs was addressed in 2006 and
2007, with an expansion of the marketing program operated for feeder
schools and improved awareness of student expectations prior to entry:
an ongoing exercise;
• having committed, accessible, responsive and capable teaching staff;
the accessibility and responsiveness of teaching staff to first year student
issues, as outlined in this thesis, is being addressed in 2007;
• receiving prompt and helpful feedback on their learning;
an issue being addressed by the First Year Teaching Team as an essential
element of the teaching and learning process; together with:
• effective use of an appropriate selection from a myriad of learning strategies
and resources which give emphasis to active learning, practice oriented learning,
peer supported learning and self-managed learning; supported by a reliable
infrastructure and support systems; and
• consistently encountering staff that are responsive and committed to giving
service to student support.
Results suggest the following recommendations for improving the retention of first
year students.
Involve staff in retention measures
Streamline pre-enrolment information
Keep all student promises – e.g. in Unit Outlines and assessment plans
Identify high-risk students early

iv - iv - ivI m p r o v i n g t h e R e t e n t i o n o f F i r s t Y e a r S t u d e n t s P a g e i v
Cater for poor UAIs and maths/science
Minimise administrative barriers
Appoint a first-year mentor/coordinator
For First year Student Orientation, the student’s first exposure to the UWS
campus,
• Aim for 100% attendance
• Ensure user-friendliness
• Address student expectations
• Address aims of the Orientation program
• Ensure all key staff easily available
• Avoid information overload
• Regularly review and modify the program on an annual basis
• Ensure full academic-administrative liaison
Ease tutorial registration and offer instant online interactive timetable
confirmation
Streamline induction information on a CD or a School web site
Adopt a team approach to teaching First Year Units
Consider alternative peer-mentor models
Strengthen academic mentoring
Ensure staff consultation availability
Regularly encourage prompt attendance and submission of assignments – a
study discipline
Address travel problems
Address campus facilities
Promote learning skills awareness
Encourage students to seek help and
Follow up all student queries.
Graham Bishop
Associate Lecturer
School of Engineering

v - v - vI m p r o v i n g t h e R e t e n t i o n o f F i r s t Y e a r S t u d e n t s P a g e v
University of Western Sydney
May 2007
vi - vi - viI m p r o v i n g t h e R e t e n t i o n o f F i r s t Y e a r S t u d e n t s P a g e v i
Table of Contents
Table of Figures x
Table of Tables xii
Preface xiv
Acknowledgments xv
Glossary xvi
Chapter 1 Introduction 1
1.1 The Problem Statement 1
1.1.1 A perspective on the problem 2
1.2 Thesis aim 4
1.3 Student retention 5
1.3.1 Definitions 5
1.3.2 Student retention at UWS 7
1.3.3 The cost implications of student retention 9
1.3.4 The scale of the student retention issue 9
1.4 Discussion 16
Chapter 2 Literature Review 17
2.1 Models of Student Retention 18
2.1.1 Institutional approaches 18
2.2 Studies of Transition 20
2.3 Key factors influencing student retention 24
2.3.1 Student age 25
2.3.2 Language and cultural background 25
2.3.3 Student gender 26
2.3.4 Goal commitment 26
2.3.5 Family and peer support 27
2.3.6 Living at home or residential 27
2.3.7 Course expectations/characteristics 28
2.3.8 Course specialisations 28
2.3.9 Travel 29
2.3.10 Administration 33
vii - vii - viiI m p r o v i n g t h e R e t e n t i o n o f F i r s t Y e a r S t u d e n t s P a g e v i i
2.3.11 Improving academic advice 33
2.3.12 Provision of transition subjects/units 34
2.3.13 Early feedback and advice 35
2.3.14 Student engagement 35
2.3.15 Collaborative learning and student engagement 39
2.3.16 Social integration 41
2.3.17 Teaching pedagogy 41
2.4 Effective interventions 42
2.4.1 Peer mentoring 44
2.4.2 Common timetabling of groups/learning communities 45
2.4.3 Developing an online community 45
2.4.4 Developmental subjects/units 46
2.4.5 Conflicts with employment 46
2.5 Summary 53
Chapter 3 Research Methodology and Design 54
3.1 A review of the instruments used to test the effectiveness of the
methods to improve first year teaching 54
3.2 Internal surveys 55
3.2.1 The 2005 (Enrolment) and 2006 (Orientation) UWS surveys 56
3.3 Research participants 59
3.4 Materials 59
Chapter 4 Transition to university – Student retention issues 65
4.1 Introduction 65
4.2 Student personal, family and social issues 65
4.3 Student UAI scores and ability in mathematics and science on entry 69
4.4 Choosing a university and course advice and welcome 74
4,5 Students at risk 75
4.6 Discussion 78
Chapter 5 Orientation and settling in – Students retention issues 82
5.1 Introduction 82
5.2 Arriving at university 82
5.3 The enrolment process 83
viii - viii - viiiI m p r o v i n g t h e R e t e n t i o n o f F i r s t Y e a r S t u d e n t s P a g e v i i i
5.4 The role of orientation week 85
5.4.1 Step 1 – The 2005 orientation program 86
5.4.2 Step 2 – Reviewing the 2005 program 87
5.4.3 Step 3 – Reviewing the 2006 program 88
5.4.4 Future orientation programs 91
5.5 An institutional approach to transition and the orientation program 92
5.6 IT Access 97
5.7 Administrative issues such as fees, MyUWS and account registration 98
5.8 Seeking help and support – staff communications and accessibility 99
5.9 Discussion 100
Chapter 6 Teaching and Learning – Student retention issues 102
6.1 Introduction 102
6.2 Teaching and learning activities 103
6.3 Curriculum design for the first year 104
6.4 Class timetables, laboratory sessions, tutorials etc. 104
6.5 Monitoring learning activities 105
6.6 A UWS survey on learning activities 112
6.7 Student motivation and workload 116
6.8 Meeting the deadlines 118
6.9 Advice and welcome from senior staff 119
6.10 The peer mentor scheme 122
6.11 Student Support Service, counselling 124
6.12 The campus 127
6.13 Staff communications and accessibility 129
6.14 Discussion 131
Chapter 7 Progression – Student retention issues 134
7.1 Introduction 134
7.2 Student retention data 134
7.3 Exit surveys 140
7.4 Progression to other universities 142
7.5 Discussion 143
Chapter 8 Conclusions, Recommendations and Future Work 145
ix - ix - ixI m p r o v i n g t h e R e t e n t i o n o f F i r s t Y e a r S t u d e n t s P a g e i x
8.1 Issues to be addresses by UWS 150
8.2 What measures can be made to retain them ? 151
8.3 A final word 152
Chapter 9 References 154
Chapter 10 Appendices 192
Appendix 1 DEST Tables of Higher Education attrition and enrolment rates 193
Appendix 2 Notes to accompany DEST Tables of attrition data 207
Appendix 3 Questionnaires to Students regarding (1) Enrolment October 2005 209 and (2) Orientation March 2006 Appendix 4 Orientation Program 2006 222
Appendix 5 Factor Analysis for CEQ Good teaching Scale 1999 226 Appendix 6 Analysis of Mathematics entry and exam data for UWS 228
School of Engineering students 2005
Appendix 7 The UWS College 3-semester program 235
Appendix 8 Report of the Group reviewing enrolment 2005 237
Appendix 9 “First Year Central” website Checklist 242
x - x - xI m p r o v i n g t h e R e t e n t i o n o f F i r s t Y e a r S t u d e n t s P a g e x
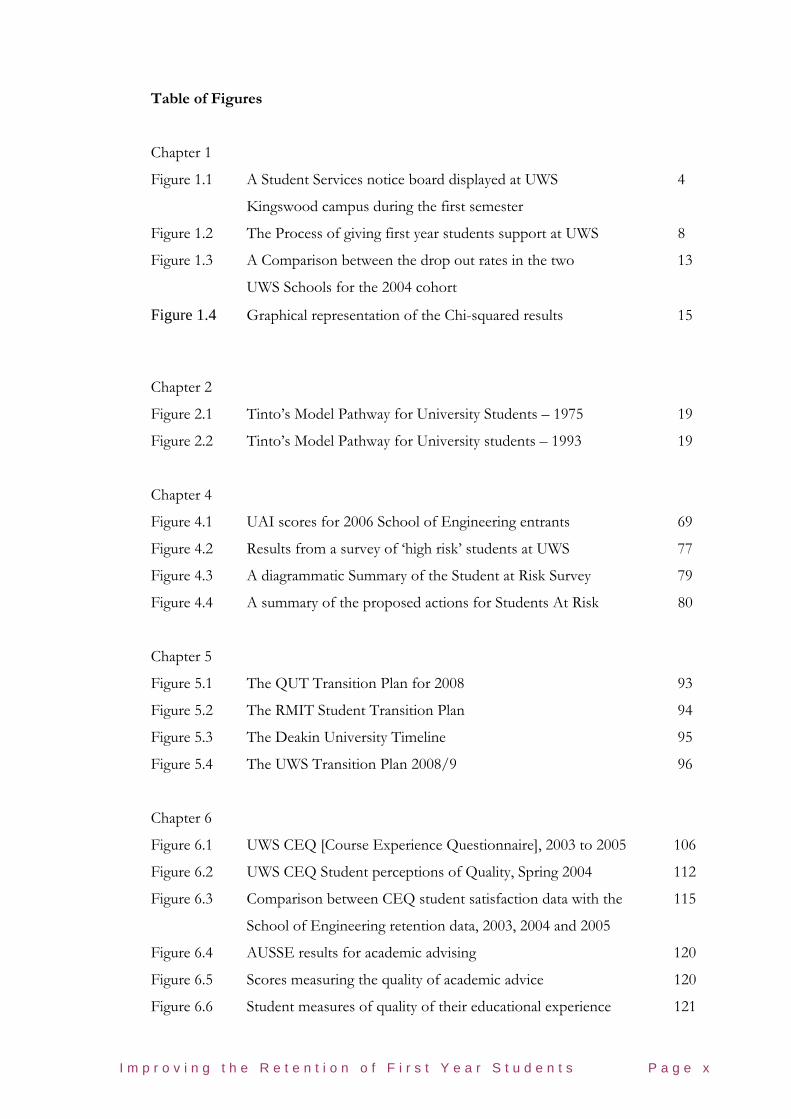
Table of Figures
Chapter 1
Figure 1.1 A Student Services notice board displayed at UWS 4
Kingswood campus during the first semester
Figure 1.2 The Process of giving first year students support at UWS 8
Figure 1.3 A Comparison between the drop out rates in the two 13
UWS Schools for the 2004 cohort
Figure 1.4 Graphical representation of the Chi-squared results 15
Chapter 2
Figure 2.1 Tinto’s Model Pathway for University Students – 1975 19
Figure 2.2 Tinto’s Model Pathway for University students – 1993 19
Chapter 4
Figure 4.1 UAI scores for 2006 School of Engineering entrants 69
Figure 4.2 Results from a survey of ‘high risk’ students at UWS 77
Figure 4.3 A diagrammatic Summary of the Student at Risk Survey 79
Figure 4.4 A summary of the proposed actions for Students At Risk 80
Chapter 5
Figure 5.1 The QUT Transition Plan for 2008 93
Figure 5.2 The RMIT Student Transition Plan 94
Figure 5.3 The Deakin University Timeline 95
Figure 5.4 The UWS Transition Plan 2008/9 96
Chapter 6
Figure 6.1 UWS CEQ [Course Experience Questionnaire], 2003 to 2005 106
Figure 6.2 UWS CEQ Student perceptions of Quality, Spring 2004 112
Figure 6.3 Comparison between CEQ student satisfaction data with the 115
School of Engineering retention data, 2003, 2004 and 2005
Figure 6.4 AUSSE results for academic advising 120
Figure 6.5 Scores measuring the quality of academic advice 120
Figure 6.6 Student measures of quality of their educational experience 121

xi - xi - xiI m p r o v i n g t h e R e t e n t i o n o f F i r s t Y e a r S t u d e n t s P a g e x i
Figure 6.7 Measures of the correlation between the overall score 122
and the AUSSE scales
Figure 6.8 Hours per week spent on extracurricular activities 127
Chapter 7
Figure 7.1 Pattern of Student Discontinuation School of Engineering, 136
2003 cohort
Figure 7.2 Pattern of Student Discontinuation School of Engineering, 137
2004 cohort
Figure 7.3 Pattern of Student Discontinuation School of Engineering, 137
2005 cohort
Figure 7.4 Pattern of Student Discontinuation School of Engineering, 138
2006 cohort
xii - xii - xiiI m p r o v i n g t h e R e t e n t i o n o f F i r s t Y e a r S t u d e n t s P a g e x i i
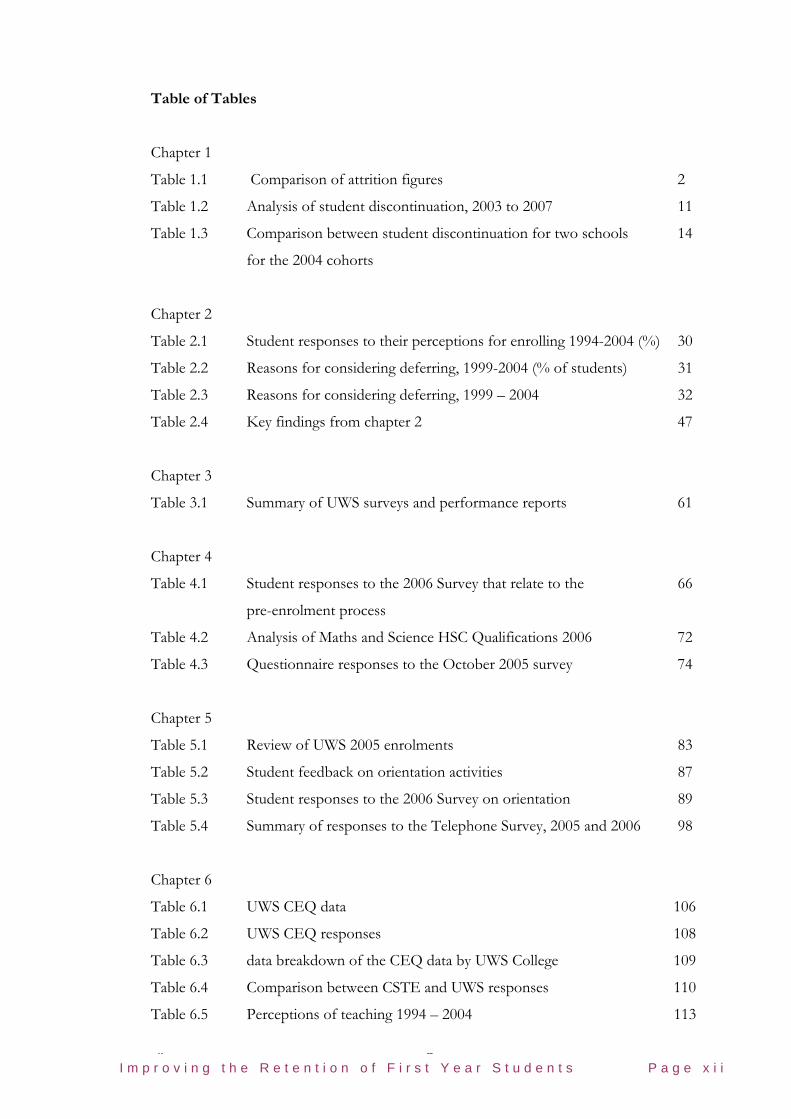
Table of Tables
Chapter 1
Table 1.1 Comparison of attrition figures 2
Table 1.2 Analysis of student discontinuation, 2003 to 2007 11
Table 1.3 Comparison between student discontinuation for two schools 14
for the 2004 cohorts
Chapter 2
Table 2.1 Student responses to their perceptions for enrolling 1994-2004 (%) 30
Table 2.2 Reasons for considering deferring, 1999-2004 (% of students) 31
Table 2.3 Reasons for considering deferring, 1999 – 2004 32
Table 2.4 Key findings from chapter 2 47
Chapter 3
Table 3.1 Summary of UWS surveys and performance reports 61
Chapter 4
Table 4.1 Student responses to the 2006 Survey that relate to the 66
pre-enrolment process
Table 4.2 Analysis of Maths and Science HSC Qualifications 2006 72
Table 4.3 Questionnaire responses to the October 2005 survey 74
Chapter 5
Table 5.1 Review of UWS 2005 enrolments 83
Table 5.2 Student feedback on orientation activities 87
Table 5.3 Student responses to the 2006 Survey on orientation 89
Table 5.4 Summary of responses to the Telephone Survey, 2005 and 2006 98
Chapter 6
Table 6.1 UWS CEQ data 106
Table 6.2 UWS CEQ responses 108
Table 6.3 data breakdown of the CEQ data by UWS College 109
Table 6.4 Comparison between CSTE and UWS responses 110
Table 6.5 Perceptions of teaching 1994 – 2004 113
xiii - xiii - xiiiI m p r o v i n g t h e R e t e n t i o n o f F i r s t Y e a r S t u d e n t s P a g e x i i i
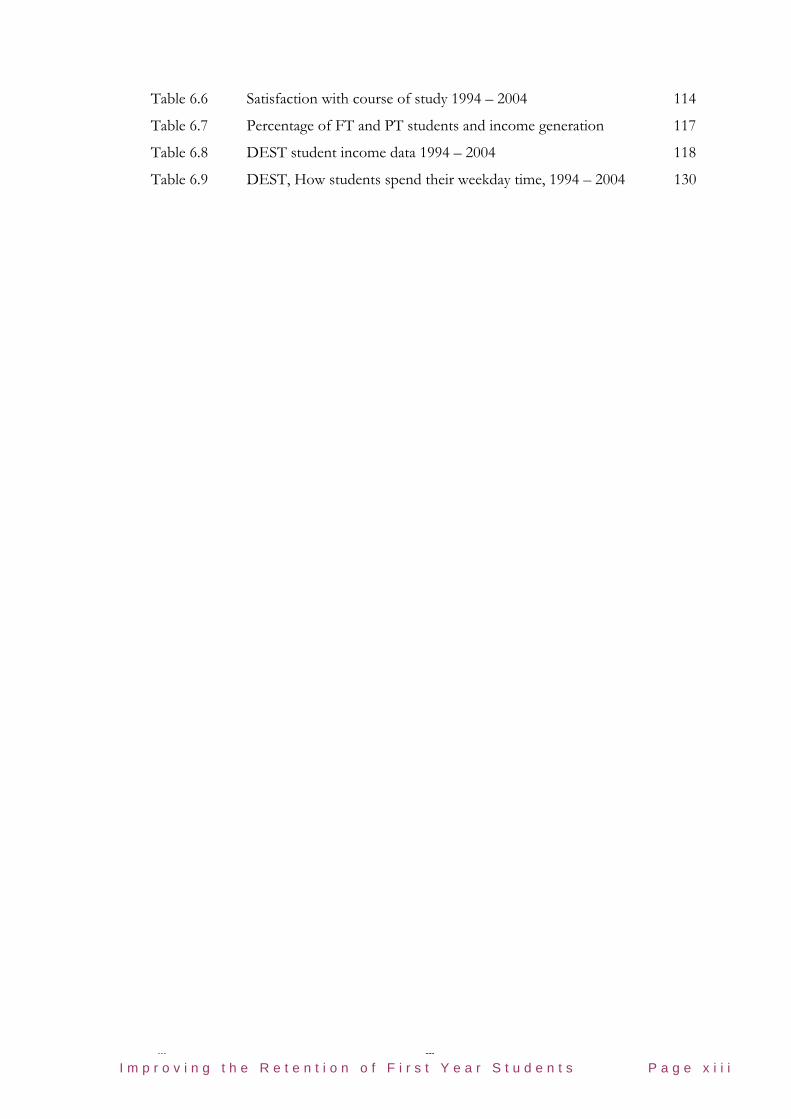
Table 6.6 Satisfaction with course of study 1994 – 2004 114
Table 6.7 Percentage of FT and PT students and income generation 117
Table 6.8 DEST student income data 1994 – 2004 118
Table 6.9 DEST, How students spend their weekday time, 1994 – 2004 130
xiv - xiv - xivI m p r o v i n g t h e R e t e n t i o n o f F i r s t Y e a r S t u d e n t s P a g e x i v
Preface
This thesis has a number of interconnected threads and analysis. The following chapters
outline is presented for ease of following the structure of this thesis.
Chapter 1 defines the terms ‘student retention’ and its alternatives, followed by an
overview of the research methodology and the research questions being addressed by
this thesis. The Student Pathway is introduced, from which the elements of the student
process is analysed and potential student drop-out identified.
Chapters 2 provides a literature review which describes previous research into student
retention, from the early 1970s to the present day. Literature from the University of
Western Sydney together with research carried out at other universities was reviewed, in
relation to student transition from school to the university and through the first year.
Methods of data monitoring and analysis are introduced, with an emphasis on the
School of Engineering at UWS.
Chapter 3 describes the instruments and methodology used to obtain the data, research,
surveys and other information necessary for the research hypothesis.
Chapters 4 to 7 describe the research results obtained from the four key phases of the
Student Pathway, including a summary of the measures discussed by the UWS School of
Engineering in May 2005:
Chapter 4 Transition to university
Chapter 5 Orientation and settling in
Chapter 6 Teaching and Learning
Chapter 7 Progression
Chapter 8 gathers the conclusions from preceding chapters and, from them, formulates
recommendations and measures to improve student retention: many being successfully
applied in this and other universities. Consequently, although the thesis primarily
focuses on data gathered from the years 2003 to 2006, occasionally the reader is brought
to 2008/9 since certain recommendations have been addressed at UWS.

xv - xv - xvI m p r o v i n g t h e R e t e n t i o n o f F i r s t Y e a r S t u d e n t s P a g e x v
Acknowledgements
Sincere gratitude goes to a number of people and, in particular, my Supervisors: Professor Steven Riley Former Head of School of Engineering, UWS Dr. Surendra Shrestha Associate Head of School of Engineering, UWS Mr Bruce Campbell Head of Program, B.Eng, UWS
The research would not have been possible without my employment as a Teaching
Fellow for the duration of the research by Professor Steven Riley, former Head of the
School of Engineering. This enables direct contact with many hundreds of first year
students on whom part of this research was focussed. Also, access to the facilities, data,
the student cohorts and staff of the university was greatly eased by the support of the
Head of School.
I am also indebted to the personal support and encouragement given by my co-
supervisor Associate Head of Engineering, Dr Surendra Shrestha who guided thoughts
and provided inspiration throughout the two year period.
My second co-supervisor, Bruce Campbell, Head of Programs in the School of
Engineering, provided wisdom and support throughout the period and shared many of
the concerns which influenced the measured levels of student retention.
I also wish to pay a tribute to the staff of the UWS Student Services Unit who shared
with me the planning of Peer Mentoring Training and orientation, the Office of
Planning and Quality who provided retention and other university data and IT,
laboratory and support staff who provided support in their respective areas.
Finally, sincere thanks for my wife, Celia, who provided love and encouragement
throughout the research and writing of the thesis; including the many times where
Microsoft Word or other program required extensive expertise.
Graham Bishop
xvi - xvi - xviI m p r o v i n g t h e R e t e n t i o n o f F i r s t Y e a r S t u d e n t s P a g e x v i
GLOSSARY AQLC Academic Quality and Learning Committee (UWS)
AUQA Australian Universities Quality Agency
Callista The UWS Computer Database
Census Date The date by which University fees have to be paid
CEQ Course Experience Questionnaire
CEQuery Course Evaluation Query exercise
CIT Computing and Information Technology
CSHE College of Social & Health Sciences
CSTE College of Science, Technology & Environment
CSTE College of Science, Technology and Environment at UWS
DEST Department of Education, Science and Training
EFTSL Effective Full-Time Student Load
EIDP Engineering and Industrial Design Practice
First Year
Central The UWS web site for new students
GDS Graduate Destination Survey
GPA Grade Point Average
GTS Good Teaching Scale
GWS Greater Western Sydney
HECS Higher Education Contribution Scheme (Australia)
HELP Higher Education Loan Program
HOPNET Head of Programs Network
HOS Head of School
HSC Higher School Certificate
ICT Information and Communication Technology
ID Industrial Design
IPP Introduction to Professional Practice (now EIDP)
MyUWS The UWS student computer system
NGU New Generation University
Orientation The initial information and advice program to new students
OAR Office of the Academic registrar
PASS Peer Assisted Study Sessions
Peer Mentor Students from 2nd year and above who support students
xvii - xvii - xviiI m p r o v i n g t h e R e t e n t i o n o f F i r s t Y e a r S t u d e n t s P a g e x v i i
PG Postgraduate
RET Regional Entry Test
SEA School of Environment and Agriculture [up to December 2005]
SEID School of Engineering and Industrial Design [up to December 2005]
SFT Student Feedback on Teaching
SFU Student Feedback on Unit
SSS Student Satisfaction Survey
STAT Special Tertiary Admissions Test
Tafe Technical and Further Education
TILT Tracking and Improving Learning and Teaching
UAC Universities Admissions centre
UAI Universities Admission Index (Australia)
UG Undergraduate
UniTrack A scheme for studying individual university units
UTS University of Technology Sydney
UWS University of Western Sydney
WebCT The UWS interactive [teaching] computer system
Improving the Retention of First year Students Page1
1 Introduction
“Student retention is one of the most widely studied areas in higher education…The result has been
an ever more sophisticated understanding of the complex web of events that shape student leaving and
persistence… But for all that, substantial gains in student retention have been hard to come by…
More importantly, there is much that we have not yet done to translate our research and theory into
effective practice.”
Vincent Tinto
This thesis addresses the issue of why a significant number of students in the School of
Engineering at the University of Western Sydney choose to discontinue their studies during,
or at the end of, their first year. The consequence for many of the students is major
interruption to their education and career development and loss of esteem. The
consequences for the University are wasted resources and damage to the image of the
institution. The problem is substantial, and not solely restricted to Engineering
This chapter states the problem of retention for Engineering at UWS, the consequences for
the institution and the students, and the research questions that arise. The research
methodology is explained.
1.1 Problem Statement
This thesis addresses the following questions, with particular reference to the School of
Engineering at the University of Western Sydney:
Why are students dropping out ?. When do they drop out ? and What measures can be used to retain them ?
The hypothesis of this thesis is that student retention can be improved.
Improving the Retention of First year Students Page2
A number of strategies to improve student retention in the School of Engineering are
examined. One aim of this thesis is to assess the effectiveness of the measures taken to
address this problem of retention, analysing the scale of this problem, its causes, and the
effectiveness of different strategies. In addition recommendations are presented for
associated improvements in student satisfaction and performance.
1.1.1 A perspective on the problem
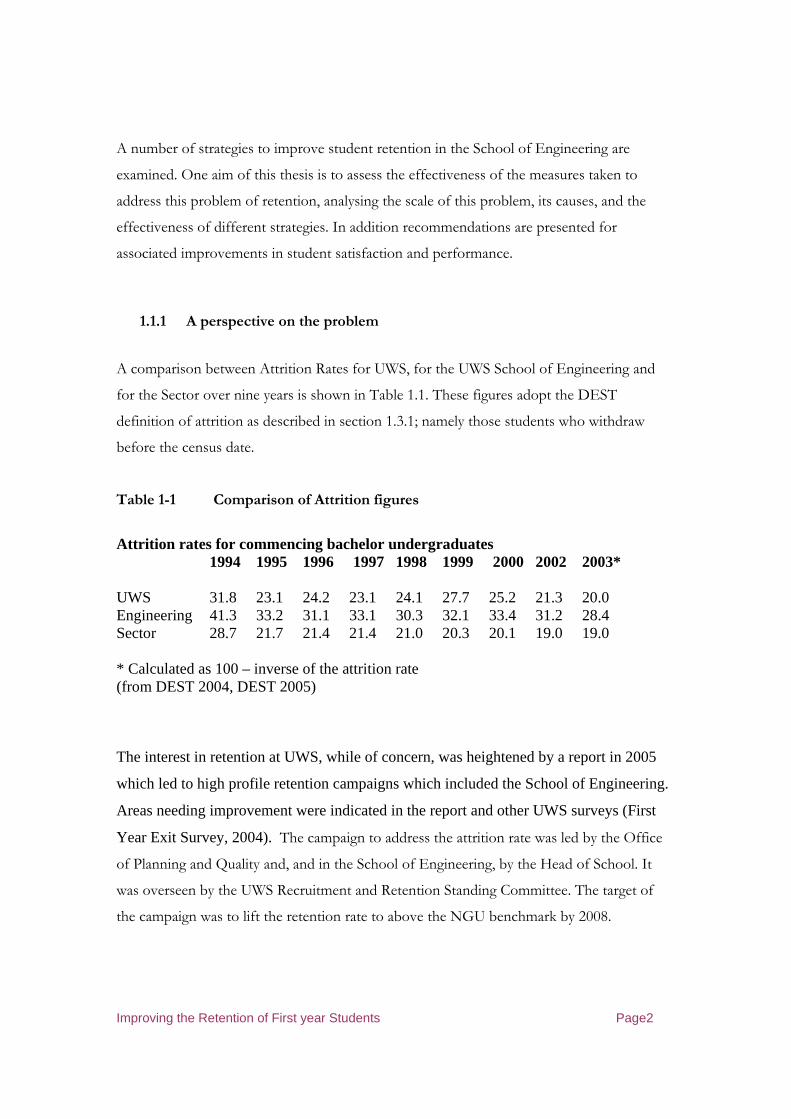
A comparison between Attrition Rates for UWS, for the UWS School of Engineering and
for the Sector over nine years is shown in Table 1.1. These figures adopt the DEST
definition of attrition as described in section 1.3.1; namely those students who withdraw
before the census date.
Table 1-1 Comparison of Attrition figures
Attrition rates for commencing bachelor undergraduates 1994 1995 1996 1997 1998 1999 2000 2002 2003*
UWS 31.8 23.1 24.2 23.1 24.1 27.7 25.2 21.3 20.0 Engineering 41.3 33.2 31.1 33.1 30.3 32.1 33.4 31.2 28.4 Sector 28.7 21.7 21.4 21.4 21.0 20.3 20.1 19.0 19.0 * Calculated as 100 – inverse of the attrition rate (from DEST 2004, DEST 2005)
The interest in retention at UWS, while of concern, was heightened by a report in 2005
which led to high profile retention campaigns which included the School of Engineering.
Areas needing improvement were indicated in the report and other UWS surveys (First
Year Exit Survey, 2004). The campaign to address the attrition rate was led by the Office
of Planning and Quality and, and in the School of Engineering, by the Head of School. It
was overseen by the UWS Recruitment and Retention Standing Committee. The target of
the campaign was to lift the retention rate to above the NGU benchmark by 2008.

Improving the Retention of First year Students Page3
The School of Engineering has a long-standing interest in improving retention rates.
Measures taken by the School of Engineering to improve teaching and learning for students
commencing in 2006 are outlined in this thesis and assessed. Measures to address student
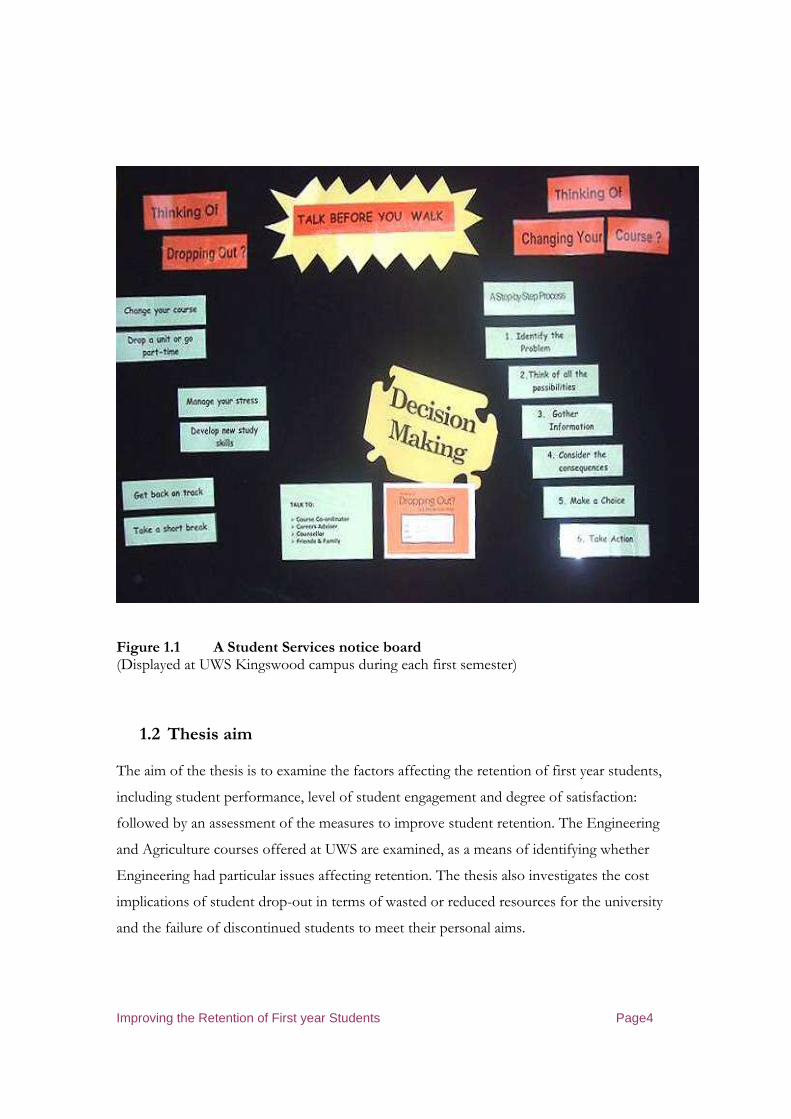
retention by the university Student Support Services are also described, one being the display
or posters such as that illustrated in Figure 1.1 which is displayed to students before census
date in order to encourage dissatisfied students to seek help before ‘walking’.
For clarification, is should be noted that the School of Engineering was formerly the School
of Engineering and Industrial Design between 2001 and 2006, and prior to that the School
of Civic Engineering and Environment between 1998 and 2000.
Student retention, satisfaction and performance and the interrelation between them are
examined in this thesis. Each chapter reviews the issues of retention by following a
generalised student pathway, from the student in High School selecting their university and
course of study to their entry to UWS via UAC, and follows them through their first year in
the School of Engineering at UWS. At each stage, issues affecting retention are addressed
(Fig 1.2).
Improving the Retention of First year Students Page4
Figure 1.1 A Student Services notice board (Displayed at UWS Kingswood campus during each first semester)
1.2 Thesis aim The aim of the thesis is to examine the factors affecting the retention of first year students,
including student performance, level of student engagement and degree of satisfaction:
followed by an assessment of the measures to improve student retention. The Engineering
and Agriculture courses offered at UWS are examined, as a means of identifying whether
Engineering had particular issues affecting retention. The thesis also investigates the cost
implications of student drop-out in terms of wasted or reduced resources for the university
and the failure of discontinued students to meet their personal aims.

Improving the Retention of First year Students Page5
The thesis considers students who have enrolled into first year courses and their progression
to second, third and subsequent years.
1.3 Student retention
1.3.1 Definitions
Definitions of retention or attrition rates can differ amongst national and international
organisations, universities, faculties or schools. Care has to be taken when comparisons are
made between the relevant data published by such institutions. For some organisations,
students are assumed to have ‘dropped out’ or discontinued if they have decided not to
proceed to the second year of their degree course whereas, in other organisations, it is
assumed that they have dropped out if they do not proceed beyond a census date: 31st March
or 31st August of the year of enrolment in Australia. This section outlines the different
methods used to define student retention or, as some organisations prefer, student attrition.
According to DEST (Department of Education, Science and Training and Higher Education
Council) the Student Retention rate is a measure of the proportion of students in a particular
year who neither graduate nor continue studying in an award course at the same institution
in the following year (DEST, 2004). The Retention rate provides one measure of the
proportion of students who ‘drop out’ from one year to another. The converse ‘rate’ is the
Attrition rate. The sum of the retention rate and the attrition rate for the same cohort of
students in any year totals 100%. The retention rate normally includes those students who
choose to stay at a university and do not leave a course at one university and enrol the next
year at another university. Those who leave their course of study and return later to the
same university are defined as not having retained their university enrolment, i.e. they
contribute to the attrition rate.
Sometimes other terms are used to describe attrition, such as student ‘drop-out’ or
‘withdrawal’ or ‘discontinued’ and so on. However, within the University of Western Sydney
database “Callista”, UWS defines Discontinue as “the withdrawal of a student from a unit

Improving the Retention of First year Students Page6
attempt. The process of discontinuing a Student’s Course and/or Unit Offerings is carried
out in the Student Course Attempt and Student Unit Attempt blocks of the Student
Enrolments form. Discontinuation is the ending of a Student Enrolment in a course or unit
other than by completion. The Discontinuation of a Student’s Course Attempt will
automatically discontinue any associated Unit Attempts. Discontinuation is usually initiated
by a student indicating that they wish to exit the course or unit but may be initiated by the
institution by way of an encumbrance for, for example, failing to pay fees or failing to
progress academically”.
Thus, a discontinuation rate registered on Callista is not necessarily equivalent to an attrition
rate defined by DEST.
DEST defines the first year crude attrition rate (DEST, 2004) as “the proportion of
students in a year who neither graduate nor continue studying at the same institution in the
following year”. For example, the 2002 figure refers to the proportion of 2002 students who
neither graduate nor continue studying at the same university in 2003. Students who enrol at
another institution in the following year will be counted in those that have 'dropped out', as
will those that deferred. In addition, DEST provides figures for commencing students and
for those new to higher education where a student is classified as a commencing student
“in relation to a particular course”. A commencing student is one who “has enrolled for
the first time to undertake a particular higher education course at a particular higher
education institution in the reference year”. Students new to higher education are defined
as those “commencing undergraduate students who have never commenced a higher
education course prior to the first enrolment in the current course”.
This thesis uses two definitions of retention rate. Firstly, ‘actual discontinuations’ when
analysing the discontinuation of first year students month by month in the UWS Schools, as
illustrated in Figure 1.3 and defined by the UWS Callista database. The discontinued students
may have withdrawn, transferred from their course or failed their studies and so are
registered as having opted out of university study. When annual UWS figures are compared
with other institutions the second definition, the DEST definition of attrition and retention
as described above is used.

Improving the Retention of First year Students Page7
1.3.2 Student Retention at UWS
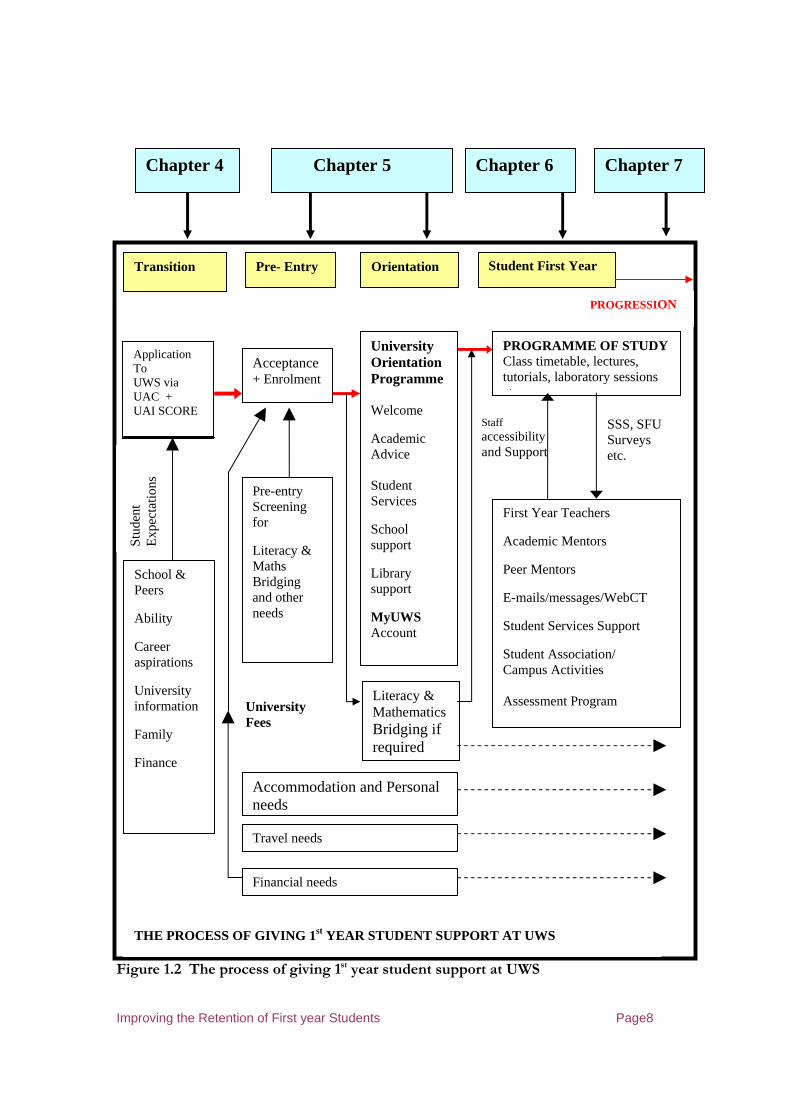
The model used in this study to assess the factors influencing attrition comprises a Student
Pathway, illustrated in Figure 1.2, where students progress from school, with expectations
and aspirations and then enter university with a UAI (Universities Admission Index) score
and HSC (Higher School Certificate) passes. The university offers a first year orientation
program which precedes the first year of study. Chapters 4 to 7 follow the student through
each element of the pathway in order to identify issues which may influence the retention of
students.
The model of the Student Pathway (Figure 1.2} illustrates the process for a student as they
transfer from school to first year at UWS. It can be seen that a student in High School
follows a pathway which incorporates three phases:
Transition – discussed in Chapter 4
Enrolment and orientation – discussed in Chapter 5
Teaching and Learning – discussed in Chapter 6 and
Progression – discussed in Chapter 7.
Chapter 2 reviews the literature on research into student retention. Chapters 4 to 7 outline
the measures taken by universities, including UWS and the School of Engineering, to
provide the necessary support and effective learning and teaching, so that the student
successfully proceeds to year 2.
The point in the pathway when students decide to drop out depends on the individual
student and their personal circumstances. For some students a major failure by the university
or their personal situation is all that may be needed to withdraw from classes: whereas, as
will be shown, for many students the decision to withdraw is influenced over a period of
time by a significant number of minor factors, not all of which are university-related.
Improving the Retention of First year Students Page8
Figure 1.2 The process of giving 1st year student support at UWS
Pre- Entry Student First Year Transition
Acceptance + Enrolment
School & Peers Ability Career aspirations University information Family Finance
Application To UWS via UAC + UAI SCORE
University Orientation Programme Welcome Academic Advice Student Services School support Library support MyUWS Account
Pre-entry Screening for Literacy & Maths Bridging and other needs
Orientation
Accommodation and Personal needs
Travel needs
Financial needs
University Fees
First Year Teachers Academic Mentors Peer Mentors E-mails/messages/WebCT Student Services Support Student Association/ Campus Activities Assessment Program
PROGRAMME OF STUDY Class timetable, lectures, tutorials, laboratory sessions t
Staff accessibility and Support
SSS, SFU Surveys etc.
THE PROCESS OF GIVING 1st YEAR STUDENT SUPPORT AT UWS
Stu
dent
E
xpec
tatio
ns
Literacy & Mathematics Bridging if required
PROGRESSION
Chapter 4 Chapter 5 Chapter 6 Chapter 7

Improving the Retention of First year Students Page9
1.3.3 The cost implications of student retention.
For every undergraduate student who discontinues from UWS, the University loses $13,000
(2006 figure) which, if 1520 students discontinue in one academic year, totals a loss of $79
million for the duration of the student’s degree course. In addition, a viable class size is 16
per group, smaller classes become vulnerable and under the threat of closure resulting in
reduced staffing levels and threats of redundancy. In small classes resources are not being
used at maximum efficiency and so the University specifies minimum student numbers per
group and per course. Finally, the student is not able to meet their expectations and
aspirations if they choose to discontinue, particularly if they leave in their first year because
they are dissatisfied with the course or some aspects of the university.
The portfolio of courses in both Schools reviewed in this thesis (Engineering and Natural
Sciences) altered in 2005 and 2006 following a rationalisation of degree programs and the
introduction of a common first year for most undergraduate students. Consequently, great
care has been taken when comparing data from the two years and the two schools.
If a student withdraws prior to the HECS cut-off date there is no financial penalty to the
student or the School, except for the investment in time and resources for the period up to
31st March or, for the Spring term, 31st August, so attrition statistics are normally confined to
students who withdraw after the HECS cut-off date.
1.3.4 The scale of the student retention issue
For student enrolments, 2003 to 2006, Table 1.2 shows the numbers of students
discontinuing each month over the five year period for the various cohorts of enrolled
students, for the School of Engineering at UWS. The patterns of discontinuation illustrated
in these figures are relatively consistent for the years shown and highlighted in Figure 1.3
where student drop out is analysed for the two schools.
Improving the Retention of First year Students Page10
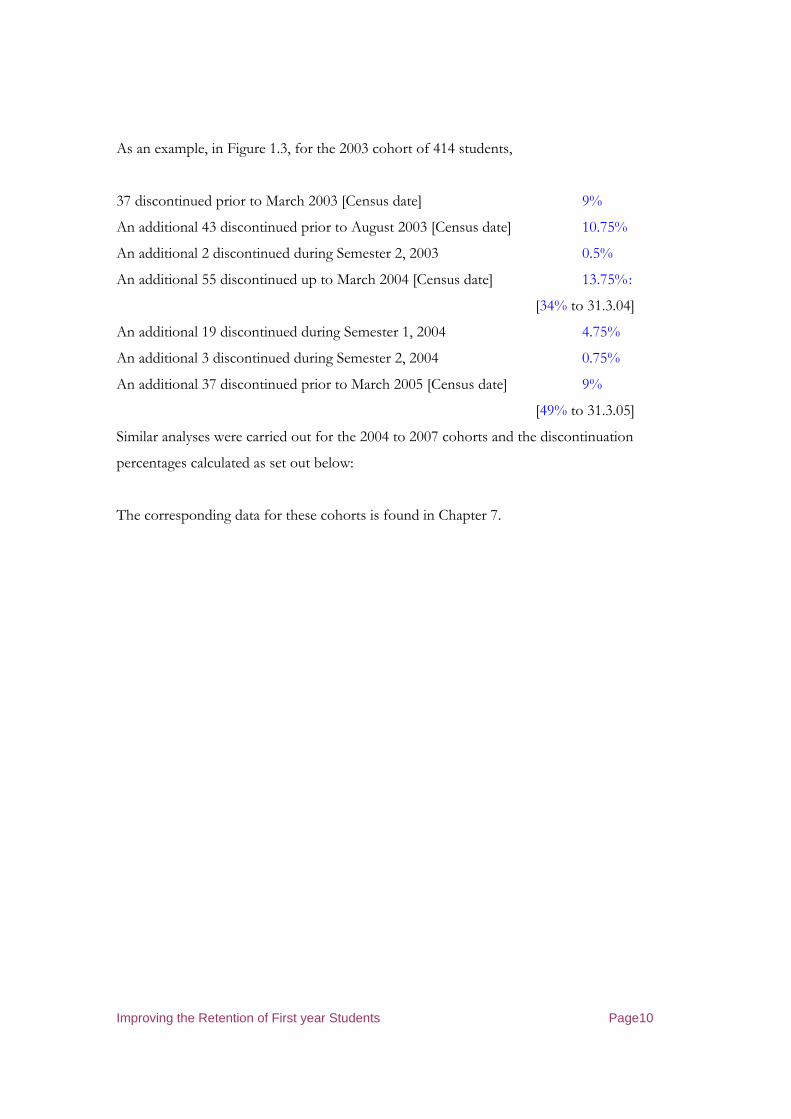
As an example, in Figure 1.3, for the 2003 cohort of 414 students,
37 discontinued prior to March 2003 [Census date] 9%
An additional 43 discontinued prior to August 2003 [Census date] 10.75%
An additional 2 discontinued during Semester 2, 2003 0.5%
An additional 55 discontinued up to March 2004 [Census date] 13.75% :
[34% to 31.3.04]
An additional 19 discontinued during Semester 1, 2004 4.75%
An additional 3 discontinued during Semester 2, 2004 0.75%
An additional 37 discontinued prior to March 2005 [Census date] 9%
[49% to 31.3.05]
Similar analyses were carried out for the 2004 to 2007 cohorts and the discontinuation
percentages calculated as set out below:
The corresponding data for these cohorts is found in Chapter 7.

Improving the Retention of First year Students Page11
Table 1-2 Analysis of Student Discontinuation, 2003 to 2007 at UWS School of Engineering * Engineering and Industrial Design Courses only
Student Numbers Discontinuing: Student Cohort 2003 [414] 2004 [425] 2005 [353] 2006 [420] 2007[423] (Figure 7.1) (Figure 7.2) (Figure 7.3) (Figure 7.4) Month ↓ Numbers of students discontinuing, each month ↓ ↓ ↓ ↓ ↓ [Accumulative percentages]
↓ ↓ ↓ ↓ ↓ January 0 0 0 2 0 February 2 4 1 6 10 March 35 [9%] 24 [6.5%] 19 [5.6%] 32 [6.5%] 27 [8.7%] April 0 0 2 1 2 May 1 9 3 4 June 0 1 0 1 July 18 6 7 10 August 24 [19%] 13 [13.4%] 12 [12.5%] 17 [11.8%] September 2 1 0 0 October 0 1 1 2 November 0 0 0 1
December 0 [19.8%] 2 [17.1%] 0 [14.7%] 1 (the numbers in bold concur with the summary figures earlier in this section}
January 12 [2004] 14[2005] 15[2006] 16[2007] February 25 32 32 23 March 18 [34%] 18 [29.4%] 15 [30.3%] 29 [23.5%] April 0 0 0 0 May 1 1 0 June 1 1 0 July 8 16 14 August 9 [37.7%] 7 [35.3%] 6 [36%] September 1 0 1 October 1 2 2 November 0 1 1 December 1 1 1 January 26[2005] 28[2006] 23[2007] February 8 10 2 March 3 [49 %] 0 [45%] 12 [45%] April 1 May 0 June 0 July 5 % total student drop-out from start August 6 of course up to each census date September 9 shown in brackets, March and October 0 August November 0 December 0 January 78[2006] February 3
Illustrated in Figure 1.3 and analysed in Table 1.3
Improving the Retention of First year Students Page12
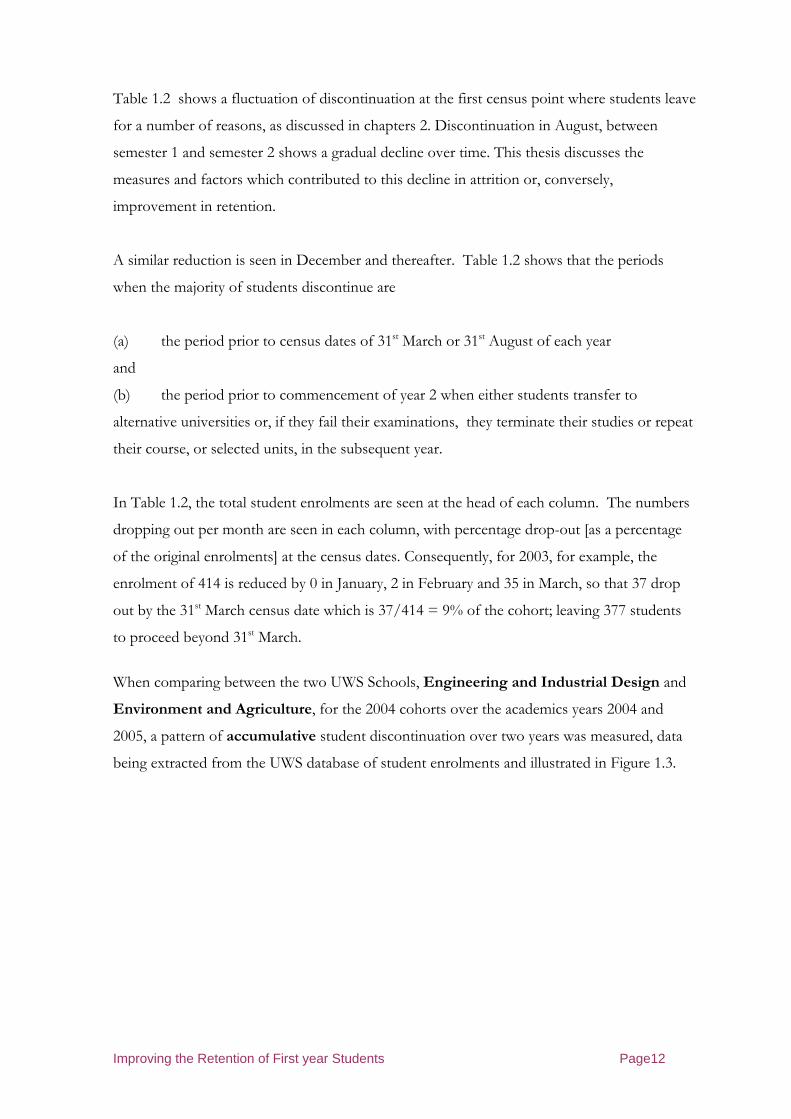
Table 1.2 shows a fluctuation of discontinuation at the first census point where students leave
for a number of reasons, as discussed in chapters 2. Discontinuation in August, between
semester 1 and semester 2 shows a gradual decline over time. This thesis discusses the
measures and factors which contributed to this decline in attrition or, conversely,
improvement in retention.
A similar reduction is seen in December and thereafter. Table 1.2 shows that the periods
when the majority of students discontinue are
(a) the period prior to census dates of 31st March or 31st August of each year
and
(b) the period prior to commencement of year 2 when either students transfer to
alternative universities or, if they fail their examinations, they terminate their studies or repeat
their course, or selected units, in the subsequent year.
In Table 1.2, the total student enrolments are seen at the head of each column. The numbers
dropping out per month are seen in each column, with percentage drop-out [as a percentage
of the original enrolments] at the census dates. Consequently, for 2003, for example, the
enrolment of 414 is reduced by 0 in January, 2 in February and 35 in March, so that 37 drop
out by the 31st March census date which is 37/414 = 9% of the cohort; leaving 377 students
to proceed beyond 31st March.
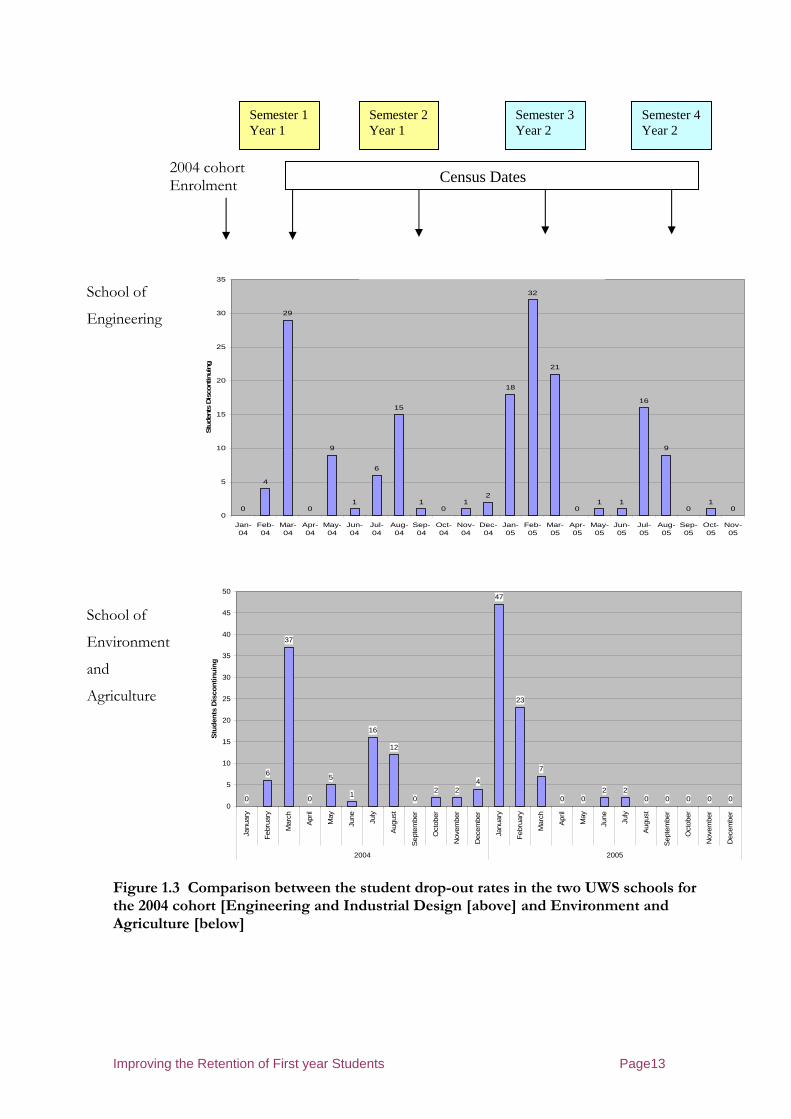
When comparing between the two UWS Schools, Engineering and Industrial Design and
Environment and Agriculture, for the 2004 cohorts over the academics years 2004 and
2005, a pattern of accumulative student discontinuation over two years was measured, data
being extracted from the UWS database of student enrolments and illustrated in Figure 1.3.
Improving the Retention of First year Students Page13
1st year Student Drop-out 2004 - SE
0
4
29
0
9
1
6
15
10
12
18
32
21
01 1
16
9
01
00
5
10
15
20
25
30
35
Jan-04
Feb-04
Mar-04
Apr-04
May-04
Jun-04
Jul-04
Aug-04
Sep-04
Oct-04
Nov-04
Dec-04
Jan-05
Feb-05
Mar-05
Apr-05
May-05
Jun-05
Jul-05
Aug-05
Sep-05
Oct-05
Nov-05
Stu
dent
s Disco
ntin
uing
1st Year Student Drop-out 2004 School of Environment & Agriculture
0
6
37
0
5
1
16
12
02 2
4
47
23
7
0 02 2
0 0 0 0 00
5
10
15
20
25
30
35
40
45
50
Janu
ary
Feb
ruar
y
Mar
ch
Apr
il
May
June
July
Aug
ust
Sep
tem
ber
Oct
ober
Nov
embe
r
Dec
embe
r
Janu
ary
Feb
ruar
y
Mar
ch
Apr
il
May
June
July
Aug
ust
Sep
tem
ber
Oct
ober
Nov
embe
r
Dec
embe
r
2004 2005
Stu
dent
s D
isco
ntin
uing
Figure 1.3 Comparison between the student drop-out rates in the two UWS schools for the 2004 cohort [Engineering and Industrial Design [above] and Environment and Agriculture [below]
2004 cohort Enrolment
School of
Engineering
School of
Environment
and
Agriculture
Semester 1 Year 1
Semester 2 Year 1
Semester 3 Year 2
Semester 4 Year 2
Census Dates
Improving the Retention of First year Students Page 14
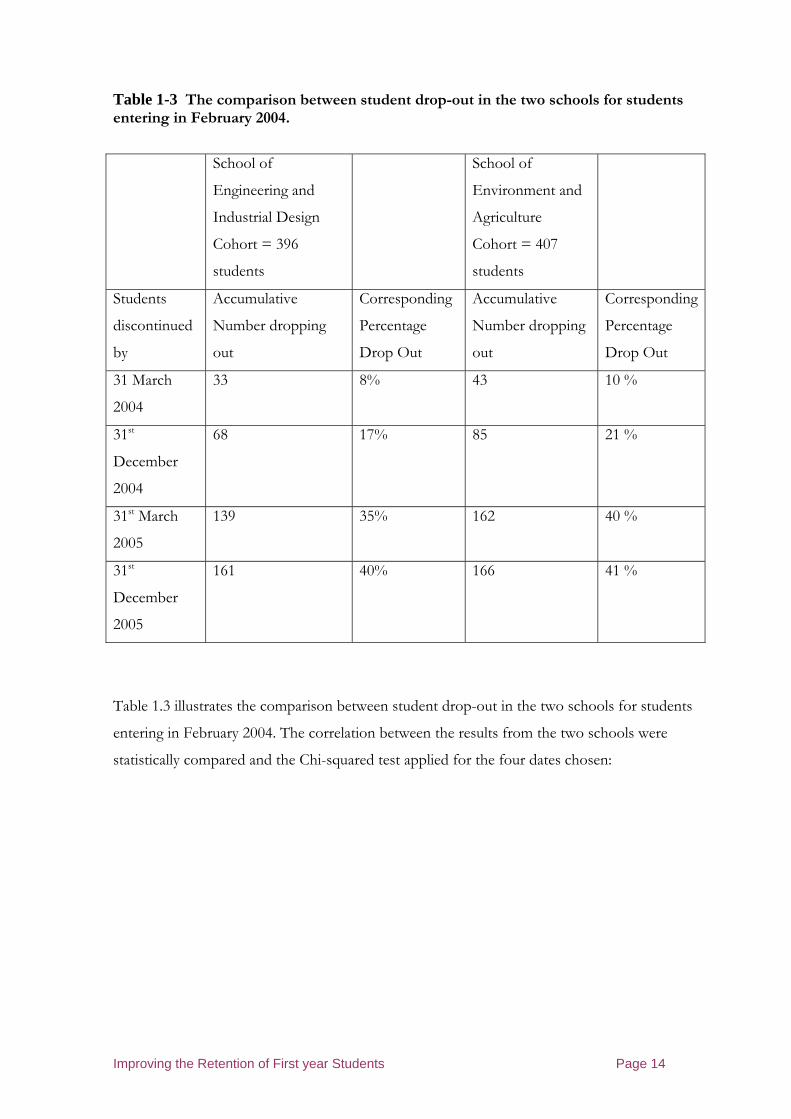
Table 1-3 The comparison between student drop-out in the two schools for students entering in February 2004.
School of
Engineering and
Industrial Design
Cohort = 396
students
School of
Environment and
Agriculture
Cohort = 407
students
Students
discontinued
by
Accumulative
Number dropping
out
Corresponding
Percentage
Drop Out
Accumulative
Number dropping
out
Corresponding
Percentage
Drop Out
31 March
2004
33 8% 43 10 %
31st
December
2004
68 17% 85 21 %
31st March
2005
139 35% 162 40 %
31st
December
2005
161 40% 166 41 %
Table 1.3 illustrates the comparison between student drop-out in the two schools for students
entering in February 2004. The correlation between the results from the two schools were
statistically compared and the Chi-squared test applied for the four dates chosen:
Improving the Retention of First year Students Page 15
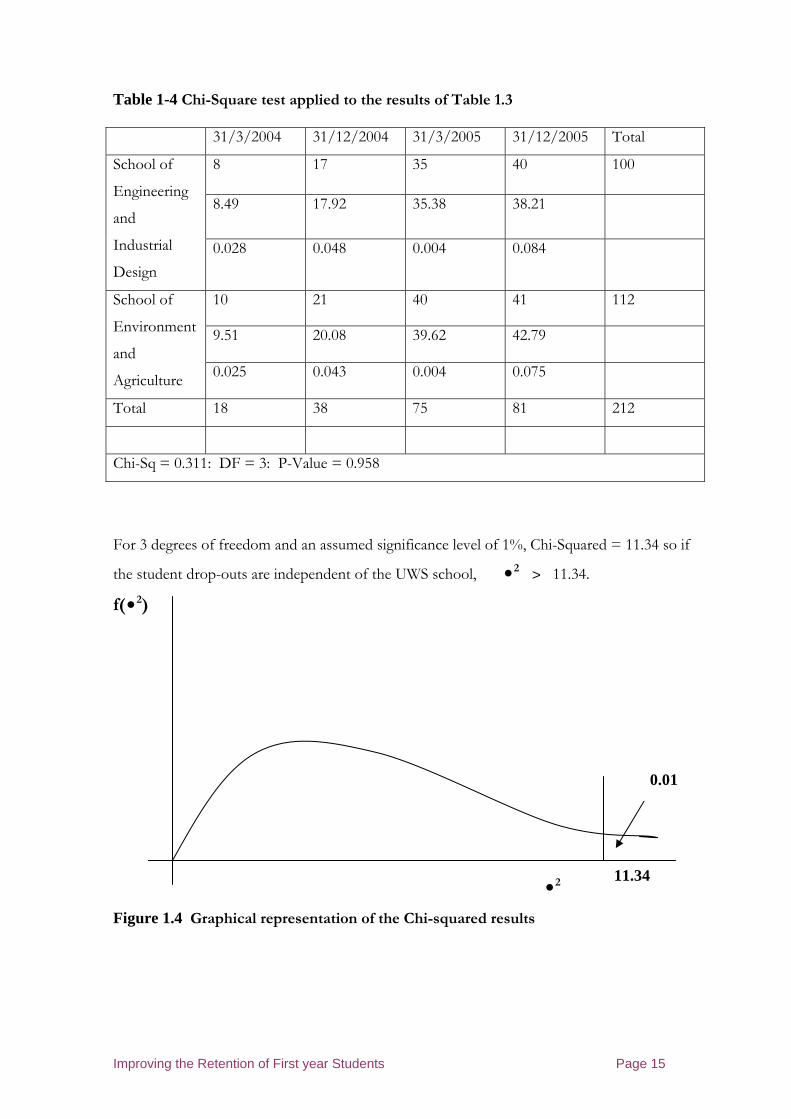
Table 1-4 Chi-Square test applied to the results of Table 1.3
31/3/2004 31/12/2004 31/3/2005 31/12/2005 Total
8 17 35 40 100
8.49 17.92 35.38 38.21
School of
Engineering
and
Industrial
Design
0.028 0.048 0.004 0.084
10 21 40 41 112
9.51 20.08 39.62 42.79
School of
Environment
and
Agriculture 0.025 0.043 0.004 0.075
Total 18 38 75 81 212
Chi-Sq = 0.311: DF = 3: P-Value = 0.958
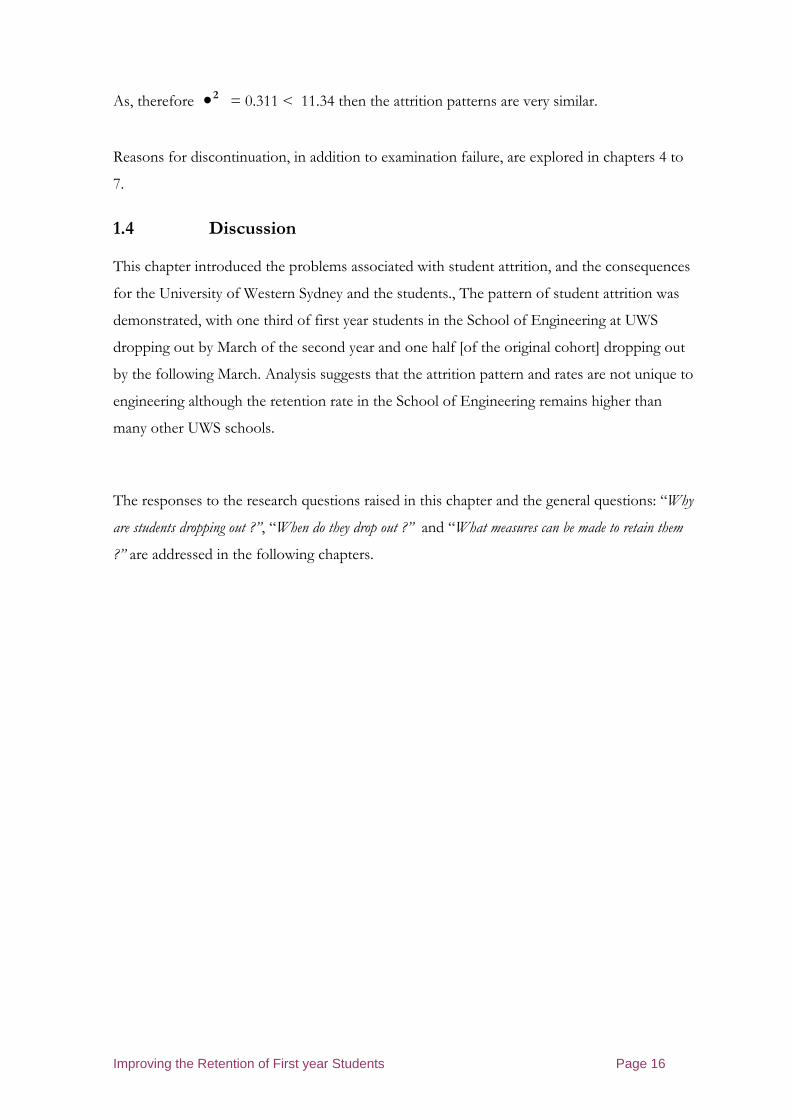
For 3 degrees of freedom and an assumed significance level of 1%, Chi-Squared = 11.34 so if
the student drop-outs are independent of the UWS school, •2 > 11.34.
f(•2)
•2
Figure 1.4 Graphical representation of the Chi-squared results
0.01
11.34
Improving the Retention of First year Students Page 16
As, therefore •2 = 0.311 < 11.34 then the attrition patterns are very similar.
Reasons for discontinuation, in addition to examination failure, are explored in chapters 4 to
7.
1.4 Discussion
This chapter introduced the problems associated with student attrition, and the consequences
for the University of Western Sydney and the students., The pattern of student attrition was
demonstrated, with one third of first year students in the School of Engineering at UWS
dropping out by March of the second year and one half [of the original cohort] dropping out
by the following March. Analysis suggests that the attrition pattern and rates are not unique to
engineering although the retention rate in the School of Engineering remains higher than
many other UWS schools.
The responses to the research questions raised in this chapter and the general questions: “Why
are students dropping out ?”, “When do they drop out ?” and “What measures can be made to retain them
?” are addressed in the following chapters.
Improving the Retention of First year Students Page 17
2. Literature Review
“We have genuinely sought to …connect specific programs and practices for students to institutional
actions that provide support for the faculty and staff directing those programs and practices”.
Vincent Tinto
All universities, in Australia and elsewhere, consider student retention seriously. They measure
retention levels in any year and within each course and they compare retention data among
schools or faculties and among universities. There are many reasons why a high retention rate
is preferred and this chapter explores the issues associated with retention and the reasons for
its significance.
The University of Western Sydney, like all universities, is aware of the consequences of
student attrition and they regularly monitor it and apply strategies to address it. Considerable
research has addressed the reasons for student attrition, as identified in the Pathway of Figure
1.2, Numerous measures have been proposed to improve retention. This chapter briefly
reviews the reasons and measures, the effectiveness of some measures and the success of
others. However, Higher Education is not a stable environment and the effectiveness of many
measures to improve retention are not consistent; they are greatly influenced by internal and
external factors such as budgets, political influences, changing personnel and changing
cultures.
Tinto and recent researchers such as Cuseo (2002), Engstrom and Tinto (2001)and Krause
(2005) regularly refer to the influences of the student’s family, prior qualifications and the
teaching and learning process on student retention. DEST (2004) reviewed student’s attitude to
university over time and concluded that the pathway to university has a significant influence on
attrition. The reasons for students coming to university have remained stable over time. There
has been little change in the considerable number of students who have a very uncertain start at
university: generally through a combination of factors, which can include lack of accurate initial
information, poor course choices, failure to get their first choice, or unrealistic expectations of
the amount of work and time involved in university study. 20% of the 1999 first year student
cohort hoped to change to a different course after their first year, and, as in 1994, about 30%
seriously consider deferring during their first semester (DEST, 2004).
Transition problems can be devastating for individuals and their families, and can result in
enormous social and economic waste (Pargetter, 1995). Considerable research has been carried

Improving the Retention of First year Students Page 18
out into transition and retention issues but the findings are not always consistent and are often
based on international studies. In USA, for example, an open-door policy applies to university
entrance which differs from the selective procedure in Australia and elsewhere.
2.1 Models of student retention
There exist a number of models of retention, dating from the mid 20th century; some of the
more influential models are referred to in the following sections.
Student retention is a result of a complex relationship between students and the teaching and
learning environment. First year retention rates remain a priority for Australian universities.
The Commonwealth Government has included retention and progression rates and student
experience data on its list of indicators for funding of higher education. “The consequences of
the massive and continuing exodus from higher education are not trivial, either for the
individuals who leave or their institutions” (Tinto, 1993). Over the last three decades attrition
rates have remained largely unchanged at 23% -25% across the higher education sector in
Australia (DEST, 2004). The first year of higher education is of great importance since nearly
one third of first year students in Australia indicate serious intentions of leaving study (Krause
et al, 2005) and first year is where the majority of departures occur (Price et al, 1991; Yorke,
2001). First year has been recognised as the key to many students’ experiences of and later
success in higher education (McInnis, 2001; Tinto, 1993).
2.1.1 Institutional approaches
Early theories on transition were based in psychology, focusing on individual personal
characteristics. From the mid- 1970’s the emphasis shifted to sociological factors, and more
recently it has focussed on the institutional context and the students’ integration. Tinto’s
(1975) conceptual model, based on Durkheim’s (1961) suicide theory and Spady’s (1970)
model of the student dropout process, is the most widely recognised and tested.
Tinto (1987, 1993) synthesised much early research on the theory of student drop-out,
emphasising the role of the institution and social/academic integration of students, particularly
the interaction between the students’ attributes, skills and dispositions and the institution’s
academic and social systems.

Improving the Retention of First year Students Page 19
Related studies include those of Stahl & Pavel (1992), Brewer’s (1992) life-task model,
Carpenter & Fleishman (1987), Eaton and Bean’s (1993, 1995) model of attrition based on
attrition/avoidance behaviour, Azjen and Fishbein’s (1975) model (c.f. Koslowsky 1993), and
Pascarella’s (1982) general model for assessing change. Cabrera et al. (1992, 1993) examine
empirically ‘the convergent and discriminant validity’ of Tinto’s model such as those seen in
Figures 2.1 and 2.2.
Figure 2.1 Tinto’s Model Pathway for University Students – 1975
Figure 2.2 Tinto’s Model Pathway for university students - 1993
Improving the Retention of First year Students Page 20
Tinto’s model, where students’ departure was found to be primarily related to isolation and
social exclusion, has been confirmed by a number of researchers; e.g. Allen and Nelson
(1989), Halpin (1990), Christie and Dinham (1990), Grossett (1989), Boyle (1989), and others.
However, Neumann and Neumann (1989) found it a poor predictor, though possibly useful
for residential students, as reflected by Pascarella et al. (1983) but add that ‘the concepts of
person-environment fit, social integration, and institutional commitment operated differently
in the commuter institution’. Pascarella (1982) added that such theories are more consistent
with "theoretical expectations in the residential and liberal arts samples than in the two- or
four-year commuter samples."
Bean and Metzner’s (1985) and Bean’s (1980, 1982, 1985) theories and models of student
departure, which emphasise the influence of the external environment more than social
integration factors, are particularly applicable to non traditional students.
2.2. Studies of transition
Many studies have been carried out on the issue of transition into University from High
School and through other entry routes Studies include:
• USA - Tinto, Pascarella, Terenzini, Astin etc, Gutierrez-Marquez (1994) (10,000 students), Gillespie and Noble (1992);
• Canada - Sarkar (1993), Sweet (1986), Anderson et al. (1994); and • UK – Goldstein, Thomas, Rabash, Raudenbusch etc., Hadley & Winn (1992), Gramlich &
Greenlee (1993);
Student retention is complex and varies according to several factors and their interaction. This
is evidenced in Calderon’s (1997) large-scale Monash comparison of student progress-rates
where he identifies the stereotypical successful student in terms of personal characteristics
such as gender, socioeconomic status and school background, and shows that these vary by
School/faculty. Following Clarke et al. (1994), variables identified as relevant in the literature
are grouped in categories, as described with reference to the Student Pathway of Figure 1.2:
In the literature attrition is often equated with student withdrawal from the institution in
which they are enrolled. Price, Harte and Cole (1991) however, identified three main
categories of withdrawal:
• internal attrition: which refers to students who transfer between courses within the same
institution. These students are not lost to a particular institution, but still contribute to
course attrition in institutional and national statistics;

Improving the Retention of First year Students Page 21
• institutional attrition: which refers to students who leave the institution in which they
commenced their university studies, but then continue at another university. These
students are not lost to the university system, but appear as course attrition in
institutional and national statistics; and
• systemic attrition: which refers to students who withdraw from a university and do not
re-enrol in that or another university. These students are lost from the university
system and are recorded as course attrition in university and national statistics.
Students who interrupt their studies by taking leave from their course are also likely to be
counted in the attrition statistics, particularly if they interrupt their studies across years or for
an entire calendar year. Since attrition calculations do not differentiate between those on leave
and those who withdraw, students categorised as ‘intermittent’ can contribute to increased
attrition rates; namely those who leave and then return at a later date. When and if, they return
from leave a statistical counter effect is observed, by decreasing attrition (or increasing
retention rates) through adding to the size of the continuing student population.
There is a range of perceptions in the higher education community concerning institutional
attrition, in some cases being viewed as a negative and in others as a positive outcome. Highly
prestigious institutions, for example, may assume that high rates of attrition are an inevitable
consequence of maintaining the competitive academic conditions upon which their
reputations depend (Lenning, Beal and Sauer, 1980). In this context, high attrition rates may
not be perceived as a problem, but rather as a form of quality assurance and hence as a
positive educational outcome for the institution. Alternatively, some people may enrol in a
course with the intention of completing only a selection of subjects to reach specific personal
or professional goals. In such cases, withdrawal can be viewed as a positive outcome, at least
from the student's perspective. Withdrawing to take up an employment opportunity can also
be considered as a positive outcome.
Attrition is usually associated with negative effects:
• Loss of confidence and self esteem which can have serious implications for any
subsequent study or career path that they may wish to pursue (Lam, 1984);
• A social loss in terms of the withdrawal of people who do not, as a result, achieve
their potential; their talent is 'wasted', and society does not achieve benefits that would
be generated by their further education;

Improving the Retention of First year Students Page 22
• A waste of institutional resources spent on students who withdraw when limited
funds could have been devoted to other students;
• The damage attrition can cause to the reputations of courses and institutions by
bringing into question the relevance of the courses, the quality of teaching, and the
adequacy of the institution's student services and support facilities; and
• Attrition can be seen to compound other problems associated with falling enrolments
and the consequent difficulties institutions may experience in planning and budgeting
for their programs, with ramifications for institutional funding (Ewell, 1984; Price,
Harte and Cole, 1991).
Attrition is commonly investigated in terms of course and institutional loss. At UWS, for each
full-time equivalent student who discontinues, the university loses around, in 2006, $13,000
per year. As such, two attrition-related matters require further discussion. These have been
referred to as the 'year out' and the 'goal fulfilment' issues (Ewell, 1984). The crux of the 'year
out' issue is that university students are displaying increasingly complex patterns of enrolment.
A conventional but outmoded view assumes that young people complete year 12, enrol in an
undergraduate degree the following year at a university and graduate 'on time' after three to
five years of uninterrupted full-time study. However, the Australian student population is
becoming increasingly diverse and students are becoming more flexible in their pathways
through and between post-compulsory education, employment and training. Combining full-
time study with periods of part-time study and paid work is increasingly common amongst
students. Furthermore, intermitting studies, to take a period of leave to travel, earn money, or
for other personal reasons, is also becoming more common. Students who take leave usually
intend to resume their studies but, while many of them may graduate eventually, this may not
necessarily be from the university in which they were originally enrolled. Such students may
thus appear as institutional attrition but are not lost to the system and their temporary
withdrawal can be viewed from a positive perspective.
The issue referred to as 'goal fulfilment' is more complex. Some students may withdraw
because they feel that their studies are not helping them to attain their goals. This can be
perceived as a negative reason for withdrawing. However, other students withdraw for more
positive goal-related reasons, as mentioned earlier. A student may have no intention of ever
finishing a degree program having enrolled in selected subjects for personal or professional
interest, to assist career progression or perhaps to gain entrance to another university (Roberts

Improving the Retention of First year Students Page 23
1984). Thus some students who withdraw do so because they have met their goals, while
others redefine their goals or identify other means of achieving them.
Australian literature tends to focus on two areas of study. Firstly the pre-entry phase and
selection criteria for the universities: secondly, the pass rates and retention rates of students.
West (1985) investigated the first category through the effects of three pre-entry
characteristics of performance of students entering Monash University from high school in
1975, 1980 and 1982. He investigated the type of school, father’s occupation and the
student’s country of birth. The author concluded that students who undertook most of their
secondary education in government schools performed better at the end of their first year at
university than students with the same selection score from independent schools. The father’s
occupation and country of birth played minimal significance in these results for each of the
three years being investigated.
Lewis (1994) analysed the results of over 10,000 students enrolled at the University of
Wollongong between 1990 and 1993 with the aim of investigating the effects of the
university’s access and equity schemes on student performance. The study concluded that
female students who had attended government schools, together with older students,
performed significantly better than the average student. However, the performance of
students from non-English speaking backgrounds and indigenous students was lower than the
average.
Killen (1994) concluded that there were a number of factors influencing success, as measured
by pass rates
• The motivation of students;
• Their approach to studying; and
• Their cultural expectations.
He conducted interviews with staff and students and the factors seen as significantly affecting
student performance were
• Student self motivation;
• Effective study techniques;
• Family support; and
• Enthusiastic lecturers.

Improving the Retention of First year Students Page 24
2.3 Key Factors influencing Student Retention
This review of the factors influencing retention follows those identified in the pathway model
presented in Fig 1.2. The key factors identified in the literature review can be grouped as in
the following list. Each of these factors has been identified by researchers and higher
education institutions as contributing to student retention. These factors are reviewed in
detail in the following sections:
Transition phase
• Student age
• Language and cultural background
• Students at Risk
• Student gender
• Goal Commitment
• Family and Peer Support
• Living at Home or Residential at the university
• Course Expectations
• Course specialisation
• Transition from School
Pre-entry phase
• Administration
• Academic advice
• Provision of Transition subjects/units
Orientation phase
• Early Feedback and Advice
• Student Engagement
• Collaborative Learning and Student Engagement
• Social Integration
Student First Year phase
• Teaching/Pedagogy
• Effective Interventions
• Peer Mentoring
• Common timetabling of groups

Improving the Retention of First year Students Page 25
• Developing an online community
• Developmental subjects/units
• Conflicts with employment
2.3.1 Student Age
"Mature age" students are sometimes included in retention statistics, a category which often
but not necessarily includes students without "normal entry" qualifications (see McClelland
and Kruger, 1993) and who may enter from TAFE or using Advanced Standing. With
increasing alternative entry pathways to higher education, a variable based on entry type is
more appropriate in such cases. Maturity is suggested as a factor in student success: hence the
argument for deferring university studies for a year after secondary school. Linke et al. (1985)
found that 5000 deferring South Australian students generally perceived deferring as "valuable
personal experience with relevance also to their ability to cope with subsequent studies" but
also that such deferring acts as a filter, deterring female non-metropolitan students from
entering higher education (Evans, 2000).
Farabaugh-Dorkins (1991) in a study of adult (over 21 years) freshmen, found dropping out
most correlated with intent to leave, GPA and goal commitment. Age appears to have little
predictive power in some studies for success (e.g. McClelland & Kruger, 1993, Kuh & Vesper,
1991); or persistence (e.g. West et al. 1986 and Gillespie & Noble, 1992). However, Clarke and
Ramsey (1991) found age correlated with performance in most institutions and courses.
Siegfried and Walstad (1990) indicate that age has a positive effect on performance in
economics. Shah and Burke’s (1996) national Australian study using input-output analysis
found that commencing students aged 18 to 20 years have the highest chance of completing a
course, and that the difference in probabilities varies with the commencement of age.
2.3.2 Language and Cultural Background
Language and cultural background have been identified as potential factors in student
retention. One indicator of ethnicity which is sometimes used is a Non-English Speaking
Background (NESB) (Winefield et al., 1990). Australian research appears clearer. Aboriginal
and Torres Strait Islander (ATSI) students have been consistently reported as being less
successful (McClelland & Kruger, 1993) and less persistent (Abbott-Chapman et al., 1992).
Improving the Retention of First year Students Page 26
Asian students tend to enter (Winefield et al., 1992) and to persist (Abbott-Chapman et al.
1992; West et al. 1986) in tertiary education disproportionately, but to have more problems
with their institutions, their courses and with not being academically prepared (West et al.,
1986)
2.3.3 Student Gender
Clarke et al. (1994) considered that results where studies suggest that gender can predict
performance (Benson, 1991; Murray-Harvey, 1993; Tutton & Wigg) or persistence (Gutierrez-
Marquez 1994), can be attributed to confounding factors and methods of analysis, and that
any interpretation must avoid being simplistic. For example, Abbott-Chapman et al. (1992)
found attrition risks greatest for able females, while West et al. (1986) found different
motivations for dropping out by gender, but no quantitative differences. Elsworth and Day
(1983) found females less likely to take courses offered to them from choices of secondary
subjects in science, or based on their perceptions of career advantages. Pascarella & Terenzini
(1983) found an overall indirect gender effect on persistence through initial institutional
commitment, but separate analyses revealed that different male and female behaviour could be
explained differently.
2.3.4 Goal Commitment
Students' goals for tertiary study are an important factor in persistence, as shown by Mutter
(1992) , Preston (1993, )Webb (1989) and Sarkar (1993). Such goals appear to have a direct
effect (Gillespie and Noble, 1992; Pascarella & Terenzini, 1983; Allen & Amaury, 1995) or an
indirect effect (Munro, 1981; Bean, 1985; Pascarella & Terenzini, 1983). The influence appears
to vary: greater during the earlier years (Bean, 1985); more direct for females but essentially
indirect for males (Pascarella & Terenzini, 1983). Warwick-James (1994), using a national
longitudinal data base, found that a clear career goal was correlated with retention, whereas
Lewallen (1993) found no evidence that students who were undecided about a choice of
career or major study area had a greater potential for non-persistence.
Munro (1981) found students’ goals appear to be strongly influenced by their perceptions of
their parents' attitudes and goals for their tertiary education. Munro (1981) demonstrated that
self-esteem indirectly influences performance through institutional commitment and
satisfaction with academic activities, etc. Students' stated intention is consistently the strongest
Improving the Retention of First year Students Page 27
predictor, whether of persistence (Bean 1982, 1985; Cabrera et al., 1993) or dropping out
(Farabaugh-Dorkins, 1991). Nordquist (1993) also found gender expectations and family
background strongly related to student withdrawal.
2.3.5 Family and Peer Support
Family support influences students’ commitment to the institution and course satisfaction
(Cabrera, Nora & Castaneda, 1993) and is an important factor in persistence for a small
sample of waverers (West et al., 1986), though West found that a few withdraw because of the
difficulty of combining study with family commitments and needs. Terenzini (1992) noted that
families can be either a supportive asset or a source of stress as relationships change. Parental
encouragement relates more to satisfaction for males (Bean and Vesper 1994).
West et al. (1986), Pascarella & Terenzini (1983), Mutter (1992) found that peer support and
relationships enhance persistence of students both directly and, from Cabrera et al. (1993),
Munro (1981), Pascarella & Terenzini (1983), indirectly, although Gillespie and Noble (1992)
and Kuh and Vesper (1991) found that it was not a significant predictor of persistence. The
support of friends was more relevant for females, whereas academically-oriented factors were
more influential in males’ decisions (Pascarella and Terenzini, 1983 and Bean and Vesper,
1994). School friends were a facilitating or a complicating transition influence depending on
whether they attended the same institution or not.
Financial matters generally appear to have a small but significant effect on persistence either
directly (e.g.Webb, 1989), or indirectly via goal commitment (Cabrera et al., 1990), or not at all
(Gillespie and Noble, 1992). Withdrawers gave financial problems as the most important
reason in West et al. (1986) and third reason in Abbott-Chapman et al. (1992). West et al.
(1986) found that, compared to withdrawers, those who persevere relied on casual
employment more than on family financial support.
2.3.6 Living at Home or Residential
Rural students, according to Elsworth and Day (1983) are more likely to decline tertiary place
offers. This could be related to a financial support factor. A location variable can also be
relevant where home postcode is often used as an indicator (McClelland & Kruger, 1993).
West et al. 1986 found significant number of students attributing finance for deciding to
withdraw or transfer to an institution nearer home and social integration is a factor. Tinto
Improving the Retention of First year Students Page 28
(1987) found `external community pivotal to off-campus students’. Terenzini and Pascarella
(1982), after controlling for other characteristics, found the residence unit context appears to
relate to persistence among males but not females. Any analysis of overseas versus local
students may be confounded by this factor.
2.3.7 Course Expectations/Characteristics
A mismatch between prior expectations and actual experiences was found to be a significant
reason for withdrawing by Abbott-Chapman et al (1992). West et al. (1986), Braxton (1993),
Power, Robertson and Beswick (1986) found that low commitment and withdrawal were often
the result of inadequate counselling and decision making about university courses. King (1992)
also stressed the central role of academic advising on retention. Glass and Garett (1995) found
that orientation courses improved retention, as did Sendman (1991) for the third, but not the
first, semester, but did not result in significantly higher GPAs. Terenzini et al. (1993) found
that faculty involvement was important in orientation. They also found a need for parents’
involvement. Other studies include Frost et al. (1991), Upcraft et al. (1995), Price et al. (1992),
Clarke and Ramsey (1990).
A perceived lack of relevance was found to be a significant factor in dropping out in some
Australian studies (Abbott-Chapman et al, 1952, West et al, 1986). Overseas, Bean (1982,
1985) found course ‘utility' a significant indirect predictor of persistence, and Kuh and Vesper
(1991) found that student effort related to the practical values associated with courses.
2.3.8 Course Specialism
Findings sometimes vary according to the discipline area, which can also relate to prerequisite
knowledge. Success in science subjects is better predicted than in the humanities by the total
ASAT test (Everett and Robins, 1991) and by performance in relevant school subjects
(McClelland and Kruger, 1993). Shah and Burke’s (1996) input-output analysis found that
Engineering students have the least chance of completing their degree whereas the majority of
Law and Medicine students completed.
2.3.9 Transition from School
Student performance, from the limited literature available, is clearly related to their own
concepts of their academic ability (Wilhite, 1990, Murray-Harvey, 1993 and Watson, 1988) in
mathematics). Watkins (1986) and colleagues focussed on aspects of students’ personalities
Improving the Retention of First year Students Page 29
and attitudes, study approaches to student learning and adjustment to the nature of
institutions and different faculties disciplines and learning environments.
A significant number of students who voluntarily withdrew from full-time study cited
unsatisfactory study skills and a lack of important pre-requisite knowledge as reasons (West et
al. 1986). Studying and learning approaches at tertiary level appear to be strongly influenced by
practices at secondary school level (Ramsden 1991, Ramsden et al. 1989) and a mis-match may
create problems (Evans, 2000).
A DEST (1999) report showed that despite widespread and concerted efforts to improve the
links between school and university, it is still the case that about one-third of the students who
go direct from school to university do not feel they were ready to choose a course, and two
thirds are of the view that they were not well-prepared for university study. However, there
are some indications that the gap between school and university noted in the 1994 survey may
not now be so wide. More students in 1999 found university study more fulfilling than school
(61 per cent) and fewer felt it was more demanding than school (57 per cent). Students have
relatively realistic expectations about the amount of new material they will experience at
university; they both expect and find a significant amount of such material. (DEST,1999)
What emerges from a CEQ [Course Experience Questionnaire] study carried out by UWS in
2004 is how important it is to be consistently alert to students’ expectations right from the
moment of their first contact with a university, then during orientation and finally in each class
as the course gets under way. Key expectation ‘hot spots’ identified in the study include
clarifying expectations for assessment, making explicit what services are and are not available,
noting the key university rules affecting student progress and life at the institution, when staff
can and cannot be accessed, providing sound academic advice and informing students about
what to do when something goes wrong.
Student perceptions are important DEST (1999). The DEST (1999) study showed differences
in perceptions when students were considering discontinuation or deferring their studies [see
Appendix 1 for the DEST Tables of Higher Education attrition and enrolment rates and
Appendix 2 for the accompanying notes]. Table 2.1 shows an extract from the DEST (1999)
study of significant differences.
Improving the Retention of First year Students Page 30
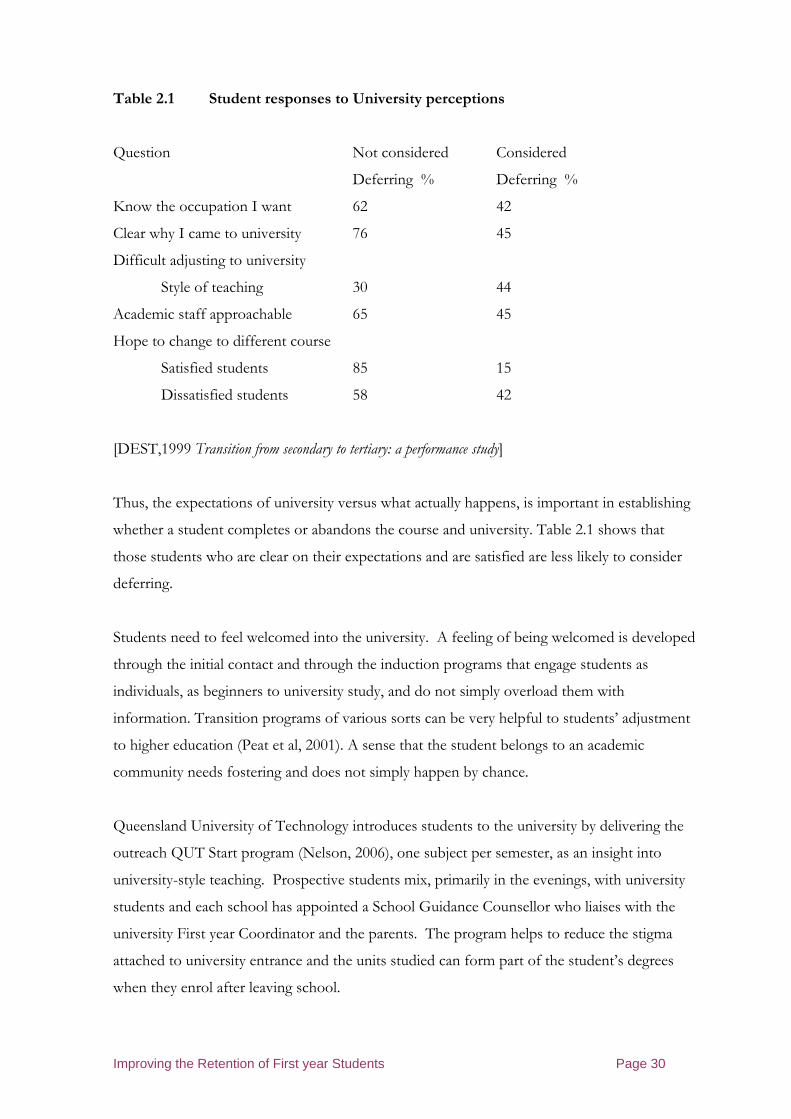
Table 2.1 Student responses to University perceptions
Question Not considered Considered
Deferring % Deferring %
Know the occupation I want 62 42
Clear why I came to university 76 45
Difficult adjusting to university
Style of teaching 30 44
Academic staff approachable 65 45
Hope to change to different course
Satisfied students 85 15
Dissatisfied students 58 42
[DEST,1999 Transition from secondary to tertiary: a performance study]
Thus, the expectations of university versus what actually happens, is important in establishing
whether a student completes or abandons the course and university. Table 2.1 shows that
those students who are clear on their expectations and are satisfied are less likely to consider
deferring.
Students need to feel welcomed into the university. A feeling of being welcomed is developed
through the initial contact and through the induction programs that engage students as
individuals, as beginners to university study, and do not simply overload them with
information. Transition programs of various sorts can be very helpful to students’ adjustment
to higher education (Peat et al, 2001). A sense that the student belongs to an academic
community needs fostering and does not simply happen by chance.
Queensland University of Technology introduces students to the university by delivering the
outreach QUT Start program (Nelson, 2006), one subject per semester, as an insight into
university-style teaching. Prospective students mix, primarily in the evenings, with university
students and each school has appointed a School Guidance Counsellor who liaises with the
university First year Coordinator and the parents. The program helps to reduce the stigma
attached to university entrance and the units studied can form part of the student’s degrees
when they enrol after leaving school.

Improving the Retention of First year Students Page 31
The results of a 10 year survey of the factors and reasons for students enrolling in University
(DEST, 2004) showed the trends and patterns summarised in Table 2.2. The data shows the
percentage responses for each year, ranging from ‘not important’ to ‘important’, for the
cohorts: 1994, N=4 028; 1999, N=2 609; 2004, N=2344. In general terms, the reasons for
enrolling are listed in order of importance.
Table 2.2 Reasons for enrolling 1994-2004 (%)
Reason Not important
Important Undecided
Studying in a field that really interests me
1994 1999 2004
0 1 1
6 3 4
94 96**1 95
Improving my job prospects
1994 1999 2004
5 4 6
11 10 11
84 86*1 83*2
Developing my talents and creative abilities
1994 1999 2004
6 6 6
20 21 19
74 73 75
To get training for a specific job
1994 1999 2004
9 9 9
18 17 17
73 74 74*3
The expectations of my parents or family
1994 1999 2004
52 51 44
23 26 26
25 23 30** 2 3
* significant at .01 ** significant at .05 1 Denotes significant change 1994 to 1999. 2 Denotes significant change 1999 to 2004. 3 Denotes significant change 1994 to 2004. (DEST, 2004)
Significant change is evident between 1994 and 2004 for parental expectations. When asked
about reasons for considering deferring, the following data was obtained (Kraus et al., 2005)
where the cohort sizes, n, are 840 and 638 and the general reasons for deferring are listed in
order of importance. (Table 2.3)

Improving the Retention of First year Students Page 32
Table 2.3 Reasons for considering deferring, 1999-2004 (% of students)
(1999, n=840; 2004, n=638)
not relevant
Neutral important/ very imp.
Emotional health 1999
2004 42 36
12 12
46 52
I wanted to change courses 1999
2004 47 45
11 13
42 42
Financial reasons 1999
2004
55 46
11 15
34 39
I thought I might fail
1999 2004
48 51
15 13
37 36
University wasn’t what I expected
1999 2004
45 48
19 24
36 28
I disliked studying
1999 2004
43 46
19 27
37 27
Physical health
1999 2004
64 62
10 11
26 27
Problems with daily travel
1999 2004
71 70
10 11
19 19
Paid work commitments
1999 2004
71 78
8 10
21 12
Family commitments
1999 2004
75 73
9 10
16 17
I found employment
1999 2004
82 83
8 7
11 10
(DEST, 2004)
Improving the Retention of First year Students Page 33
2.3.10 Administration
Bean (1982, 1985) found that the opportunity to transfer to another university directly
influenced persistence, and West et al. (1986) found that 15% of withdrawers indicated
that the administrative arrangements of the institution were too inflexible.
2.3.11 Improving academic advice
There is evidence that retention can be increased by the active provision of advice to first year
students about their programs of study (course advice, subject/unit selection, course transfers,
withdrawal etc) (Pascarella and Terenzini, 2005). Apart from anything else, there is a well-
established association between retention and out-of-classroom contact with staff (Cuseo,
2003).
Cuseo (2003) is a strong advocate of so-called intrusive advising:
“…institutions should deliver academic support intrusively—by initiating contact with
students and aggressively bringing support services to them, rather than offering
services passively and hoping that students will come and take advantage of them on their
own accord. Academic advisors are in the ideal position to “intrusively” connect
students with academic support professionals, who can provide students with timely
assistance before their academic performance and persistence are adversely affected by
ineffective learning strategies.” (Cuseo, 2003)
Active advising of this type is commonly associated with a central advising service staffed by
specialist advisors. In the US, academic advising is often shared between academics in the
faculties and specialist advisers in an advising centre. Typically, the latter provide a service for
a subset of students, such as first-year students and those on academic probation, while the
former advise students in later years. In four-year public colleges and universities in the US,
this “split model” is the dominant organisational model (Pardee, 2004).
There are some resonances here with the Field of Study Advisor (FOSA) model associated
with the Personalised Access and Study (PAS) initiative at Victoria University. The advising
centre in this case was the Centre for Commencing Students (CCS) and the FOSAs were
higher education academics and TAFE teachers who were, in effect, seconded to the CCS for
Improving the Retention of First year Students Page 34
a limited time to provide a specialised academic advising service for students across the
sectors, but only at the time of enrolment.
Implemented at UWS, the “split model” might use specialist advisors based in a central unit to
provide academic advice to students throughout their first year, while course coordinators
provide advice for later years.
2.3.12 Provision of transition subjects/units
Over 90% of US colleges responding to a recent survey, including research intensive
universities, reported offering “first year seminars” in the form of subjects/units designed to
assist the transition of students into higher education (Barefoot, 2003). These seminars vary
considerably in content and approach but are mostly designed as formal units emphasising
extended orientation or “college survival”. In the US they are most commonly offered as 1
credit hour subjects, which equates to 50 minutes of in-class time per week plus 1.5 hours per
week of out-of-class work (roughly equivalent to a 2 credit point unit at UWS). However,
some colleges offer first year seminars that are 2, 3, 4, 5 or even more credit point subjects.
Academic advising is often built into first year seminars, as is the related area of career
planning. The courses are typically taught by both academics and student services
professionals (National Resource Centre for The First-Year Experience and Students in
Transition, 2004). Collaborative learning approaches are also a key feature of these courses.
While some first year seminars are offered as electives and therefore may be taken by those
who are likely to succeed, there is consistent evidence that participation in these programs is
associated with increased retention and completion. However, it is not clear whether these
positive effects are directly or indirectly related to the seminars (Pascarella and Terenzini,
2005).
2.3.13 Early feedback and action
Poor academic progress is probably the best “red flag” warning of potential attrition (Cuseo,
2004). Early feedback to students on their academic progress coupled with appropriate action
to assist them increases retention (Pascarella and Terenzini, 2005). An effective early feedback
system requires early assessment tasks, timely and helpful feedback, and appropriate action to
support those who either do not submit at all or submit sub-standard work.

Improving the Retention of First year Students Page 35
Evidence from the UK Open University suggests that email contact from a central service can
improve assignment submission rates, though telephone contact from the student’s tutor may
be more effective (Simpson, 2003). Whatever delivery system is used, the style of the message
is important – “It needs to be short, be informally written, be attractive, address the students
concerns and feelings directly, and give appropriate encouragement” (p78).
Over half of US colleges report mid-term grades to academic advisors and to a central office,
as well as to the students themselves (Barefoot, 2003). This allows a coordinated institutional
follow up to those with poor results but would require a degree of central reporting that is
likely to be unacceptable at UWS, where the tradition is that only final grades are released. In
most instances at Victoria University, grades for individual assessment tasks do not go further
than the subject/unit team.
2.3.14 Student engagement
The motivation and academic orientation of students has been found to be a significant
predictor of performance and persistence by Hughes and Wyld (1986), Abbott-Chapman et al.
(1992), and West et al. (1986).
Siegfried and Walstad’s (1990) survey of economics students indicated study effort was
positively related to student performance, whereas their earlier study (Siegfred and Fels, 1979)
did not. Tay (1994) found that preparation for class, and Romer (1993) found that attendance
at class, were important for the final performance of students.
The interventions he proposed therefore tended to de-emphasise those based in the classroom
and to focus instead on the development of community in student residences and in extra-
curricular contact between staff and students. However, more recently his attention has turned
to other institutions, including non-residential colleges serving “commuting students” and
community colleges offering two-year sub-degree programs and vocational training (Tinto,
1993). In these settings, which are much closer to those of an Australian University, he accepts
that students are mostly only on campus to attend classes and that academic and social
engagement in the classroom is therefore much more important than what happens outside of
it (Tinto, 1995; 1997; 2003).

Improving the Retention of First year Students Page 36
Amongst others, Yorke is critical of Tinto’s earlier model, mainly for its lack of emphasis on
choice of course, geographical distance from home town, personal health and student learning
experience , though he sees it as more relevant for part-time students than full-time students
(Yorke, 1999). Braxton (1995, 2002) and his colleagues have reviewed the empirical validity of
Tinto’s theory and concluded that while there is strong support for many of its propositions in
residential colleges and universities, this is not so in commuter colleges and universities. They
paint a picture of the commuter institution that is familiar to us. It is a place that students
attend by balancing many other day-to-day commitments, including family and work. It is not
their primary social focus; family, friends, and colleagues off campus are much more
important socially. They describe the campus environment as follows:
“Competing time demands minimize social involvement at commuter institutions, as
students devote their campus time to academic pursuits of attending class, meeting
with faculty, or fulfilling degree requirement…Students spend their time efficiently on
campus, hurrying to class and leaving afterwards to be at the next place that requires
their presence, often work or home. An aerial view of the campus might resemble a
transportation centre, with frequent arrivals and departures of cars, buses and other
vehicles. The various forms of rushed comings and goings create a “buzzing
confusion”…Amid this activity, the daily schedule of meeting times provides order.”
They propose a modified theory for such institutions that emphasises an institutional
commitment to student welfare and a focus on the development of academic communities in
the classroom. As Tinto has also concluded, the focus in commuting institutions has to be on
academic integration rather than on social integration. The only real site for improving
student-student interaction and teacher-student interaction is the classroom, so what goes on
in the classroom has far greater impact on student attrition than in the traditional residential
university. Thanks to the work of Tinto(1982), Astin(1977), Pascarella(1982) and
Terenzini(1993) and others, there is a growing emphasis on student engagement in North
American universities. This is exemplified by the widespread use of instruments to measure
student engagement at an institutional level, such as the National Survey of Student
Engagement (NSSE) (National Survey of Student Engagement) and the Community College
Survey of Student Engagement (CCSSE) (Community College Survey of Student Engagement
2004). Associated with the NSSE is the DEEP (Documenting Effective Educational Practice)
project, where 20 institutions with high levels of student engagement measured by the
National Survey for Student Engagement were investigated to explore why they performed so

Improving the Retention of First year Students Page 37
well (Kuh et al, 2005). The challenge lies in engaging students who see study as just one of the
many activities that they need to juggle in their lives. As McInnis (2003) puts it:
“The new realities of the student experience largely concern change in priority
students now give to their time at university. We have observed in Australia recently
that students increasingly expect university to fit with their lives rather than vice versa.
For academics from any generation, this is often perplexing and frustrating. The
students appear to be less engaged with university generally and with study in
particular…. Undergraduate students now have many more choices about when,
where, and what they will study, and how much commitment they need to make to
university life.
(McInnis 2003:1).”
McInnis (2003) writes here about Australian students in general but his emphasis on
negotiated engagement that meets student needs while ensuring that learning is effective is
particularly germane to institutions like UWS.
Price, Harte and Cole (1991) carried out a study into student attrition at the Northern
Territory University, examining students who enrolled in 1988, 1989 and 1990 and who did
not re-enrol the following year. Over 2000 students were identified with a 23% response.
The study concluded that the most consistent reasons for withdrawing over the three years
were
• Employment “I could not cope with full-time work and study”
• A personal decision – unspecified
• Family commitments
• The course: “I was dissatisfied with the course teaching”
Less important reasons included
• Health
• Academic preparedness and
• Finances linked to fees, accommodation, living expenses and employment.
With regard to awareness of the implications of student retention across the university,
suggested strategies for monitoring and reducing attrition suggested by Price et al (1991) are
• The introduction of ongoing exit surveys for students who do not re-enrol
• A review of computer programs which monitor admissions and other data
Improving the Retention of First year Students Page 38
• A review of information material to provide university advice and offerings
• Reviews of academic support programme, staff development, education facilities
(including the library), timetabling and after-hours facilities.
Sharma and Burgess (1994) examined undergraduate students who withdrew from Swinburne
University of Technology in 1993 (850 students, a 43% response). At least 30% of
respondents identified the reasons for withdrawing as:
• Lack of motivation
• Enrolment related matters
• Study workload
• Failure in exams
• Financial situation
• Dissatisfaction with the learning environment and
• Having enrolled in the wrong course.
It was evident that actions taken to improve pass rates appeared to reduce attrition rates and
that external issues such as employment conditions and personal and family situations
influenced student’s decisions.
Further studies by Power, Robertson and Baker (1987) and also by Price, Harte and Cole
(1991), concluded that universities can reduce attrition in the initial years by implementing
programs to
• Provide assistance to potential students to make more informed choices about
university study
• Help students to become better motivated by demonstrating the relevance of the
course to their educational goals, thereby increasing their commitment to study
• Develop study skills that are relevant to university study and
• Provide a university environment which is more empathetic to the needs of a more
diverse population
• Provide a mentoring program (which he called Faculty-Student Mentoring) and
• Providing a caring role for the many students who do not have this at home.
Cuseo (2002) suggested eight ‘Roots of Attrition’ and their associated remedies:
• academic underpreparedness
• academic boredom
Improving the Retention of First year Students Page 39
• transition- to-higher education adjustment difficulties
• uncertainty about educational or occupational goals
• irrelevancy
• isolation
• incompatibility and
• low commitment
Research on mentoring indicates (Cuseo, 2002) that it has a positive impact on the personal
professional development of young adults. Links have been established between student
mentoring and student retention (Campbell & Campbell, 1997). In 2003 UWS published an
evaluation report on Peer Mentoring and found that control groups show that students who
received mentoring had higher retention rates than those who did not.
The quality and style of mentoring is significant if students are to benefit. Mentors should,
according to Cuseo (2002), be more mature than the students, have interpersonal skills, be
willing to commit time and have a good knowledge of the campus, with academic advisers who
are accessible, approachable and helpful in providing guidance. The mentor potentially acts as
• Advocate
• Cheerleader
• Coach
• Confidante
• Friend/Colleague
• Guide
• Resource and referral agent and
• Role model for the student.
2.3.15 Collaborative learning and student engagement
Collaborative learning is in essence an approach that seeks to engage students in their own
learning though, for example, project-based learning. As was discussed in the previous section,
student engagement appears to be a critical means by which educational institutions can

Improving the Retention of First year Students Page 40
reduce their attrition rates. Briefly, the principles informing this approach to teaching and
learning are: students working collaboratively (in pairs or groups) to achieve shared learning
goals; the view that learning occurs when students and teachers work together to create
knowledge; and that the process of learning, as much as the content of teaching, is what
produces deep learning (Barkley, Cross & Major, 2005; Matthews, 1996).
On the strength of an exhaustive review of the American literature, Pascarella and Terenzini
(2005) highlight the place of collaborative learning as a strategy for preventing attrition thus:
“Researchers during the 1990’s produced a substantial body of evidence on
approaches to teaching that either did not exist in earlier decades or
were…nascent…Two important themes woven through many of these new
pedagogies concern active student engagement in learning and teaching and learning in
collaboration with faculty and peers.”
Pascarella and Terensini (2005) also summarise evidence suggesting that collaborative learning
tends to improve knowledge retention and provides opportunities for students to then act as
‘teachers’ for their own peers. They go on to suggest that this kind of interaction with peers is
“probably the most pervasive and powerful force in student persistence and degree
completion” (Pascarella and Terenzini, 2005).
The association between retention and the adoption of collaborative learning within
institutions is clearly related to the generally positive outcomes generated for students
involved in collaborative learning including; improved grades; better attitudes to learning;
higher satisfaction with their courses and their teachers; and better interaction with teachers
and peers (Barkley et al, 2005). These are the same student experiences, not surprisingly, that
have consistently been associated with lower attrition rates (Tinto, 1997; Polesol et al, 2004;
Pascarella and Terenzini, 2005). As Panitz points out, a student centred approach lies at the
heart of the distinction between collaborative learning and other closely associated approaches
to learning. There are many ways and means of creating interactive environments in which
students take more responsibility for their own learning and that of their peers. However,
what works best is determined, to a large extent, by the characteristics of the local student
population and of the institution (Panitz, 1996).
Improving the Retention of First year Students Page 41
Finally, collaborative learning approaches are premised on principles like embracing cultural
diversity and acknowledging the disparate background communities that learners bring with
them to education, and draws on these to promote engagement with the educational process
(see Bruffee, 1999; Barkley et al, 2005). This is particularly important at UWS.
2.3.16 Social Integration
Stage (1987) and Bean (1985) found that degree of social integration matched the level of
academic integration. Student’s perception that academic and administrative staff provide for
their personal and social needs appears to positively influence persistence both directly and
indirectly, particularly for females (Bean & Vesper 1994, Pascarella & Terenzini, 1983,
Pascarella et al.,, 1986, Cabrera et al. 1993, West et al,. 1986). Munro (1981) and Allen and
Nelson (1989) found these qualities influenced institutional engagement.
The literature on mentoring is reviewed by Jacobi (1991), and Muckert et al. (1996). Nordquist
(1993) found mentoring relationships had the greatest impact on academic and social
integration and a significant impact on student retention. Life on campus and extra curricular
activities appear to enhance student integration (Christie & Dinham, 1990). Other relevant
studies include Astin (1993), Tinto (1995), Kuh (1993, 1995), Astin (1993) (for counselling,
support services), Nordquist (1993), Braxton et al. (1995) and Eaton & Bean (1995).
2.3.17 Teaching/Pedagogy
The level of student satisfaction with the teaching and learning activities provided by the
institution has been found to predict persistence, both indirectly by Bean (1985) and directly
by West et al. (1986) (where withdrawers cited little encouragement or enthusiasm) and by
Abbott-Chapman et al. (1992). The latter’s sample of withdrawers ranked this factor as the
fourth most important reason, also citing uncaring and uninterested teaching staff, an
unsuccessful or inadequately supportive tutoring system, large and impersonal classes, and
poor facilities. Important aspects of teacher behaviour were identified by Care (1995) in a
qualitative Canadian study of distance education nurses. Elliott’s (1992) interviews identify a
link between behaviour of faculty and student persistence.
Persistence is slightly higher and performance better for first-year students in learning
communities than in traditional classes. Collaborative learning has been discussed by Tinto

Improving the Retention of First year Students Page 42
(1993), Tinto & Love (1995), and ‘freshman interest groups’ by Tinto & Goodsell (1993,
1994), Tinto & Russo (1994), Tinto et al. (1994), Tinto (1995).
Douglas and Suloch (1995) suggested their results provide some basis to evaluate the
effectiveness of methods of teaching. Their results support the importance of homework, and
indicate that homework and class attendance are similar in production of good grades. In
surveys of economics education, Siegfreid and Fels (1979) found that class size and textbooks
are not significant for performance, and Siegfried and Walstead (1990) found that a good
match between students’ learning style and instructors’ teaching style had positive effects, but
both found that having a graduate student instructor was not relevant. Tay (1994), in a
relatively controlled experimental environment, found that effects relating to the type of
instructor (graduate assistant, tutor, lecturer, foreigners) were significant in performance for
Economics in Singapore, and suggests that the contrary US findings of Watts and Lynch
(1989) resulted from language ability, not cultural effects.
2.4 Effective interventions
There is no shortage of recommendations for interventions aimed at improving retention.
Lists of proposed interventions exist in many reports (e.g. Martinez and Munday, 1998;
Pargetter, et al, 1998; Martinez, 2001; McInnis et al, 2000; Krause, et al, 2005). An abbreviated
list provided by Martinez (2001) includes the following:
• improving advisory services
• recruiting with integrity
• paying particular attention to the early stages of courses
• tutoring which is focused on student progress
• monitoring and follow up of poor attendance
• early identification of under-performing students or students who are ‘at risk’
• early diagnosis of student requirements for basic skills and provision of appropriate
support
• the development of a curriculum framework appropriate for a college’s intended
students
• mechanisms to maintain or improve student motivation including parental
involvement, peer support and prizes and ceremonies
Improving the Retention of First year Students Page 43
• target setting allied with formative assessment and feedback
• improvements to teaching.
At the same time, Martinez (2001) observes, “there are no ‘magic bullets’, ‘single solutions’,
‘one best way’ or ‘golden rules’”.
What is certain is that reduction in attrition requires a co-ordinated university-wide approach.
Tinto provides the following three principles for effective retention programs (Tinto, 1993):
1. Effective retention programs are committed to the students they serve. They put
student welfare ahead of institutional goals;
2. Effective retention programs are first and foremost committed to the education of
all, not just some, of their students; and
3. Effective retention programs are committed to the development of supportive
social and educational communities in which all students are integrated as competent
members.
Similarly, Braxton and Hirschy (2005) propose the following general guidelines:
1. College and university administrators and faculty members should embrace a
commitment to safeguarding the welfare of the student and
2. The decisions and day-to-day actions of college and university administrators and
individual faculty members must resonate with the missions, goals, and values
espoused by their college or university.
Policy settings that focus on developing an institutional commitment to not only treating
students with respect but also engaging them in university communities are important. This, as
Braxton and Hirschy (2005) make clear, applies to both general and teaching staff. Tinto, too,
advocates an integrated university-wide approach and is dismissive of the “add-a-course” or
“bolt-on” approach, such as introducing a single First Year Seminar as an elective subject/unit
for first year students. However, he places particular emphasis on building student
engagement into classrooms by the use of collaborative learning strategies such as problem-
based learning (Tinto, 2003). This is particularly important, as Braxton and Hirschy (2005)

Improving the Retention of First year Students Page 44
point out, at commuting institutions, where students are typically only on campus for classes
or to access specialised facilities.
While comprehensive retention programs guided by an overarching policy will include the
provision of a range of support services, such as general orientation programs, student
counselling and financial assistance, it is what happens in the classroom that is likely to have
most impact on student retention in commuting institutions. In broad terms, the challenge is
for teachers to make the most of relatively brief periods of face-to-face contact with students
on campus by building a sense of community in these face-to-face sessions that can then be
reinforced in online activity between classes. At the same time, students need to be provided
with scaffolded support as they develop the skills of independent learning.
The interventions that follow must t be elements within the context of an integrated transition
program rather than as stand-alone interventions.
2.4.1 Peer Mentoring
Structured peer assistance/mentoring, such as in the Supplemental Instruction (SI) or PASS
[Peer Assisted Study Sessions] (Kelly and Gardiner, 1994) model for “historically difficult”
subjects/units, has improves student retention, student progress and degree completion
(Pascarella and Terenzini, 2005). Mentoring is particularly effective for academically under-
prepared students (Arendale, 2005). SI or PASS sessions focus on helping students to master
content while developing effective learning strategies. The sessions are regularly-scheduled,
voluntary, informal review sessions led by a student or a pair of students who have succeeded
in the subject/unit in a previous year. In these collaborative learning sessions, participants
compare notes, discuss readings and prepare for assessment tasks.
In North American universities, peer assistants have many roles, including as “rovers” in
learning commons (University of Guelph, 2005) and as IT assistants (Kuh et al, 2005). There
is evidence not only that peer assistance programs such as SI or PASS can reduce attrition, but
that students who are employed on campus as peer assistants are more likely to persist in their
studies (Astin, 1993). Thus, while paid work is initially associated with increased attrition, paid
work on campus is associated with reduced attrition.
Improving the Retention of First year Students Page 45
2.4.2 Common timetabling of groups/learning communities
In North America the term “learning communities” is used for an approach involving block
timetabling of two or more first year subjects/units so that groups of students can work
together across these subjects/units (Shapiro and Levine 1999). In the US, one subject/unit
may be a basic skills developmental unit (e.g. in writing or mathematics) or the subjects/units
may be thematically linked. Most learning communities involve some team teaching across the
subjects/units involved and have a strong emphasis on collaborative learning. There is
evidence that such approaches in first year have a positive effect on retention into second year
(Pascarella and Terenzini, 2005).
In essence, learning communities aim to reduce student isolation by providing membership of
a relatively small group of students who learn collaboratively across subjects/units. At its
simplest, this approach ensures that students are in the same tutorial group for two or more
subjects and, at its most complex, a cross-disciplinary team of academics teach all of the core
subjects/units in a semester or even an entire academic year around an interdisciplinary theme.
There are resonances here with problem-based learning (PBL), where subjects/units are often
integrated and organised around cross-disciplinary problems.
2.4.3 Developing an online community
One of the key features of the DEEP institutions, identified by the National Survey of
Student Engagement team, was that they focused on developing an online community as a
means for strengthening student engagement with the university (Kuh et al, 2005).
Universities such as George Mason University in Washington, which has over 50% transfer
(articulating) students, use technology to extend the sense of community developed in
collaborative learning activities in face-to-face teaching.
As well as supporting collaborative learning, online technology such as WebCT or Blackboard
allows assessment tasks to be submitted electronically. This not only makes assessments more
convenient for commuting students but also allows efficient monitoring of “red flag”
behaviours by teachers and other academic advisers. Kuh et al (2005) stress that developing
online community does not happen simply by providing the technological infrastructure. It
also requires teaching staff and other academic advisers to rethink the links between face-to-
face learning and online learning so that each reinforces the other. User support is particularly

Improving the Retention of First year Students Page 46
important and a number of the DEEP universities make considerable use of student
assistants, who act as helpers and trouble-shooters for both students and teaching staff.
2.4.4 Developmental subjects/units
There is evidence that well-designed developmental (once called remedial) subjects focussing
on the development of basic mathematical and writing skills can reduce attrition and improve
progress for under-prepared students (Pascarella and Terenzini, 2005). Such programs are
more likely to be effective if they are taken in the first year of study, where they can
significantly boost both progress and persistence (Weissman, Silk and Bulakowski, 1997).
Programs specifically designed for academically under-prepared students are common in
North American higher education (especially in community colleges), where they are seen as
playing an important role in supporting access to higher education. In a recent survey of 1,000
US colleges and universities, approximately 80% reported offering developmental maths and
developmental English subjects. Almost all community colleges offered such subjects/units
but over 50% of research universities also reported offering developmental subjects/units
(Barefoot 2003).
2.4.5 Conflicts with Employment:
Perhaps the most striking difference between the 1994 and 1999 responses (DEST, 2004) is
an increased proportion of students who are enrolled full-time and engaged in part-time work,
and an increase in the average number of hours students are employed. There has been a 9 per
cent increase in the proportion of full-time students who work part-time, and a 14 per cent
increase in the mean number of hours they work.
These findings are endorsed by research results described in chapters 5 to 7.
2.5 Summary
The following table 2.4 summarises the key findings from the Literature Review where
significant findings and statements are made. In the following chapters, each element of the
Pathway is described and the results of research outlined, to assess whether student retention
is seen to have improved.
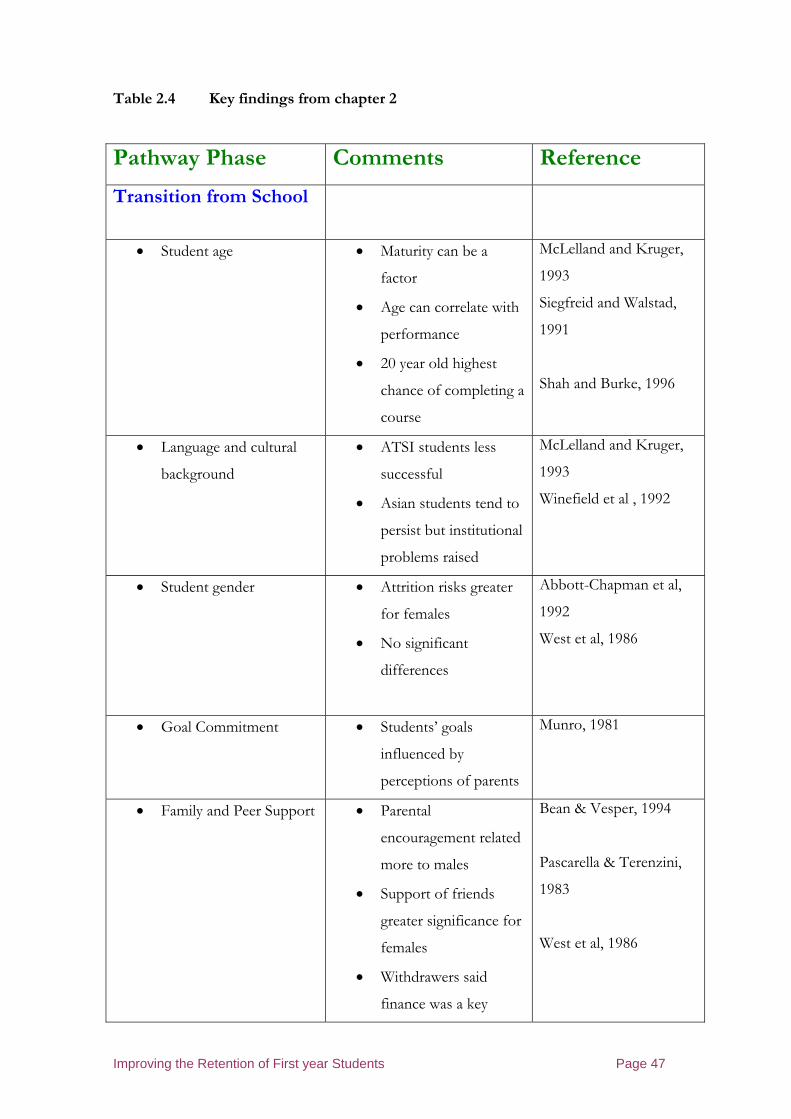
Improving the Retention of First year Students Page 47
Table 2.4 Key findings from chapter 2
Pathway Phase Comments Reference
Transition from School
• Student age • Maturity can be a
factor
• Age can correlate with
performance
• 20 year old highest
chance of completing a
course
McLelland and Kruger,
1993
Siegfreid and Walstad,
1991
Shah and Burke, 1996
• Language and cultural
background
• ATSI students less
successful
• Asian students tend to
persist but institutional
problems raised
McLelland and Kruger,
1993
Winefield et al , 1992
• Student gender • Attrition risks greater
for females
• No significant
differences
Abbott-Chapman et al,
1992
West et al, 1986
• Goal Commitment • Students’ goals
influenced by
perceptions of parents
Munro, 1981
• Family and Peer Support • Parental
encouragement related
more to males
• Support of friends
greater significance for
females
• Withdrawers said
finance was a key
Bean & Vesper, 1994
Pascarella & Terenzini,
1983
West et al, 1986

Improving the Retention of First year Students Page 48
Pathway Phase Comments Reference
factor
• Living at Home or
Residential
• Rural students gave
finance as reason to
decline tertiary place
• Residential study more
appealing to males
Elsworth & Day, 1983
Pascarella & Terenzini,
1982
• Course Expectations • Mismatch between
prior expectations and
actual experiences –
reason for withdrawing
• Inadequate prior
counselling
• Orientation improved
retention
• Academic advising
improved retention
• Perceived lack of
relevance
Abbott-Chapman et al,
1992
West et al, 1986
Glass & Garett, 1995
King, 1992
Abbott-Chapman et al,
1992
• Course specialism • Engineering students
least chance of
completing: Law
students most chance
Shah & Burke, 1996
• Transition from School • Withdrawal due to
unsatisfactory study
skills and pre-requisite
knowledge
• DEST 1999 study
showed students now
see gap between
school and HE less
significant
West et al, 1986
DEST, 1999
Peat et al, 2001
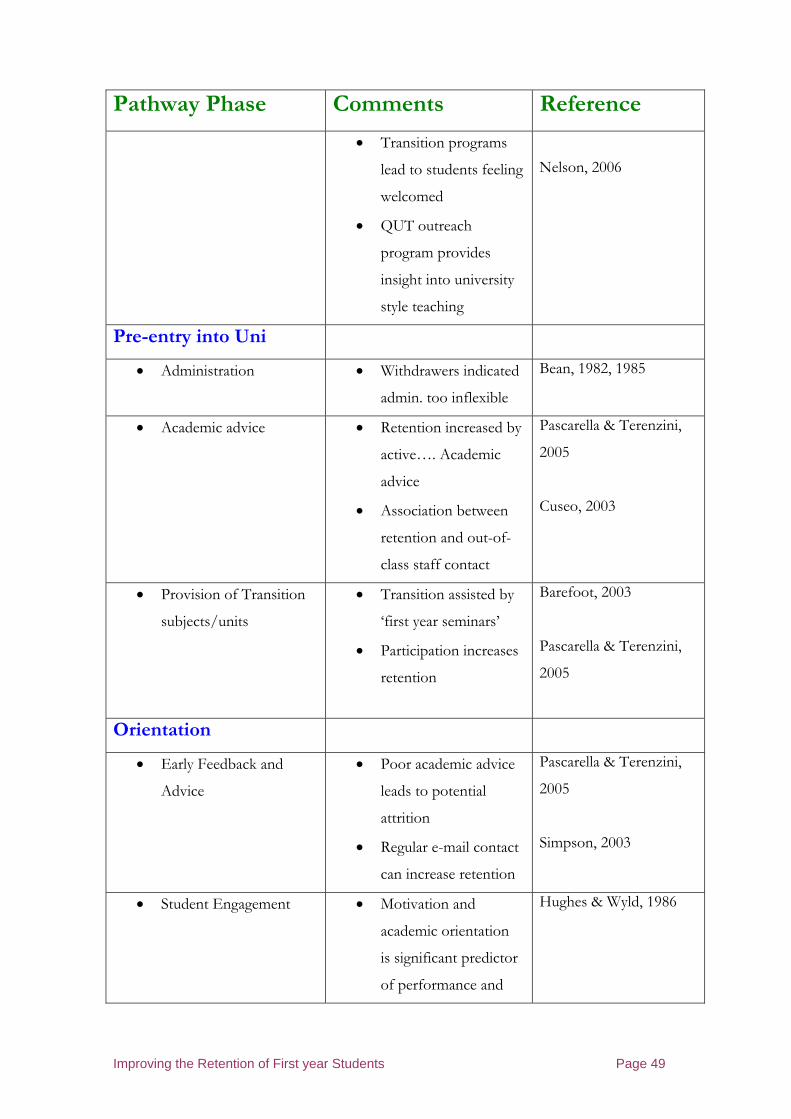
Improving the Retention of First year Students Page 49
Pathway Phase Comments Reference
• Transition programs
lead to students feeling
welcomed
• QUT outreach
program provides
insight into university
style teaching
Nelson, 2006
Pre-entry into Uni
• Administration • Withdrawers indicated
admin. too inflexible
Bean, 1982, 1985
• Academic advice • Retention increased by
active…. Academic
advice
• Association between
retention and out-of-
class staff contact
Pascarella & Terenzini,
2005
Cuseo, 2003
• Provision of Transition
subjects/units
• Transition assisted by
‘first year seminars’
• Participation increases
retention
Barefoot, 2003
Pascarella & Terenzini,
2005
Orientation
• Early Feedback and
Advice
• Poor academic advice
leads to potential
attrition
• Regular e-mail contact
can increase retention
Pascarella & Terenzini,
2005
Simpson, 2003
• Student Engagement • Motivation and
academic orientation
is significant predictor
of performance and
Hughes & Wyld, 1986
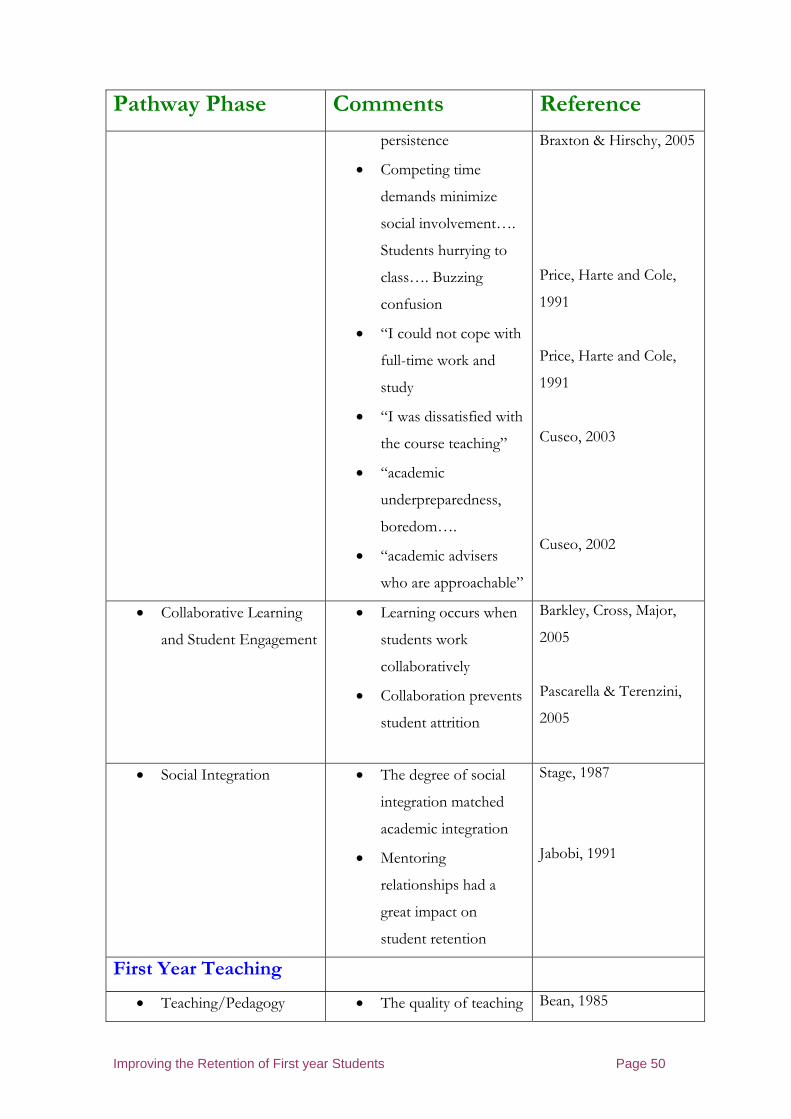
Improving the Retention of First year Students Page 50
Pathway Phase Comments Reference
persistence
• Competing time
demands minimize
social involvement….
Students hurrying to
class…. Buzzing
confusion
• “I could not cope with
full-time work and
study
• “I was dissatisfied with
the course teaching”
• “academic
underpreparedness,
boredom….
• “academic advisers
who are approachable”
Braxton & Hirschy, 2005
Price, Harte and Cole,
1991
Price, Harte and Cole,
1991
Cuseo, 2003
Cuseo, 2002
• Collaborative Learning
and Student Engagement
• Learning occurs when
students work
collaboratively
• Collaboration prevents
student attrition
Barkley, Cross, Major,
2005
Pascarella & Terenzini,
2005
• Social Integration • The degree of social
integration matched
academic integration
• Mentoring
relationships had a
great impact on
student retention
Stage, 1987
Jabobi, 1991
First Year Teaching
• Teaching/Pedagogy • The quality of teaching Bean, 1985

Improving the Retention of First year Students Page 51
Pathway Phase Comments Reference
and learning has been
found to predict
persistence
• Uncaring and
uninteresting staff
……fourth most
important reason for
withdrawal
• Class size and text
books are not
significant for
performance…
students’ learning style
and instructors’
teaching style had
positive effects
Abbott-Chapman et al,
1992
Siegfreid and Walstad,
1990
• Effective Interventions • Improved advisory
services…attention to
early stages of
courses…tutoring on
student progress…
early identification…
• There are no magic
bullets, single
solutions, golden rules
• What is important is a
coordinated university-
wide approach
• What happens in the
classroom is likely to
have the most impact
on student retention
Martinez, 2001
Tinto, 1993
Tinto, 1993
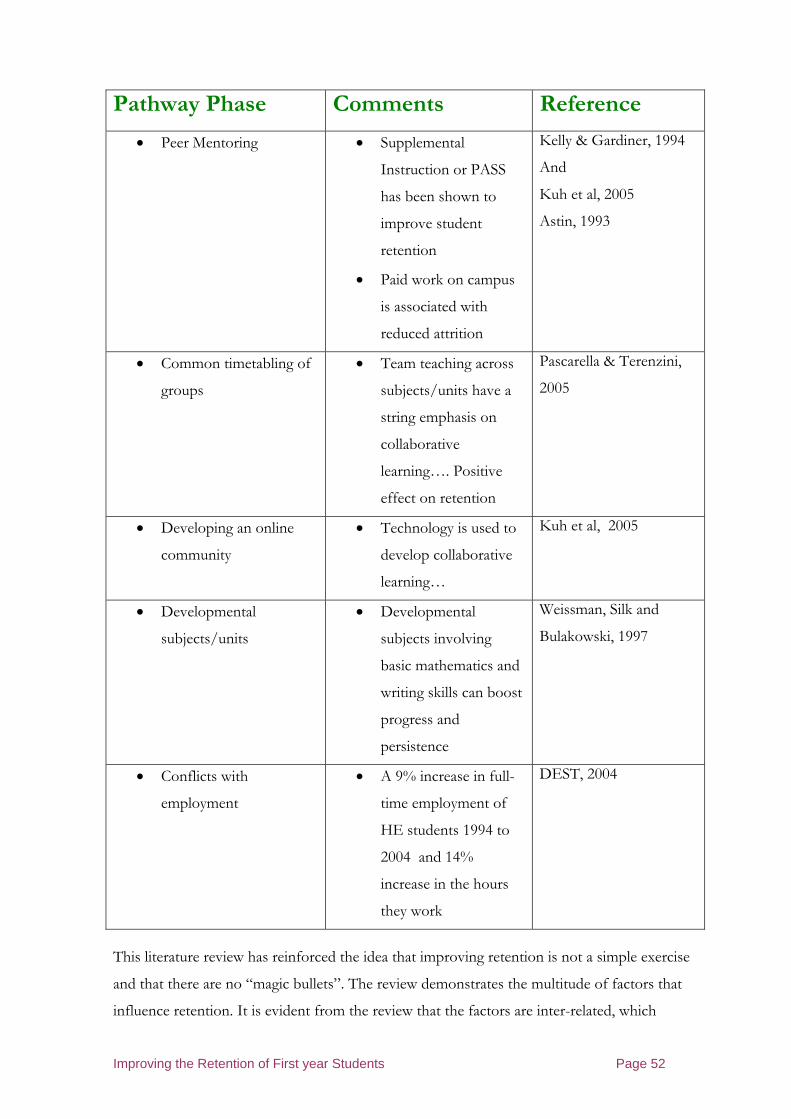
Improving the Retention of First year Students Page 52
Pathway Phase Comments Reference
• Peer Mentoring • Supplemental
Instruction or PASS
has been shown to
improve student
retention
• Paid work on campus
is associated with
reduced attrition
Kelly & Gardiner, 1994
And
Kuh et al, 2005
Astin, 1993
• Common timetabling of
groups
• Team teaching across
subjects/units have a
string emphasis on
collaborative
learning…. Positive
effect on retention
Pascarella & Terenzini,
2005
• Developing an online
community
• Technology is used to
develop collaborative
learning…
Kuh et al, 2005
• Developmental
subjects/units
• Developmental
subjects involving
basic mathematics and
writing skills can boost
progress and
persistence
Weissman, Silk and
Bulakowski, 1997
• Conflicts with
employment
• A 9% increase in full-
time employment of
HE students 1994 to
2004 and 14%
increase in the hours
they work
DEST, 2004
This literature review has reinforced the idea that improving retention is not a simple exercise
and that there are no “magic bullets”. The review demonstrates the multitude of factors that
influence retention. It is evident from the review that the factors are inter-related, which

Improving the Retention of First year Students Page 53
means that separating the influence of factors will be very difficult and likely impossible with
the data set available for the School of Engineering at UWS. The review also flags a warning.
Namely, that an improvement in retention may not be related to an action, at least in a direct
way, and so “proving “the effectiveness of an intervention strategy may be problematic.
Finally, there are several models that related to student retention. This thesis will concentrate
on the Tinto model as it appears to be the one most commonly used and comprehensive. This
does not mean that it is the only available model nor that it is valid in all circumstances.
However, it is a starting point to make sense of the data available from UWS and to provide
some structured analysis to discerning and examining the more important factors in the
answering the question, “what works”.
The following chapter presents details of the analytical methods, the methodology and the
data available for this study.
Improving the Retention of First year Students Page 54
3 Research Methodology and Design
The aim of this chapter is to outline the ways by which the hypothesis and the
research evidence relating to this thesis was collected and tested. The hypotheses are:
• The retention of first year students can be improved and
• Measures can be introduced which can improve retention.
In order to prove the hypotheses, the research
• Collected and analysed UWS and other data
• Identified the student pathway, from High School through to the second year
of study, focussing on
o The transition phase
o The enrolment and orientation phases
o The learning and teaching phase
o The progression phase and
o The student social environment.
• Identified areas where improvements might be made to improve retention
• Used statistical methods to test the hypotheses and generally examine the data.
3.1 A review of the instruments used to test the effectiveness of the methods to
improve first year teaching
The research for this thesis comprised:
1. Data Collection. Initially from the University of Western Sydney where patterns of
student retention were identified and analysed. The data included two significant
surveys conducted, specifically for this thesis, in 2005 and 2006, where student
responses to the enrolment and orientation phases were collected, under university
conditions and within university ethics policy. These surveys included the collection
of data on student background and entry qualifications. Such data were not available
within UWS-conducted surveys. Data was also collected from DEST and from other
institutions and compared with that for UWS. From these data, the significance of
measures to improve student retention was examined and compared with conclusions
identified within the Literature Review.

Improving the Retention of First year Students Page 55
2. Collection and analysis of CEQ data in UWS surveys. The university Office of
Planning and Quality regularly issue CEQ data, as tabulated in Table 3.1 where
qualitative data are stored in areas of ‘good practice’ & ‘those requiring improvement’.
Results at the course, College and University level are included in each College’s
annual course report and were used to analyse student retention in this thesis.
3. Acquisition of papers, reports, analyses and surveys from UWS and other institutions
and organisations where prior research into elements of the hypothesis had taken
place, results published and conclusions drawn.
4. Locally collected data and surveys conducted within the School of Engineering at
UWS where student data was immediately available for analysis: in order to test
elements of the hypothesis and to assess whether local measures had improved student
retention
5. Attendance at conferences where papers and reports on elements of the hypothesis
were presented and published.
3.2 Internal Surveys
Many measures to address student retention have been applied in universities: the literature
review in chapter 2 explored a significant number, many focussing on student background and
the transition of students from school to university. Consequently many surveys are carried
out by universities, including UWS, where the effectiveness of local measures are tested and
decisions made about their long-term future. All the UWS surveys, which include the UWS
conducted surveys as well as the specific surveys of this thesis, were conducted within the
requirements of the Human Research Ethics Policy, formulated by the associated Committee
(HREC). The two surveys conducted for this thesis were approved by the ethics committee.
Each survey was submitted to the committee and approval obtained before issuing to
students. Subsequently, feedback was submitted to this same committee following the survey
analysis.
The surveys (detailed in Table 3.1), some of which were not specifically constructed for this
thesis, provided information that could be used to test the hypothesis that student retention
can be improved. These surveys sought responses to a number of questions on [for the 2005

Improving the Retention of First year Students Page 56
Survey] the enrolment procedures and [for the 2006 survey] student background and the
usefulness of information provided for the students during the orientation program. The
survey questions related to the measures identified by literature and research as discussed in
chapter 2.
3.2.1 The 2005 (Enrolment) and the 2006 (Orientation) UWS Surveys1
The literature review identified the transition phase as being significant in terms of student
satisfaction and preparedness for their studies in the first semester. The 2005(Enrolment)
Survey, directed towards this thesis, was carried out in the second semester 2005, focussing on
ten questions which tested student responses to the quality of information provided when
they first entered the university. Students were also able to comment on their subsequent
experiences in, for example, attendance at tutorials, use of WebCT and peer mentoring, issues
which were encouraged at orientation but perhaps were not adequately reinforced. The
questionnaire is presented in Appendix 3.
The ten questions were:
1. When you first made contact with UWS, were the staff friendly and helpful?
2. Was academic advice given in a friendly and helpful manner? 3. Were you aware of recommended minimum standards in English and mathematics for your course? 4. When you visited UWS for the orientation program, were the staff helpful and friendly? 5. Was the procedure for registering for tutorials and laboratory sessions made clear to you? 6. Was the importance of attending tutorials and laboratory sessions made clear to you? 7. Was the importance of regular participation in WebCT and e-mails made clear to you?
1 * - referred to as “the 2005 Survey” and “the 2006 Survey” respectively, so as to distinguish
them from UWS and other surveys covering a similar period.

Improving the Retention of First year Students Page 57
8. Did you find the peer mentoring useful to you? 9. Did you find the academic mentoring useful to you? 10. Have academic staff, during the pre-enrolment period, been helpful, approachable and friendly to you? [Each answer was graded from VERY POOR [1] , to VERY SATISFIED [6]]
The results of this survey are described later in chapter 4 [Table 4.3] and chapter 5
[Table 5.2].
The second survey, carried out in February 2006, focussed on student opinion in the School
of Engineering and was specifically directed towards this thesis. The questions focussed on
student background, the details of the orientation program [see appendix 5], and the collection
of student data concerning employment and initial views on university study. The issues
included in the 2006 (Orientation) survey tested, at a local level, a number of measures to
improve retention within the transition phase, pre-entry phase and the orientation program.
This survey, unlike the 2005 survey, tested student opinion at the start of their university year.
Students were invited to respond to questions 1 to 12 below:
1 Overall level of satisfaction for the Orientation program 2 Was the Presentation by Head of School useful to you ? 3 Was the Careers and Employment presentation useful to you ? 4 Was the Engineers Australia presentation useful to you ? 5 Was the presentation on Learning Skills useful to you ? 6 Was the Library Services presentation useful to you ? 7 Was the Group Tutorial useful to you ? 8 Did you find it useful to meet your Academic Mentor ? 9 Did you find it useful to meet your Peer Mentor in week 1 ? 10 Was the site tour useful ? 11 Are you satisfied with the instructions for activating your MyUWS account ? 12 Did the Orientation program prepare you for week 1 ?
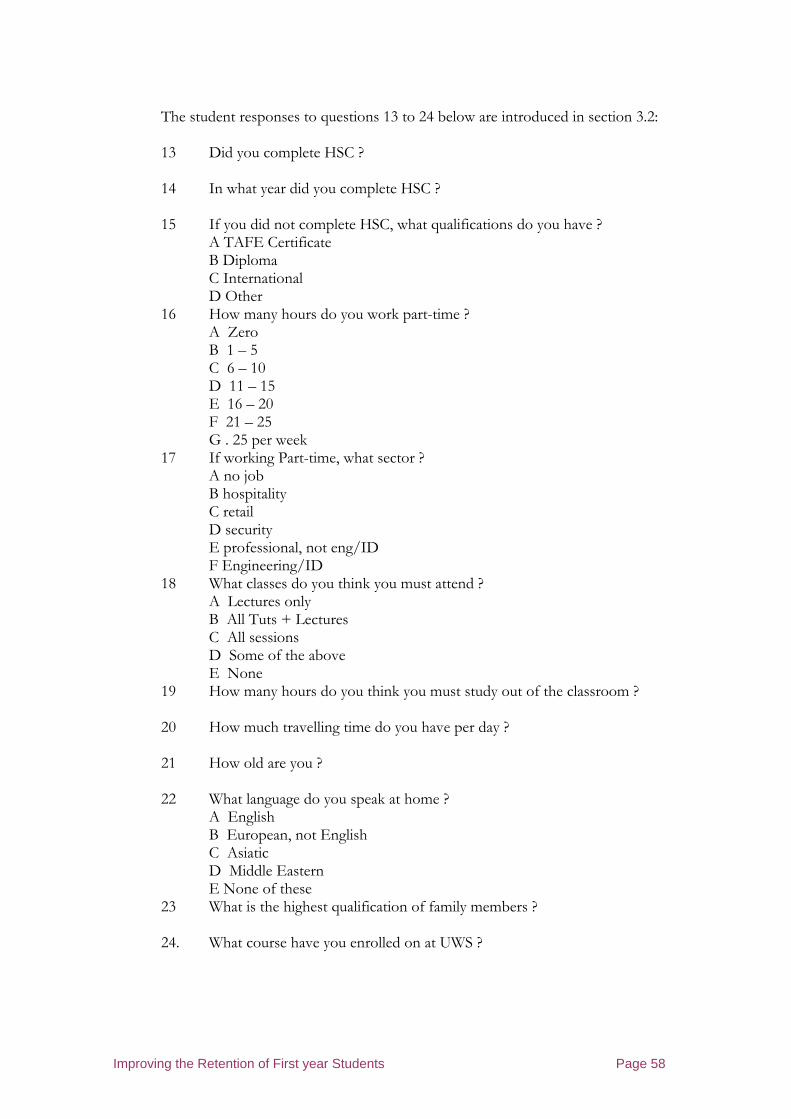
Improving the Retention of First year Students Page 58
The student responses to questions 13 to 24 below are introduced in section 3.2: 13 Did you complete HSC ? 14 In what year did you complete HSC ? 15 If you did not complete HSC, what qualifications do you have ?
A TAFE Certificate B Diploma C International D Other
16 How many hours do you work part-time ? A Zero B 1 – 5 C 6 – 10 D 11 – 15 E 16 – 20 F 21 – 25 G . 25 per week
17 If working Part-time, what sector ? A no job B hospitality C retail D security E professional, not eng/ID F Engineering/ID
18 What classes do you think you must attend ? A Lectures only B All Tuts + Lectures C All sessions D Some of the above E None
19 How many hours do you think you must study out of the classroom ? 20 How much travelling time do you have per day ? 21 How old are you ? 22 What language do you speak at home ?
A English B European, not English C Asiatic D Middle Eastern E None of these
23 What is the highest qualification of family members ?
24. What course have you enrolled on at UWS ?
Improving the Retention of First year Students Page 59
Where appropriate, statistical analyses were undertaken to test the hypotheses which stated
that first year student retention can be improved and that measures could be introduced to
make these improvements.
Additional data for this study was obtained from attending workshops, meetings and training
sessions; reports and data from the School of Engineering; the literature; the author’s
involvement in learning and teaching of first year students; and questionnaires, surveys and
comments in 2005 and 2006 of students and staff.
3.3 Research Participants
Around 80 students responded to the 2005 survey, referred to in the previous section, and
approximately 200 students responded to the 2006 survey out of a cohort of approximately
500. Both surveys were approved by the University Human Research Ethics Committee,
was voluntary, anonymous and the results are compared, in later chapters, with similar
surveys from within UWS and from other universities.
3.4 Materials
The questions contained within the two surveys referred to measures relevant to the
research carried out by Pascarella and Terenzini (1980) where the five institutional scales
are labelled as (1) peer group interactions, (2) interactions with faculty, (3) family concern
for student development and teaching, (4) academic and intellectual development and (5)
institutional and goal commitments. These scales have been proven, by a number of
researchers (e.g.Bers and Smith, 1991; Tenenzini et al., 1981) as reliable with predictive
validity.
Additional questions were included in the surveys in order to enable comparison with other
surveys, such as UWS surveys carried out in the first semester (see Table 5.1), telephone
surveys (see Table 5.4) and the DEST 2004 survey “First year experience” summarised in
Table 6.1.

Improving the Retention of First year Students Page 60
One source of data for this research was the Course Unit Outlines at UWS, School of
Engineering, where the aims and objectives of the Unit are described, together with
assessment criteria and semester timetable.
Student feedback was collected for this chapter and, in particular, for two first year units:
Engineering and Industrial design Practice [300461] and Electrical Fundamentals [300021].
The purpose of such feedback was to survey student learning and teaching in respect of
student satisfaction, progress and quality in the learning situation both within the units listed
above and across the first year curriculum. Direct contact with students was found to be
invaluable as both a lecturer/tutor and as a member of a first year teaching team. Chapter 6
refers to the learning and teaching feedback obtained: chapters 5 refers to associated feedback
obtained from these same students re: their enrolment and orientation experiences and the
overall learning experience in general.
For example, one feature of the first year program, integrated within one of the core units, is
peer mentoring where students in 2nd and subsequent years volunteer to assist the new first
year students and offer general support, based on their own experiences as first year students
in the same course of study. The peer mentor program, in a similar way to other elements of
the Student Pathway, is modified and improved over time, based on feedback and ongoing
issues. The research included an analysis of peer mentoring and its benefits together with
feedback from students on its effectiveness.
To conclude, the main research instruments were
• Data collection – used to compare the performance of the UWS school(s) with other
universities and with other UWS schools
• Date analysis of UWS and other data – to identify a uniformally adopted definition of
student retention/attrition and consequently to compare results between selected
institutions
• The acquisition of papers, reports and surveys from UWS and elsewhere – to identify
measures carried out within universities to address student retention and their
effectiveness: also to measure, where available, research that has been carried out to
relate specific retention measures to associated retention improvement
• The carrying out of locally based student surveys – to collect student personal
information and opinions on their first year experiences
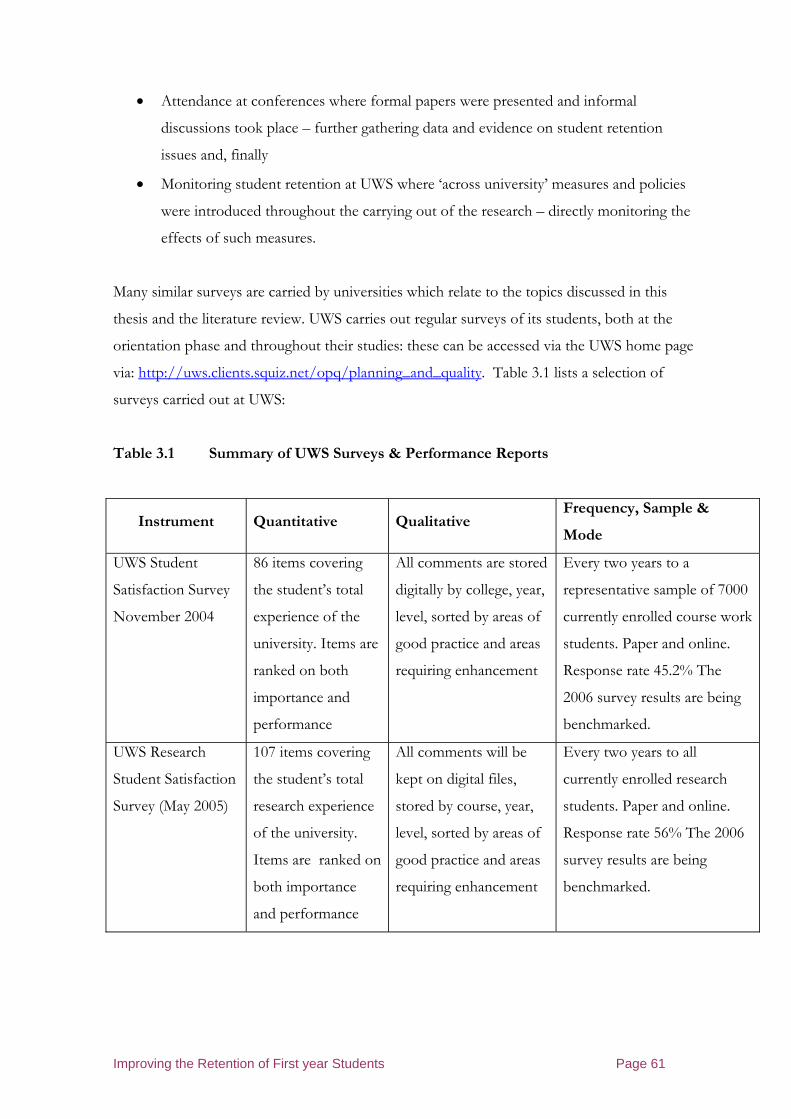
Improving the Retention of First year Students Page 61
• Attendance at conferences where formal papers were presented and informal
discussions took place – further gathering data and evidence on student retention
issues and, finally
• Monitoring student retention at UWS where ‘across university’ measures and policies
were introduced throughout the carrying out of the research – directly monitoring the
effects of such measures.
Many similar surveys are carried by universities which relate to the topics discussed in this
thesis and the literature review. UWS carries out regular surveys of its students, both at the
orientation phase and throughout their studies: these can be accessed via the UWS home page
via: http://uws.clients.squiz.net/opq/planning_and_quality. Table 3.1 lists a selection of
surveys carried out at UWS:
Table 3.1 Summary of UWS Surveys & Performance Reports
Instrument Quantitative Qualitative Frequency, Sample &
Mode
UWS Student
Satisfaction Survey
November 2004
86 items covering
the student’s total
experience of the
university. Items are
ranked on both
importance and
performance
All comments are stored
digitally by college, year,
level, sorted by areas of
good practice and areas
requiring enhancement
Every two years to a
representative sample of 7000
currently enrolled course work
students. Paper and online.
Response rate 45.2% The
2006 survey results are being
benchmarked.
UWS Research
Student Satisfaction
Survey (May 2005)
107 items covering
the student’s total
research experience
of the university.
Items are ranked on
both importance
and performance
All comments will be
kept on digital files,
stored by course, year,
level, sorted by areas of
good practice and areas
requiring enhancement
Every two years to all
currently enrolled research
students. Paper and online.
Response rate 56% The 2006
survey results are being
benchmarked.
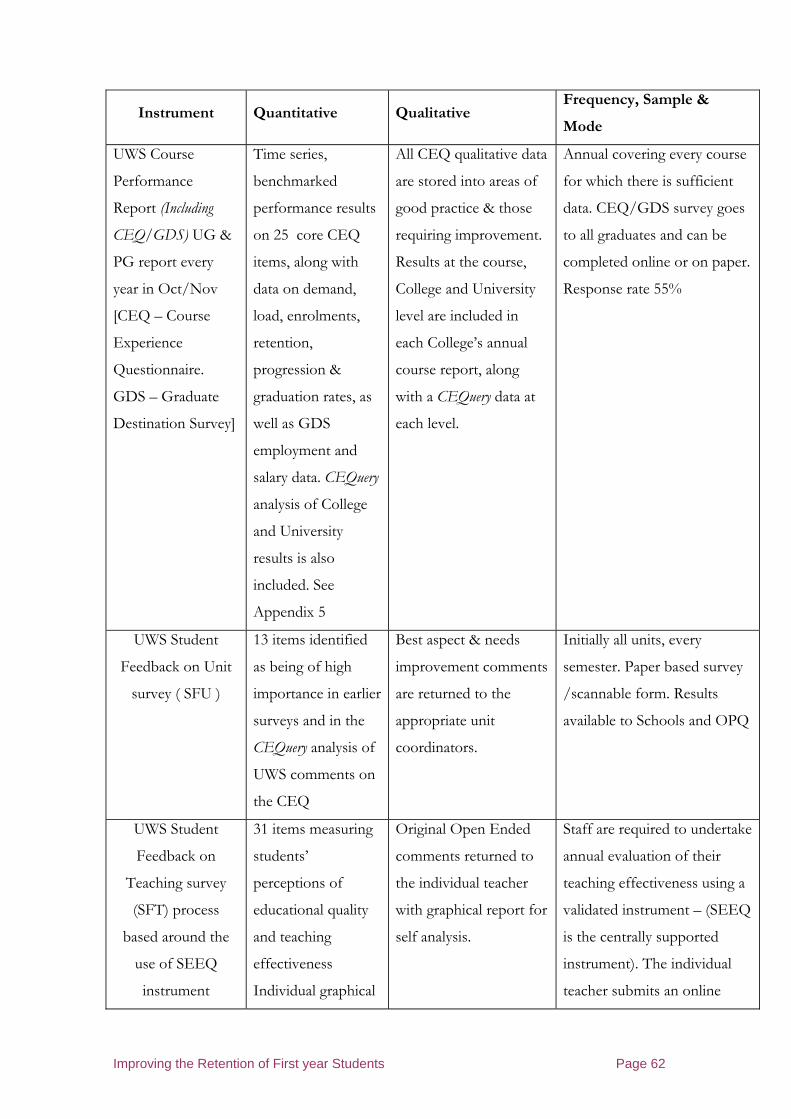
Improving the Retention of First year Students Page 62
Instrument Quantitative Qualitative Frequency, Sample &
Mode
UWS Course
Performance
Report (Including
CEQ/GDS) UG &
PG report every
year in Oct/Nov
[CEQ – Course
Experience
Questionnaire.
GDS – Graduate
Destination Survey]
Time series,
benchmarked
performance results
on 25 core CEQ
items, along with
data on demand,
load, enrolments,
retention,
progression &
graduation rates, as
well as GDS
employment and
salary data. CEQuery
analysis of College
and University
results is also
included. See
Appendix 5
All CEQ qualitative data
are stored into areas of
good practice & those
requiring improvement.
Results at the course,
College and University
level are included in
each College’s annual
course report, along
with a CEQuery data at
each level.
Annual covering every course
for which there is sufficient
data. CEQ/GDS survey goes
to all graduates and can be
completed online or on paper.
Response rate 55%
UWS Student
Feedback on Unit
survey ( SFU )
13 items identified
as being of high
importance in earlier
surveys and in the
CEQuery analysis of
UWS comments on
the CEQ
Best aspect & needs
improvement comments
are returned to the
appropriate unit
coordinators.
Initially all units, every
semester. Paper based survey
/scannable form. Results
available to Schools and OPQ
UWS Student
Feedback on
Teaching survey
(SFT) process
based around the
use of SEEQ
instrument
31 items measuring
students’
perceptions of
educational quality
and teaching
effectiveness
Individual graphical
Original Open Ended
comments returned to
the individual teacher
with graphical report for
self analysis.
Staff are required to undertake
annual evaluation of their
teaching effectiveness using a
validated instrument – (SEEQ
is the centrally supported
instrument). The individual
teacher submits an online
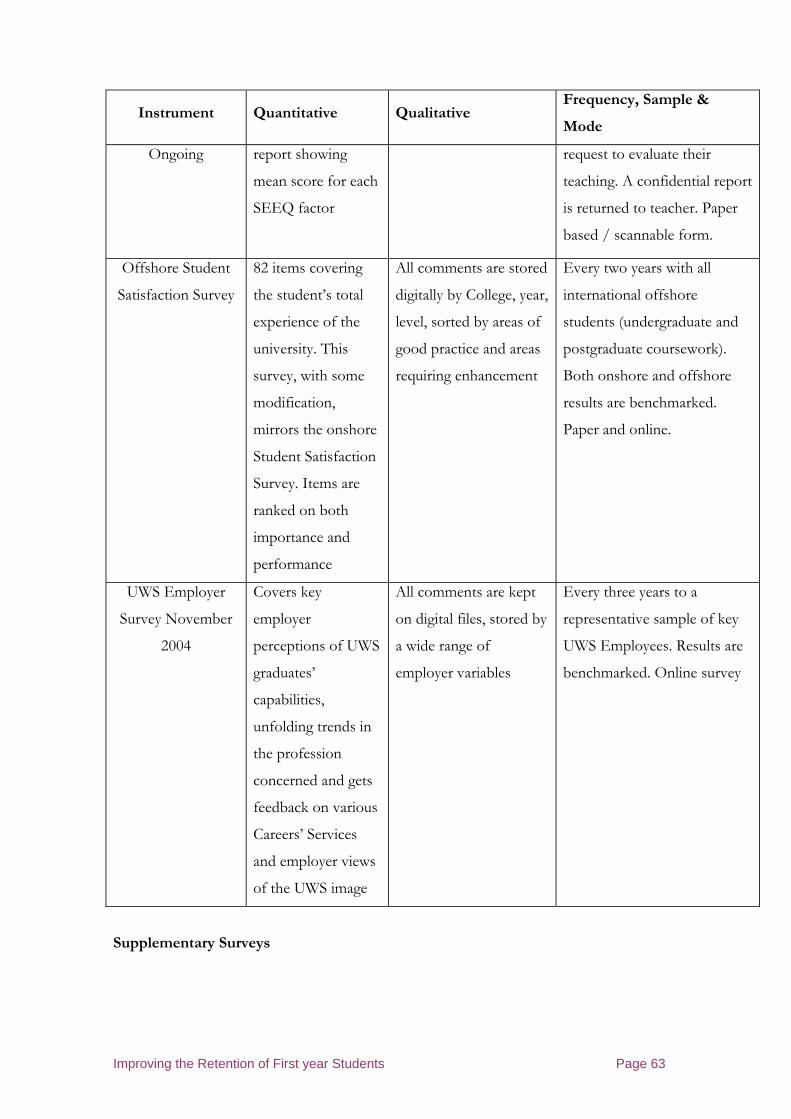
Improving the Retention of First year Students Page 63
Instrument Quantitative Qualitative Frequency, Sample &
Mode
Ongoing report showing
mean score for each
SEEQ factor
request to evaluate their
teaching. A confidential report
is returned to teacher. Paper
based / scannable form.
Offshore Student
Satisfaction Survey
82 items covering
the student’s total
experience of the
university. This
survey, with some
modification,
mirrors the onshore
Student Satisfaction
Survey. Items are
ranked on both
importance and
performance
All comments are stored
digitally by College, year,
level, sorted by areas of
good practice and areas
requiring enhancement
Every two years with all
international offshore
students (undergraduate and
postgraduate coursework).
Both onshore and offshore
results are benchmarked.
Paper and online.
UWS Employer
Survey November
2004
Covers key
employer
perceptions of UWS
graduates’
capabilities,
unfolding trends in
the profession
concerned and gets
feedback on various
Careers’ Services
and employer views
of the UWS image
All comments are kept
on digital files, stored by
a wide range of
employer variables
Every three years to a
representative sample of key
UWS Employees. Results are
benchmarked. Online survey
Supplementary Surveys
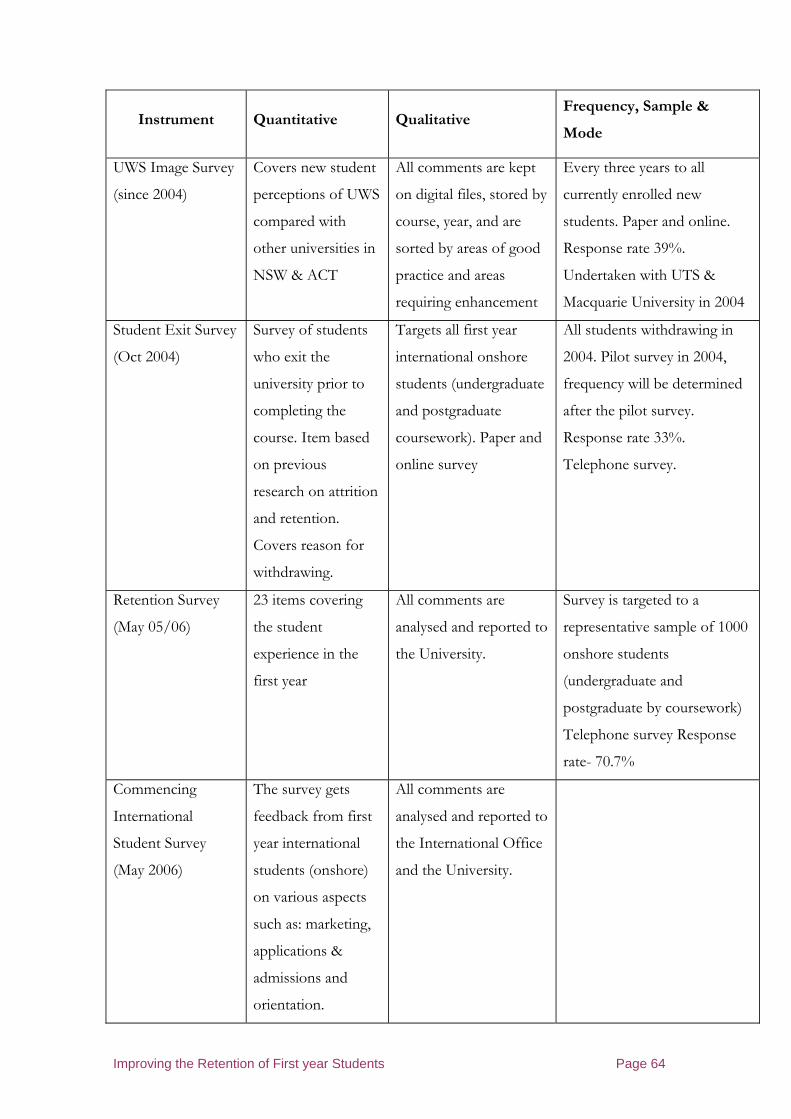
Improving the Retention of First year Students Page 64
Instrument Quantitative Qualitative Frequency, Sample &
Mode
UWS Image Survey
(since 2004)
Covers new student
perceptions of UWS
compared with
other universities in
NSW & ACT
All comments are kept
on digital files, stored by
course, year, and are
sorted by areas of good
practice and areas
requiring enhancement
Every three years to all
currently enrolled new
students. Paper and online.
Response rate 39%.
Undertaken with UTS &
Macquarie University in 2004
Student Exit Survey
(Oct 2004)
Survey of students
who exit the
university prior to
completing the
course. Item based
on previous
research on attrition
and retention.
Covers reason for
withdrawing.
Targets all first year
international onshore
students (undergraduate
and postgraduate
coursework). Paper and
online survey
All students withdrawing in
2004. Pilot survey in 2004,
frequency will be determined
after the pilot survey.
Response rate 33%.
Telephone survey.
Retention Survey
(May 05/06)
23 items covering
the student
experience in the
first year
All comments are
analysed and reported to
the University.
Survey is targeted to a
representative sample of 1000
onshore students
(undergraduate and
postgraduate by coursework)
Telephone survey Response
rate- 70.7%
Commencing
International
Student Survey
(May 2006)
The survey gets
feedback from first
year international
students (onshore)
on various aspects
such as: marketing,
applications &
admissions and
orientation.
All comments are
analysed and reported to
the International Office
and the University.
Improving the Retention of First year Students Page 65
4 Transition to University – Student Retention Issues
4.1 Introduction
“No single First Year Experience – “the” First Year Experience is complex.
The first year experience is not a homogeneous experience but a multiplicity of experiences contingent
on type of institution and student characteristics… Furthermore, the first year experience evolves and
changes both temporally and culturally. Issues facing students when they first arrive are not the same
as issues half way through the first year or towards the end:”
Harvey et al (2006)
This chapter addresses the issues of retention related to the Pathway from High School to
University (Figure 1.2). The focus is the key factors in this Pathway that affect student’s
retention and examining whether actions can be taken in this pathway to reduce attrition.
The literature review raised issues that arise within the transition phase about the influence on
student retention of factors such as student background, family support and expectations.
This chapter tests the effectiveness of measures which address these issues and assesses
whether the measures increase student retention at UWS
4.2 Student personal, family or social issues
For school leavers, the student pathway commences at school via their individual UAI score
and HSC passes. The majority of students carry with them, as they embark on the Pathway,
dreams, expectations and aspirations for a successful career.
The 2006 survey, described in the previous chapter and carried out at the commencement of
the 2006 academic year, assessed the student’s aspirations to attendance in classes prior to the
start of their studies. The survey addressed a number if issues raised in the literature review
such as student age, language and cultural background, family issues and so on. The responses
to the questions are listed in Table 4.1.
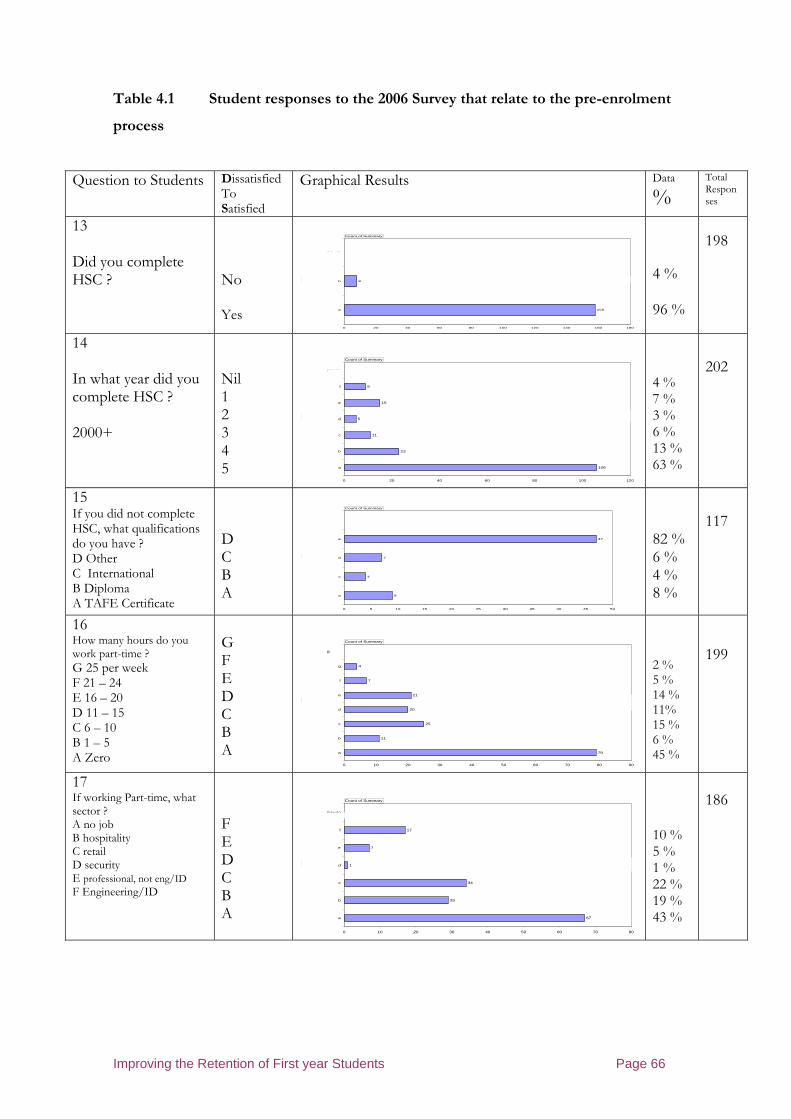
Improving the Retention of First year Students Page 66
Table 4.1 Student responses to the 2006 Survey that relate to the pre-enrolment
process
Question to Students Dissatisfied To Satisfied
Graphical Results Data
%
Total Responses
13 Did you complete HSC ?
No Yes
Background 2a - 166 responses
158
8
0 20 40 60 80 100 120 140 160 180
a
b
(blank)
Count of Summary
Summary
4 % 96 %
198
14 In what year did you complete HSC ? 2000+
Nil 1 2 3 4 5
Background 2 - 169 responses
106
23
11
5
15
9
0 20 40 60 80 100 120
a
b
c
d
e
f
(blank)
Count of Summary
Summary
4 % 7 % 3 % 6 % 13 % 63 %
202
15 If you did not complete HSC, what qualifications do you have ? D Other C International B Diploma A TAFE Certificate
D C B A
Total
9
4
7
47
0 5 10 15 20 25 30 35 40 45 50
a
c
d
e
(blank)
Total
Count of Summary
Summary
82 % 6 % 4 % 8 %
117
16 How many hours do you work part-time ?
G 25 per week F 21 – 24 E 16 – 20 D 11 – 15 C 6 – 10 B 1 – 5 A Zero
G F E D C B A
Background 3 - 167 responses
79
11
25
20
21
7
4
0 10 20 30 40 50 60 70 80 90
a
b
c
d
e
f
g
(blank)
Count of Summary
Summary
2 % 5 % 14 % 11% 15 % 6 % 45 %
199
17 If working Part-time, what sector ? A no job B hospitality C retail D security E professional, not eng/ID F Engineering/ID
F E D C B A
Background 4 - 155 responses
67
29
34
1
7
17
0 10 20 30 40 50 60 70 80
a
b
c
d
e
f
(blank)
Count of Summary
Summary
10 % 5 % 1 % 22 % 19 % 43 %
186
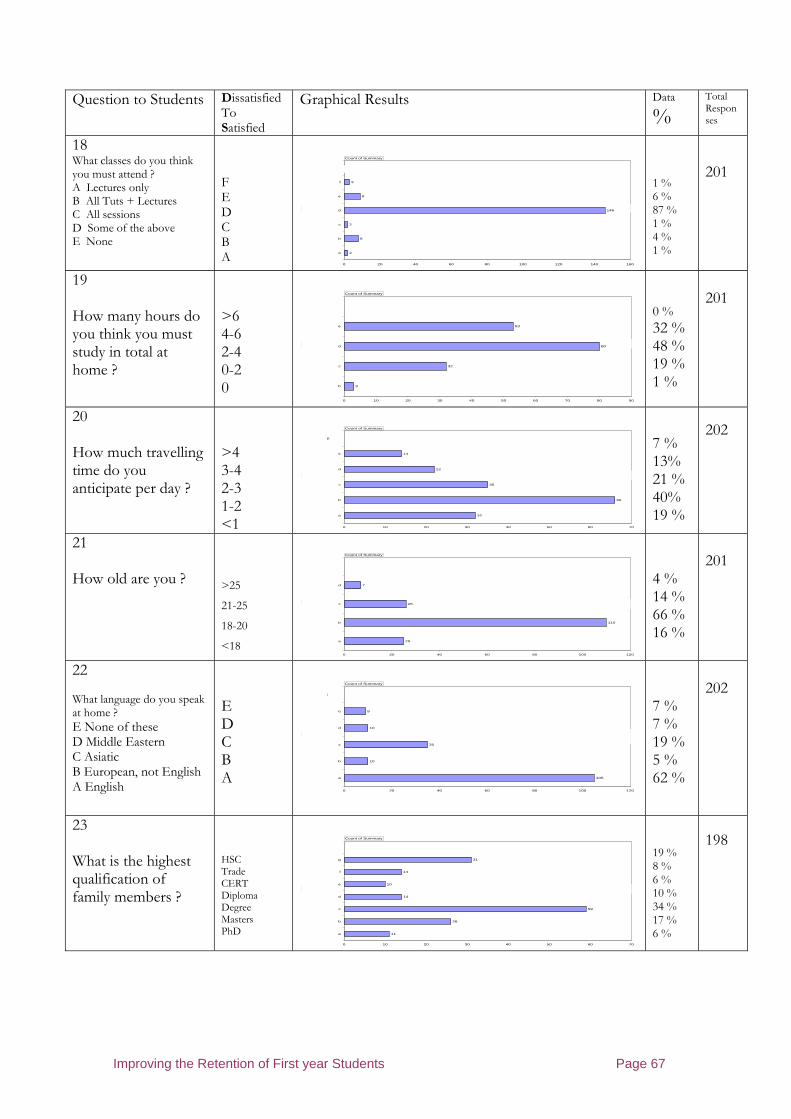
Improving the Retention of First year Students Page 67
Question to Students Dissatisfied To Satisfied
Graphical Results Data
%
Total Responses
18 What classes do you think you must attend ? A Lectures only B All Tuts + Lectures C All sessions D Some of the above E None
F E D C B A
Background 5 - 170 responses
2
8
2
146
9
3
0 20 40 60 80 100 120 140 160
a
b
c
d
e
f
(blank)
Count of Summary
Summary
1 % 6 % 87 % 1 % 4 % 1 %
201
19 How many hours do you think you must study in total at home ?
>6 4-6 2-4 0-2 0
Background 6 - 168 responses
3
32
80
53
0 10 20 30 40 50 60 70 80 90
b
c
d
e
(blank)
Count of Summary
Summary
0 %
32 % 48 % 19 % 1 %
201
20 How much travelling time do you anticipate per day ?
>4 3-4 2-3 1-2 <1
Background 7 - 169 responses
32
66
35
22
14
0 10 20 30 40 50 60 70
a
b
c
d
e
(blank)
Count of Summary
Summary
7 % 13% 21 % 40% 19 %
202
21 How old are you ?
>25
21-25
18-20
<18
Background 8 - 168 responses
25
110
26
7
0 20 40 60 80 100 120
a
b
c
d
(blank)
Count of Summary
Summary
4 % 14 % 66 % 16 %
201
22 What language do you speak at home ?
E None of these D Middle Eastern C Asiatic B European, not English A English
E D C B A
Background 9 - 169 responses
105
10
35
10
9
0 20 40 60 80 100 120
a
b
c
d
e
(blank)
Count of Summary
Summary
7 % 7 % 19 % 5 % 62 %
202
23 What is the highest qualification of family members ?
HSC Trade CERT Diploma Degree Masters PhD
Background 10 - 165 responses
11
26
59
14
10
14
31
0 10 20 30 40 50 60 70
a
b
c
d
e
f
g
(blank)
Count of Summary
Summary
19 % 8 % 6 % 10 % 34 % 17 % 6 %
198

Improving the Retention of First year Students Page 68
Question to Students Dissatisfied To Satisfied
Graphical Results Data
%
Total Responses
24 What course have you enrolled on at UWS ?
Other
D& T
BID
BEng
Background 11 - 170 responses
107
38
20
5
0 20 40 60 80 100 120
a
b
c
d
(blank)
Count of Summary
Summary
2.5 % 12 % 22.5%
63 %
205
Comparing these results with the literature review,
• the predominant age of the surveyed students was 18 to 20 years who, it is suggested
in the research (chapter 2, section 2.3), have the highest chance of completion. In this
cohort, the number aged over 25 is low at 4% which, it is claimed, correlates with
better performance.
• 62% of the cohort speak English at home but research infers (chapter 2, section 2.3 )
that, of the remainder, the 19% Asiatic students are more committed
• Research suggests that parental support influences goal commitment (chapter 2,
section 2.3) – over 70% of the cohort had parents with a higher education
qualification and so is encouraging for the surveyed students
• Travelling time is significant with 81 % travelling more than one hour per day: the
majority living at home; albeit in areas away from the UWS Kingswood campus.
Residential accommodation is available but is limited to the 19% with minimal travel
• The course expectations are influenced, according to research, by prior qualifications.
The survey identified only 40% students entering UWS solely with Australian HSC
qualifications and 58% with additional or alternative qualifications.
• In terms of student engagement, 55% student work part-time [2006 figure] which
greatly influences student engagement which, the research states, introduces a conflict
between the time available for effective study, work and socialising
• Social integration of students is also influenced by the conflict between study and
work, full or part-time
• While the influence of staff on the pre-enrolling student is evident there is no data to
verify whether attempts to improve these first contacts have been successful in
improving retention.
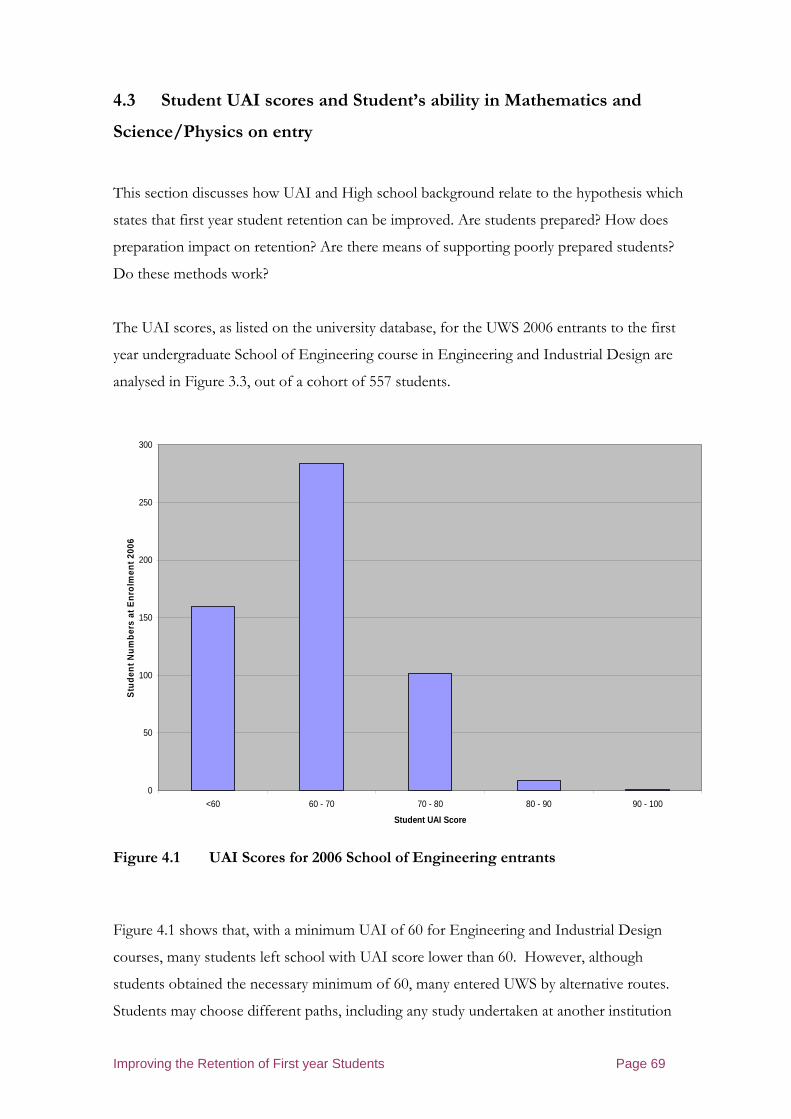
Improving the Retention of First year Students Page 69
4.3 Student UAI scores and Student’s ability in Mathematics and
Science/Physics on entry
This section discusses how UAI and High school background relate to the hypothesis which
states that first year student retention can be improved. Are students prepared? How does
preparation impact on retention? Are there means of supporting poorly prepared students?
Do these methods work?
The UAI scores, as listed on the university database, for the UWS 2006 entrants to the first
year undergraduate School of Engineering course in Engineering and Industrial Design are
analysed in Figure 3.3, out of a cohort of 557 students.
0
50
100
150
200
250
300
<60 60 - 70 70 - 80 80 - 90 90 - 100
Student UAI Score
Stu
dent
Num
bers
at E
nrol
men
t 200
6
Figure 4.1 UAI Scores for 2006 School of Engineering entrants
Figure 4.1 shows that, with a minimum UAI of 60 for Engineering and Industrial Design
courses, many students left school with UAI score lower than 60. However, although
students obtained the necessary minimum of 60, many entered UWS by alternative routes.
Students may choose different paths, including any study undertaken at another institution

Improving the Retention of First year Students Page 70
(TAFE, private colleges, or other universities), to improve their competitiveness for entry to
UWS or to achieve academic credit/advanced standing in recognition of prior learning.
A low UAI score and low attainment in HSC mathematics subjects have a significant effect on
the retention of students in the School of Engineering as concluded in the McFarlane report
described below. The Bachelor of Engineering course, for example, contains mathematics
units in semesters 1 and 2 which are studied alongside technical units where the mathematics
is applied. As a result, many students experience difficulties or are discouraged at an early stage
in the degree studies which can prompt them to consider withdrawing or, if they continue to
the examinations, they fail in mathematics units and achieve poor results or fail the technical
units.
A report “An Analysis of Autumn 2005 Mathematics for Engineers 1 Results” described the
significance of UAI score to the progress of first year students in their first semester in the
School of Engineering in 2005. The report is included in Appendix 6 and the author, Assoc.
Prof. John MacFarlane, states that, for all groups other than ‘2U only’ [those who entered with
two HSC passes in Mathematics] ‘the UAI score is as good a predictor as the HSC Maths
score(s) for this groups. The exercise analysed the HSC mathematics qualifications of students
on entry, along with their UAI score, and compared this statistically with their performance in
the first year Mathematics for Engineers 1 unit; referred to again in the next section. Of the 70
students who entered with 3U [HSC passes in three Mathematics subjects], the 2005 figures
show the following relationship with their UAI score:
Pass grade in UAI Score on entry
Mathematics for Engineers 1 60-69 70-79 80-89 90-100
High Distinction 3 6 1 2
Distinction 2 5
Credit 6 4
Pass 12 10
Fail 12 7
Students with a low UAI score and low attainment in mathematics, although admitted to the
degree courses, are less likely, as identified in the literature review, to

Improving the Retention of First year Students Page 71
• meet their course expectations due to difficulties coping with associated subject matter; as
supported by the 2005 report described above
• seek appropriate academic advice, counselling and learning skills support
• attend all lectures and tutorials and complete all assignments on time and
• continue and successfully complete the first year, many withdrawing before the census
date or failing one or more units in the first semester.
The MacFarlane report illustrates that the UAI score can assist with the prediction of pass
grades in this unit for students with above average HSC entry but 19 of these students failed
in this key unit, despite 7 of these students [10%] entering with UAIs above 70. Such failures
not only require the units to be repeated in subsequent years but place considerable pressure
on associated studies where mathematical skills are applied.
The recommended HSC qualifications for the School of Engineering undergraduate courses
are Physics with Mathematics Extension 1 or Mathematics Extension 2. The “assumed
knowledge” is mathematics and two units of science, with two units of English. In 2006 only
17% of the student cohort complied with these requirements.
The 2005 analysis referred to in the previous section and in Appendix 6 concluded that “the
3U score looks to be the best predictor from among the HSC Maths results” with an element
of ‘background error’ due to adjustment to uni and overall effort in Mathematics. The
commentary in Appendix 6 shows that “The results in Maths for Engineers tend to decline
as the level of HSC Mathematics drops. Of the 61 students who studied 3-unit Maths at
the HSC, 22 received a result in Band 1. Of these 22, only 2 achieved Band 5 or better in
2-Unit Maths and 12 of the 22 (55%) failed Maths for Engineers 1.”
MacFarlane (2005) suggests a ‘rule of thumb’ model to predict the Mathematics for
Engineers 1 raw mark from the HSC scores, where 3U students should succeed; 2U
students need to work hard to pass; and concluded in his report “General Mathematics
students do not really stand a chance of passing and should enter via an alternative
route”.
The 2006 Survey, referred to in section 3.2, asked students to list their full range of HSC
passes on entry to UWS. The spread of HSC passes for students qualifying in High School in
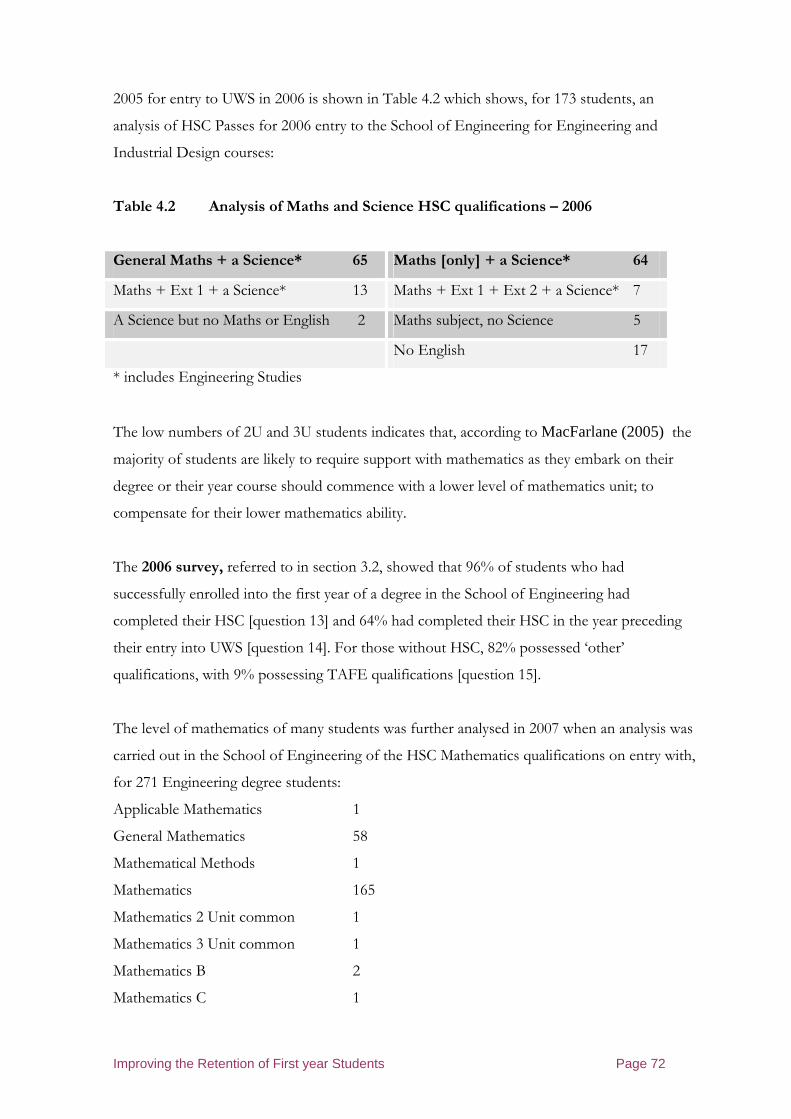
Improving the Retention of First year Students Page 72
2005 for entry to UWS in 2006 is shown in Table 4.2 which shows, for 173 students, an
analysis of HSC Passes for 2006 entry to the School of Engineering for Engineering and
Industrial Design courses:
Table 4.2 Analysis of Maths and Science HSC qualifications – 2006
General Maths + a Science* 65 Maths [only] + a Science* 64
Maths + Ext 1 + a Science* 13 Maths + Ext 1 + Ext 2 + a Science* 7
A Science but no Maths or English 2 Maths subject, no Science 5
No English 17
* includes Engineering Studies
The low numbers of 2U and 3U students indicates that, according to MacFarlane (2005) the
majority of students are likely to require support with mathematics as they embark on their
degree or their year course should commence with a lower level of mathematics unit; to
compensate for their lower mathematics ability.
The 2006 survey, referred to in section 3.2, showed that 96% of students who had
successfully enrolled into the first year of a degree in the School of Engineering had
completed their HSC [question 13] and 64% had completed their HSC in the year preceding
their entry into UWS [question 14]. For those without HSC, 82% possessed ‘other’
qualifications, with 9% possessing TAFE qualifications [question 15].
The level of mathematics of many students was further analysed in 2007 when an analysis was
carried out in the School of Engineering of the HSC Mathematics qualifications on entry with,
for 271 Engineering degree students:
Applicable Mathematics 1
General Mathematics 58
Mathematical Methods 1
Mathematics 165
Mathematics 2 Unit common 1
Mathematics 3 Unit common 1
Mathematics B 2
Mathematics C 1

Improving the Retention of First year Students Page 73
Mathematics Extension 1 47
Mathematics Extension 2 4
Specialist Mathematics 1
All students with Mathematics Extension 1 or 2 entered with two HSC passes [2U as used in
the 2005 analysis], the majority entering with one HSC pass; but 27 entered with no
mathematics qualification.
The conclusion of the McFarlane report (Appendix 6) was
“3U students should be quite OK (as long as their 3U HSC performance was satisfactory, i.e. Band 2 or better); 2U students need to work hard to pass. Students below Band 3 should not be moving straight into Maths for Engineers 1 (failure rate for this group is 80%); General Maths students also do not really stand a chance of passing (failure rate also 80%) and should also not be moving straight into Maths for Engineers 1.”
Consequently, if the general level of Mathematics is low:
(a) additional learning support is suggested for those without 2U or 3U Mathematics prior
to entry and during the first semester;
(b) the routing of many students to a ‘lower level’ mathematical first semester unit is
recommended, such as Foundations of Mathematics, rather than direct entry in to
Mathematics for Engineers 1 where, in certain circumstances, this ‘lower level’ unit can be
considered an elective within the degree, and
(c) the integration of all first semester units is suggested so that the mathematical content
progresses in tandem, with newly introduced concepts taught in the mathematics classes
alongside the technical subjects: or
(d) routing students who do not possess the recommended entry requirements to a
Foundation Course such as the 2, 3 or 4-semester course offered by UWS College as
described in Appendix 7 where potential UWS students study:
• Computer Literacy
• Foundations of Business
• Foundations of Science
• Living Skills and

Improving the Retention of First year Students Page 74
• Mathematical Foundations.
There have been no data analyses undertaken at UWS, other than that described above, on
the students who took “remedial “ mathematics programs, so it is not possible to judge
whether such programs, which have been in operation for several years, are successful.
4.4 Choosing a University and Course - Advice and Welcome from
Senior School/College staff
Students meet or talk to academic staff at enrolment or prior to enrolment about issues related
to enrolment and choice of course. Also students meet academic staff on orientation day
where key staff are introduced, where students meet their academic mentor and where
academic staff are available for consultation on a one-to-one basis.
In the 2005 [enrolment] survey of first year students in the School of Engineering [voluntary
to all first year students] students responded to ten questions, previously introduced in section
3.1, with the results listed in Table 3.3. Further questions and responses from the 2005 survey,
relating to the orientation process, are listed in Table 4.3.
Table 4.3 Questionnaire to students October 2005 Question to Students [October 2005]
1 Very Poor
2 Poor
3 4 5 Satisfied
6 Very Satisfied
Total Responses
% scoring 5 and 6
1. When you first made contact with UWS, were staff friendly and helpful ?
2 1 12 20 25 15 75 53
2. Was academic advice given in a friendly and helpful manner ?
2 4 8 21 21 12 68 49
3 Were you aware of recommended minimum standards of English and Mathematics for your course ?
2 3 8 7 26 32 78 74
10 Have Academic staff, during the pre-enrolment
11 23 24 11 3 4 76 9
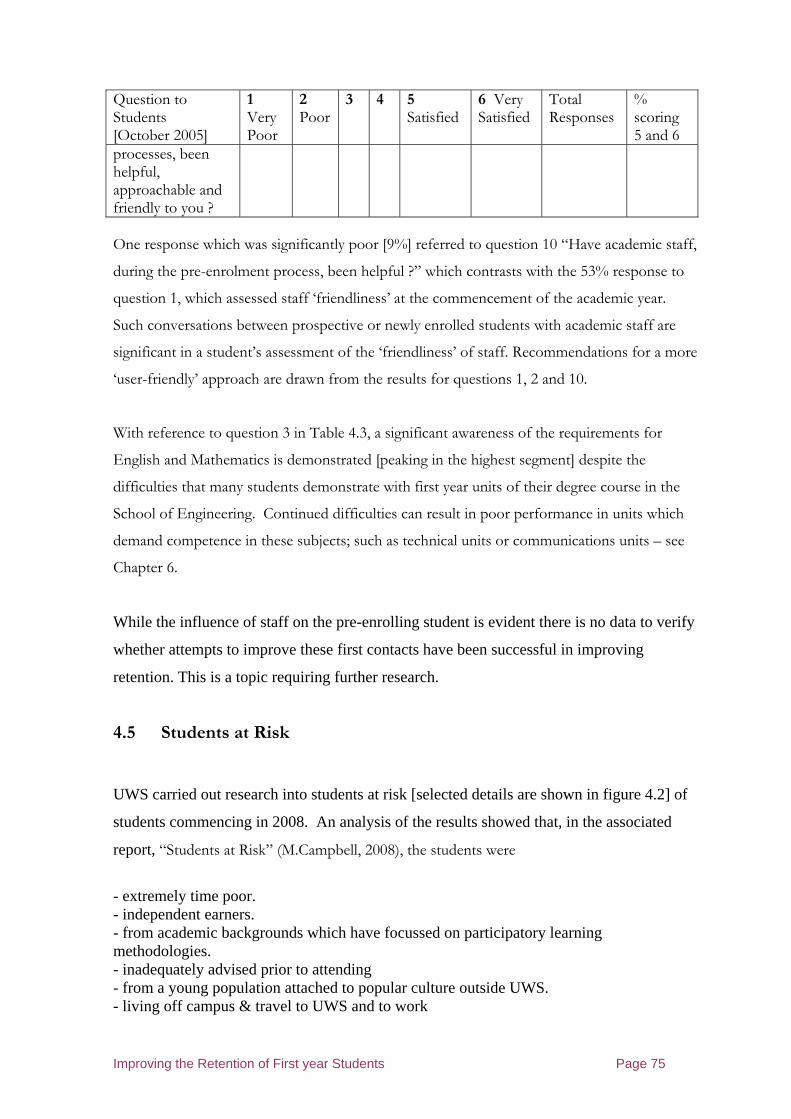
Improving the Retention of First year Students Page 75
Question to Students [October 2005]
1 Very Poor
2 Poor
3 4 5 Satisfied
6 Very Satisfied
Total Responses
% scoring 5 and 6
processes, been helpful, approachable and friendly to you ? One response which was significantly poor [9%] referred to question 10 “Have academic staff,
during the pre-enrolment process, been helpful ?” which contrasts with the 53% response to
question 1, which assessed staff ‘friendliness’ at the commencement of the academic year.
Such conversations between prospective or newly enrolled students with academic staff are
significant in a student’s assessment of the ‘friendliness’ of staff. Recommendations for a more
‘user-friendly’ approach are drawn from the results for questions 1, 2 and 10.
With reference to question 3 in Table 4.3, a significant awareness of the requirements for
English and Mathematics is demonstrated [peaking in the highest segment] despite the
difficulties that many students demonstrate with first year units of their degree course in the
School of Engineering. Continued difficulties can result in poor performance in units which
demand competence in these subjects; such as technical units or communications units – see
Chapter 6.
While the influence of staff on the pre-enrolling student is evident there is no data to verify
whether attempts to improve these first contacts have been successful in improving
retention. This is a topic requiring further research.
4.5 Students at Risk
UWS carried out research into students at risk [selected details are shown in figure 4.2] of
students commencing in 2008. An analysis of the results showed that, in the associated
report, “Students at Risk” (M.Campbell, 2008), the students were
- extremely time poor. - independent earners. - from academic backgrounds which have focussed on participatory learning methodologies. - inadequately advised prior to attending - from a young population attached to popular culture outside UWS. - living off campus & travel to UWS and to work
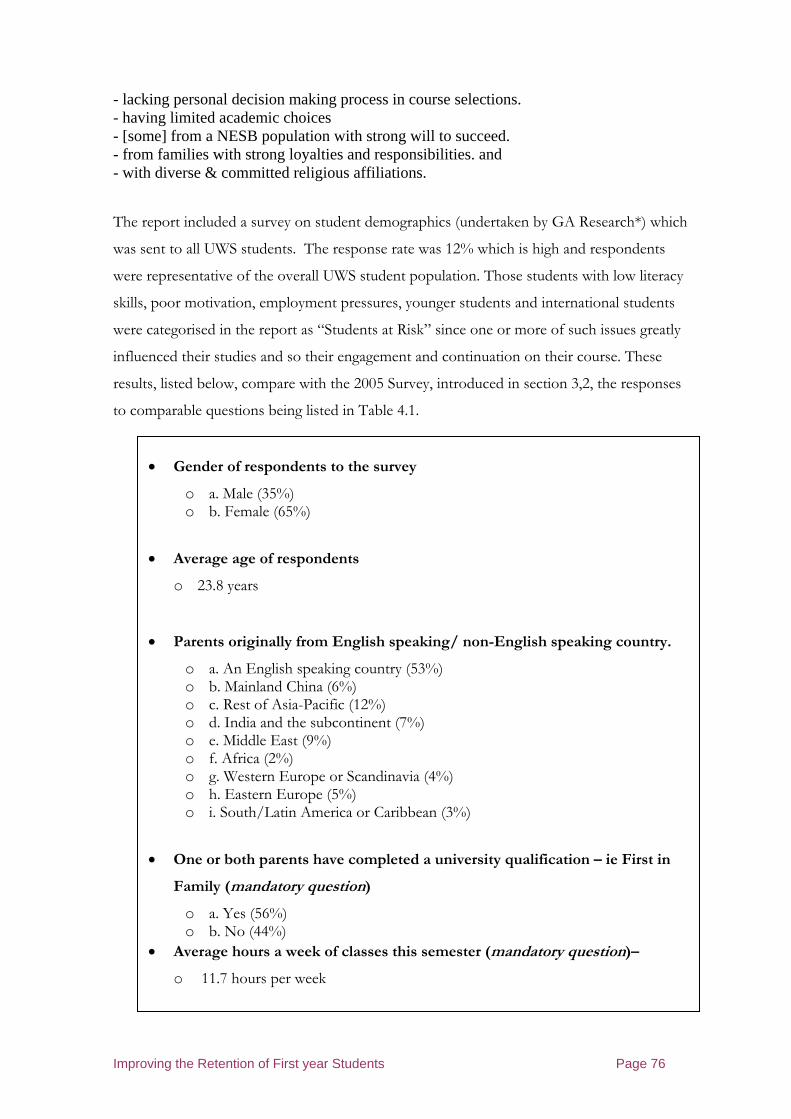
Improving the Retention of First year Students Page 76
- lacking personal decision making process in course selections. - having limited academic choices - [some] from a NESB population with strong will to succeed. - from families with strong loyalties and responsibilities. and - with diverse & committed religious affiliations.
The report included a survey on student demographics (undertaken by GA Research*) which
was sent to all UWS students. The response rate was 12% which is high and respondents
were representative of the overall UWS student population. Those students with low literacy
skills, poor motivation, employment pressures, younger students and international students
were categorised in the report as “Students at Risk” since one or more of such issues greatly
influenced their studies and so their engagement and continuation on their course. These
results, listed below, compare with the 2005 Survey, introduced in section 3,2, the responses
to comparable questions being listed in Table 4.1.
• Gender of respondents to the survey
o a. Male (35%) o b. Female (65%)
• Average age of respondents
o 23.8 years
• Parents originally from English speaking/ non-English speaking country.
o a. An English speaking country (53%) o b. Mainland China (6%) o c. Rest of Asia-Pacific (12%) o d. India and the subcontinent (7%) o e. Middle East (9%) o f. Africa (2%) o g. Western Europe or Scandinavia (4%) o h. Eastern Europe (5%) o i. South/Latin America or Caribbean (3%)
• One or both parents have completed a university qualification – ie First in
Family (mandatory question)
o a. Yes (56%) o b. No (44%)
• Average hours a week of classes this semester (mandatory question)–
o 11.7 hours per week
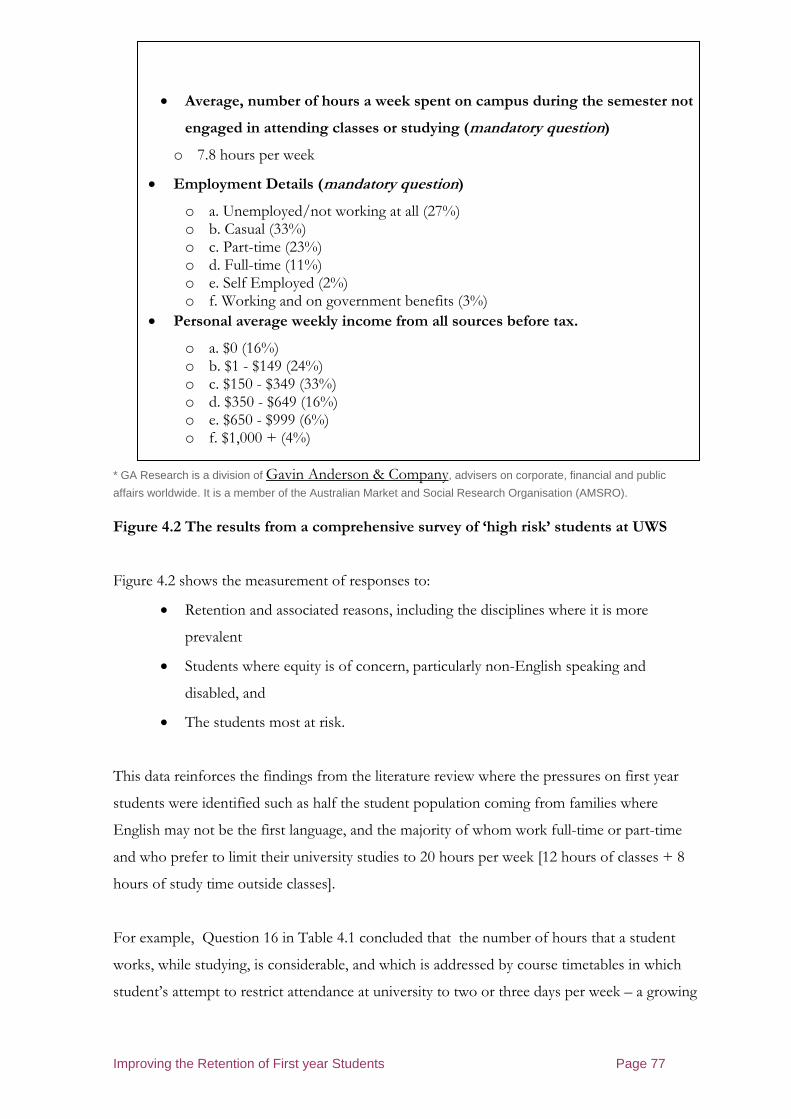
Improving the Retention of First year Students Page 77
• Average, number of hours a week spent on campus during the semester not
engaged in attending classes or studying (mandatory question)
o 7.8 hours per week
• Employment Details (mandatory question)
o a. Unemployed/not working at all (27%) o b. Casual (33%) o c. Part-time (23%) o d. Full-time (11%) o e. Self Employed (2%) o f. Working and on government benefits (3%)
• Personal average weekly income from all sources before tax.
o a. $0 (16%) o b. $1 - $149 (24%) o c. $150 - $349 (33%) o d. $350 - $649 (16%) o e. $650 - $999 (6%) o f. $1,000 + (4%)
* GA Research is a division of Gavin Anderson & Company, advisers on corporate, financial and public
affairs worldwide. It is a member of the Australian Market and Social Research Organisation (AMSRO).
Figure 4.2 The results from a comprehensive survey of ‘high risk’ students at UWS
Figure 4.2 shows the measurement of responses to:
• Retention and associated reasons, including the disciplines where it is more
prevalent
• Students where equity is of concern, particularly non-English speaking and
disabled, and
• The students most at risk.
This data reinforces the findings from the literature review where the pressures on first year
students were identified such as half the student population coming from families where
English may not be the first language, and the majority of whom work full-time or part-time
and who prefer to limit their university studies to 20 hours per week [12 hours of classes + 8
hours of study time outside classes].
For example, Question 16 in Table 4.1 concluded that the number of hours that a student
works, while studying, is considerable, and which is addressed by course timetables in which
student’s attempt to restrict attendance at university to two or three days per week – a growing
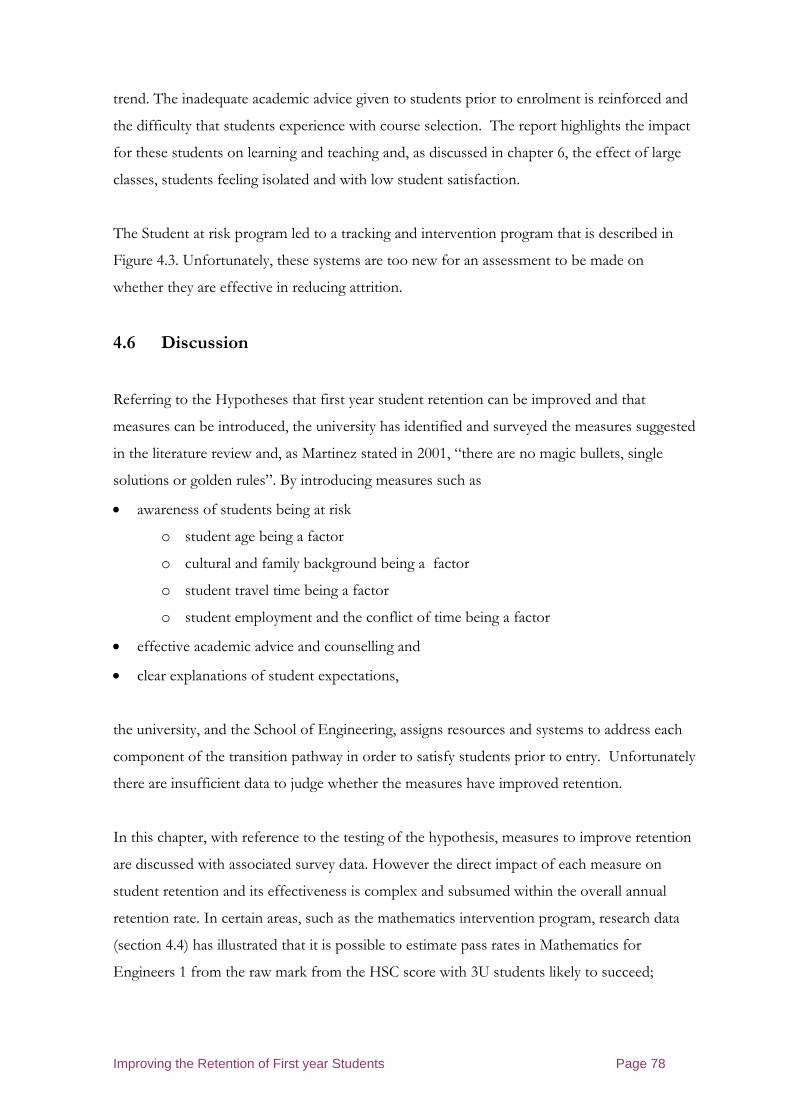
Improving the Retention of First year Students Page 78
trend. The inadequate academic advice given to students prior to enrolment is reinforced and
the difficulty that students experience with course selection. The report highlights the impact
for these students on learning and teaching and, as discussed in chapter 6, the effect of large
classes, students feeling isolated and with low student satisfaction.
The Student at risk program led to a tracking and intervention program that is described in
Figure 4.3. Unfortunately, these systems are too new for an assessment to be made on
whether they are effective in reducing attrition.
4.6 Discussion
Referring to the Hypotheses that first year student retention can be improved and that
measures can be introduced, the university has identified and surveyed the measures suggested
in the literature review and, as Martinez stated in 2001, “there are no magic bullets, single
solutions or golden rules”. By introducing measures such as
• awareness of students being at risk
o student age being a factor
o cultural and family background being a factor
o student travel time being a factor
o student employment and the conflict of time being a factor
• effective academic advice and counselling and
• clear explanations of student expectations,
the university, and the School of Engineering, assigns resources and systems to address each
component of the transition pathway in order to satisfy students prior to entry. Unfortunately
there are insufficient data to judge whether the measures have improved retention.
In this chapter, with reference to the testing of the hypothesis, measures to improve retention
are discussed with associated survey data. However the direct impact of each measure on
student retention and its effectiveness is complex and subsumed within the overall annual
retention rate. In certain areas, such as the mathematics intervention program, research data
(section 4.4) has illustrated that it is possible to estimate pass rates in Mathematics for
Engineers 1 from the raw mark from the HSC score with 3U students likely to succeed;
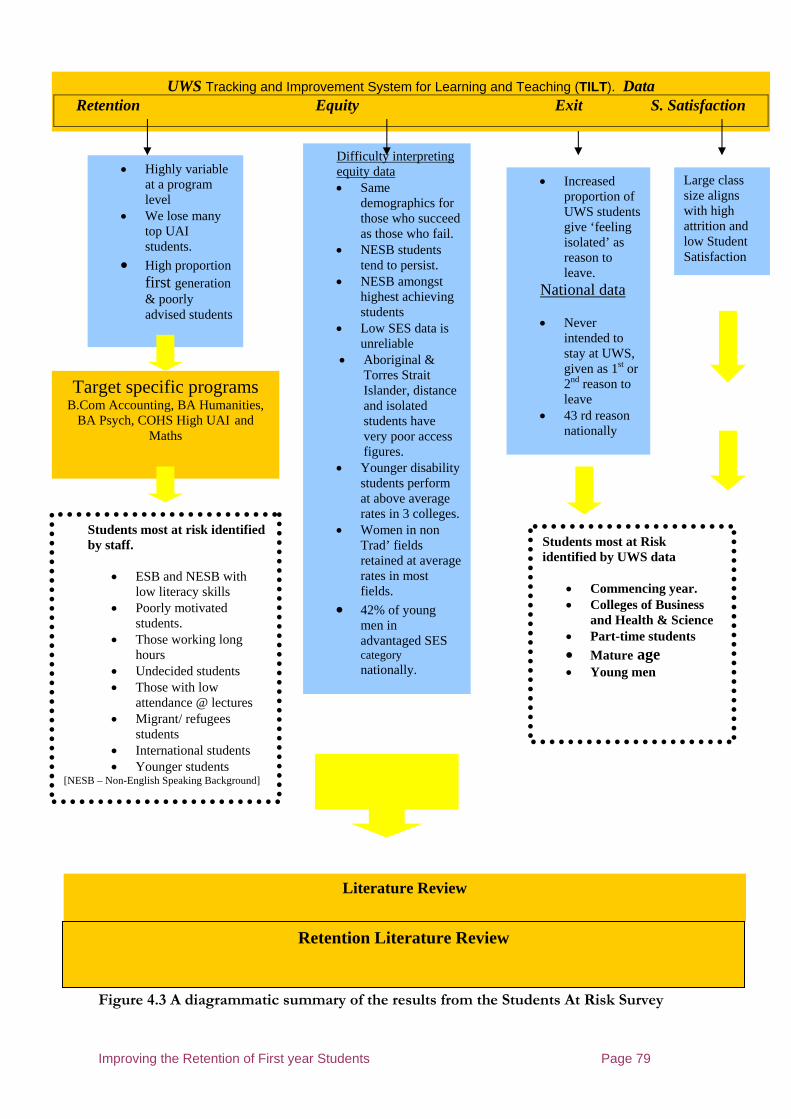
Improving the Retention of First year Students Page 79
Figure 4.2 An Analysis of the Students at Risk results
Figure 4.3 A diagrammatic summary of the results from the Students At Risk Survey
UWS Tracking and Improvement System for Learning and Teaching (TILT). Data Retention Equity Exit S. Satisfaction
• Increased proportion of UWS students give ‘feeling isolated’ as reason to leave.
National data • Never
intended to stay at UWS, given as 1st or 2nd reason to leave • 43 rd reason nationally
Large class size aligns with high attrition and low Student Satisfaction
Students most at risk identified by staff. • ESB and NESB with
low literacy skills • Poorly motivated students. • Those working long hours • Undecided students • Those with low attendance @ lectures • Migrant/ refugees students • International students • Younger students
[NESB – Non-English Speaking Background]
Students most at Risk identified by UWS data
• Commencing year. • Colleges of Business and Health & Science • Part-time students • Mature age
• Young men
Target specific programs B.Com Accounting, BA Humanities,
BA Psych, COHS High UAI and Maths
• Highly variable at a program level • We lose many top UAI students. • High proportion first generation & poorly advised students
Difficulty interpreting equity data • Same
demographics for those who succeed as those who fail. • NESB students tend to persist. • NESB amongst highest achieving students • Low SES data is unreliable • Aboriginal & Torres Strait Islander, distance and isolated students have very poor access figures. • Younger disability students perform at above average rates in 3 colleges. • Women in non Trad’ fields retained at average rates in most fields. • 42% of young men in advantaged SES category nationally.
Literature Review
Retention Literature Review
Improving the Retention of First year Students Page 80
Figure 4.3 An analysis of the UWSUndergraduate population,
Characteristics of underachievers 1. Unclear goal & planning skills 2. Time spent in study, out of class 3. Impact of paid employment 4. Insufficient advice prior to attending. (undecided students) 5. Previous poor academic performance. 6. Living arrangements. 7. Financial issues 8. Difficult family circumstances 9. Personal resilience
Institutional approaches/ to isolation & engagement - Student interaction with faculty members. - Active & collaborative learning. - Enriching Educational experiences. - Supportive campus environment. - High levels of academic challenge.
Best practice engagement initiatives nationally and internationally with non traditional cohorts
UWS Undergraduate population emerges as a non traditional student body. Student profiles: UWS commencing year students - Extremely time poor. - Independent earners. - From academic backgrounds which have focussed on participatory learning methodologies. - Inadequately advised prior to attending - Young population attached to popular culture outside UWS. - Live off campus & travel to UWS and to work - Lack personal decision making process in course selections. - Limited academic choices - NESB population with strong will to succeed. - Strong family loyalties and responsibilities. - Diverse & committed religious affiliations.
Focus needs to be brought to the students who underachieve as well as those who withdraw. The profile of UWS commencing year students is similar to those described in the literature as “non traditional” and suggests that ‘experimenting’ with University as a chosen option can be expected from this population. Students need to be supported through options and choices. A proportion of students must drop out in first year as they make other choices. UWS students do not withdraw prematurely in atypical numbers for the sector in the commencing year but the typical student will need support, committed teaching energy and resources in order to succeed.
Figure 4.4 A summary of the proposed actions for the Students At Risk project
Improving the Retention of First year Students Page 81
2U students needing to work hard to pass; “General Mathematics students do not really
stand a chance of passing and should enter via an alternative route”. Such difficulties
with mathematics contribute to the overall student retention rate but the precise improvement
would require extensive additional research.
In addition to the issues described in this chapter, ongoing changes take place to the academic
environment. These include course structural changes, curriculum changes, staff changes,
administrative structural changes, and changes to student intake qualifications. Whereas some
changes are introduced in order to improve the learning and teaching, some may have the
effect of reducing student satisfaction and success and so it is difficult to untangle the changes
from the actual improvements resulting from intervention to improve retention. In order to
analyse the effect of these and the other measures of this chapter it would be necessary to
instigate a major research project within the School, requiring the full cooperation of all staff
and students while this intervention exercise was carried out.
In the UWS letter offering a place and in the follow-up letter from the School of Engineering,
students are made aware of the need to commit 100% to their studies if they are to succeed
but the offer of advice and support is reinforced at every stage. As a consequence, students
welcome such advice and support, as reported in the surveys analysed in this chapter. Students
At Risk are identified at the Pre-Entry and Orientation phases where additional support of
offered.
The following chapter describes the influences of the ‘institution’ regarding staff interaction, a
supportive environment and information and guidance provided by the university prior to
attending. Chapter 5 also describes how the orientation program can improve the transition of
students and how an institutional holistic approach can effectively minimise the problems
highlighted above. The survey also looked at the UWS student population and identified
comparisons with the general Australian HE population, as in figure 4.3 and listed above.
Such characteristics as high earners, school and family background, levels of pre-entry advice
and diverse backgrounds are significant and concur with the results obtained earlier in this
chapter.
Subsequent chapters address the further phases of the pathway.

Improving the Retention of First year Students Page 82
5 Orientation and Settling In – Student Retention Issues
Enhancing the First Year Experience of our students and easing transition to tertiary study centres around one essential - their engagement as learners in their learning. For our students to engage in their tertiary studies and have a successful first year, they need to:
� feel that they belong to a larger group of students and academics who are committed to learning;
� sense that there is a seamlessness between their structured, timetabled classes and the learning experiences that occur outside the classroom; and
� actively connect to the subject matter of their discipline.
(McInnis, 2003 and Kul et al, 1991)
5.1 Introduction
Many researchers identify the orientation phase as crucial in terms ‘settling in’, becoming
familiar with the new environment and being an independent student on a university degree
(see Chapter 2). This chapter describes the ways by which UWS, the School of Engineering
and other institutions address the outcomes of the research reviewed in chapter 2, and their
effectiveness in improving student retention.
5.2 Arriving at University
Until recently, at UWS, the student’s first exposure to the university campus, staff,
administration, attitude, efficiency, professionalism and other elements were at ‘academic
advising days’ or ‘enrolment day’ . During these “days” students attended for general
introductions to the University, the course and general facilities; followed by paying the fees
and, for many students, registering for selected support such as e-learning computer system
access – an essential tool for all School of Engineering students. Prior to this day, information
was sent to students by post, or students accessed the University web sites. After enrolment, it
was necessary to register online for tutorials and other sessions, and subsequently, in week 0,
to attend for the Orientation Day program before commencement of classes in Week 1. From
2007, students enrol online and so the student’s first visit to the campus is during ‘week 0’ for
Orientation activities, run by either the School and/or the University. As discussed in Chapter

Improving the Retention of First year Students Page 83
4, there are pre-student contacts with the University which influence retention, as examined in
that chapter.
Currently, the university distributes offer letters to all prospective students in early January: the
School follows with a letter with details of orientation, services and expectations. Students are
able to access the e-learning site at an early stage and so initially become familiar with the
online systems before attending the scheduled orientation program in week 0. Settling in has
been extended to weeks prior to week 0 and now continues for several weeks beyond week 0;
along the lines of QUT, RMIT and Deakin, described in section 5.5.
5.3 The Enrolment process
Prior to 2007, enrolment was the first step along the Pathway and so, for many students, this
was their first entry into the university environment and meeting university staff.
Consequently, any delays, errors or lack of a user-friendly reception could be registered by
students negatively. However this time was an opportunity for the orientation process to
commence, albeit alongside the administrative enrolment procedures. With online enrolment,
the student’s first exposure to university procedures is in Week 0 or orientation week.
Comments on the traditional enrolment process were obtained via surveys [one being the
UWS 2005 Telephone Survey referred to elsewhere in this chapter] carried out by UWS and
by questionnaires associated with enrolment. In addition, a Call Centre received applications
and provided information throughout this process. With all forms of enrolment it is essential
that all details and information concerning the University, its services, its support and its
course are easily accessible on the UWS web site.
In 2005, the University Office of Planning and Quality reviewed the UWS 2005 enrolment
process and students were asked to grade their opinions on a number of issues. The results of
this review, set out in Table 5.1, refer to a number of administrative issues that affected
students in the 2005 cohort.
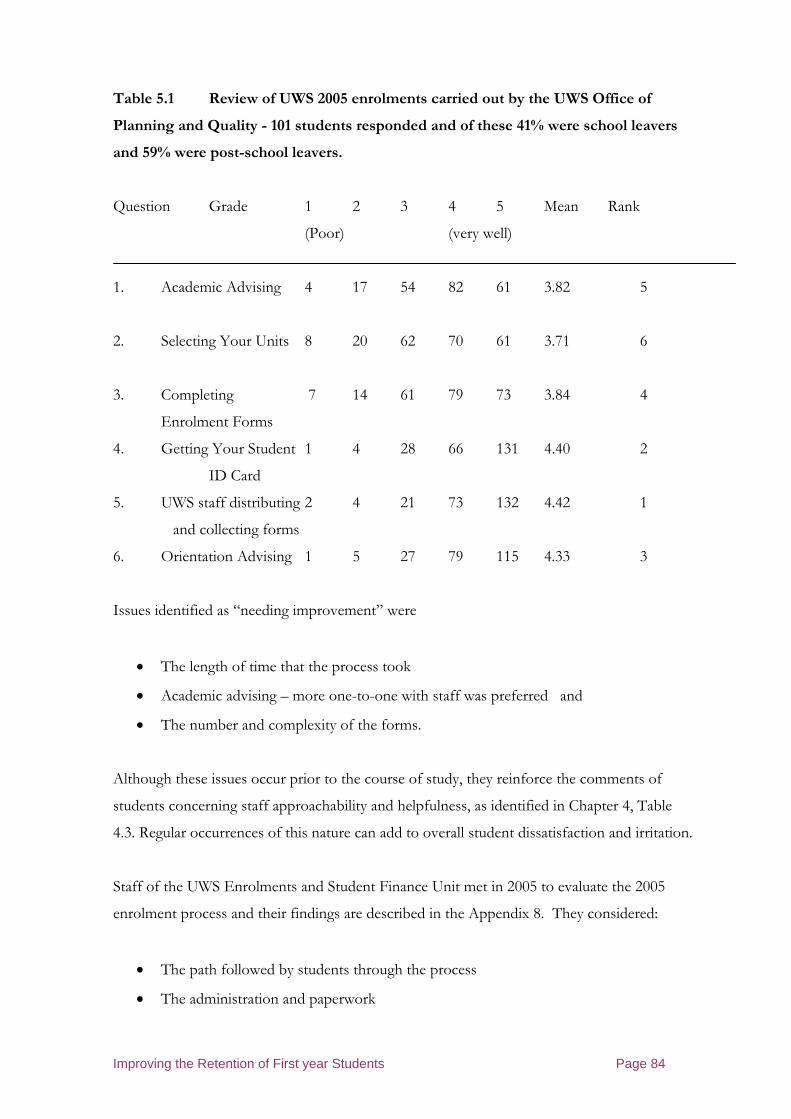
Improving the Retention of First year Students Page 84
Table 5.1 Review of UWS 2005 enrolments carried out by the UWS Office of
Planning and Quality - 101 students responded and of these 41% were school leavers
and 59% were post-school leavers.
Question Grade 1 2 3 4 5 Mean Rank
(Poor) (very well)
1. Academic Advising 4 17 54 82 61 3.82 5
2. Selecting Your Units 8 20 62 70 61 3.71 6
3. Completing 7 14 61 79 73 3.84 4
Enrolment Forms
4. Getting Your Student 1 4 28 66 131 4.40 2
ID Card
5. UWS staff distributing 2 4 21 73 132 4.42 1
and collecting forms
6. Orientation Advising 1 5 27 79 115 4.33 3
Issues identified as “needing improvement” were
• The length of time that the process took
• Academic advising – more one-to-one with staff was preferred and
• The number and complexity of the forms.
Although these issues occur prior to the course of study, they reinforce the comments of
students concerning staff approachability and helpfulness, as identified in Chapter 4, Table
4.3. Regular occurrences of this nature can add to overall student dissatisfaction and irritation.
Staff of the UWS Enrolments and Student Finance Unit met in 2005 to evaluate the 2005
enrolment process and their findings are described in the Appendix 8. They considered:
• The path followed by students through the process
• The administration and paperwork
Improving the Retention of First year Students Page 85
• Travel to and from the enrolment venues and
• Student satisfaction.
Possible improvements were analysed for subsequent years and recommendations made, as
listed in Appendix 8. Delays were minimised and efforts made so that students obtained the
information and guidance necessary to complete the process.
These responses informed the decision to introduce online enrolment of all students from
2007. However, the issues reflect on potential improvements to administrative processes
across the institution so that students are not discouraged at this early stage and lose their
confidence in the university and its procedures. Research has shown (chapter 2., section 2.3)
that, if students experience a succession of problems, whether administrative, technical,
academic or procedural, then they are more likely to consider withdrawal at a later stage.
5.4 The role of Orientation week
Prior to online enrolment, students visited university campuses on, for example, a scheduled
Careers Day while in High School or for academic advice and so became familiar with a
university environment and how it may differ from school. However, for many students, the
orientation sessions may be the first programmed experience of university life which can be
not only exciting, but also daunting. Procedures for admission, enrolment or orientation
processes may differ very much among schools (Chapter 2, section 2.3). These include campus
layout(s), timetabling, teaching and learning styles. For this reason the Orientation program,
scheduled for ‘week’ 0’, the week before classes commence, is designed to introduce, explain,
visit, tour and ‘settle in’. University Orientation programs form part of the First Year
Experience Program or Transition Program.
The literature shows that the academic orientation and integration of a student is equally, if
not more important, than the social orientation (Tinto 1975, 2002).
With this in mind, Orientation:
1) Welcomes students to the university and engenders a sense of belonging with students
making friends and forging relationships.

Improving the Retention of First year Students Page 86
2) Develops a student’s sense of direction by:
• Introducing them to their course area and promoting a clear understanding of
where their courses and subjects are directed.
• Promoting a clear understanding of the aims and objectives, learning outcomes,
learning processes, assessment methods, and teaching and learning methods of
their courses.
3) Familiarises students with the university by:
• Introducing students to the physical environment.
• Explaining the academic culture and expectations.
• Promoting a clear sense of university policy and procedures.
• Promoting the wider academic and student support services of the university
(‘who to go to for what’), including Library, Student Support Services (Careers
& Employment, Counselling & Disabilities, and Learning Skills), Information
Technology, Student Administration, Web CT.
4) Facilitates students’ engagement in university life by:
• Acknowledging that the transition to university can be difficult and working to reduce
student anxiety.
• Promoting involvement in university life and engagement with peers.
• Supporting students to make ‘good’ choices.
The following sections summarise student responses to the development of the Orientation
program at UWS: an exercise where improvements were progressively implemented in
subsequent years. Comparisons are made with the orientation programs at other universities,
including RMIT, Deakin University and QUT.
5.4.1 Step 1 - The 2005 Orientation program
Regular surveys of students following orientation programs are conducted by UWS. For
example, in 2005, a telephone survey was carried out by UWS [see table 5.4] to assess student
satisfaction of the 2005 orientation program and feedback was received from 494 students out
of 1000 first year students from the School of Engineering and Industrial Design. These
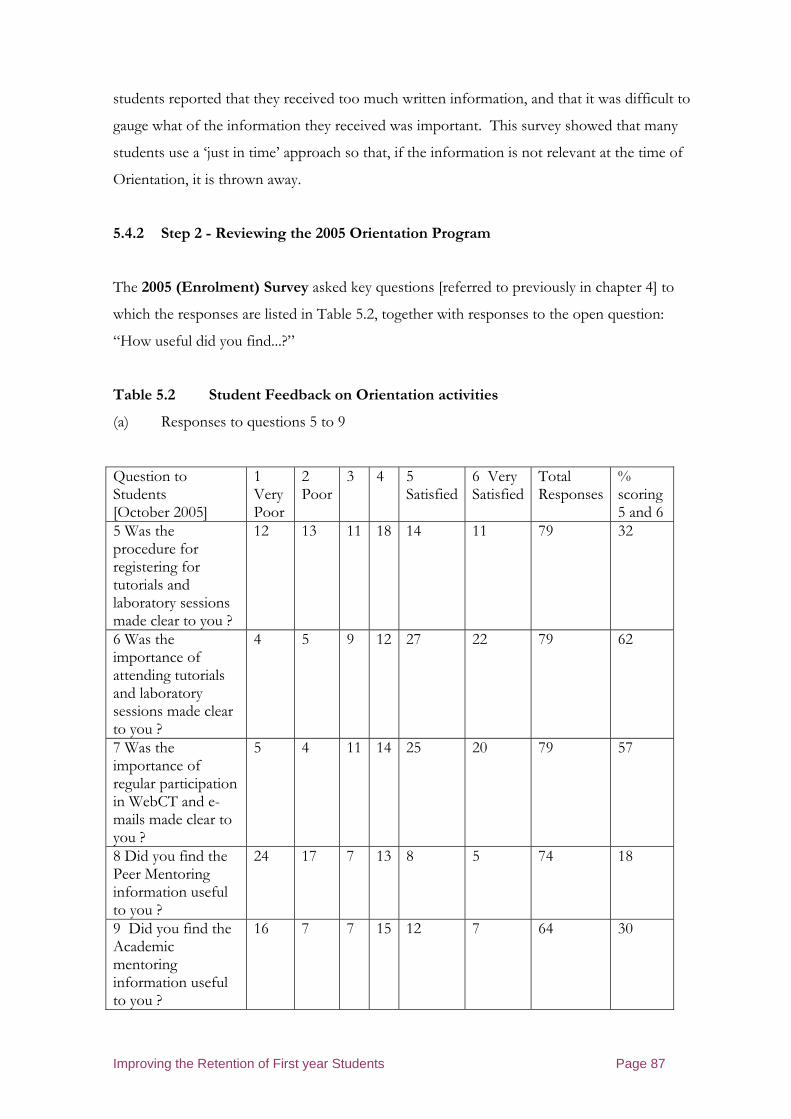
Improving the Retention of First year Students Page 87
students reported that they received too much written information, and that it was difficult to
gauge what of the information they received was important. This survey showed that many
students use a ‘just in time’ approach so that, if the information is not relevant at the time of
Orientation, it is thrown away.
5.4.2 Step 2 - Reviewing the 2005 Orientation Program
The 2005 (Enrolment) Survey asked key questions [referred to previously in chapter 4] to
which the responses are listed in Table 5.2, together with responses to the open question:
“How useful did you find...?”
Table 5.2 Student Feedback on Orientation activities
(a) Responses to questions 5 to 9
Question to Students [October 2005]
1 Very Poor
2 Poor
3 4 5 Satisfied
6 Very Satisfied
Total Responses
% scoring 5 and 6
5 Was the procedure for registering for tutorials and laboratory sessions made clear to you ?
12 13 11 18 14 11 79 32
6 Was the importance of attending tutorials and laboratory sessions made clear to you ?
4 5 9 12 27 22 79 62
7 Was the importance of regular participation in WebCT and e-mails made clear to you ?
5 4 11 14 25 20 79 57
8 Did you find the Peer Mentoring information useful to you ?
24 17 7 13 8 5 74 18
9 Did you find the Academic mentoring information useful to you ?
16 7 7 15 12 7 64 30

Improving the Retention of First year Students Page 88
(b) Responses to the open question “How useful did you find...?”
Assessment of Usefulness
Session nil% little% lot% more% did not
attend%
Course based sessions 2.2 31.2 43.4 17.3 4.0
Library Tour 2.7 18.9 42.8 16.5 19.1
IT Tour 5.9 22.0 28.5 8.0 35.6
Secrets of Success 6.1 19.7 26.2 8.8 39.2
Orientation Bag 3.1 20.7 49.0 23.0 4.2
Orientation website 1.9 26.4 41.5 16.1 14.0
Campus info. Stall 1.2 27.3 47.3 20.2 3.9
Self Guided Tour 3.6 24.3 37.1 14.5 20.5
Using attendance records, the overall attendance for 1st year students in 2005 was 95%: an
increase on 2004.
The 2006 Orientation program
As a result of the discussion that took place around these and other issues, the School of
Engineering reviewed and revised subsequent programs. The procedure for registering for
tutorials was addressed and improved and the peer mentoring process was enhanced and
better explained to students. Within the 2006 Survey, students were asked to assess aspects of
the 2006 program, as summarised in the following section.
5.4.3 Reviewing the 2006 Orientation program
The 2006 student survey, introduced in chapter 3 as part of the research for this thesis, listed
questions submitted, in February 2006, to first year students in the School of Engineering. The
responses to questions 1 to 12 are listed in Table 5.3 [the responses to questions 13 to 24 are
listed in Table 4.1]. The 26 question survey was voluntary and circulated via WebCT in late
February 2006 to all UWS School of Engineering First year EIDP students. 233 responses
were received, out of a student population of 350 – a 66.6 % response.

Improving the Retention of First year Students Page 89
Table 5.3 Student responses to the 2006 Survey on Orientation
Question to Students
Dissatisfied To Satisfied
Results Results Total Responses
% Satisfied + Very Satisfied
1 Overall level of satisfaction for the Orientation program
D S 10
98
24
3
4
31
0 20 40 60 80 100
1
2
3
4
5
6
(blank)
Count of Summary
Summary
37 5 4 28 117 13
204 64 %
2 Was the Presentation by Head of School useful to you ?
D S
Question 2 169 responses
14
81
33
5
2
34
0 10 20 30 40 50 60 70 80
1
2
3
4
5
6
(blank)
Count of Summary
Summary
39 5 6 39 98 16
203
56 %
3 Was the Careers and Employment presentation useful to you ?
D S
Question 3 171 responses
27
77
25
2
8
32
0 10 20 30 40 50 60 70 80
1
2
3
4
5
6
(blank)
Count of Summary
Summary
38 12 2 30 91 31
204
60 %
4 Was the Engineers Australia presentation useful to you ?
D S
Question 4 171 responses
21
63
36
9
10
32
Count of Summary
Summary
38 15 10 41 75 25
204
49 %
5 Was the presentation on Learning Skills useful to you ?
D S
Question 5 - 168 responses
15
88
19
3
8
35
0 10 20 30 40 50 60 70 80 90
1
2
3
4
5
6
(blank)
Count of Summary
Summary
42 9 3 22 106 19
201
62 %
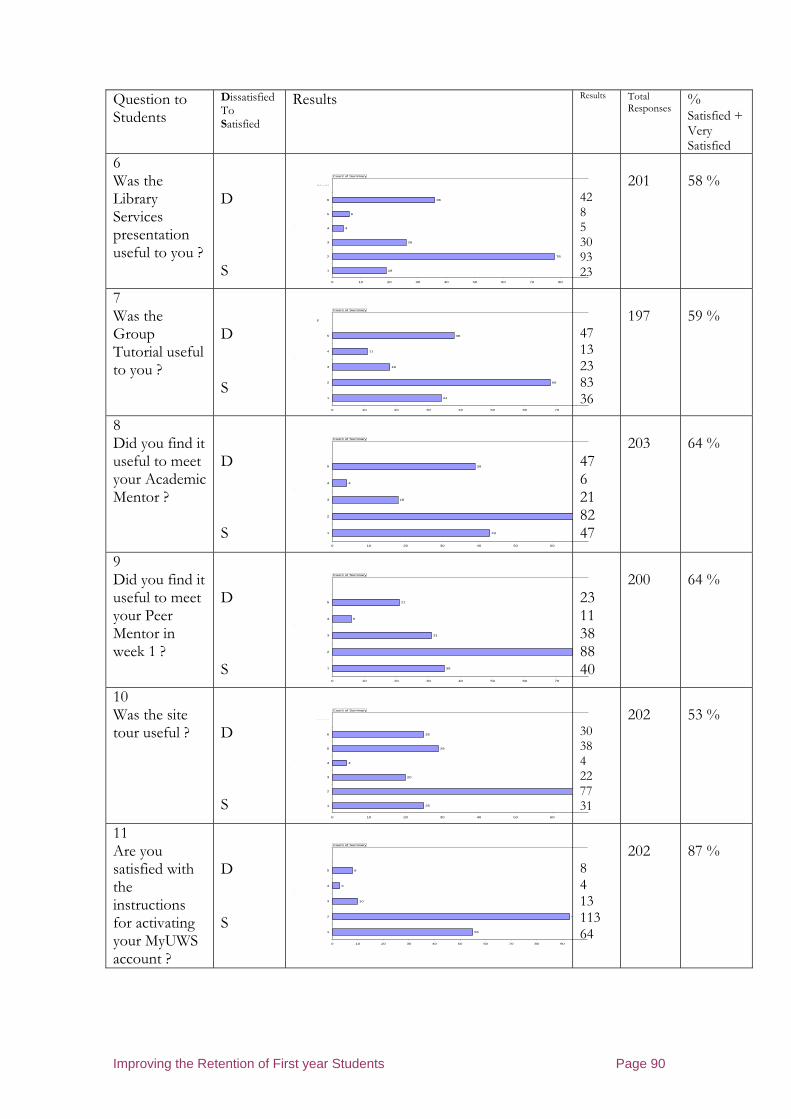
Improving the Retention of First year Students Page 90
Question to Students
Dissatisfied To Satisfied
Results Results Total Responses
% Satisfied + Very Satisfied
6 Was the Library Services presentation useful to you ?
D S
Question 6 - 169 responses
19
78
26
4
6
36
0 10 20 30 40 50 60 70 80
1
2
3
4
5
6
(blank)
Count of Summary
Summary
42 8 5 30 93 23
201
58 %
7 Was the Group Tutorial useful to you ?
D S
Question 7 - 169 responses
34
68
18
11
38
0 10 20 30 40 50 60 70
1
2
3
4
5
(blank)
Count of Summary
Summary
47 13 23 83 36
197
59 %
8 Did you find it useful to meet your Academic Mentor ?
D S
Question 8 - 170 responses
43
18
4
39
0 10 20 30 40 50 60
1
2
3
4
5
(blank)
Count of Summary
Summary
47 6 21 82 47
203
64 %
9 Did you find it useful to meet your Peer Mentor in week 1 ?
D S
Question 9 - 168 responses
35
31
6
21
0 10 20 30 40 50 60 70
1
2
3
4
5
(blank)
Count of Summary
Summary
23 11 38 88 40
200
64 %
10 Was the site tour useful ?
D S
Question 10 - 169 responses
25
20
4
29
25
0 10 20 30 40 50 60
1
2
3
4
5
6
(blank)
Count of Summary
Summary
30 38 4 22 77 31
202
53 %
11 Are you satisfied with the instructions for activating your MyUWS account ?
D S
Question 11 - 169 responses
55
9
10
3
8
0 10 20 30 40 50 60 70 80 90
1
2
3
4
5
(blank)
Count of Summary
Summary
8 4 13 113 64
202
87 %
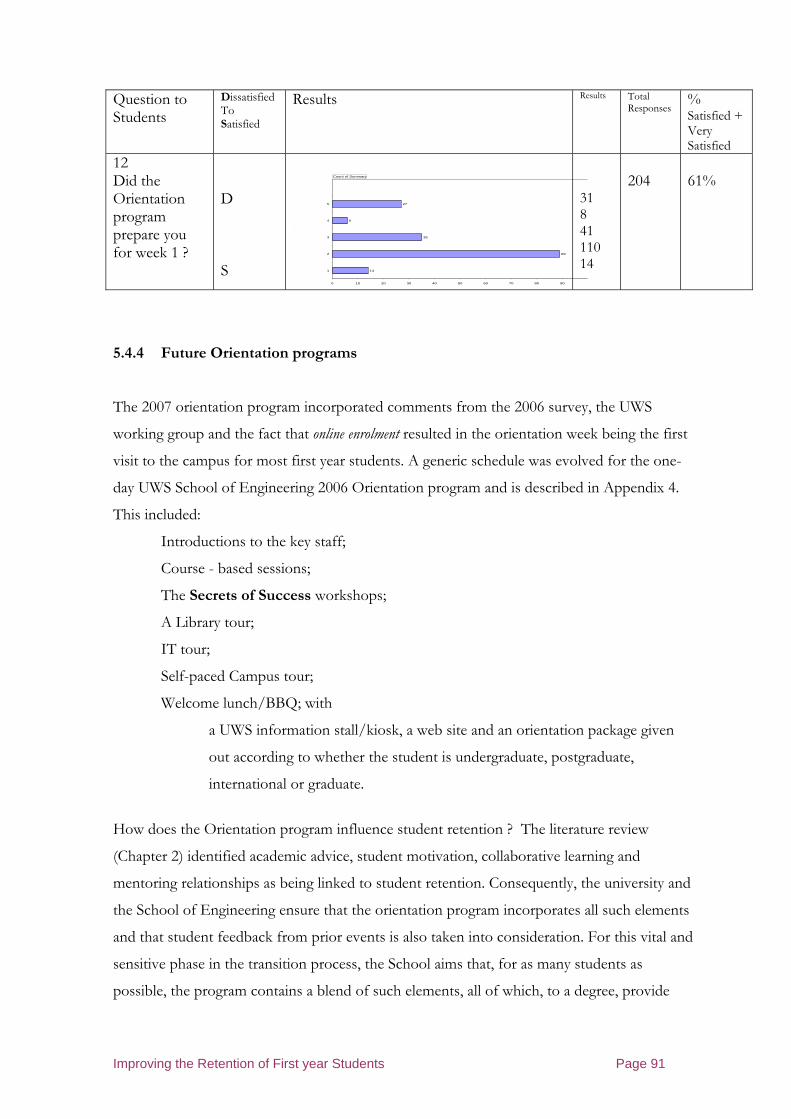
Improving the Retention of First year Students Page 91
Question to Students
Dissatisfied To Satisfied
Results Results Total Responses
% Satisfied + Very Satisfied
12 Did the Orientation program prepare you for week 1 ?
D S
Question 12 - 171 responses
14
89
35
6
27
0 10 20 30 40 50 60 70 80 90
1
2
3
4
5
(blank)
Count of Summary
Summary
31 8 41 110 14
204
61%
5.4.4 Future Orientation programs
The 2007 orientation program incorporated comments from the 2006 survey, the UWS
working group and the fact that online enrolment resulted in the orientation week being the first
visit to the campus for most first year students. A generic schedule was evolved for the one-
day UWS School of Engineering 2006 Orientation program and is described in Appendix 4.
This included:
Introductions to the key staff;
Course - based sessions;
The Secrets of Success workshops;
A Library tour;
IT tour;
Self-paced Campus tour;
Welcome lunch/BBQ; with
a UWS information stall/kiosk, a web site and an orientation package given
out according to whether the student is undergraduate, postgraduate,
international or graduate.
How does the Orientation program influence student retention ? The literature review
(Chapter 2) identified academic advice, student motivation, collaborative learning and
mentoring relationships as being linked to student retention. Consequently, the university and
the School of Engineering ensure that the orientation program incorporates all such elements
and that student feedback from prior events is also taken into consideration. For this vital and
sensitive phase in the transition process, the School aims that, for as many students as
possible, the program contains a blend of such elements, all of which, to a degree, provide

Improving the Retention of First year Students Page 92
students with a positive and motivating experience. However, precise data on, for example,
the percentage increase in retention due to one or more such elements is not possible due to
the many other influences such as described in chapter 4 and later in chapter 6.
5.5 An Institutional approach to Transition and the Orientation
Program
Following the identification of the components of a successful orientation program, such as at
UWS, many universities have adopted an institutional approach to transition and orientation
and extended the process from a few weeks prior to ‘Week 0’ to the end of the first semester,
recognising that students adjust to their university studies over an extended period. Typical
programs are :
1. The QUT program of Figure 5.1
2. The RMIT Draft Student Transition Plan of Figure 5.2
3. The Deakin University Timeline of Figure 5.3 and
4. The UWS First Year Transition/Retention Plan 2008/9 of Figure 5.4
(Programs 1, 2 and 3 - Kift,2008). Program 4 was presented to the UWS Transition/FYHE Group in 2008).
Each program recognises that induction/orientation commences a week or two prior to their
first classes; it continues throughout the first semester and continues through examinations
and into the second semester. Each program incorporates the learning and teaching session,
‘academic engagement’ and study skills, ‘at risk’ provision’ and the use of student ‘hosts’,
‘mentors’ or ‘buddies’ to serve as ice breakers with special provision for international students.
One key objective of such programs is to ease transition of every student into the university
and thereby to minimise student dissatisfaction, disquiet or frustration: thereby minimising
student attrition. Such programs are recognised (Kift, 2008) as an institutional ‘culture shift’
and so each program relies on cooperation between all interested parties, from the academic
and administrative School/Faculty staff to Student Support Services, IT departments, catering
and all other university services.

Improving the Retention of First year Students Page 93
Figure 5.1 The QUT Transition Plan for 2008

Improving the Retention of First year Students Page 94
Figure 5.2 The RMIT Student Transition Plan

Improving the Retention of First year Students Page 95
Figure 5.3 Deakin University’s Timeline

Improving the Retention of First year Students Page 96
What you expect, what we expect Course Expectations: balancing study, work and social life QUEST Who/ Where to go for Help ? Campus Familiarity First Year Intro to Key Staff Central website Access to vUWS for Ice Breakers “Market Days” NEW STUDENTS: BBQs Fit, Financial, Feeling Good ? • Key Dates • Tutorial Student engagement monitored Registration “Talk before you Walk” • Online access Census Date Ü • Acquire Books • Receive Week 0 “First Assessment” monitored - Program At Risk students identified + Revision Drop-ins/workshop Transition/Bridging Exams Skills Pre-Programs Academic Skills Workshops Top 10 Tips Guides/Mentors/ ‘ Ask Us’ teams circulate Buddies available
-4 -3 -2 -1 0 1 2 3 4 5 6 7 8 9 10 11 12 13 14 15 16 17 18 19 (week number) Academic Staff Tutors refer to Learning Guide at each lecture Briefed Tutors continue “Welcome Mentoring” www.uws.edu.au/fyc “Just in Time” e-mails sent
WELCOME SETTLING IN TAKING OFF FABULOUS FINISH
Figure 5.4 UWS Transition Plan 2008/9
Orie
ntat
ion
Week
Improving the Retention of First year Students Page 97
5.6 IT access
Students of UWS have access to a wide range of IT facilities. Over 1000 computer terminals are
available across the six campuses with student access to general-purpose computer laboratories 7
days a week, from early morning to the evening during weekdays. Many students are required to
upload their assignments through WebCT [a sub set of e-learning] and so regularly require such
access. Quizzes are displayed as assignments on WebCT, as are student e-mail addresses for
communicating to or from students. It is therefore necessary for every student to register online
with MyUWS and hence to their appropriate WebCT pages. Students also have access to WebCT
from their home computers, enabling continuous communications with the university and their
academic and administrative staff and student colleagues.
MyUWS contains many 1000s of pages of information for students, including First Year central
during the first few weeks and help pages such as the button “Got Questions ?” [See Appendix 9
for the First Year Central links].
In the 2005 UWS Telephone survey referred to in section 5.4.1, some questions were asked about
the MyUWS help service via a button called “Got Questions ?”. Students were also asked to
comment on IT resources, WebCT and library access and quality. The results are summarised in
Table 5.4.
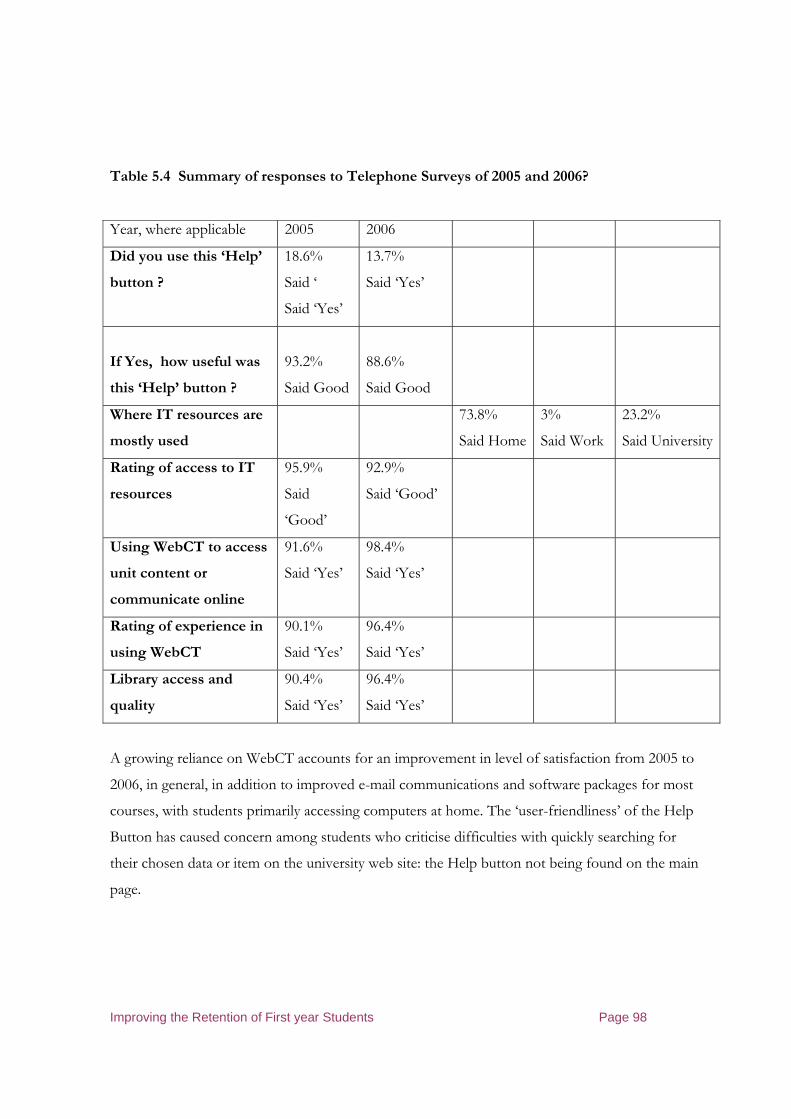
Improving the Retention of First year Students Page 98
Table 5.4 Summary of responses to Telephone Surveys of 2005 and 2006?
Year, where applicable 2005 2006
Did you use this ‘Help’
button ?
18.6%
Said ‘
Said ‘Yes’
13.7%
Said ‘Yes’
If Yes, how useful was
this ‘Help’ button ?
93.2%
Said Good
88.6%
Said Good
Where IT resources are
mostly used
73.8%
Said Home
3%
Said Work
23.2%
Said University
Rating of access to IT
resources
95.9%
Said
‘Good’
92.9%
Said ‘Good’
Using WebCT to access
unit content or
communicate online
91.6%
Said ‘Yes’
98.4%
Said ‘Yes’
Rating of experience in
using WebCT
90.1%
Said ‘Yes’
96.4%
Said ‘Yes’
Library access and
quality
90.4%
Said ‘Yes’
96.4%
Said ‘Yes’
A growing reliance on WebCT accounts for an improvement in level of satisfaction from 2005 to
2006, in general, in addition to improved e-mail communications and software packages for most
courses, with students primarily accessing computers at home. The ‘user-friendliness’ of the Help
Button has caused concern among students who criticise difficulties with quickly searching for
their chosen data or item on the university web site: the Help button not being found on the main
page.
Improving the Retention of First year Students Page 99
5.7 Administrative issues such as fees and MyUWS Account registration
Students pay fees to UWS early in the process of enrolment. This triggers the administrative staff
to open access for the students to MyUWS and the university library and consequently WebCT
where early course information is posted onto the relevant course sites. Errors or problems with
the paying of the correct fees can create frustration with students who are unable to follow the
steps suggested by academic staff with the preparation for their first week of studies with, for
example, information of text book, readings, initial quizzes and general background information.
In the 2005 UWS Telephone Survey several questions were asked of students in their first
semester about administrative issues and the results incorporated into the UWS working party
addressing student retention. As a result, improvements and greater awareness have been evident
and student comments in 2007 have been minimal within the School of Engineering.
5.8 Seeking help and support - Staff communications and accessibility
In relation to staff, the following issues are suggested by Tinto [2002]:
o A stronger emphasis in staff performance review and development, staff training,
new staff recruitment and induction on:
- professionalism
- cultural sensitivity
- becoming more ‘client centred’
- providing comprehensive and accurate advice to students
o Improved protocols, and monitoring of adherence to these protocols to avoid
slippage, to ensure that
- teaching staff provide reasonable and clearly communicated accessibility to
students
- The Peer Mentor scheme
Improving the Retention of First year Students Page 100
Student feedback obtained in the 2005 (Enrolment) survey associated with this thesis included
reference to much needed improvements to information relating to peer mentoring and academic
mentoring – see Table 5.2; further discussed in chapter 6. Table 5.2 shows that only 18% of
students were satisfied or very satisfied with information on peer mentoring and only 30% with
information on academic mentoring. In terms of peer mentoring, improvements in peer
mentoring training and implementation were introduced in 2007 but, because of a considerable
increase in first year student numbers, insufficient [volunteer] peer mentors were introduced so
this issue is to be addressed for the 2008 cohort. In terms of academic mentoring, the scheme
was shelved for 2007, being partly replaced by a First year Coordinator, but was addressed for the
2008 semester.
The visibility and responsibility of Student Support greatly influences the ease with which students
approach and receive responses to any problems and issues that they may have. For example, if
one member of staff identifies that a student requires assistance,
• Is this conveyed to colleagues within the School or within UWS ?
• Is this recorded within the School ?
• How is the student channelled to the source of assistance ?
• Which measures have been introduced into the School in 2005 to improve the retention
of 1st year students ?
• How affective are these measures ?
• Is the drop in retention rate linked to the Retention Project Action Plan 2005: December
2004
• What improvements could be considered by the School for subsequent years ?
Questions on IT access, The Campus, WebCT, The Library, UWS Study Assistance and Learning
Skills support are contained within the research questions listed above. A major project will be
carried out for the first semester 2009 in the School of Engineering at UWS which addresses the
above questions and ‘students at risk’ with the aim of improving student retention in its first year.
Improving the Retention of First year Students Page 101
Evaluation of every measure and aspect of the transition and orientation process will be
continuous.
5.9 Discussion
The initiatives, introduced in this chapter and identified in the literature review of Chapter 2, were
aimed at improving the student experience, and consequently student retention, through the entry
and orientation phases. These initiatives sit alongside many other measures that universities
introduce for the new students and so it is difficult to state that any one initiative alone improved
student retention. However they alter the ‘mentoring culture’ of the university and the School,
particularly if an institution-wide approach is adopted. Alongside these measures, each student
carries a background and individual approach to study, as well as academic ability and so the
university attempts to maximise the effectiveness of its entry and orientation processes for each
student; addressing individual student needs where resources allow.
Student responses to the elements of the orientation program described in this chapter indicate
reasonable acceptance and satisfaction. Students in the 2006 survey were satisfied with the 2006
orientation program in general, the e-learning facilities and the mentoring.
This follows an on-going review and improvement process with, for example, orientation and, as
at UWS and other universities, an institutional approach to the whole process from week -4 to
week 5 and beyond as illustrated in Figure 5.4. These exercises have involved all staff within the
School and key departments of the university: all have raised awareness of student expectations in
order to maximise student satisfaction.
Unfortunately, the data available for this project were insufficient to undertake a rigorous
analytical study of the effectiveness of the different retention strategies although ongoing
developments of the 2004 strategy was very useful; measuring its effectiveness though the 3 years
of this research. Thus, while a significant effort has been devoted to improving student
satisfaction during the first contact with the university, there is no substantive evidence that it
alone or in unison with other actions resulted in a significant improvement in retention.

Improving the Retention of First year Students Page 102
6 Teaching and Learning – Student Retention Issues
6.1 Introduction
“The more students learn, the more value they find in their learning, the more likely they are to stay and
graduate. This is particularly true for more able and motivated students who seek out learning and are, in
turn, more likely to respond to perceived shortcomings in the quality of learning they experience on campus.
Lest we forget the purpose of higher education is not merely that students are retained, but that they are
educated.
In the final analysis, student learning drives student retention.”
( Vincent Tinto)
This chapter addresses the issues of teaching and learning as they affect retention and, in
particular, the effects of style, quality and support in teaching and learning on first year
engineering students as they embark on their four year degree course.
The literature review (Chapter 2) identified a number of teaching and learning issues, such as
• Quality of teaching and learning
• Attitude of staff
• Learning style
• Advisory services
• An institutional approach
which, accumulatively, influence student retention. As stated in Chapter 5 and by Martinez (2001)
there are no “magic bullets” in improving retention. The review suggested that, if the teaching and
learning curriculum, styles, support, timetables and related factors, are understood by new
students and if tutors are aware of the student backgrounds and abilities, then an appropriate
learning and teaching culture is in place and students will be less likely to be discouraged.
Many support services such as student support, mentoring and academic advice are used to
address the retention issues associated with teaching and learning. Issues of student workload and

Improving the Retention of First year Students Page 103
motivation can influence the ability of any student to cope with their course of study and research
has indicated (see chapter 2, section 2.3) that time pressures or work pressures or family pressures
can place significant burdens on any one student. In the following these factors and those of
teaching and learning in general are discussed and examined in the context of Engineering courses
at UWS using data from surveys and analyses undertaken at the University of Western Sydney
and other universities (where appropriate).
6.2 Teaching and Learning activities
Two groups of first year undergraduate students were tutored by the author, as part of the
approved methodology of this research study as a means of collecting further data on student
retention, satisfaction and performance. Ethics approval was obtained for the surveys and
contacts with students and all students were informed, prior to the exercise, that the process was
in place. However, this was not referred to again so as to minimise the ‘halo’ effect where the
knowledge of the project may have biased the results in the tutor groups. At the conclusion of
the exercise, students then received feedback. Tutoring and meeting these tutorial groups proved
invaluable to the research. The contacts allowed better assessment of the potential reasons why
students choose to drop out via
• Discontinuation
• Dropping the subject and transferring elsewhere within UWS at the first opportunity
• Transferring to another university or
• Repeating the Unit [n.b. students failing or withdrawing from any unit are recorded as
dropping out, even if they return to repeat the same unit in a subsequent semester].
The feedback relating to the enrolment process was outlined in chapter 4 and the orientation
process in Chapter 5, where questions relating to classroom experience and support were raised
(see Appendix 3 for the questionnaires). Many issues create student dissatisfaction which, if
occurring frequently or if unresolved, cause general disquiet and dissatisfaction, with
consequential lack of motivation and eventual dropping out. Evidence to support this statement is
varied and, as stated above, is contained within many aspects of the pathway followed by each

Improving the Retention of First year Students Page 104
student, whether via their background and ability or via the process that they are following.
‘Tolerance levels’ are exceeded and commitment is reduced. Students may consider transfer to
another course, either during the semester or between semesters; or elsewhere to another
University. Throughout the first semester students are encouraged by Student Support Services,
and the First Year Coordinator, to ‘Talk before they Walk’ [see Figure 1.1] so that such issues are
discussed and, maybe, eliminated or reduced in complexity. One aspect of University-based
student support is the identification of students with problems/issues either directly or by
encouraging them to seek assistance. The importance of a mentoring culture was identified in the
literature review (Chapter 2.3).
6.3 Curriculum Design for the First year
Students should be clear on their expectations and fully understand the criteria against which they
are assessed. Lack of clarity with assessment details has been identified in UWS research and
linked with student attrition. As a consequence, the university revised its assessment policy in
2008 requiring all unit outlines to be rewritten in the form of criteria and standard based
learning, with an accompanying learning guide circulated to all students where all assessment
tasks were listed and linked to the learning outcomes, with criteria and standards explained.
6.4 Class Timetables, including laboratory sessions, tutorials etc.
The timetabling of lectures, tutorials, laboratory sessions and other activities for each Unit can
pose problems for many students. In the 2006 survey a question was asked of students
“5. Was the procedure for registering for tutorials and laboratory sessions made clear to you ?”
and the satisfactory score was 32%.
This is an ongoing problem partly due to the integration of timetable sessions of one, two, three
or more units in any week and partly due to the integration of a timetable with their personal life,
including part-time or full-time employment. For this reason, some students prioritise classes and

Improving the Retention of First year Students Page 105
may not attend if difficulties or clashes arise. For example, attendance at formal lectures can be
poor: some students choosing to utilise the lecture notes on WebCT rather than attend. The
procedure for each student to establish their full semester timetable comprises registration in each
class, and this poses problems for some students whose options are limited for a number of
reasons. Problems arise if students are late in registering, if they are international students and
their registration is delayed, or if the units of their course are complex and the options are difficult
to integrate.
The week-by-week schedules contain the times allocated to lectures, laboratory, tutorial and other
sessions, with rooms, times and other details. First year Units cater for large numbers of students
and lectures are normally held in a large lecture theatre whereas, for tutorials and
laboratory/practical sessions, classes are divided according to the furniture and/or equipment
available in individual rooms and many groups are timetabled throughout the week.
6.5 Monitoring Learning activities
Considerable research has been carried out which links ‘quality of teaching and learning’ with
student retention, particularly in the first few weeks of the first year [Zimitat, 2006]. Several
references have been made in this chapter to students’ perceptions of the teaching and learning
process and their levels of satisfaction or disquiet with the curriculum, syllabus content, teaching
styles, assessments and so on.
Students at UWS have the opportunity to assess aspects of their teaching program, such as ‘good
teaching’, assessment and so on in the feedback forms SFU [Student Feedback on Unit] and SFT
[Student Feedback on Teacher], as described in Table 3.1, and offer a discrete opportunity to
inform the university, and subsequently the School, of their opinions.
The literature review (Chapter 2) showed that student satisfaction was a key factor in discouraging
students from engaging and succeeding. This is measured at UWS and at other universities via
SFU and SFT surveys, or similar, and Course Experience Questionnaires, carried out annually.
These are two part surveys which includes responses from UWS and compares them with national
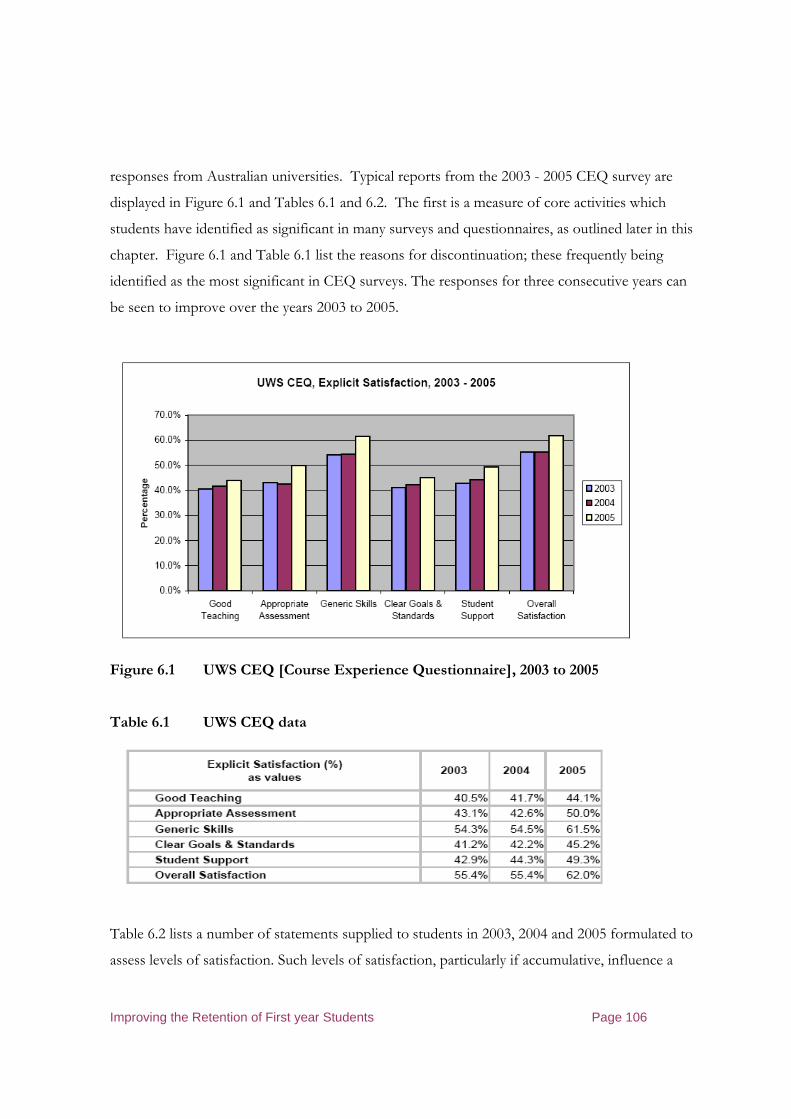
Improving the Retention of First year Students Page 106
responses from Australian universities. Typical reports from the 2003 - 2005 CEQ survey are
displayed in Figure 6.1 and Tables 6.1 and 6.2. The first is a measure of core activities which
students have identified as significant in many surveys and questionnaires, as outlined later in this
chapter. Figure 6.1 and Table 6.1 list the reasons for discontinuation; these frequently being
identified as the most significant in CEQ surveys. The responses for three consecutive years can
be seen to improve over the years 2003 to 2005.
Figure 6.1 UWS CEQ [Course Experience Questionnaire], 2003 to 2005
Table 6.1 UWS CEQ data
Table 6.2 lists a number of statements supplied to students in 2003, 2004 and 2005 formulated to
assess levels of satisfaction. Such levels of satisfaction, particularly if accumulative, influence a
Improving the Retention of First year Students Page 107
student’s decision to remain in the course, to remain in the university or to remain motivated to
succeed. Although some data in these tables is college-based, it illustrates trends in overall levels
of satisfaction for, in particular, the College of Science, Technology and Environment [CSTE]
within which are the two Schools where detailed research and surveys were carried out – namely
the School of Engineering and Industrial Design [now Engineering] and the School of
Environment and Agriculture.
A selection of the detailed questionnaire responses is displayed in Table 6.2, together with the
questions asked, for the same three years at UWS. This questionnaire is one of those introduced
in Table 3.1 carried on annually by the UWS Office of Planning and Quality. Overall, the results
are disappointing and, for students who are experiencing such difficulties as only 45% saying “my
lecturers were good at explaining things” and similar responses below 50%, greater emphasis on
the quality of teaching staff is obvious. Table 6.3 illustrates the variations between UWS colleges
where, for engineering courses contained within the College of Science, Technology and
Environment, CSTE; [now, after reorganisation, the College of Health and Science], the
satisfaction percentage of 41.8% for ‘good teaching’ is below that for the Colleges of Education
and of Health where entry UAIs are considerably higher. If these figures, for CSTE, are compared
with the average UWS figures as seen in Table 6.4, student satisfaction is higher but, due to other
lower percentages, the overall satisfaction level is lower at 58.2%
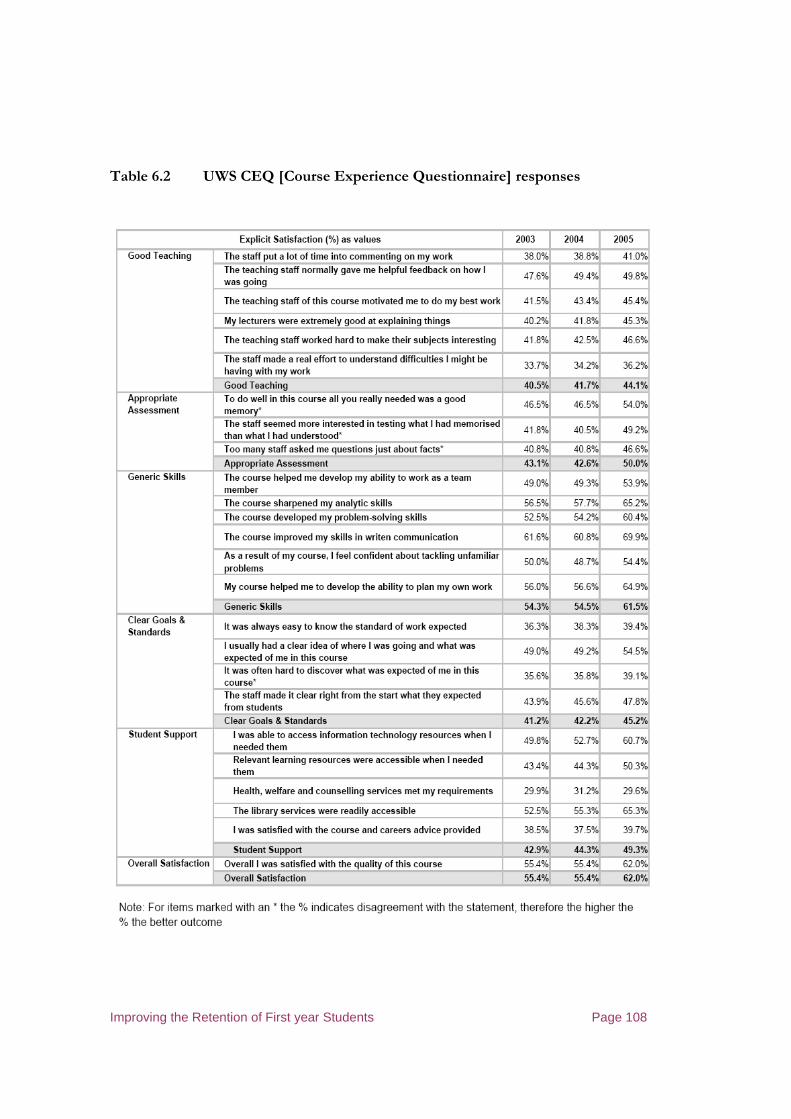
Improving the Retention of First year Students Page 108
Table 6.2 UWS CEQ [Course Experience Questionnaire] responses
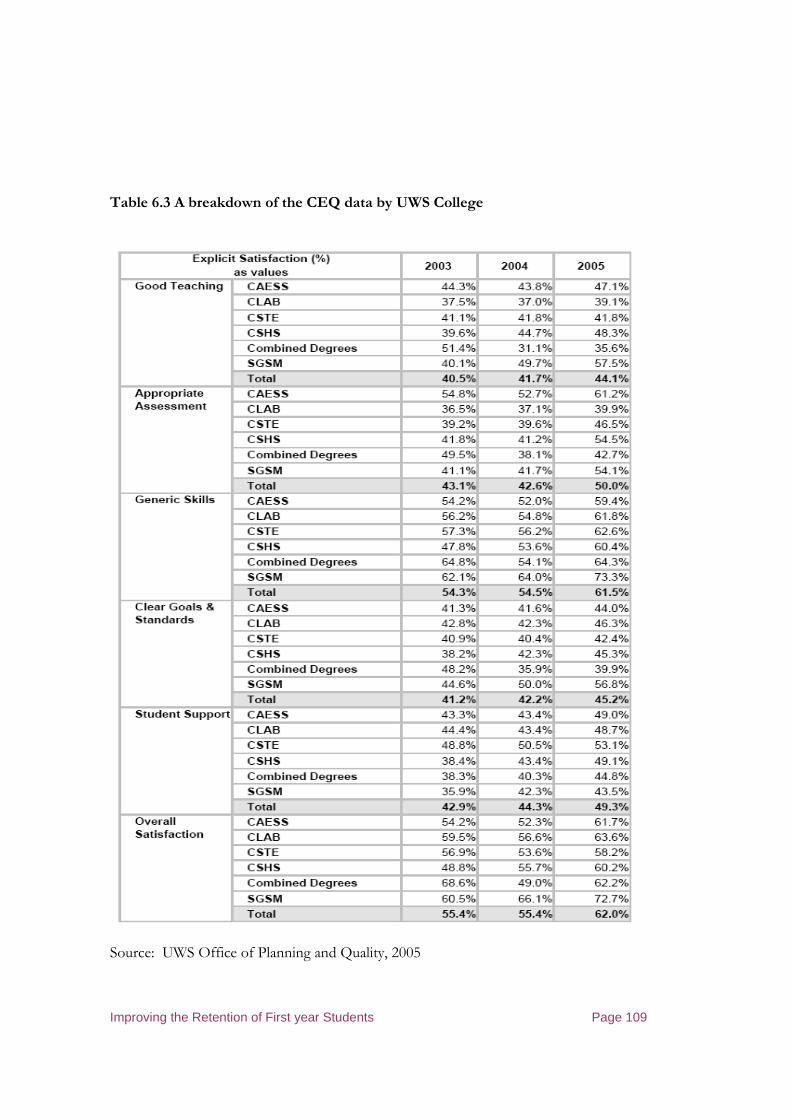
Improving the Retention of First year Students Page 109
Table 6.3 A breakdown of the CEQ data by UWS College
Source: UWS Office of Planning and Quality, 2005
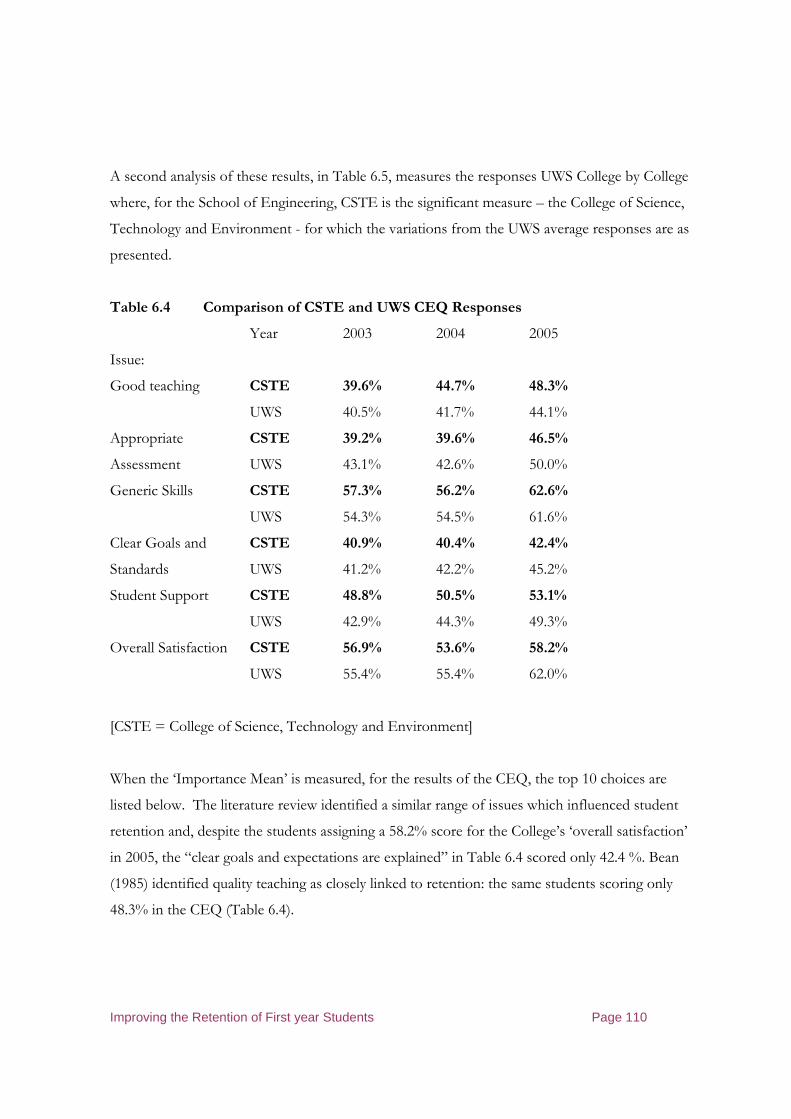
Improving the Retention of First year Students Page 110
A second analysis of these results, in Table 6.5, measures the responses UWS College by College
where, for the School of Engineering, CSTE is the significant measure – the College of Science,
Technology and Environment - for which the variations from the UWS average responses are as
presented.
Table 6.4 Comparison of CSTE and UWS CEQ Responses
Year 2003 2004 2005
Issue:
Good teaching CSTE 39.6% 44.7% 48.3%
UWS 40.5% 41.7% 44.1%
Appropriate CSTE 39.2% 39.6% 46.5%
Assessment UWS 43.1% 42.6% 50.0%
Generic Skills CSTE 57.3% 56.2% 62.6%
UWS 54.3% 54.5% 61.6%
Clear Goals and CSTE 40.9% 40.4% 42.4%
Standards UWS 41.2% 42.2% 45.2%
Student Support CSTE 48.8% 50.5% 53.1%
UWS 42.9% 44.3% 49.3%
Overall Satisfaction CSTE 56.9% 53.6% 58.2%
UWS 55.4% 55.4% 62.0%
[CSTE = College of Science, Technology and Environment]
When the ‘Importance Mean’ is measured, for the results of the CEQ, the top 10 choices are
listed below. The literature review identified a similar range of issues which influenced student
retention and, despite the students assigning a 58.2% score for the College’s ‘overall satisfaction’
in 2005, the “clear goals and expectations are explained” in Table 6.4 scored only 42.4 %. Bean
(1985) identified quality teaching as closely linked to retention: the same students scoring only
48.3% in the CEQ (Table 6.4).
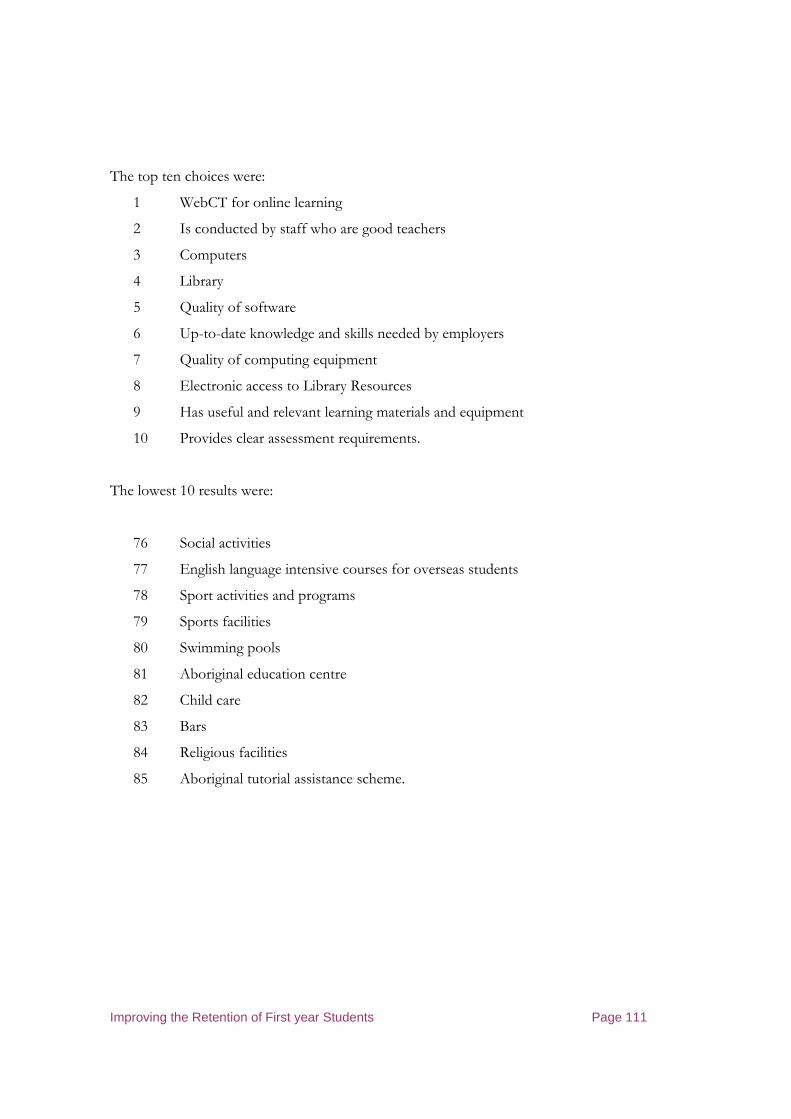
Improving the Retention of First year Students Page 111
The top ten choices were:
1 WebCT for online learning
2 Is conducted by staff who are good teachers
3 Computers
4 Library
5 Quality of software
6 Up-to-date knowledge and skills needed by employers
7 Quality of computing equipment
8 Electronic access to Library Resources
9 Has useful and relevant learning materials and equipment
10 Provides clear assessment requirements.
The lowest 10 results were:
76 Social activities
77 English language intensive courses for overseas students
78 Sport activities and programs
79 Sports facilities
80 Swimming pools
81 Aboriginal education centre
82 Child care
83 Bars
84 Religious facilities
85 Aboriginal tutorial assistance scheme.
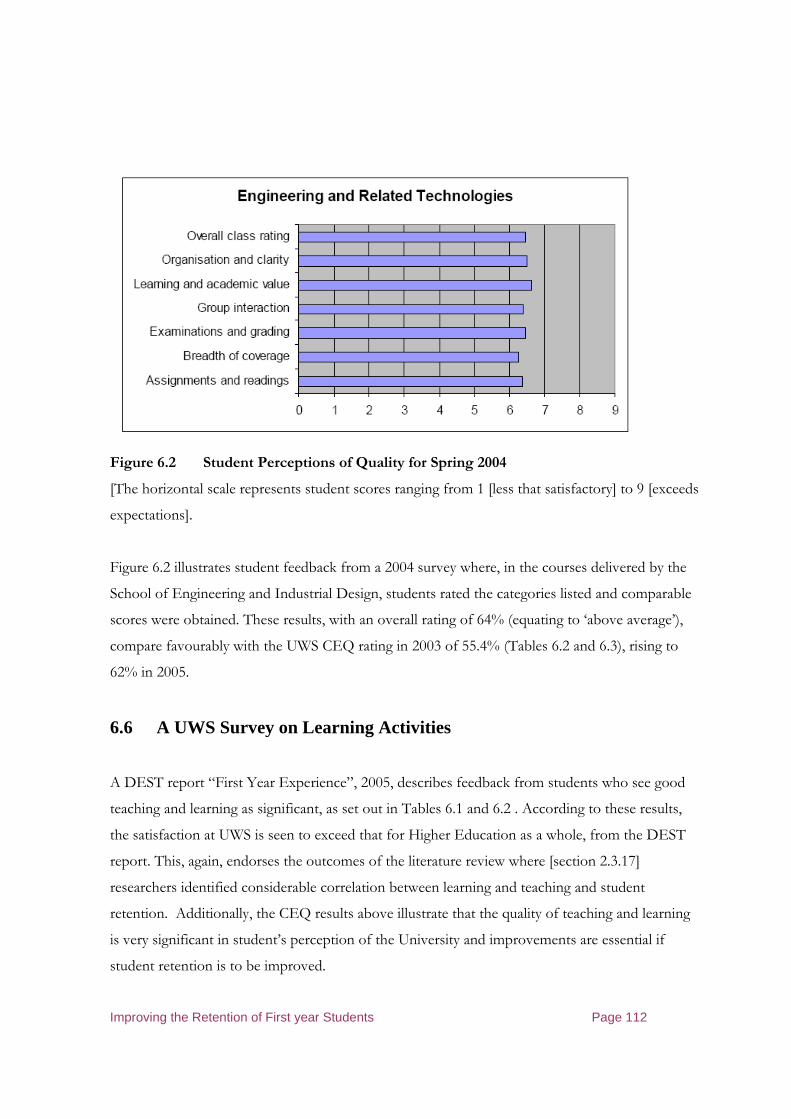
Improving the Retention of First year Students Page 112
Figure 6.2 Student Perceptions of Quality for Spring 2004
[The horizontal scale represents student scores ranging from 1 [less that satisfactory] to 9 [exceeds
expectations].
Figure 6.2 illustrates student feedback from a 2004 survey where, in the courses delivered by the
School of Engineering and Industrial Design, students rated the categories listed and comparable
scores were obtained. These results, with an overall rating of 64% (equating to ‘above average’),
compare favourably with the UWS CEQ rating in 2003 of 55.4% (Tables 6.2 and 6.3), rising to
62% in 2005.
6.6 A UWS Survey on Learning Activities
A DEST report “First Year Experience”, 2005, describes feedback from students who see good
teaching and learning as significant, as set out in Tables 6.1 and 6.2 . According to these results,
the satisfaction at UWS is seen to exceed that for Higher Education as a whole, from the DEST
report. This, again, endorses the outcomes of the literature review where [section 2.3.17]
researchers identified considerable correlation between learning and teaching and student
retention. Additionally, the CEQ results above illustrate that the quality of teaching and learning
is very significant in student’s perception of the University and improvements are essential if
student retention is to be improved.

Improving the Retention of First year Students Page 113
Table 6.5 Perceptions of teaching, 1994-2004, 5-point scale collapsed to 3 points, (% of
students) (1994, N=4028; 1999, N=2609, N=2334). DEST 2004
Disagree Agree
The quality of teaching in my course is generally good 1994
1999
2004
9
9
5
25
24
17
66
67
78**2 3
Staff are enthusiastic about the subjects they teach 1994
1999
2004
13
12
5
34
32
23
53
56*1
72**2 3
Most of the academic staff are approachable 1994
1999
2004
12
12
8
26
26
20
62
62
72**2 3
The teaching staff are good at explaining things 1994
1999
2004
16
17
9
38
35
28
47
48
63**2 3
Staff try hard to make the subjects interesting 1994
1999
2004
17
17
11
34
34
28
50
50
61**2 3
Staff are usually available to discuss my work 1994
1999
2004
21
25
15
34
37
36
45
38**1
49**2 *3
Staff make a real effort to understand difficulties students
may be having with their work
1994
1999
2004
28
28
17
36
35
36
36
37
47**2 3

Improving the Retention of First year Students Page 114
Teaching staff here usually give helpful feedback
on my progress
1994
1999
2004
40
40
31
32
34
36
28
25*1
33**2 3
Most academic staff in my subjects take an interest
in my progress
1994
1999
2004
44
47
34
32
32
36
24
21*1
30**2 3
* Significant at .01 ** significant at .05
1 Denotes significant change 1994 to 1999. 2 Denotes significant change 1999 to 2004.
3 Denotes significant change 1994 to 2004.
Table 6.6 Satisfaction with course of study, 1994-2004 (% of students)
(1994, N=4028; 1999, N=2609; 2004, N=2334) (DEST 2004)
Disagree Agree
I am finding my course intellectually stimulating 1994
1999
2004
12
10
6
25
26
19
63
63
75**2 3
Overall, I am really enjoying my course 1994
1999
2004
15
13
9
24
23
20
61
64*1
71**2 3
Overall, I am very satisfied with my university
experience so far
1994
1999
2004
15
14
10
23
24
20
61
63
70**2 3
* Significant at .01 ** significant at .05
1 Denotes significant change 1994 to 1999. 2 Denotes significant change 1999 to 2004.
3 Denotes significant change 1994 to 2004.
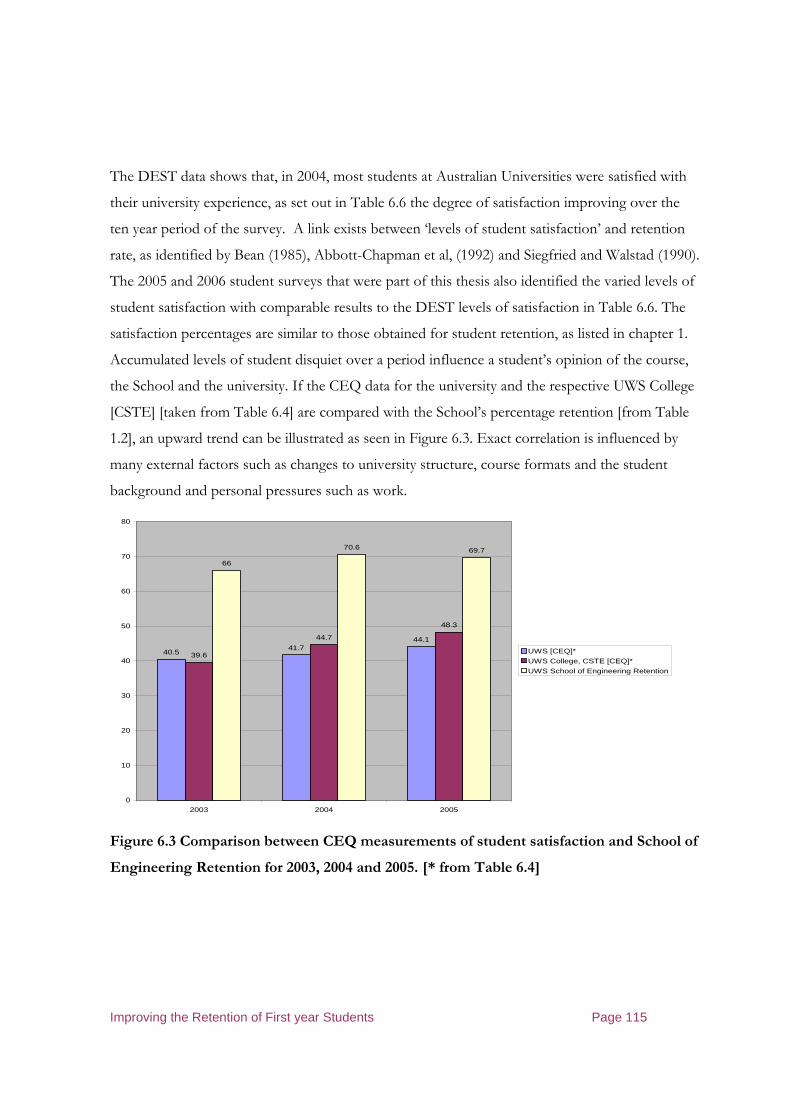
Improving the Retention of First year Students Page 115
The DEST data shows that, in 2004, most students at Australian Universities were satisfied with
their university experience, as set out in Table 6.6 the degree of satisfaction improving over the
ten year period of the survey. A link exists between ‘levels of student satisfaction’ and retention
rate, as identified by Bean (1985), Abbott-Chapman et al, (1992) and Siegfried and Walstad (1990).
The 2005 and 2006 student surveys that were part of this thesis also identified the varied levels of
student satisfaction with comparable results to the DEST levels of satisfaction in Table 6.6. The
satisfaction percentages are similar to those obtained for student retention, as listed in chapter 1.
Accumulated levels of student disquiet over a period influence a student’s opinion of the course,
the School and the university. If the CEQ data for the university and the respective UWS College
[CSTE] [taken from Table 6.4] are compared with the School’s percentage retention [from Table
1.2], an upward trend can be illustrated as seen in Figure 6.3. Exact correlation is influenced by
many external factors such as changes to university structure, course formats and the student
background and personal pressures such as work.
40.541.7
44.1
39.6
44.7
48.3
66
70.6 69.7
0
10
20
30
40
50
60
70
80
2003 2004 2005
UWS [CEQ]*
UWS College, CSTE [CEQ]*
UWS School of Engineering Retention
Figure 6.3 Comparison between CEQ measurements of student satisfaction and School of
Engineering Retention for 2003, 2004 and 2005. [* from Table 6.4]
Improving the Retention of First year Students Page 116
6.7 Student motivation and workload
According to Tinto (1975, 2003), the decision whether a student persists or drops out is quite
strongly predicted by their degree of academic integration, and social integration. These evolve
over time, as integration and commitment interact, with dropouts depending on commitment at
the time of the decision. Both academic and social integration could possibly be measured by
posing the following two questions (Tinto, 2002):
(a) “How can each student assess the academic integration of their studies, using:
o Grade / mark performance
o Personal development -- or does this just indicates a student's private judgement
on the value of what they are learning (as opposed to official marks / teachers'
judgements).
o "Do you think you are doing well academically?" (Academic self-esteem)
o Enjoying your subject(s).
o Enjoying studying your subject(s): i.e. the study patterns required/requested are or
are not enjoyable.
o Identification with academic norms and values
o Identification with one's role as a student ?
(b) How can the students assess the social integration by asking:
o How many friends do you have ? It probably doesn't matter whether you fit with
the dominant social crowd, only whether or not you have a group of friends you
fit with.
o Personal contact with academics. In fact, it may be that it is important to measure
really small amounts of contact: how many staff know your name, smile at you…
("How many staff have you had a personal interaction with, however small?"
"How many personal interactions with staff have you had this year?").
o "Are you enjoying being at university?"
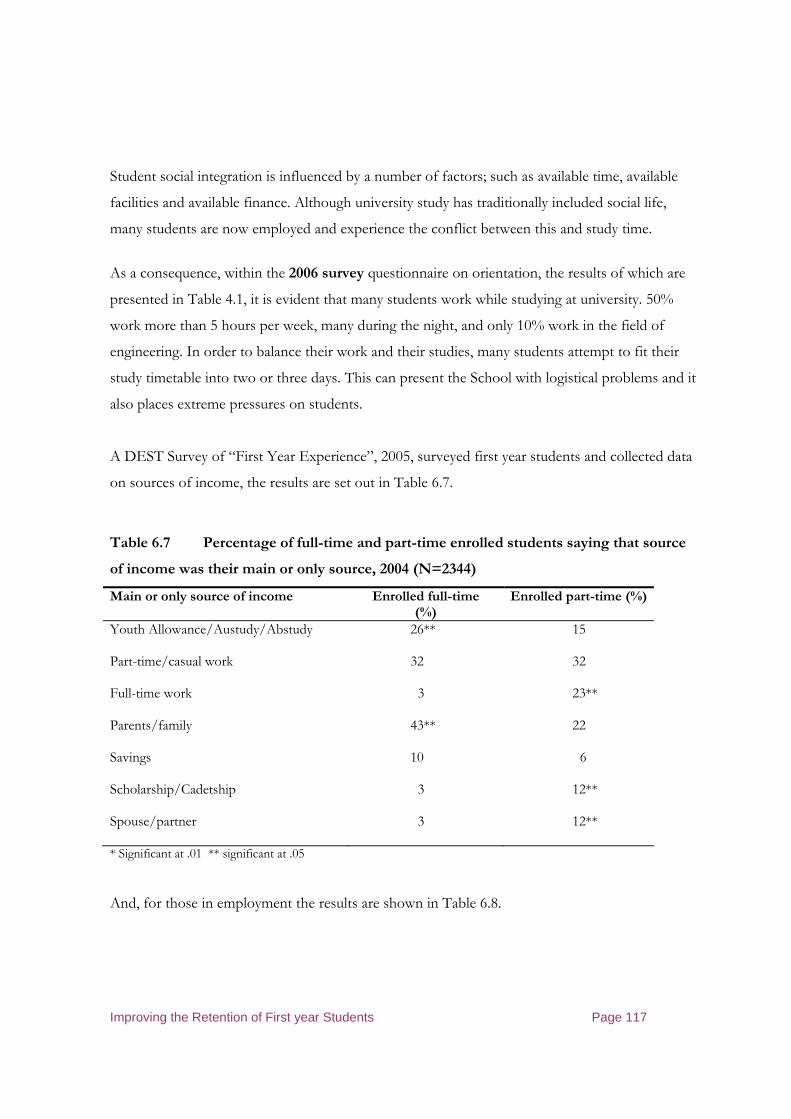
Improving the Retention of First year Students Page 117
Student social integration is influenced by a number of factors; such as available time, available
facilities and available finance. Although university study has traditionally included social life,
many students are now employed and experience the conflict between this and study time.
As a consequence, within the 2006 survey questionnaire on orientation, the results of which are
presented in Table 4.1, it is evident that many students work while studying at university. 50%
work more than 5 hours per week, many during the night, and only 10% work in the field of
engineering. In order to balance their work and their studies, many students attempt to fit their
study timetable into two or three days. This can present the School with logistical problems and it
also places extreme pressures on students.
A DEST Survey of “First Year Experience”, 2005, surveyed first year students and collected data
on sources of income, the results are set out in Table 6.7.
Table 6.7 Percentage of full-time and part-time enrolled students saying that source
of income was their main or only source, 2004 (N=2344)
Main or only source of income
Enrolled full-time (%)
Enrolled part-time (%)
Youth Allowance/Austudy/Abstudy
26** 15
Part-time/casual work
32 32
Full-time work
3 23**
Parents/family
43** 22
Savings
10 6
Scholarship/Cadetship
3 12**
Spouse/partner
3 12**
* Significant at .01 ** significant at .05
And, for those in employment the results are shown in Table 6.8.
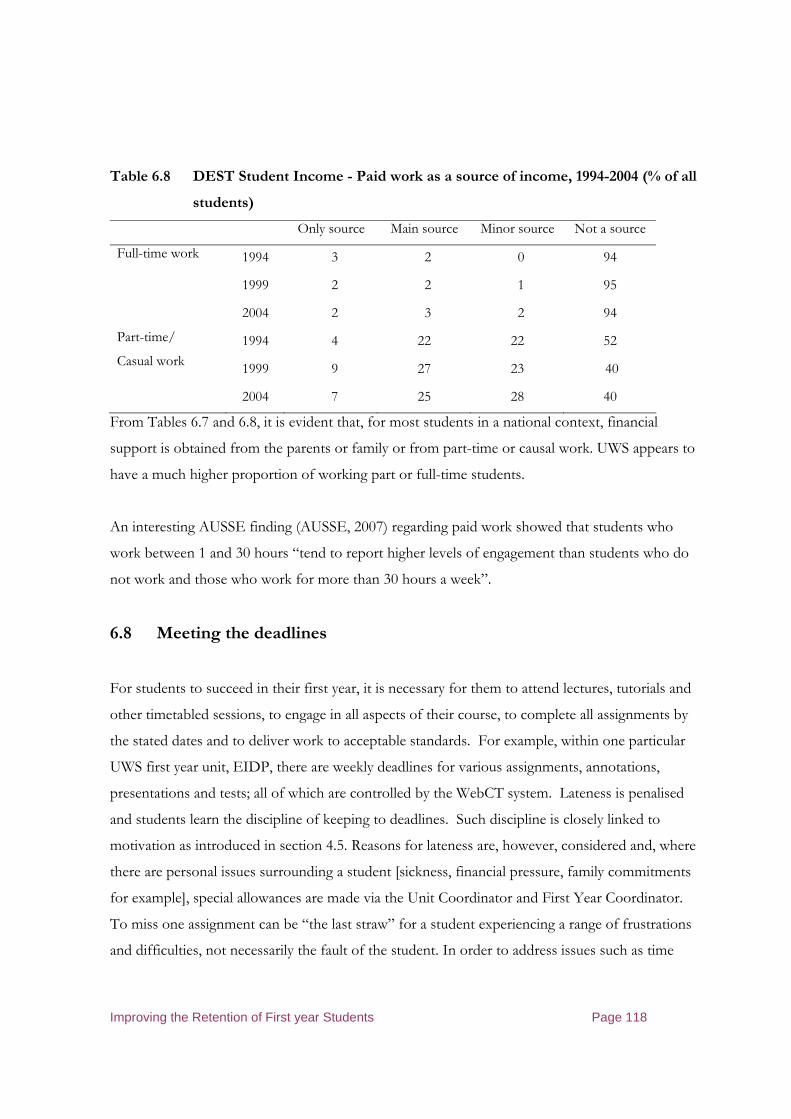
Improving the Retention of First year Students Page 118
Table 6.8 DEST Student Income - Paid work as a source of income, 1994-2004 (% of all
students)
Only source Main source Minor source Not a source
Full-time work 1994
1999
2004
3
2
2
2
2
3
0
1
2
94
95
94
Part-time/
Casual work
1994
1999
2004
4
9
7
22
27
25
22
23
28
52
40
40
From Tables 6.7 and 6.8, it is evident that, for most students in a national context, financial
support is obtained from the parents or family or from part-time or causal work. UWS appears to
have a much higher proportion of working part or full-time students.
An interesting AUSSE finding (AUSSE, 2007) regarding paid work showed that students who
work between 1 and 30 hours “tend to report higher levels of engagement than students who do
not work and those who work for more than 30 hours a week”.
6.8 Meeting the deadlines
For students to succeed in their first year, it is necessary for them to attend lectures, tutorials and
other timetabled sessions, to engage in all aspects of their course, to complete all assignments by
the stated dates and to deliver work to acceptable standards. For example, within one particular
UWS first year unit, EIDP, there are weekly deadlines for various assignments, annotations,
presentations and tests; all of which are controlled by the WebCT system. Lateness is penalised
and students learn the discipline of keeping to deadlines. Such discipline is closely linked to
motivation as introduced in section 4.5. Reasons for lateness are, however, considered and, where
there are personal issues surrounding a student [sickness, financial pressure, family commitments
for example], special allowances are made via the Unit Coordinator and First Year Coordinator.
To miss one assignment can be “the last straw” for a student experiencing a range of frustrations
and difficulties, not necessarily the fault of the student. In order to address issues such as time

Improving the Retention of First year Students Page 119
management, the School of Engineering has now introduced the Learning Guides to all students
and the schedule of attendance, assessments and deadlines is fully explained. An increased
awareness of student support is also regularly explained; by both academic staff and university
support staff.
For a number of reasons, such as conflicts with employment, difficulty in coping with studies,
personal circumstances such as finance or accommodation or travel, a student can be placed
under time pressures to both attend all lectures and classes and to submit all assignments on time.
If such conflicts and pressures accumulate, some students might consider dropping out, either on
a temporary basis or permanently. For this reason the message “Talk before you Walk” is
displayed and, if at all possible, reflected in classes and university activities, so that assistance can
be offered; see Figure 1.1. This demonstrates one of many strategies to reach those students
considering dropping out or those who may lack the confidence to come forward to seek help. If
such students are not assisted, there is a strong chance that they will become an attrition statistic.
6.9 Advice and Welcome from Senior School/College staff
In 2007, around 25 institutions took part in the Australasian Survey of Student
Engagement (AUSSE). 15 universities took part in the Staff Student Engagement Survey – a
cross-institutional survey of staff which, for the first time in Australasia, was about students. The
report concluded that, to enhance the management of educational programs and resources, more
should be done to develop this aspects of university education. AUSSE (2007, pp 17-18)
identified a deficit regarding the necessary student support to cope with non-academic challenges
& to help socialise
– 56.6% of students reported that institutions provide academic support “quite a bit” or “very
much”
BUT
– Only 15.7% say this for non-academic support (49.7% never supported; 34.6% sometimes
supported);
– 21% say support provided to socialise (37.6% never supported; 41.4% sometimes supported).

Improving the Retention of First year Students Page 120
Figure 6.4 AUSSE results for academic advising for specific experiences, for levels of
student engagement. (AUSSE, 2007)
Figure 6.5 Scores measuring the quality of academic advising (AUSSE, 2007)
These results can be compared with measures, by students, of their educational experience in
Figure 6.6 which strongly resemble the student perceptions seen in Figure 6.5. Students are seen
to score high for a supportive learning environment but poorly for staff/student interactions and
the ‘enriched’ educational experience. Students who have poor educational experiences and/or
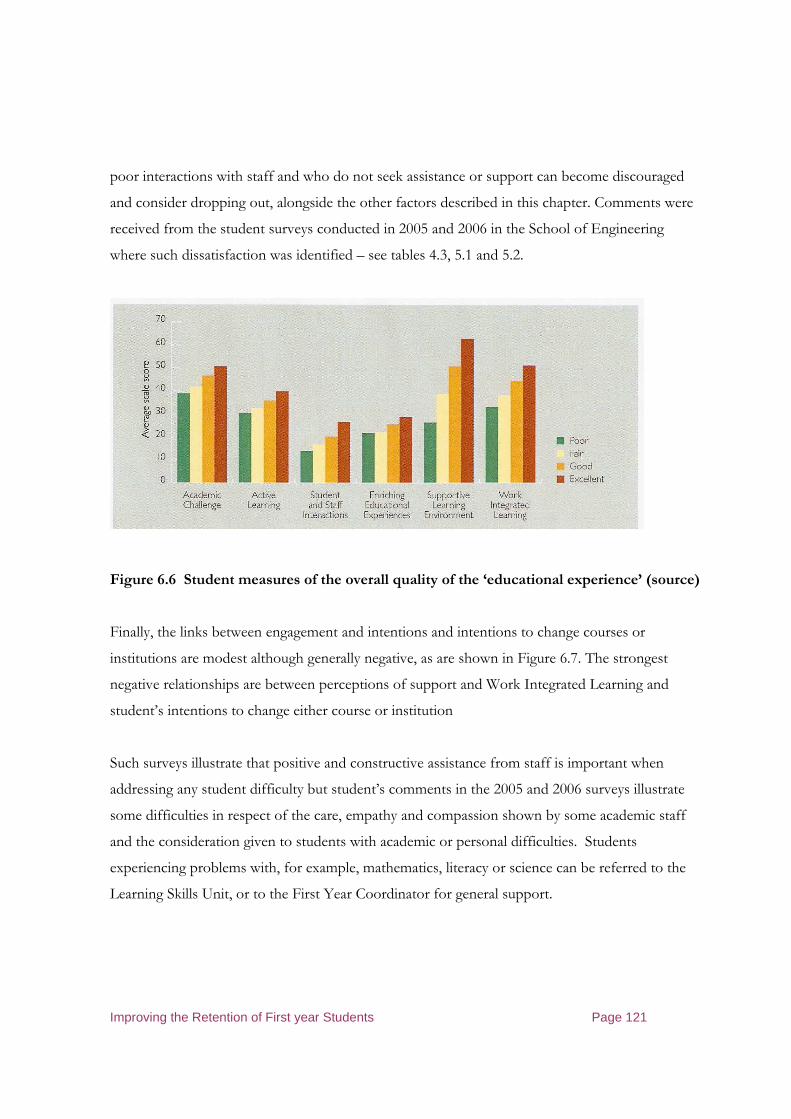
Improving the Retention of First year Students Page 121
poor interactions with staff and who do not seek assistance or support can become discouraged
and consider dropping out, alongside the other factors described in this chapter. Comments were
received from the student surveys conducted in 2005 and 2006 in the School of Engineering
where such dissatisfaction was identified – see tables 4.3, 5.1 and 5.2.
Figure 6.6 Student measures of the overall quality of the ‘educational experience’ (source)
Finally, the links between engagement and intentions and intentions to change courses or
institutions are modest although generally negative, as are shown in Figure 6.7. The strongest
negative relationships are between perceptions of support and Work Integrated Learning and
student’s intentions to change either course or institution
Such surveys illustrate that positive and constructive assistance from staff is important when
addressing any student difficulty but student’s comments in the 2005 and 2006 surveys illustrate
some difficulties in respect of the care, empathy and compassion shown by some academic staff
and the consideration given to students with academic or personal difficulties. Students
experiencing problems with, for example, mathematics, literacy or science can be referred to the
Learning Skills Unit, or to the First Year Coordinator for general support.
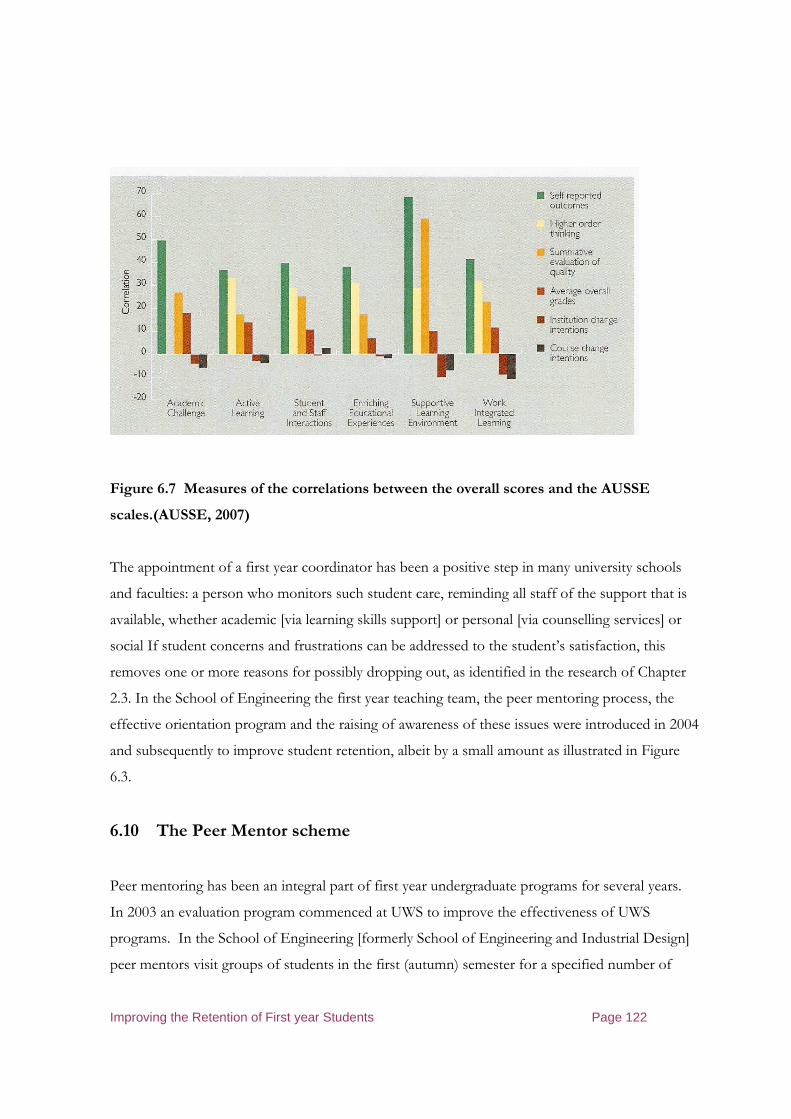
Improving the Retention of First year Students Page 122
Figure 6.7 Measures of the correlations between the overall scores and the AUSSE
scales.(AUSSE, 2007)
The appointment of a first year coordinator has been a positive step in many university schools
and faculties: a person who monitors such student care, reminding all staff of the support that is
available, whether academic [via learning skills support] or personal [via counselling services] or
social If student concerns and frustrations can be addressed to the student’s satisfaction, this
removes one or more reasons for possibly dropping out, as identified in the research of Chapter
2.3. In the School of Engineering the first year teaching team, the peer mentoring process, the
effective orientation program and the raising of awareness of these issues were introduced in 2004
and subsequently to improve student retention, albeit by a small amount as illustrated in Figure
6.3.
6.10 The Peer Mentor scheme
Peer mentoring has been an integral part of first year undergraduate programs for several years.
In 2003 an evaluation program commenced at UWS to improve the effectiveness of UWS
programs. In the School of Engineering [formerly School of Engineering and Industrial Design]
peer mentors visit groups of students in the first (autumn) semester for a specified number of
Improving the Retention of First year Students Page 123
times, one hour per visit, and peer mentors cover a range of issues which help to build the
confidence and ability of the undergraduate first year students.
Peer mentors for Engineering, Industrial Design and, now, Construction, degree courses are
recruited from the School of Engineering 2nd and subsequent year students and they are trained
prior to the commencement of the first semester. They are required to keep attendance records of
the groups that they mentor and provide reports on each session.
The results from several years are as follows:
Engineering and Industrial Design
• 1999 Failure rate dropped from 72.4% in 1997 to 52.4% in 1998, and the pass rate in 1999
was 71%.
• 2000 Pass rate steady at 71% with mentor program in Civil and Environmental
Engineering Practice. 65 attended.
• 2001 voluntary program. 3 attended.
• 2002 no program due to lack of school staff support.
• 2003 Introduction to Professional Practice showed a higher GPA for those who were
mentored (269 students) when compared with those who were not (200 students). The
mean GPA for the group who were mentored (2.95) was significantly higher ( a 75%
increase) than that of the group who were not mentored (1.71) for a comparison
excluding all students who withdrew without penalty. This increase compares with the
corresponding increase in retention from 2003 onwards, as part of a range of measures
which, as a package, aimed to increase student satisfaction and, as with peer mentoring,
offered a route to mentoring support to those students for whom it seemed appropriate.
From the quantitative and qualitative evaluations of the program over a number of years, it
appears that both first year students and mentors who participate gain considerably in terms of
skills and confidence. The greatest difficulty is encouragement of first year students to attend
sessions, and this is dependent on the support of the academics and schools involved.
Benchmarking with the University of Wollongong, which conducts an SI based program (PASS),

Improving the Retention of First year Students Page 124
indicates that it may be advisable to focus on fewer disciplines, particularly those with strong
support from academic staff and schools and which have difficult subjects with a high failure rate.
In 2006, 22 peer mentors were trained by the UWS School of Engineering to serve the 360 or so
first year students, some operating in pairs to serve the 19 streams of students:
Week 1, (both hours of the tutorial)
Week 2, (2nd hour of the tutorial)
Week 4, (2nd hour of the tutorial)
Week 8, (2nd hour of the tutorial)
Week 12, (2nd hour of the tutorial)
In 2007, with 23 groups of students, the required numbers of peer mentors proved difficult to
recruit so that a small number of student groups failed to meet their peer mentor. However,
some peer mentors volunteered to visit 2 or 3 groups and so a all student groups received peer
mentoring. It was decided, by the School Academic Committee to continue with a peer mentor
scheme in the first year semester due to ongoing successes, despite recruitment difficulties. First
year undergraduates meeting their more advanced peers can be a very successful and stimulating
experience, contributing to improved student retention, and supplementing support to students
who lack confidence or particular skills, for example, written communications.
6.11 Student Support Services, counselling
Many references have been made to student support from the university where counselling,
guidance, learning skills, chaplaincy and other support is freely available to every student. For
students living away from home, this can be the only form of personal guidance available; apart
from peer group support. The university outlines this support at orientation and, where possible,
reminds students throughout their first year.
Student support is available in many forms: from academic staff; from administrative staff, from
professional counsellors, from learning skills support staff and so on. In the same UWS Retention
Improving the Retention of First year Students Page 125
Telephone Survey as referred to in table 5.4, questions were put to first year students in 2005
about student support in order to assess the effectiveness of such services:
“Did you receive assistance, inside or outside of your course, that has helped with university study
skills, university writing or maths ?”
For the College, 27.7% replied Yes: 72.3% replied No. This response reflects the level of
awareness or student confidence in these services.
Students were also asked “What was the kind of assistance received ?”: the responses were:
• Preparation and bridging programs 32.3%
• Workshops 27.8%
• Web based resources 16.7%
• Peer Mentoring 8.6%
• Teaching provided within timetabled subjects 8.1%
• Booklets in writing and academic skills 6.6%
“What was the rating of assistance received ?”
For the College, 76.9% replied ok, good or excellent: 16.9% replied Not Used. These are
encouraging responses which are reflected in the surveys and CEQ data described elsewhere in
this thesis.
“Have you used other UWS Student Services ?”
For 2005 for the College 29.5% replied Yes
For 2006 the reply was 11.9% and for Penrith was 14.8%.
“What was the UWS Student Services most used 2006 and 2005 ?”

Improving the Retention of First year Students Page 126
• Careers and Employment 31.8% (20.3% in 2005)
• Learning and Study Skills 26%
• Other 16.2%
• Personal Counselling 12.1% (24.1% in 2005)
• Disability Support 9.8% (27.8% in 2005)
• Chaplaincy 4% (2.5% in 2005)
The careers and employment service, the highest in the above list and for university financial
reasons, ceased to be offered from 2007. The 26% for Learning Skills is encouraging in an
environment where many first-year students have difficulties with basic subjects such as
mathematics, science and English. The lower percentages for counselling and disability support
may be reflected in the organisational changes to Student Support Services introduced in 2006 and
2007, with staff reductions and consequential reductions in support.
“What was the rating of experience in using (other) Student Services ?”
For the College 87.5% replied ok, good or excellent
For Penrith 80.8% replied ok, good or excellent.
“Did you receive the UWS ‘Start Up’ kit ?” Yes 86.3%: No 13.7%
“If received, was it useful ?” Yes 76.5% No 23.5%
This kit is no longer supplied – one of the consequences of university financial pressures.
The Learning Skills Unit, part of Student Support Services, offers a wide range of study skills for
students who may have difficulties reading, speaking or writing in English. These include

Improving the Retention of First year Students Page 127
Essay Structure 2 hours
Academic Writing Style 2 hours
Essay Writing 4 hours
Referencing 3 hours
Critical Thinking 2 hours
Scientific Report Writing 2 hours
Spoken English 4 x 1 hour
Grammar and Writing 4 x 1 hour
Developing your Writing 5 x 1 hour.
Many sessions are offered at different campuses and many are available during the lunch period or
late afternoon/evening, for the convenience of the students. Such programs, and programs in
mathematical skills, run by demand, are free to students and are encouraged for students who do
not possess the Australian HSC qualifications, students who come from no-English speaking
countries or homes where English is not the first language.
6.12 The Campus
‘University life’ for many potential students, comprises studies supplemented by social and sports
events and activities with friends or fellow students. However, one limiting factor with such
activities is the available time between studies and classes and employment. Travel to the UWS
Kingswood campus requires students to either drive or to use public transport but the campus
buildings are positioned a km or so from the nearest railway station. A local UWS bus carries
students between the railway station and the campus buildings so, in the 2006 survey one
question was asked about travel to the Penrith Campus and the result from Table 4.1, question 20.
Of the responses, the majority of students 40% travel for one to two hours per day and 41%
taking two hours or more. Consequently, many students, because of the geographical position of
the campus, do not have the free time to enjoy social and sports activities, before or after classes.
Many students live in the Sydney region, some north or south of the CBD and so travel by car or
train can take two hours each way for every visit to the campus. For this reason, these students
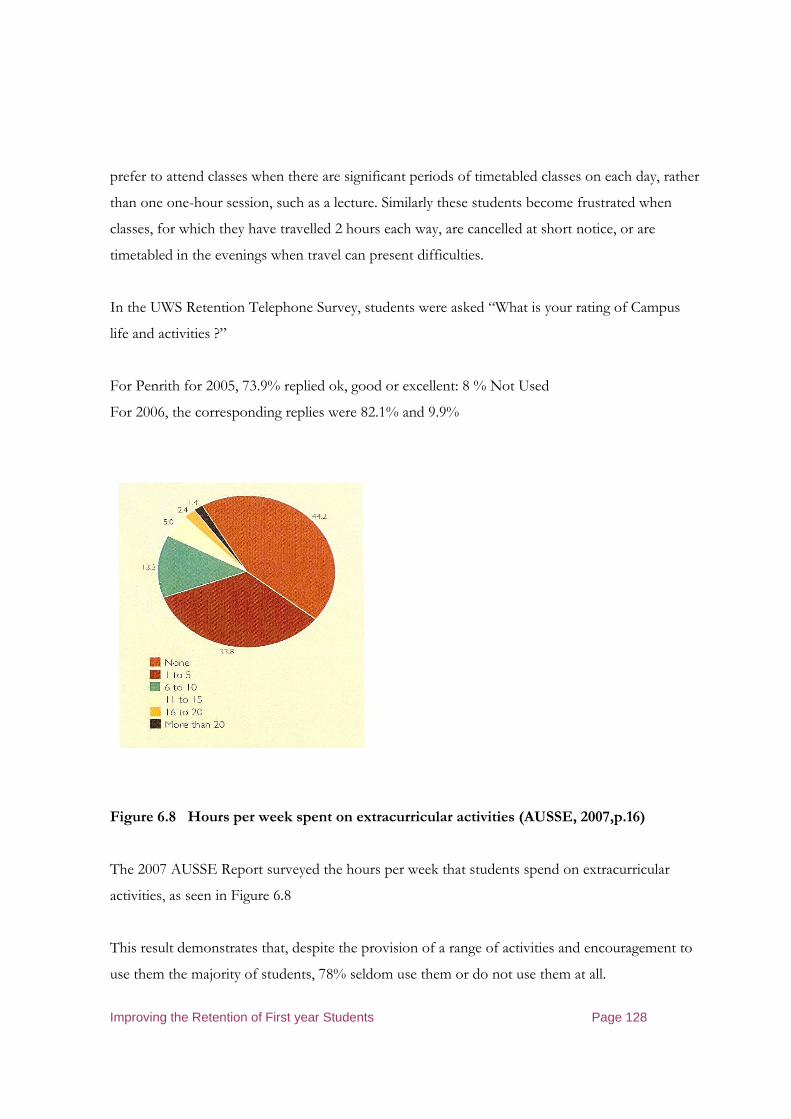
Improving the Retention of First year Students Page 128
prefer to attend classes when there are significant periods of timetabled classes on each day, rather
than one one-hour session, such as a lecture. Similarly these students become frustrated when
classes, for which they have travelled 2 hours each way, are cancelled at short notice, or are
timetabled in the evenings when travel can present difficulties.
In the UWS Retention Telephone Survey, students were asked “What is your rating of Campus
life and activities ?”
For Penrith for 2005, 73.9% replied ok, good or excellent: 8 % Not Used
For 2006, the corresponding replies were 82.1% and 9.9%
Figure 6.8 Hours per week spent on extracurricular activities (AUSSE, 2007,p.16)
The 2007 AUSSE Report surveyed the hours per week that students spend on extracurricular
activities, as seen in Figure 6.8
This result demonstrates that, despite the provision of a range of activities and encouragement to
use them the majority of students, 78% seldom use them or do not use them at all.
Improving the Retention of First year Students Page 129
The DEST 2005 “First Year Experience” report surveyed students on their weekly schedule with
the results set out in Table 6.9.
The impact of employment in 2004, as compared with 1994, is significant. Also, the weekly time
spent on many activities, some related to study, has greatly reduced since 1994. Campus sports
facilities are no longer a high priority for university students, on average, whereas the time spent
on commuting is significant.
6.13 Staff communications and accessibility
Students access academic staff in a number of ways, to ask specific academic questions or to seek
clarity; to seek advice on careers or future studies; to ask personal questions or to seek comments
on an assignment before or after submitting it for marking. Students can access staff during
tutorial, during practical laboratory sessions, before or after the weekly lecture, via e-mail or
telephone or by attending the office of the staff member during the advertised consultation
times. Students are made aware of the consultation times from the staff member or by reading
notices on the office doors. Staff can communicate with one or more students, or whole classes or
units of students, via WebCT. For this reason, all students are encouraged to check their
messages on a daily basis.
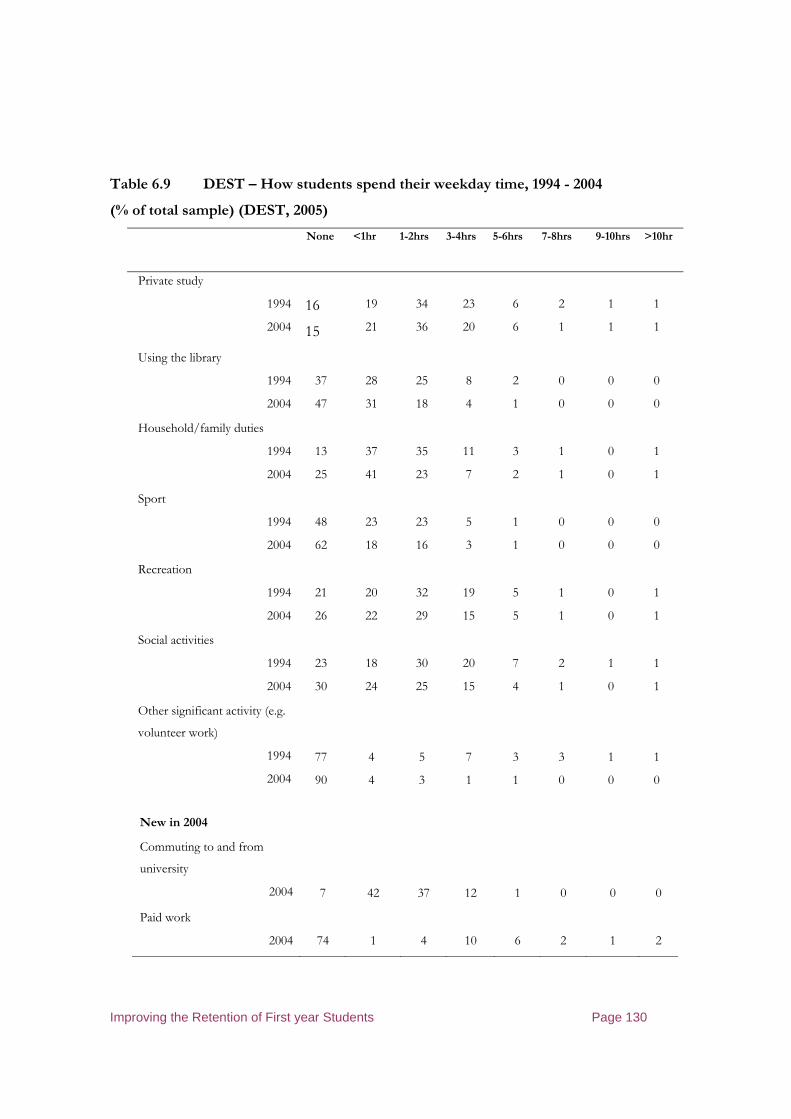
Improving the Retention of First year Students Page 130
Table 6.9 DEST – How students spend their weekday time, 1994 - 2004
(% of total sample) (DEST, 2005)
None <1hr 1-2hrs 3-4hrs 5-6hrs 7-8hrs 9-10hrs >10hr
Private study
1994
2004
16
15
19
21
34
36
23
20
6
6
2
1
1
1
1
1
Using the library
1994
2004
37
47
28
31
25
18
8
4
2
1
0
0
0
0
0
0
Household/family duties
1994
2004
13
25
37
41
35
23
11
7
3
2
1
1
0
0
1
1
Sport
1994
2004
48
62
23
18
23
16
5
3
1
1
0
0
0
0
0
0
Recreation
1994
2004
21
26
20
22
32
29
19
15
5
5
1
1
0
0
1
1
Social activities
1994
2004
23
30
18
24
30
25
20
15
7
4
2
1
1
0
1
1
Other significant activity (e.g.
volunteer work)
1994
2004
77
90
4
4
5
3
7
1
3
1
3
0
1
0
1
0
New in 2004
Commuting to and from
university
2004
7
42
37
12
1
0
0
0
Paid work
2004
74
1
4
10
6
2
1
2
Improving the Retention of First year Students Page 131
The objective of this thesis is to “analyse possible reasons why students discontinue and identifies
strategies and approaches to retaining these students through improvements to the quality of the
teaching and learning environment”. Effective communications with staff, an essential component
of the teaching and learning process, is vital in motivating and retaining students at university.
Students, in the 2005/2006 telephone survey analysis, were asked: “What is the method mostly
used to communicate with staff ?”
For 2006, 44.4% of students replied: “Face to face:” 36% replied E-Mail, 16.6% replied WebCT
and 3% replied telephone.
With respect to “Staff accessibility”:
For 2005, for the College 86% of students replied ok, good or excellent
For 2006 the corresponding reply was 90.4% which is a higher rating than the 2005 (Enrolment)
survey referred to above which was carried out during the second semester when most students
were familiar with the overall level of communications with staff and their responses were based
on ten months at uni as compared with three weeks in the telephone survey.
However such responses could possibly be distorted due to the Hawthorne effect – responses to
questions about ‘staff’ being rated higher due the psychological stimulus of being singled out and
made to feel important.
6.14 Discussion
The research referred to in this chapter aimed to identify links between student retention with the
learning and teaching process. Zimiate (2006) and other researchers in the literature review said
that student retention should be closely linked with ‘good teaching’ and the student experience.
The evidence is based on research into the links between the many aspects of the programme of
study such as
• Week 1 and introduction to study skills, the Learning Guides, assessment plans and so on
• Quality teaching and learning

Improving the Retention of First year Students Page 132
• Effective e-learning and other materials
• Academic mentoring
• Student support
• Learning skills support.
• Staff accessibility and approachability and
• Conflicts between study time and employment.
Students experience degrees of satisfaction with each of the above aspects of their studies and,
coupled with their individual qualifications and experiences, each student follows an individual
path, so quantitative analysis is complex. Overall satisfaction is measured by DEST and the CEQ
and, in academic terms, examination success.
Student motivation, progress and ability to cope with the workload in the first year is highly
dependent on the learning activities; whether in the classroom and laboratory, whether on
WebCT; whether during assessment processes and whether students receive support and a
positive attitude from the academic staff. Other issues such as administration, accommodation or
personal traumas are ongoing and, if aggravated by problems with learning, can “tip the balance”
and cause a personal crisis or period of depression for the student who then might require
intervention by a Unit Coordinator, First Year Coordinator, counsellor or peer mentor. Many
students drop out because of a build up of tensions and stresses during the first year but their
state of mind does not direct them to a source of positive assistance: instead they distance
themselves from the university and, after a period of absence and accumulative missed
assignments or other demands, choose to leave or defer their course until a later date.
Despite the anecdotal evidence there is no sufficient data to establish whether all the actions to
improve teaching and learning have a direct impact on improving retention in the School of
engineering. There are too many interacting factors to unscramble the direct causes of
improvement in retention. Nevertheless, as far as satisfaction is concerned in relation to a number
of aspects of teaching and learning, there is no doubt that there has been an improvement. Clearly
Improving the Retention of First year Students Page 133
mentoring and personal contact with staff and mentors are important factors in improving
student performance and hence the commitment of students to remain at university. But as was
shown in the literature review and this chapter, many of the factors that determine attitudes and
commitment to learning are personal and beyond the ability of the School or University to
influence.

Improving the Retention of First year Students Page 134
7 Progression – Student Retention Issues
The survey also found that many students had negative views of teaching and their courses. In particular, it was notable that:
� barely half the students surveyed found their subjects interesting; � only 53 per cent of students thought academic staff were enthusiastic about the subjects they were teaching; � less than half thought that teaching staff were good at explaining things; � only 41 per cent of students thought there was a positive attitude towards learning amongst their fellow
students; and � over a quarter of the students worked in isolation from their peers and were not interested in extra-
curricular activities DEST The First Year Experience, 2005
7.1 Introduction
This chapter describes the results of research carried out into the fourth stage of the Student
Pathway, namely progression into the second year or, for those choosing to transfer elsewhere,
progression to another university or employment or elsewhere. This chapter also describes
measures taken by other universities, such as the University of Tasmania, where retention is
addressed and the results of their efforts are compared with similar measures introduced at UWS.
Once again, the focus is on the hypothesis that retention can be improved by introducing
measures to facilitate these improvements.
All data referred to in this thesis is public information as published by DEST or at public
presentations by individual universities or in published papers.
7.2 Student Retention data
The UWS Action Plan 2005 stated a retention target:
Improving the Retention of First year Students Page 135
“Target
We have set an ambitious target of reducing the first year drop out rate by 25%. On last
year’s figures this would mean that we would lose 1140 UWS students in year one, not
1520. “
Measures to improve student retention were introduced over a period commencing in 2003 and
described in chapters 4 to 7, resulted in an overall progressive improvement in student retention
in the UWS School of Engineering over this period. Table 1.2, derived from university data
collected over four years, illustrates the accumulative numbers of students who discontinued as
the 2003, 2004 and 2005 cohorts progressed from the commencement of their courses in
February 2003, 2004 or 2005:
Student numbers discontinuing in the first year in 2003, from the 2003 cohort = 20%;
Student numbers discontinuing in the first year in 2004, from the 2004 cohort = 17%; and
Student numbers discontinuing in the first year in 2005, from the 2005 cohort = 15%.
Following the 2005 Course Report referred to in chapter 1, the School of Engineering and
Industrial Design identified the need to address some of its key issues , namely retention,
progression, UAI and loading, as discussed in Chapter 1. The School was mindful that many of
the statements made in the CEQs related to the teaching quality of staff and their interaction with
the students. The First Year Teaching Team was formed to address this issue and also the
comments relating to the School of Engineering [and Industrial Design] within the report on the
Course Experience Questionnaire [CEQ] where “Best Aspects” and “Needs Improvement” were
identified. Examples of areas of improvement from the CEQ were:
For Environmental and Civil courses the lectures and real world examples were ‘good
points’. ‘Needing improvement’ was the range of electives and resources.
For Robotics and Mechatronics courses, it was the practicals and content that were ‘good
points’. Communication skills of the staff needed improving.
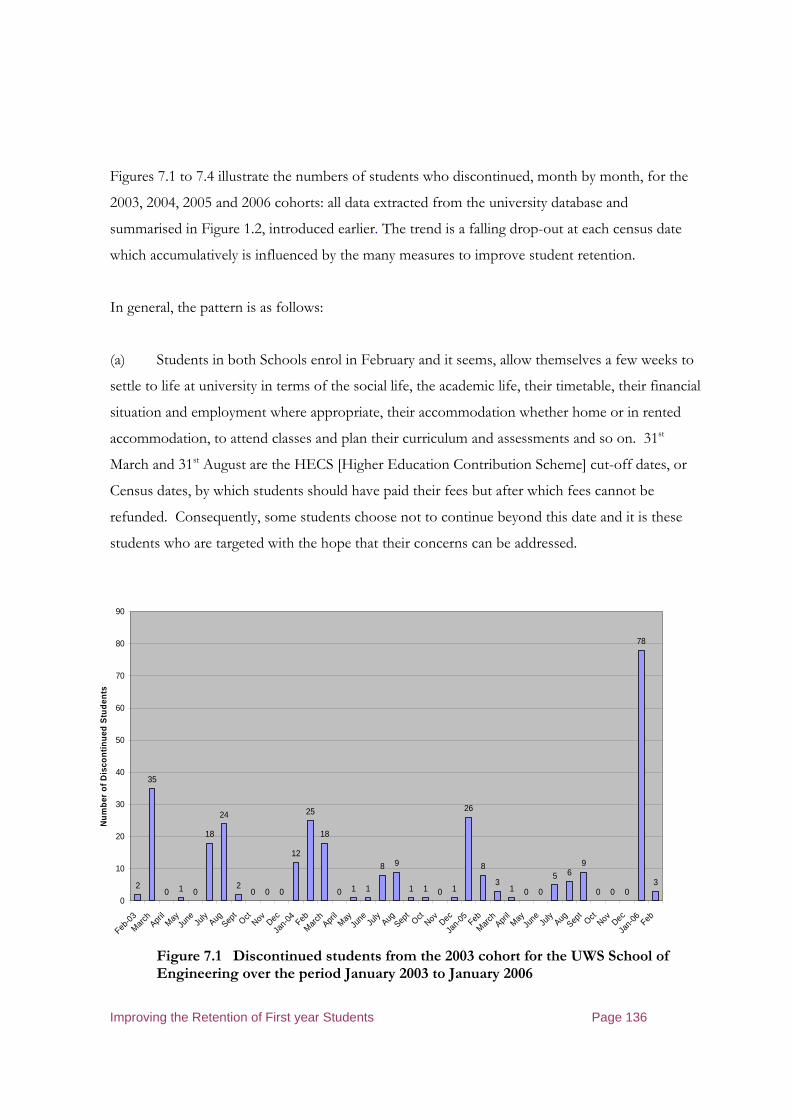
Improving the Retention of First year Students Page 136
Figures 7.1 to 7.4 illustrate the numbers of students who discontinued, month by month, for the
2003, 2004, 2005 and 2006 cohorts: all data extracted from the university database and
summarised in Figure 1.2, introduced earlier. The trend is a falling drop-out at each census date
which accumulatively is influenced by the many measures to improve student retention.
In general, the pattern is as follows:
(a) Students in both Schools enrol in February and it seems, allow themselves a few weeks to
settle to life at university in terms of the social life, the academic life, their timetable, their financial
situation and employment where appropriate, their accommodation whether home or in rented
accommodation, to attend classes and plan their curriculum and assessments and so on. 31st
March and 31st August are the HECS [Higher Education Contribution Scheme] cut-off dates, or
Census dates, by which students should have paid their fees but after which fees cannot be
refunded. Consequently, some students choose not to continue beyond this date and it is these
students who are targeted with the hope that their concerns can be addressed.
Discontinued Students from 2003 Cohort
2
35
0 1 0
18
24
20 0 0
12
25
18
0 1 1
8 9
1 1 0 1
26
8
31 0 0
5 69
0 0 0
78
3
0
10
20
30
40
50
60
70
80
90
Feb-0
3
March
April
MayJu
ne July
AugSep
tOct
Nov Dec
Jan-
04 Feb
March
April
MayJu
ne July
AugSep
tOct
NovDec
Jan-
05 Feb
March
April
MayJu
ne July
AugSep
tOct
NovDec
Jan-
06 Feb
Num
ber
of D
isco
ntin
ued
Stu
dent
s
Figure 7.1 Discontinued students from the 2003 cohort for the UWS School of Engineering over the period January 2003 to January 2006
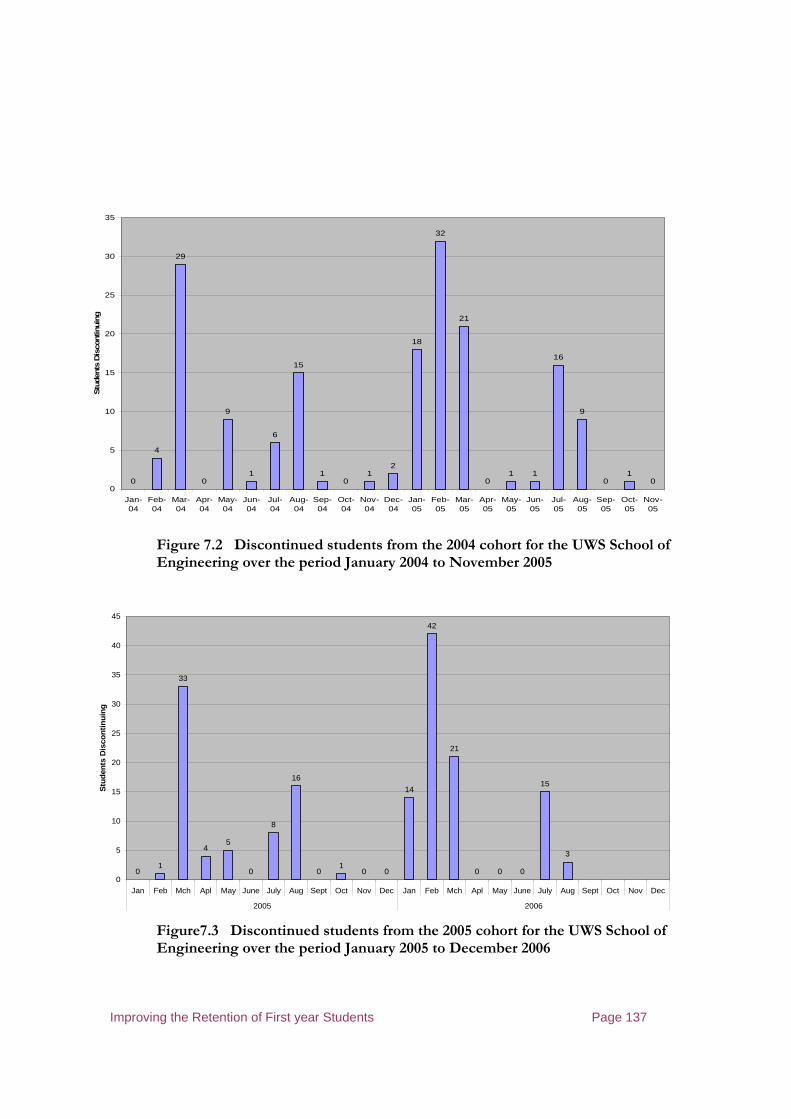
Improving the Retention of First year Students Page 137
1st year Student Drop-out 2004 - SE
0
4
29
0
9
1
6
15
10
12
18
32
21
01 1
16
9
01
00
5
10
15
20
25
30
35
Jan-04
Feb-04
Mar-04
Apr-04
May-04
Jun-04
Jul-04
Aug-04
Sep-04
Oct-04
Nov-04
Dec-04
Jan-05
Feb-05
Mar-05
Apr-05
May-05
Jun-05
Jul-05
Aug-05
Sep-05
Oct-05
Nov-05
Stu
dent
s D
isco
ntin
uing
Figure 7.2 Discontinued students from the 2004 cohort for the UWS School of Engineering over the period January 2004 to November 2005
First Year Student Drop-out 2005 - SE
01
33
45
0
8
16
01
0 0
14
42
21
0 0 0
15
3
0
5
10
15
20
25
30
35
40
45
Jan Feb Mch Apl May June July Aug Sept Oct Nov Dec Jan Feb Mch Apl May June July Aug Sept Oct Nov Dec
2005 2006
Stu
dent
s D
isco
ntin
uing
Figure7.3 Discontinued students from the 2005 cohort for the UWS School of Engineering over the period January 2005 to December 2006
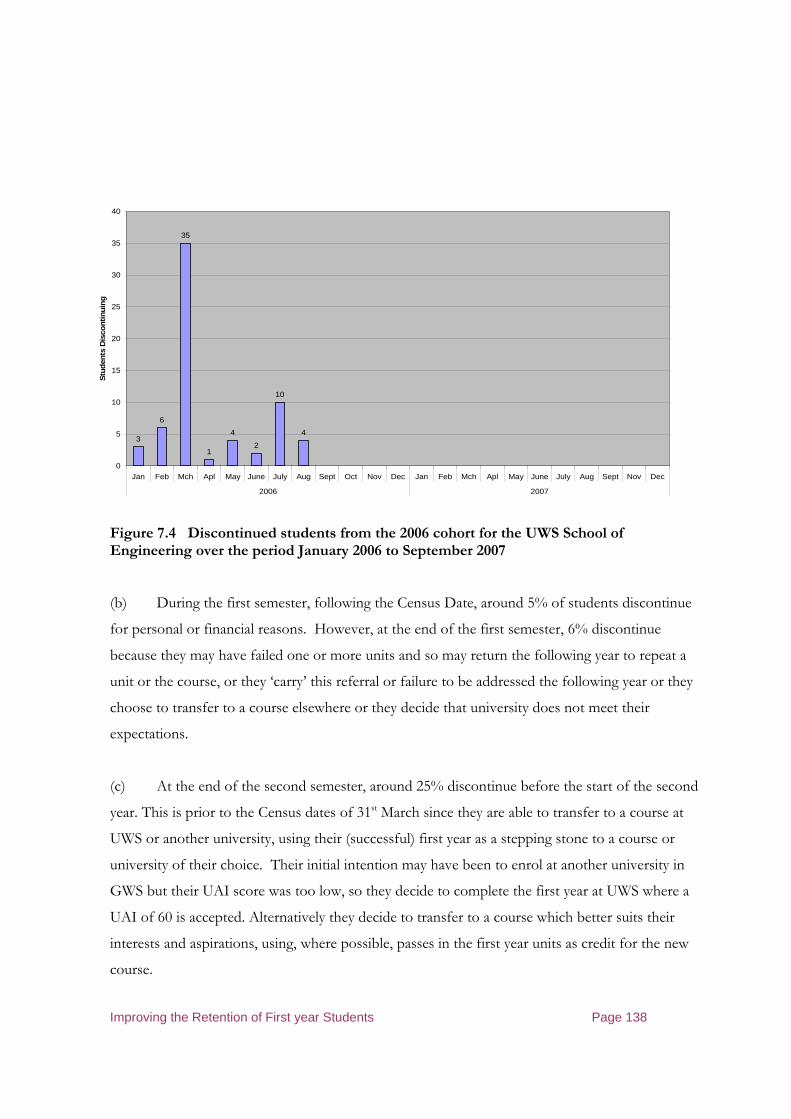
Improving the Retention of First year Students Page 138
1st Year Student Drop-out 2006 - SE
3
6
35
1
4
2
10
4
0
5
10
15
20
25
30
35
40
Jan Feb Mch Apl May June July Aug Sept Oct Nov Dec Jan Feb Mch Apl May June July Aug Sept Nov Dec
2006 2007
Stu
dent
s D
isco
ntin
uing
Figure 7.4 Discontinued students from the 2006 cohort for the UWS School of Engineering over the period January 2006 to September 2007 (b) During the first semester, following the Census Date, around 5% of students discontinue
for personal or financial reasons. However, at the end of the first semester, 6% discontinue
because they may have failed one or more units and so may return the following year to repeat a
unit or the course, or they ‘carry’ this referral or failure to be addressed the following year or they
choose to transfer to a course elsewhere or they decide that university does not meet their
expectations.
(c) At the end of the second semester, around 25% discontinue before the start of the second
year. This is prior to the Census dates of 31st March since they are able to transfer to a course at
UWS or another university, using their (successful) first year as a stepping stone to a course or
university of their choice. Their initial intention may have been to enrol at another university in
GWS but their UAI score was too low, so they decide to complete the first year at UWS where a
UAI of 60 is accepted. Alternatively they decide to transfer to a course which better suits their
interests and aspirations, using, where possible, passes in the first year units as credit for the new
course.
Improving the Retention of First year Students Page 139
(d) Subsequently, having passed the Census date, the remaining students continue through
year 2 with a small number discontinuing during each semester (20 in the first semester out of the
2003 cohort and 3 in the second semester) and a greater number, (around 37, or for 2003, 9 % of
the original cohort) dropping out between year 2 and year 3, because they have failed units or are
repeating units or are transferring elsewhere.
(e) A similar pattern continues for following years, with most students dropping out
between semesters. However, many students choose to work part-time or full-time while studying
and this influences, over several years, their study time, their degree of success in each year and
the personal pressures on themselves. Many opt out as they find difficulty coping but can return
in later years to continue their studies.
The measurement of 78 for January 2006 corresponds to the graduation of 78 students from the
2003 cohort, these students being catagorised as ‘withdrawing’ on the university database.
Comparisons of the data for the 2004 and 2005 cohorts of Figures 7.2 and 7.3 , shows a
significant correlation between the two cohorts., measured over the two academic years when the
data is analysed as described in (a) to (e) above. A similar pattern is evident for the 2003 and the
2006 data.
The School of Environment and Agriculture (Figure 1.3) displays a very similar pattern of
discontinuance to that for the School of Engineering. These two schools on different
campuses, each experiencing a similar drop-out pattern
The courses within the School of Environment and Agriculture courses to which this data was
taken , sited at the UWS Hawkesbury campus, were:
206A Bachelor of Arts (Tourism)
407A Bachelor of Applied Science (Environmental Management and Tourism)
3544 Bachelor of Landscape Management and Conservation

Improving the Retention of First year Students Page 140
3569 Bachelor of Applied Science (Environmental Health)
3570 Bachelor of Applied Science (Environmental Management)
3571 Bachelor of Systems Agriculture
3572 Bachelor of Equine Studies
3586 Bachelor of Environmental Science
3592 Bachelor of Animal Science
There are also financial and personal costs of students dropping out, which have been
discussed previously.
Mention has been made in each chapter of the complex nature of proving the hypothesis that first
year student retention can be improved. The research described in chapter 2 described many
factors relating to transition, pre-entry, orientation and first year teaching but little research was
evident regarding the progression phase where, as experienced at UWS, students choose an
engineering degree at UWS with a low UAI and then transfer to another university on successful
completion or year 1. Efforts are made to retain students by aiming for high quality teaching and
support but considerable persuasion is required if the student tolerates four hours of travel per
day or they work: geographical or financial reasons which cannot easily be resolved. The offer of
scholarships to successful first year students is one option, together with pathways to honours
streams or postgraduate programs not available elsewhere.
7.3 Exit Surveys
The university carries out exit surveys of students when they leave: at whatever stage in their
degree studies. This is a voluntary exercise with around 50% response. The data is not specific to
a school or college but provides indications of the reasons, in ‘university’ terms, why students
drop out. In 2004, around 5000 students were enrolled across UWS but 1,520 enrolled and then
withdrew, around 25% drop-out. This data is useful in this research inasmuch as it confirms the
outcomes of the research described in Chapter 2 but applied to students who have chosen to opt
out, rather than to reconsider their decision following advice or support, if sought. Equivalent
data is not available for the School of Engineering and so the research into student retention

Improving the Retention of First year Students Page 141
would require extension if data is to be obtained and correlated with earlier findings. These exiting
students were asked for the reasons why they withdrew and the results were:
Course was not as expected 35%
Conflicting employment commitments 24%
Administrative fees and other difficulties 20%
Assessment expectations unclear 16%
Timetable difficulties 16%
Pressurised to enrol 15%
Family pressures 13%
Staff difficult to access 10%
Unmotivated teaching /learning 9% and
Financial difficulties 9%.
Many of these reasons are interlinked. For example, a student’s family may put pressure on their
child to enrol at university because, as introduced in the orientation survey, many students come
from families where parents have qualified to degree level. Also, employment conflicts can be
linked to timetable difficulties.
These results concur with the survey feedback described in Chapter 5 where students in the 21st
century have greater financial pressures and choose to work alongside their studies which reduces
their overall study time and reduces the time for university social life.
Feedback from students on reasons for discontinuing is echoed by other universities. For
example, at the University of Tasmania, (Carlson, 2006) students gave the following reason or
reasons why they discontinued:
54% of students withdrew for non-university reasons;
46% therefore said university-related factors had contributed to their withdrawal;
22% had transferred to other units;
33% had attended no classes and
Under institutional control with respect to appropriate advice and guidance prior to enrolment and commencement
Primarily due to student personal choices
Under Institutional control
Improving the Retention of First year Students Page 142
60% stated their intention to re-enrol later.
Some students at AUT choose to attend no classes, due to other commitments, travel restrictions
or other priorities, and so they rely primarily on the lecture notes posted on WebCT, These same
students attend, however, when attendance is recorded or when assignments are set and the
marks can contribute towards their final grade,
Also in the University of Tasmania, 18.5% indicated overload at the start of their course but, by
contrast,
17% claimed insufficient pre-enrolment information;
14% said that university was not a welcoming place;
14% said it was difficult to make friends;
14% said the teaching methods did not suit them and
12% complained of excessive workload.
These results concur with the survey results described in earlier chapters; effective orientation programs
addressing several issues [see Chapter 5] and on-going encouragement to seek guidance [see Chapter 6]
addressing the remainder.
7.4 Progression to other universities
In the UWS School of Engineering, it became evident, in January 2005, that fifty students from
the 2004 cohort had transferred to engineering courses at the University of Technology, Sydney
[UTS], following information obtained from Dr. David Lowe, Associate Dean [Teaching and
Learning] Faculty of Engineering. These students, which contributed 15 percentage points of the
school’s attrition in 2004, successfully completed their first undergraduate year at UWS, entering
UWS in 2004 because they did not meet the prerequisites of UTS. These fifty students are
included in the retention statistics, such as Table 1.2.
Many students enrol at UWS because their entry qualifications and/or UAI do not match the
requirements of other universities: universities which ‘require’ minimum entry UAI scores and

Improving the Retention of First year Students Page 143
HSC passes rather than, as at UWS, ‘recommended’. These students may live in areas more
accessible to the Sydney CDB universities than UWS but they tolerate such inconvenience with
the intention of transferring to the Sydney CBD 12 months later. Such students require to pass,
often with credit or distinction, eight units, each with 10 credit points, for progression elsewhere
and so they are highly motivated. UWS could, therefore, be described as a feeder institution for
some students.. One strategy for retaining students at universities, rather than observe them
moving from, say, UWS to another Sydney university, is to encourage students to benefit from
the Learning and Teaching Performance Fund (LTPF) which was introduced in 2006 to reward
universities for excellence in learning and teaching for undergraduates. Undergraduates could
be offered scholarships to remain at UWS and complete their course, possibly to Honours or
beyond. Many would agree that the LTPF has contributed to the focusing of universities’ on
learning and teaching policies and practices, and the quality of learning and teaching.
7.5 Discussion
This chapter discussed the retention issues associated with the overall student experience – a
degree of satisfaction on which is based, for many students, progression into year 2 at the Host
University or transfer to another university – even if the student’s original intention was to stay
with the host university and transfer elsewhere. Recommendations described in Chapter 8 often
refer to the close liaison between student drop-out and an accumulation of difficulties in the areas
of the pathway introduced in chapter 2.
Was the target of losing 1140 students, rather than 1520, achieved in 2006 ?
With regard to the university, the percentage of first year students who discontinued fell by
16% [lower than the target of 25%] in 2006 as compared with the 2004 figure. For the School
of Engineering, the data shows that 119 first year students dropped out from the 2004 cohort
whereas 116 dropped out from the 2006 cohort which is insignificant. There are many reasons
for this apparent limited improvement within this school. These include:

Improving the Retention of First year Students Page 144
• The growing dependency of students, year by year, on employment and so reduced
study times and associated pressures, resulting in increased pressure to drop out or
switch to part-time study [identified as ‘discontinued’ within the data];
• Structural course changes took place in 2005/2006 which distorts the data;
• The definition of ‘drop-out’ or discontinuation and their timelines can be inconsistent
between sets of data; e.g. using December or March or census date as the cut off date;
and
• The resultant effects of retention improvement take several years to mature or
materialise – some requiring an injection of resources in subsequent years, such as at
UWS where, in 2009 a major retention project is under way.
Improving the Retention of First year Students Page 145
8 Conclusions, Recommendations and Future Work
Overall, however, only eight per cent of students in 1955/6 indicated they had not enjoyed their time at
university. Nevertheless, 53 per cent, although satisfied intellectually, expressed some reservations about
other aspects of their experience. The report of the first major Australian study concluded that when a
number of personal problems were encountered by students a pattern of failure resulted. Students who did
well were those who were favourably endowed in terms of finance, family occupation, and family tradition of
university study.
DEST The First Year Experience, 2005
This research concludes that, in general terms, “there are no magic bullets, single solutions or
golden rules” to improve student retention for first year students, for a number of reasons. Some
of the reasons for attrition are institutional, some social, some financial and some are long term
and primarily attitudinal. This chapter addresses the hypothesis that student retention can be
improved by introducing measures to facilitate that improvement.. The findings follow the
phases of the student pathway and conclude with a strategy for the improvement of student
retention.
Transition to University [Chapter 4]
1. Prior to enrolment, students should be aware of the academic requirements in terms of
entry qualifications, e.g. mathematics and science for engineering courses – the 2005
{enrolment} survey
2. Effective academic advice, counselling and support is essential and this should include
a. Clarity with the expectations of the university regarding commitment and
engagement
b. Full information on the course of study, its assessment requirements and
timescales
c. Ongoing encouragement to seek advice and assistance whenever required - CEQ
Feedback
Improving the Retention of First year Students Page 146
3. Academic staff should have an awareness of some students being at risk due to, for
example
a. student age
b. cultural and family background
c. student travel time
d. student employment and the conflicts of time - the Students at Risk Project
4. The transition from High School to university study is identified as a major hurdle for
students in terms of modes of study, levels of available support, academic expectations
and, sometimes, as concluded in the 2006 Survey, financial pressures; many students
having to earn income alongside university study. – 2005 {enrolment} survey
Enrolment and Orientation [Chapter 5]
Within the School of Engineering,
1. A ‘mentoring culture’ is suggested where all students are encouraged to seek assistance
and, when needed, this is provided in a caring manner and followed up. This includes
learning skills support where the need is identified. – 2006 {orientation} survey
2. Academic advice is comprehensive and meaningful prior to enrolment and prior to entry
into the course. Students at risk should be identified and programs designed to their
requirements. – 2006 {orientation} survey
3. The orientation program should include social, course, campus and other elements and
include an ongoing mentoring culture throughout the first semester – 2006 {orientation}
survey
Chapter 5 described how the transition from high school to university is assisted by an
‘institutional mentoring culture’, supplementary bridging courses to students with low HSC passes
Improving the Retention of First year Students Page 147
in mathematics and physics followed by the orientation process. Only 17% of engineering
students in 2006 Survey possessed the recommended entry qualifications. The orientation
program introduces students to key staff, processes, procedures and university life in general.
Chapter 5 followed the development of an orientation program at UWS so that its effectiveness
was improved as a preparation for students entering the first semester. The importance of a ‘user
friendly’ environment during the orientation process was evident in the 2005 and 2006 Surveys,
with staff ‘approachability and attitude’ being seen as important at the commencement of their
studies.
Teaching and Learning [Chapter 6]
Quality learning and teaching should be the target, to maximise student success and satisfaction,
including elements such as:
• Week 1 and an introduction to study skills, the Learning Guides, assessment plans and
student expectations
• Quality teaching and learning
• Effective e-learning and other materials
• Academic mentoring
• Student support
• Learning skills support.
• Reliable staff accessibility and approachability and
• Awareness by tutors of the conflicts between study time and employment. – UWS CEQ
study
Chapter 6 described research, including local surveys and student feedback, which identified the
correlation between student drop-out and the teaching and learning process. Significant research
findings are evident in this area, both in UWS, in the School and externally. The content of the
curriculum, its pace, style of learning/teaching, integration between units/subjects, assessment
techniques, student support and other issues form elements of the teaching and learning process;
Improving the Retention of First year Students Page 148
each of which can present difficulties for some students and, if not discussed or resolved, can
trigger student drop-out.
Progression [Chapter 7]
1. All staff should be aware of student retention data and issues and aim to maximise this –
UWS Exit Survey
2. Measures should be introduced to retain students at the end of year 1 by, for example,
considering scholarships – LTPF Scheme
3. Regular surveys should identify the reasons why students opt out and potential areas for
improvement – AUT Survey
The recommendations of chapters identify many areas where the university might take steps to
minimise student drop-out, such as:
Entry qualifications – see chapter 4
• Cater for students from all backgrounds, entry qualifications and UAIs; so that their
progress can be monitored and necessary action taken.
• Adopt an effective and pro-active team approach to first year teaching and integration of
the curriculum; so that students with poor HSCs can be catered for and curriculum
barriers minimised.
• Adjust the curriculum for students without the pre-requisite HSCs; by offering different
levels in subjects such as mathematics and science.
• Address student motivation, particularly for those with low engagement.
• Promote Learning Skills awareness and encourage students to use Learning Skills
programs; as an essential support process for students with low HSC passes, low UAIs
and with language difficulties. Inform potential students in good time of their entitlement

Improving the Retention of First year Students Page 149
to Learning Skills and Bridging courses: including students, such as international students,
who arrive at university in week 0.
Strategies which worked well: Recognition of student difficulties with
mathematics and the introduction of Fundamentals
of Mathematics; and
‘voluntary’ Bridging courses offered in
Mathematics, Physics and English prior to and
during the first semester.
Strategies which require further work: The enrolment on Bridging courses proved
disappointing: many students not being informed
of Bridging courses or alternative routes; in
particular international students.
The integration of first year units is seen as a major
logistic exercise.
Student disengagement is a major problem which is
influenced by student UAI and entry qualifications
and many other factors.
The First Year teaching team meets sporadically, so
coordination and progress is slow.
• Ensure minimum administrative barriers so that students are not delayed, frustrated or
turned away by unnecessary difficulties sometimes caused by university departments
failing to liaise and resolve academic and administrative issues. To regularly publish dates
and to reminder students of key information, maybe via WebCT; particularly in the first
semester following the student’s transition from school to university. To establish an
Engineering two-way ‘one stop shop’ online HelpLine; to provide access to information,
contacts, links and so on:
Strategies which worked well: Online enrolment a success.
A First year Coordinator processes the majority of
such queries and refers such issues to the Student
Focus Group: for example issues surrounding the
Improving the Retention of First year Students Page 150
UWS Campus Student Centre; now seen as more
accessible and ‘use friendly’
Strategies requiring further work: Students continue with central UWS administrative
difficulties and errors which can greatly frustrate
students and trigger thoughts of dropping out.
Campus issues such as car parking and inter-site
travel remain and are being addressed by the
Student Focus Group
• Appoint a First Year Mentor or Coordinator; to ensure students have access to relevant
information, guidance and support. To encourage students to seek help when needed; and to
follow up all student queries and consider recording them; so that patterns of student progress
can be identified and acted upon – particularly with high risk students. To strengthen
academic mentoring; so that students can confidently approach staff members for assistance,
whether unit related of in general terms, such as careers or course advice:
Strategies which worked well: A First Year Coordinator processes student queries
or refers elsewhere and is easily accessible.
A Student Focus group meets regularly to discuss
curriculum, campus and administrative issues.
Strategies requiring further work: Few students choose to seek guidance and support
when in difficulty, despite encouragement. This can
be due to lack of confidence or low esteem or the
inaccessibility or approachability of some staff.
8.1 Issues yet to be addressed at UWS, and for which policies are not
in place
• To give consideration to students timetable needs, taking into consideration the need to
provide early registration of tutorials and practicals, an early printout of the full timetable and
student requests for non-class times/days in order to work. To introduce interactive timetable
Improving the Retention of First year Students Page 151
software this enables students to plan their route through the first semester with minimum
frustrations. By adopting a coordinated timetable and assessment program, to address student
workload; particularly for those who have part-time or full-time employment or those who
travel long distances to the campus:
• Consider alternative Peer Mentor models, so that the service is reliable and which meets the
set criteria; inviting all year 2+ students to become Peer Mentors;
• Ensure the UWS and School web and WebCT sites are user friendly; and also reliable at all
times – a common cause of frustration
• To ensure a “warm and fuzzy”/”user friendly” welcome and ongoing approach by all staff; so
that students feel confident and comfortable in approaching any member of staff for help and
guidance
• To closely follow the published Unit Outlines; so that students accept the criteria and
assessment requirements which do not alter as the semester proceeds.
8.2 What measures can be made to retain them ?
The measures adopted by universities in Australia and elsewhere are described in chapters 4 to 7,
in addition to measures considered and adopted in UWS. Many measures require either policy
decisions by managers, such as “Appoint a First Year Mentor or Coordinator; to ensure students
have access to all types of information, guidance and support:” or they might be procedures which
can be applied on a local level to, for example, “Invite all year 2+ students to become Peer
Mentors”: a task which can be carried out by a Unit Coordinator or the First Year Coordinator.
The recommendations below include a number of issues for which data is not readily available,
awareness is poor, policies are required which raise the profile of student retention, its
consequences and the measures to improve retention:
• Collect retention data regularly and communicate this to staff; so as to regularly raise the
awareness of the financial and educational consequences
Improving the Retention of First year Students Page 152
• Coordinate all analyses of enrolment, retention and exit data; so that it is easily available for
analysis and discussion and so that measures can be introduced to counteract any falling
trends
• Involve the staff in retention analyses and train the staff to interpret and react to the causes
and remedies for low retention
• Coordinate all pre-enrolment student information; so that the schools and prospective
students receive correct and non-conflicting information
• Identify at-risk students and respond at an early stage; so that such students can be contacted
and, if necessary monitored and counselled
• Establish a School web site where pre-enrolment and orientation information is displayed;
both by schools and prospective students and
• Liaise regularly with feeder schools and provide potential students with all necessary
information; coupled with a web site, CD and other information.
Following the completion of this thesis and an analysis of student retention in the UWS School of
Engineering, possible continuation on to a PhD project could include:
Research Hypothesis
The cost benefit of retaining students at university justifies the investment necessary to
introduce measures to improve student satisfaction, particularly within the first year
8.3 A Final Word
The hypothesis that the actions undertaken to improve retention are working is not proven,
although it was shown that retention has improved as a result of a number of actions. It was
also shown that student satisfaction has improved as a result of a number of School and
University wide initiatives, but the link between satisfaction and retention is not firmly
established. The student pathway is complex and varies from student to student in terms of the
Improving the Retention of First year Students Page 153
important factors influencing the decision and ability to remain in engineering. So it is not
surprising that there are no clear relationships between actions and student retention.
It is clear that the School of Engineering is not alone in the University in either its pattern of
attrition or the magnitude of the attrition. And there is evidence to suggest that the pattern and
magnitude are similar in engineering schools and faculties at other Universities. But this is no
excuse for not trying to reduce the attrition, nor in terms of the number of students affected
and the cost does it give one solace.
The three questions that were asked at the beginning of the thesis were:
Why are students dropping out ?.
When do they drop out ? and
What measures can be used to retain them ?
This thesis has demonstrated the complexity of the answer to these questions in a model based
around the student pathway into and through the engineering course at UWS.
The hypothesis of this thesis is that student retention can be improved. The answer to this is
affirmative, but we cannot predict by how much nor what are the most effective actions in
improving retention, either in terms of percentage improvement in retention or the cost-
effectiveness of retention actions. As a result of the ambiguity there is likely to be no “quick
fixes” or strategies that will be universally applied, either within the University or amongst
Universities. It is suggested that the local institutions and the schools/faculties within the
Universities probably know best the nature of their student and potential-student populations
and can respond most rapidly to the outcome of initiatives and the need to vary these to
improve performance.
Improving the Retention of First year Students Page 154
9 REFERENCES
Abbott, C. J., Hughes, P. & Wyld, C. 1992, Monitoring Student Progress. A framework for improving student performance and reducing attrition in higher education, Youth Education Studies Centre, University of Tasmania. A report funded by the Department of Employment Education and Training.
Abbott, C.J., Hughes, P. & Wyld, C. 1986, Participation and Retention Rates and Social and Educational Factors which are Related to Them in Tasmania, Australian Government Printing Service, Canberra Commonwealth Schools Commission.
Abbott-Chapman, J., Hughes, P. and Wyld, C. 1992 Improving Access of Disadvantaged Youth to Higher Education, Canberra: AGPS.
Adams, R. 1983, Sex differences in ASAT and retentivity, Australian Association for Research in Education Conference, Melbourne., pp 35-44
Aitkin, M. & Longford, N. 1986, ‘Statistical Modelling Issues in School Effectiveness Studies’, Journal of the Royal Statistical Society A., Vol. 149, No. 1, pp. 1-43.
Allen, D. & Amaury, N. 1995, ‘An Empirical Examination of the Construct Validity of Goal Commitment in the Persistence Process’ Research in Higher Education, Vol. 36,No. 5, pp. 509-33.
Allen, D 1999. ‘Desire to finish college’. Research in Higher Education, 40(4), 461-485.
Allen, D.F. & Nelson, J.M. 1989, ‘Tinto's Model of College Withdrawal Applied to Women in Two Institutions’, Journal of Research and Development in Education, Vol. 22, No. 3, pp. 1-11.
Anderson, G., Benjamin, B. & Fuss, M.A. 1994, ‘The Determinants of Success in University Introductory Economics Courses’, Journal of Economic Education, Vol. 25, No. 2, pp. 99-119.
Anderson, J. (undated) A.C.T. 1: Assessment Counselling and Tutoring for First Year Students at University, Preliminary Report prepared for DEET, Monash University, 65 pages
Anderson, K.L. 1986, College Contexts, Student Integration, and Educational Attainment. ASHE Annual Meeting Paper, 15 pages
Anderson, K.L. 1987, Persistence, Student Background, and Integration/Commitment: Variation by Definition of Persistence and Institutional Type. Association for the Study of Higher Education Conference Paper, Baltimore, 23 pages
Arcuri, A., Daly, W., & Mercado, P. 1982. Academic boot camp. In K. Lauridgen, V. & C. Myers (Eds.), Summer Programmes for Underprepared Freshman. New Directions for College Learning Assistance (pp. 13-20). San Francisco: Jossey-Bass.
Improving the Retention of First year Students Page 155
Ashurst, J.T, De La Rocha, O. & Tobis, J. 1992, ‘Analysis of Collateral Data: A Method for Assessing and Correcting the Effects of Attrition on Internal Validity’, Journal of Experimental Education, Vol. 60, No. 3, pp. 215-234.
Astin, A. 1975, Preventing Students from Dropping Out and Knowledge, San Francisco, Jossey-Bass.
Astin, A. 1977, Four Critical Years: Effects of College on Beliefs, Attitudes and Knowledge, San Francisco, Jossey-Bass.
Astin, A. 1984, ‘Student Involvement: a Development Theory of Higher Education’, Journal of College Student Personnel, Vol. 25, pp. 297-308.
AUSSE 2007, ‘Australia Survey of Student Engagement’, Australian Learning & Teaching Council, 30 pages
Auyeung, P K., & Sands, J.S. 1993, ‘An evaluation of secondary school studies as predictors of performance for accounting majors’, Australian Educational Researcher, Vol. 20, No. 3, pp. 51-61.
Bailey, D.E., Emeleus, T.G. & Logan, P.F. 1989, Student performance and success predictions in the first year physics courses of applied science degree programs, Higher Education Research and Development Society of Australasia, Melbourne., 256 pages
Baxton, J.M. et al. 1988, ‘The Influence of Student Problems on Student Withdrawal Decisions: An Autopsy on Autopsy Studies’, Research in Higher Education, Vol. 28, No. 3, pp. 241-53.
Bean, J.P. & Metzner, B.S. 1985, ‘A Conceptual Model of Non-traditional Undergraduate Student Attrition’, Review of Educational Research, Vol. 55, No. 4, pp. 485-540.
Bean, J.P. & Vesper, N. 1994, Gender Differences in College Student Satisfaction. Association for the Study of Higher Education Conference Paper, (Tucson), 46 pages
Bean, J.P. 1980, ‘Dropouts and Turnover: The Synthesis and Test of a Causal Model of Student Attrition’, Research in Higher Education, Vol. 12, pp. 155-187.
Bean, J.P. 1982, ‘Student Attrition, Intentions, and Confidence: Interaction Effects in a Path Model’, Research in Higher Education, Vol. 17, pp. 291-319.
Bean, J.P. 1985, ‘Interaction effects based on class level in an exploratory model of college student dropout syndrome’, American Educational Research Journal, Vol. 22, pp. 35-64.
Becker, W.E. & Salemi, M.K. 1977, ‘The Learning and cost effective of AVT supplemented instruction: Specification of learning models’, Journal of Economic Education, Vol. 8, pp. 77-92.
Becker, W.E. & Walstad, W.B. 1990, ‘Data loss from pretest to post test as a sample selection problem’, Review of Economics and Statistics, Vol. 72, pp. 184-188.

Improving the Retention of First year Students Page 156
Becker, W.E. 1983, ‘Economic education research: Part III, statistical estimation methods’, Journal of Economic Education, Vol. 14, pp. 4-15.
Beltzer, S. 1985, Persistence of GED and Traditional Students at a Public Community College: A Test of a Conceptual Model, American Council on Education, Washington, 19 pages
Benda, E.J. 1991, ‘The Relationship among Variables in Tinto's Conceptual Model and Attrition of Bachelor's Degree Nursing Students’, Journal of Professional Nursing, Vol. 7, No. 1, pp. 16-24.
Bennett, R. 2003,. Determinants of Undergraduate Student Drop Out Rates in a University Business Studies Department. Journal of Further and Higher Education, 27(2), 123-141.
Ben-Shakhar, G. & Kiderman, I 1996, ‘Comparing the Utility of Two Procedures for Admitting Students to Liberal Art’, Educational and Psychological Measurement, Vol. 56, No. 1, pp. 90-106.
Benson, M.T. (ed) 1991, A statistical analysis of the predictions of graduation rates for college student athletes, NCAA Academic Performance Study, 36 pages
Bers, T. 1994, ‘English proficiency, course patterns and academic achievements of limited-English-proficient community college students’, Research in Higher Education, Vol. 35, No. 2, pp. 209-234.
Bers, T.H., and Smith, K.E. 1991, Persistence of community college students: The influence of student intent and academic and social integration’’, Research in Higher Education 32(5), 539-556.
Beswick, D, Schofield, H., Meek, L. & Masters 1984, Selective admissions under pressure: an evaluation and development study of student selection procedures at the University of Melbourne, Centre for the Study of Higher Education, Melbourne, pp 11-14
Biggs, J. 1999. Teaching for Quality Learning at University. Buckingham: SRHE and OUP, 183 pages
Biner, P.M., Bink, M., Martin, L., Huffman, M. & Dean, R. 1995, ‘Personality Characteristics Differentiating and Predicting the Achievement of Televised-Course Students and Traditional-Course Students’, The American Journal of Distance Education, Vol. 9, No. 2, pp. 46-60.
Binkley, M. et al. 1995, Methodological Issues in Comparative Educational Studies: The Case of the IEA Reading Literacy Study, National Centre for Education Statistics, Washington, 63 pages
Birrell, B. 1994, ‘Competition for Tertiary Entrance: The Monash Experience’, People and Place, Vol. 2, No. 2, pp. 18-24.
Blanc, R., DeBuhr, L. & Martin, D. 1983, ‘Breaking the Attrition Cycle’, Journal of Higher Education, Vol. 54, No. 1, pp. 80-90.

Improving the Retention of First year Students Page 157
Bleiklie, I., & Kogan, M. 2000. Comparison and Theories. In M. Kogan, M. Bauer, I. Bleiklie & M. Henkel (Eds.), Transforming Higher Education, A Comparative Study. London and Philadelphia: Jessica Kingsley, 132 pages Blythman, M., & Orr, S. 2003, A Joined-up Policy Approach to Student Support. In M. a. W. Peelo, T. (Ed.), Failing Students in Higher Education (pp. 45-55). Buckingham: Open University Press/SRHE.
Boddy, G. 1996, ‘A Three Year Longitudinal Study of the University Experience: A Progress Report’, Asia Pacific Student Services Association, Conference Proceedings, Sydney.
Bollen, K.A. 1989, Structural Equations with Latent Variables John Wiley and Sons, New York.
Boud, D. 1988, Developing Student Autonomy in Learning. London: Kogan Page, 79 pages
Bouillon, M. & Doran, M. 1992, ‘The Relative Performance of Female and Male Students in Accounting Principles Classes’, Journal of Education for Business, pp. 224-228.
Bouillon, M.L. & Doran, M. 1990, ‘Factors That Predict Success in Principles of Accounting Classes’, Journal of Education for Business, pp. 23-27.
Bourdieu, P., & Passeron, J. C. 1990. Reproduction in Education, Society and Culture London: Sage Publications, 261 pages
Boyle, P. 1987, Secondary students knowledge of postsecondary education options, and its relationship to background variables, University of Western Australia, Perth, 64 pages
Boyle, T. 1989, ‘An Examination of the Tinto Model of Retention in Higher Education’, NASPA Journal, Vol. 26, No. 4, pp. 288-94.
Bradsen, J.R. & Farrington, J.A. 1986, ‘Student selection and performance in the Faculty of Law, the University of Adelaide’, Australian Universities Review, Vol. 29, No. 1, pp. 25-31.
Brasfield, D., Harrison, D., McCoy J. & James P. 1993, ‘The Impact of High School Economics on the College Principles of Economics Course’, Journal of Economic Education, pp. 99-111.
Braxton, J. et al. 1995, ‘Expectations for College and Student Persistence’, Research in Higher Education, Vol. 36, No. 5, pp. 595-612.
Braxton, J., Vesper, N., & Hossler, D. 1995 Expectations for college and student persistence. Research in Higher Education, 36(5), 595-612.
Braxton, J.M., & Mundy, M.E. 2002, ‘Powerful institutional levers to reduce college student departure’’. Journal of College Student Retention Research, Theory & Practice, 3(1), 91-118.
Brekke, S.E. 1994, Some Factors Affecting Student Performance in Physics, Illinois, 37 pages
Improving the Retention of First year Students Page 158
Brennan, L. 2001, ‘Choosing a University Course: first year student' expertise and information search activity’. Higher Education Research & Development, 20(2), 217 – 224.
Burgum, M, Martins, A.C. & Northey, K. 1993, ‘Predicting student persistence and performance in the first year of a tertiary nursing programme: a pilot study’, Higher Education Research and Development, Vol. 12, No. 2, pp. 157-169.
Burke, R. J., McKenna, C. S., and McKeen, C. A. 1991 "How do mentorships differ from typical supervisory relationships?” Psychological Reports: 68(2). April. Pp. 459-467. Burr, P. L., Burr, R. M., & Novak, L. F. 1999, ‘Student retention is more complicated than merely keeping the students you have today: towards a "seamless retention theory"’ Journal of College Student Retention, 1(3), 239-253.
Cabrera, A. F., Nora, A. & Castaneda, M.B. 1993, ‘Structural Equations Modelling Test of an Integrated Model of Student Retention’, Journal of Higher Education, Vol. 64, No. 2, pp. 124-139.
Cabrera, A., Castaneda, M., Nora, A. & Hengsteen, D. 1992, ‘The Convergence between Two Theories of College Persistence’, Journal of Higher Education, Vol. 63, No. 2, pp. 143-64.
Cabrera, A., Nora, A., & Castaneda, A. 1992, ‘The roles of finances in the persistence process: A structural model’. Research in Higher Education, 33, 571-593.
Cabrera, A.F., Nora, A. & Castaneda, M.B. 1993, ‘College persistence: Structural equations modelling test of an integrated model of student retention’, Journal of Higher Education, Vol. 64, No. 2, pp. 123-139.
Caldas, S. 1992, ‘Using Multiple Regression to Predict Achievement: A Reply to Klingele and Warrick, Penny and Bond’, Journal of Educational Research, Vol. 85, pp. 325-326.
Calderon, A. 1996, ‘Student Progress Units (SPU) and SPU Ratios’, Memo, Budget and Statistical Services, Monash University.
Callender, C., & Kemp, M. 2000, Changing Student Finances: Income, Expenditure and the Take-up of Student Loans Among Full- and Part-time Higher Education Students in 1998/9. Retrieved 5th March, 2006, from http://www.dfes.gov.uk/research/data/uploadfiles/RR213.PDF
Campbell, J.D. 1990, ‘Self-esteem and clarity of the self-concept’, Journal of Personality and Social Psychology, Vol. 59, pp. 538-549.
Campbell, TA, & Campbell, DE 1997 ‘Faculty/Student mentor program: effects on academic performance and retention’, Research in Higher Education, 38, pp. 727–742.
Improving the Retention of First year Students Page 159
Carbone, A., Mitchell, I., & Macdonald, I. D. H. 1996, ‘Improving teaching and learning in first year computer science tutorials’, ASCILITE conference paper.
Care, W. 1995, Helping Students To Persist in a Distance Education Program: The Role of the Teacher, University of Manitoba, Canada, 82 pages
Carlson, J 2006 (AUT) Supporting Retention – a presentation at the 2006 QUT 9th Pacific Rim Conference, 6 pages
Carpenter, P. & Fleishman, J. 1987, ‘Linking intentions and behaviour: Australian students college plans and college attendance’, American Educational Research Journal, Vol. 24, No. 1, pp. 79-105.
Carpenter, P. & Hayden, M. 1992, ‘Academic achievement among Australian youth’, Australian Journal of Education, Vol. 29, No. 3, pp. 199-220.
Cash, R. & Bissel, H. 1985, ‘Testing Tinto's Model of Attrition on the Church-Related Campus’, Association for Institutional Research, Conference Paper, Portland.
Castle, E.McC., 1993, ‘Minority Student Attrition Research, Higher Education’s Challenge for Resource Development’, Educational Research, Vol. 22, No. 7, pp. 21-30.
Caudill, S. & Gropper, D. 1991, ‘Test Structure Human Capital, and Student Performance on Economics Exams’, Journal of Economic Education, Vol. 22, No. 4, pp. 303-06.
Cheng, K.C, Keeves, J. Sellin, N. & Tsoi, S.C. 1990, ‘The analysis of multilevel data in educational research: studies of problems and their solutions’, International Journal of Educational Research (UK), Vol. 14, p. 3.
Chickering, A. & Reisser, L. 1993, Education and Identity, (2nd ed.) Jossey-Bass, San Francisco, 192 pages
Chickering, W & Gamson,Z 1987 "Seven principles for good practice in undergraduate education" American Association of Higher Education Bulletin pp.3-7 Christie, H., Munro, M., & Fisher, T. 2004, ‘Leaving university early: exploring the differences between continuing and non-continuing students’. Studies in Higher Education, 29(5), 617 - 636.
Christie, N. & Dinham, S. 1990, ‘Elaboration of Tinto's Model of College Student Departure: A Qualitative Study of Freshman Experiences’, American Educational Research Association, Conference Paper, Boston, 35 pages
Christie, N. & Dinham, S. 1991, ‘Institutional and External Influences on Social Integration in the Freshman Year’, Journal of Higher Education, Vol. 62, No. 4, pp. 412-36.

Improving the Retention of First year Students Page 160
Clark, E. & Ramsay, W. 1990, ‘Problems of Retention in Tertiary Education", Education Research and Perspectives, Vol. 17, No. 2, pp. 47-59.
Clark, E. 1989, ‘The Importance of a Comprehensive Advising System in Improving Student Retention and Graduation Rates’, Australian Universities’ Review, Vol. 1, pp. 27-29.
Clark, J. & Davis, W. 1992, ‘Does High School Economics Turn Off Too Many Students?’, Journal of Education for Business, pp. 152-155.
Clarke, J., Burnett, P. & Dart, B. 1994, A Research Project Investigation Predictors of Performance in Higher Education: Phase 1 Literature Review and Model Development, Tertiary Entrance Procedures Authority, 17 pages
Cobbin, D.M & Barlow, A.R. (eds) 1993, Tertiary access and equity initiatives: a handbook for evaluative research. Evaluative Studies Research Group, Higher Education Division, EIP, Australian Government Publishing Service, Canberra, 14 pages
Cohen, A.M. 1994, ‘Indicators of Institutional Effectiveness’, ERIC Digest, Office of Educational Research and Improvement, Washington, 114 pages
Cope, R & Hannah, W. 1975, Revolving College Doors: the causes and consequences of dropping out, stopping out, and transferring, John Wiley & Sons, New York, 229 pages
Corman, J., Barr, L. & Caputo, T. 1992, ‘Unpacking Attrition: A Change of Emphasis’, Canadian Journal of Higher Education, Vol. 22, No. 3, pp. 14-27.
Cornell, I., Cornell, R. Dickie, L., Elizov, H., Farrell, J., Kubanek, A., Montpetit, D. & Waller, M. 1990, Easing the transition from secondary school to college, Ste. Anne de Bellevue, Quebec (ERIC Document Reproduction Service), 188 pages
Cowan, J. 1998. On Becoming an Innovative University Teacher: Reflection in Action Buckingham: SRHE and OUP, 96 pages . Cuseo, J, 2002 ROOTS OF ATTRITION : www.ulster.ac.uk/star/resources/sing_handout.pdf, accessed 6.6.2007
Dale, M.G. & Jennings, P.J. 1986, ‘Factors Affecting the Performance of Students in Undergraduate Physics’, Australian Physicist, Vol. 23, No. 1, pp. 9-12.
Dancer, D.M & Doran, H. 1990, Prediction of the probability of successful first year university studies in terms of high school background: with application to the Faculty of Economic Studies, University of New England, 69 pages
Danko, K., Duke, J.D. & Franz, D.P. 1992, ‘Predicting Student Performance in Accounting Classes’, Journal of Education for Business, Vol. 67, No. 5, pp. 270-274.

Improving the Retention of First year Students Page 161
Dart, B.C. & Clarke, J.A. 1992, ‘Learning and learning environments’, Research and Development in Higher Education, Vol. 15, pp. 167-174.
Dart, B.C. 1993, ‘Personal and environmental influences on tertiary students’ learning strategy use’, European Association for Research in Learning and Instruction Conference Papers, France, 23 pages
Dart, B.C. 1994, ‘A goal-mediational model of personal and environmental influences on tertiary students’ learning strategy use’, Higher Education, p. 16.
Davies, R., & Elias, P. 2003, Dropping Out: A Study of Early Leavers from Higher Education. http://www.dcsf.gov.uk/research/data/uploadfiles/RR386.pdf Retrieved 5.3.2007
Davis, T.M. & Murrell, P.H. 1994, ‘Turning Teaching into Learning. The Role of Student Responsibility in the Collegiate Experience’, ERIC Digest, 15 pages
De Rome, E. & Lewin, T. 1984, ‘Predicting persistence at University from Information obtained at intake’, Higher Education (NETH), Vol. 13, No. 1, pp. 49-60.
Deer, C. 2005, The politics of access to higher education in France. In T. Tapper & D Palfreyman (Eds.), Understanding Mass Higher Education, Comparative perspectives on access (pp. 28-50). London and New York: Routledge Falmer.
DEST 1990, A Fair Chance for All Canberra: AGPS, 73 pages
DEST 1995 Equality, Diversity and Excellence: Advancing the National Equity Framework, Canberra: AGPS, 155 pages
DEST, 8/1999 Transition from secondary to tertiary: a performance study [higher education series (HES) 36], 115 pages
DEST 2005 Outcomes of a university's flexible admissions policies [EIP 96/8] Eleanor Ramsay; Deborah Tranter;
Robert Summer; Steve Barrett; University of South Australia, 166 pages
DEST 2005 First Year Experience. Updated 2007
DEST 2004 Higher Education Attrition Rates 1994 – 2002 A Brief Overview. Research Note 1 March 2004 – including: the web site http://www.dest.gov.au/sectors/higher_education/publications_resources/statistics/ DEST Learning & Teaching Performance Fund cited 1.4.2007 http://www.dest.gov.au/sectors/higher_education/policy_issues_reviews/key_issues/learning_teaching/ltpf/default.htm Dewart,H, Drees,D, Hixenbaugh,P, Thron,L 2006 Engaging Students at a Metropolitan University: Is Electronic mentoring an Effective Startegy ? University of Westminster, London, UK, 16 pages
Improving the Retention of First year Students Page 162
Dey, E.L. & Astin, A.W. 1993, ‘Statistical Alternatives for Studying College Student Retention: A Comparative Analysis of Logit, Probit, and Linear Regression’, Research in Higher Education, Vol. 34, No. 5, pp. 569-81.
Diasma, K. et al. 1994, ‘Look what you get when the system is a bit more flexible and generous’, JANSSA News, No. 4.
Dietsche, P.H.J. 1995, ‘Attrition Research: Implications for Quality in Community College Education’, Community College Journal of Research and Practice, Vol. 19, No. 5, pp. 423-426.
Dinius, S.H. 1991, ‘Accounting Students: Secondary-Level Study and Academic Performance and Characteristics’, Journal of Educational for Business, pp. 244-250.
Dirkx, J.M. & Jha, L.R. 1994, ‘Completion and Attrition in Adult Basic Education: A Test of Two Pragmatic Prediction Models’, Adult Education Quarterly, Vol. 45, No. 1, pp. 269-85.
Dobson I R & Sharma, R 1993, ‘Student Progress: a study of the experience in Victorian Tertiary institutions’. Journal. of. Tertiary Education Administration 1993, 75 pages
Dobson, I. & Sharma, R. 1995, Student Performance and the Diversification of Modes of University Study and Bases of Admission, DEETYA. 42 pages
Dobson, I. 1995, ‘A Fair Chance for Whom?’, National Conference on Equity and Access in Tertiary Education, paper, 97 pages
Dobson, I., Sharma, R. & Haydon, A. 1996, ‘Evaluation of the Relative Performance of Commencing Undergraduate Students in Australian Universities’, Australian Credit Transfer Agency, Adelaide, 39 pages
Dolnicar, S. 2005, ‘Should We Still Lecture or Just Post Examination Questions on the Web?: the nature of the shift towards pragmatism in undergraduate lecture attendance.’’ Quality in Higher Education, 11(2), 103-115.
Douglas, S. & Sulock, J. 1995, ‘Estimating Educational Production Functions with Correction for Drops’, Journal of Economic Education, Vol. 26, No. 2, pp. 101-12.
Downes, B. 1976, ‘A Model for Prediction of Academic Performance and Selection of Students for University Entrance’, The Australian University, Vol. 14, No. 2, pp. 202-212.
Drew, N, Pike, L., Pooley, J., Young, A., & Breen, L. 2000 School of Psychology peer mentoring pilot programme. Paper presented at the Pacific Rim Conference on the First-year in Higher Education, July 7 2000, Brisbane, Australia.
Duke, F. 1987, ‘Degrees of Experience: are the needs of nature age adults and school leavers compatible?’, Journal of Access Studies, Vol. 2, No. 1, pp. 54-63.

Improving the Retention of First year Students Page 163
Durkheim, E. 1961, Suicide, (Spaulding, J. and Simpson, G. trans.), Glencoe: the Free Press.
Durkheim, Suicide, 1897, The Free Press reprint 1997 ISBN 0684836327, 416 pages
Earwaker, J. 1992. Helping and Supporting Students. Buckingham: SHRE and OUP, 79 pages
Eaton, S.B. & Bean, J. 1995, ‘An Approach/Avoidance Behavioural Model of College Student Attrition’, Research in Higher Education, Vol. 36, No. 6, pp. 617-45.
Eckel, P. 1994, ‘Building Community in the Freshman and Senior Year Experiences: Completing the Cycle of Student-Institution Involvement’, International Conference on the First Year Experience, Dublin, 64 pages
Ecob, R. & Goldstein, H. 1983, ‘Instrumental Variable Methods for the Estimation of Test Score Reliability’, Journal of Educational Statistics, Vol. 8, No. 3, pp. 223-41.
Edwards, R. 1993, Mature Women Students: Separating or Connecting Family and Education, Taylor and Francis Ltd., London, 27 pages
Eisenberg, E & Dowsett, T. 1990, ‘Student drop-out from a distance education project course: a new method of analysis’, Distance Education, Vol. 11, No. 2, pp. 231-253.
Elkin, G 1990, ‘The admission of mature adult students to executive MBA programs’, Australian Journal of Adult and Community Education, Vol. 30, No. 3, pp. 166-173.
Ellington, H. 1999, April 30, ‘Teach with excellence’. The Times Higher Education Supplement, p. 33.
Elliott, D.B. 1992, Community College Faculty Behaviours, Impacting Transfer Student Success: A Qualitative Study, the Ed D dissertation, Arizona State University, 94 pages
Elsworth, G., Day, N., Hurworth, R. & Andrews, J. 1983, From School to Tertiary Study: transition to college and university in Victoria, Australian Council for Education Research, Melbourne, 59 pages
Elsworth, G.R & Day, N.A. 1983, ‘Eligibility and self selection: discontinuities in transition to tertiary education in Victoria’ Australian Journal of Education, Vol. 27, No. 1, pp. 62-77.
Engstrom, C & V.Tinto, 2001, Building Collaborative Partnerships with Student Affairs to Enhance Student Learning, San Francisco: Jossey-Bass Inc., 88 pages
Eskilson, A., Wiley, M.G., Muehlbauer, G. & Dodder, I 1986, ‘Parental pressure, self-esteem and adolescent reported deviance: Bending the twig too far’, Adolescence, Vol. 21, pp. 501-515.
Evans, M, 2000, Planning for the Transition to Tertiary Study: A Literature Review, Journal of Institutional Research, 105 pages
Improving the Retention of First year Students Page 164
Everett, J.E & Robins, J. 1991, ‘Tertiary entrance predictors of first-year university performance’, Australian Journal of Education, Vol. 35, No. 1, pp. 24-40.
Ewell, P.T. 1984 Conducting Student Retention Studies, Boulder: National Centre for Higher Education Management Systems, 53 pages
Fagenson, E, 1989 The Mentor Advantage, Journal of Organisational Behaviour Vol 10 No. 4 pp 309 - 320
Farabaugh-Dorkins, C. 1991, ‘Beginning To Understand Why Older Students Drop Out of College: A Path Analytic Test of the Bean/Metzner Model of Non-traditional Student Attrition’, The Association of Institutional Research, Vol. 39, pp. 1-10.
Farley, A.A. & Ramsay, A.L. 1988, ‘Student Performance in First Year Tertiary Accounting Courses and Its Relationship to Secondary Accounting Education’, Accounting and Finance, pp. 29-41.
Farley, B.L. 1995, A Is for Average: The Grading Crisis in Today's Colleges, Princeton University, 44 pages
Fels, R. & Siegfried, J.J. (eds.) 1982, Research on teaching college economics: Selected readings, Joint Council on Economic Education: New York, 48 pages
Ferber, M.A., Birnbaum, B.G. & Green, C.A. 1983, ‘Gender differences in economic knowledge: A re-evaluation of the evidence’, Journal of Economic Education, Vol. 14, No. 2, pp. 24-37.
Fetler, M.E. 1989, ‘School Dropout Rates, Academic Performance, Size, and Poverty: Correlates of Educational Reform’, Educational Evaluation and Policy Analysis, Vol. 11, No. 2, pp. 109-16.
Fetler, M.E. 1990, ‘A Method for the Construction of Differentiated School Norms’, Applied Measurement in Education, Vol. 4, No. 1, pp. 53-66.
Fetler, M.E. 1991, ‘Pitfalls of Using SAT Results to Compare Schools’, American Educational Research Journal, Vol. 28, No. 2, pp. 481-91.
Finch, P.D. 1977, ‘Some statistical comments on educational issues in tertiary selection’, Vestes, Vol. 20, pp. 33-39.
Fisher, S., & Hood, B. 1987, ‘The stress of the transition to university: a longitudinal study of psychological disturbance, absent-mindedness and vulnerability to homesickness’. British Journal of Psychology, 78, 425-441. Fitzgibbon, K., & Prior, J., 2003, Student Expectations and University Interventions – a timeline to aid undergraduate student retention. Paper presented at the LTSN BEST Annual Conference

Improving the Retention of First year Students Page 165
Flitman, A.M. 1997, ‘Towards Analysing Student Failures: Neural Networks Compared with Regression Analysis and Multiple Discriminant Analysis’, Computers Ops. Res., Vol. 24, No. 4, pp. 367-377.
Floud, R. 2003, Policy Implications of Student Non-completion: Government, Funding Councils and Universities. In M. Peelo & T. Wareham (Eds.), Failing Students in Higher Education (pp. 56-69). Buckingham: Open University Press/SRHE, 27 pages
Fox, R.N. 1984, ‘Reliability and Discriminant Validity of Institutional Integration Scales for Disadvantaged College Students’, Educational and Psychological Measurement, Vol. 44, No. 4, pp. 1051-57.
Fox, R.N. 1986, ‘Application of a Conceptual Model of College Withdrawal to Disadvantaged Students’, American Educational Research Journal, Vol. 23, No. 3, pp. 415-24
Francis, K.C. et al. 1993, ‘Success in School: A Research Agenda on Student Attrition and Retention in the SEEK Program’, Educational Evaluation and Policy Analysis, Vol. 15, No. 4, pp. 437-41.
Frazer, L. 1992, ‘Students at Risk of Dropping Out: Developing Accurate Criteria to Identify Them’, ERS Spectrum, Vol. 10, No. 4, pp. 3-9.
Fries-Britt, S. 1995, ‘Voices of Gifted Black Students’, Association for the Study of Higher Education Conference paper, Orlando.
Frost, S.H. 1991, Academic Advising for Student Success: A System of Shared Responsibility, ERIC Digest, ASHE-ERIC Higher Education Report, Washington, 17 pages
Fulmer, A. & Jenkins, H.I. 1992, ‘Evaluating a Tertiary Access Program for Mature Age Women’, Higher Education Research and Development, Vol. 11, No. 1, pp. 45-60
Garner, C. L. & Raudenbush, S.W. 1991, ‘Neighbourhood Effects on Educational Attainment: A Multilevel Analysis’, Sociology of Education, Vol. 64, No. 4, pp. 251-62.
Geiger, M.A. & Cooper, E.A. 1995, ‘Predicting Academic Performance: The Impact of Expectancy and Needs Theory’, Journal of Experimental Education, Vol. 63, No. 3, pp. 251-62.
Getzlaf, S.B. et al. 1984, ‘Two Types of Voluntary Undergraduate Attrition: Application of Tinto's Model’, Research in Higher Education, Vol. 20, No. 3, pp. 257-68.
Gillespie, M. & Noble, J. 1992, Factors Affecting Student Persistence: A Longitudinal Study, American College Testing Program, Iowa City, 24 pages
Glaser, N, Hall, R, Halperin, S 2005 Students supporting Students – the effects of peer mentoring on student transition. Paper presented in 2005 to the conference Enhancing Students Success, 18 pages
Improving the Retention of First year Students Page 166
Glass, J. C. Jr. & Garrett, M.S. 1995, ‘Student Participation in a College Orientation Course, Retention, and Grade Point Average’, Journal of Research and Practice, Vol. 19, No. 2, pp. 117-32.
Godwin & Markham 1996 NOV-DEC [NOV 15] JOURNAL OF HIGHER EDUCATION 67(6):660-& Godwin GJ; Markham WT First encounters of the bureaucratic kind - Early Freshman experiences with a campus bureaucrat, 11 pages
Goldstein, H 1991, ‘Better Ways to Compare Schools?’ Journal of Educational Statistics, Vol. 16, No. 2, pp. 89-91.
Goldstein, H. & McDonald, R.P. 1988, ‘A General Model for the Analysis of Multilevel Data’ Psychometrika, Vol. 53, No. 4, pp. 455-67.
Goldstein, H. & Spiegelhalter, D. 1996, ‘League Tables and their Limitations: Statistical Issues in Comparisons of Institutional Performance’, Journal of the Royal Statistical Society, A, Vol. 159, No. 3, pp. 385-443.
Goldstein, H. 1983, ‘Measuring Changes in Educational Attainment over Time: Problems and Possibilities’, Journal of Educational Measurement, Vol. 20, No. 4, pp. 369-77.
Goldstein, H. 1984, ‘The Methodology of School Comparisons’, Oxford Review of Education, Vol. 10, No. 1, pp. 69-74.
Goldstein, H. 1986, ‘Multilevel mixed linear model analysis using iterative generalised least squares’, Biometrika, Vol. 73, pp. 43-56.
Goldstein, H. 1987, ‘Multilevel covariance component models’, Biometrika, Vol. 74, pp. 430-431.
Goldstein, H. 1989, ‘Estimating the Regional Economic Impact of Universities: An Application of Input-Output Analysis’, Planning for Higher Education, Vol. 18, No. 1, pp. 51-64.
Goldstein, H. 1993, ‘Assessing Group Differences’, Oxford Review of Education, Vol. 19, No. 2, pp. 141-50.
Goldstein, H. 1995, Multilevel Statistical Models, Kendalls Library of Statistics, No. 3, 2nd ed., John Wiley and Sons, 27 pages
Goldstein, J. & Thomas, S. 1996, ‘Using examination results as indicators of school and college performance’, Journal of the Royal Statistical Society, A, Vol. 159, No. 1, pp 149-163.
Goldstein, Z. & Marcoulides, G.A. 1991, ‘Maximizing the Coefficient of Generalisability in Decision Studies’, Educational and Psychological Measurement, Vol. 51, No. 1, pp. 79-88.
Gracia, L., & Jenkins, E. 2002. An exploration of student failure on an undergraduate accounting programme of study. Accounting Education, 11(1), 93-107.
Improving the Retention of First year Students Page 167
Grimes, P.W. 1994, ‘Public versus Private Secondary Schools and the Production of Economic Education’, Journal of Economic Education, Vol. 25, No. 1, pp. 17-30.
Grosset, J. & Hawk, T.R. 1988, Institutional Effectiveness: A Three-Year (1985-1988) Status Report, Philadelphia Community College Philadelphia, 15 pages
Grosset, J.A. 1989, Conceptual Framework for Describing the Causes of Student Attrition, Philadelphia Community College, Philadelphia, 57 pages
Gunn, F. M. & Macdonald, I. D. H. 1997, ‘Developing a culture of teaching and learning at tertiary level: A training course for post graduate student tutors that made a difference’, ASERA conference paper, pp 12-16
Gunstone, R., Macdonald, I. D. H., McKittrick, B., Mills, D., Mulhall, P. & White, R. T. 1996, ‘Changing students’ approaches to laboratory work in undergraduate physics’, ASERA conference paper, pp 24-27
Gutierrez, M & Marquez, A. 1994, ‘Longitudinal Model for Assessing Student Outcomes at a Community College’, Association for Institutional Research, Conference Paper, Illinois, pp11-18
Gutteridge, R. 2001, May 14-16, Student support, guidance and retention; re-defining additional needs. Paper presented at the Conference on Qualitative Evidence-based Practice: Taking a Critical Stance, Coventry University, from http://www.leeds.ac.uk/educol/documents/00001709.htm (Accessed 24 February 2005)
Hadley,T. & Winn, S. 1992, ‘Measuring Value Added at Course Level: An Exploratory Study’, Higher Education Review, Vol. 25, No. 1, pp. 7-30.
Hagan, D.L., Sheard, J.I. & Macdonald, I.D.H. 1997, ‘Monitoring and evaluating a redesigned first year programming course’, ACM SIGCSE/SIGCUE Conference on Integrating Technology into Computer Science Education, paper, Sweden, pp 35-36
Halabi, A & Smyrnios, K. 1996, ‘Orientation Programs: What Monash Gippsland Business Students Think..Finally!’, Journal of Australian and New Zealand Student Services Association, Vol. 8, pp. 73-89.
Halpin, R.L. 1990, ‘An Application of the Tinto Model to the Analysis of Freshman Persistence in a Community College’, Community College Review, Vol. 17, No. 4, pp. 22-32
Hamdi, F.A., Abdulrazzak, C. & Nada, K.H. 1992, ‘A discriminant function model for admission at undergraduate university level’, International Review of Education, Vol. 38, No. 5, pp. 505-518.
Hand, M. & and Fry, T.R.L. 1995, Honours Streaming of Undergraduate Students: The Predictive Ability of the Binary Logit Model, Department of Econometrics, Monash University, 52 pages
Improving the Retention of First year Students Page 168
Hansen, W.L. 1993, ‘Bringing total quality improvement into the college classroom’, Higher Education, Vol. 25, pp. 259-279.
Hansford, B.C. & Hattie, J.A. 1982, ‘The relationship between self and achievement/performance measures’, Review of Educational Research, Vol. 52, pp. 325-340.
Hart, G. 1992, Selected correlates of academic performance, Institute of Education, University of Melbourne, Melbourne, 16 pages
Hartley & McInnis 2002, SRHE The role of peers in undergraduate student experience, Annual Conference 2002 Student engagement: Hartman-Hall, H. M., & Haaga, D. A. F. 2002 ‘College students' willingness to seek help for their learning disabilities’. Learning Disability Quarterly, 25, 263-274. Hatcher, L., Kryter, K., Prus,. J. & Fitzgerald, V. 1992 ‘Predicting college student satisfaction, commitment, and attrition from invest model constructs’. Journal of Applied Social Psychology 22, 1273 - 1296.
Hau, I. 1991, ‘Teaching quality improvement by quality improvement in teaching’, University of Wisconsin Report Series in Quality and Productivity, Vol. 59, pp. 1-15.
Hawker, L. et al. 1991, ‘The Relationship of Interpersonal Communication Variables to Academic Process and Persistence in College’, Communication Quarterly, Vol. 39, No. 4, pp. 297-308.
Hayes, S. 1977, ‘Pressure Contributing to the Decision to Dropout - Comparison between dropouts and persisters’, Australian Journal of Education, Vol. 18, No. 2, pp. 138-148.
Hayes, S. C. ,1977, ‘Dropouts' dissatisfaction with university’. Australian Journal of Education, 21, 141-149.
Heath, J.A. 1989, ‘An econometric model of the role of gender in economic education’, American Economic Review, Vol. 79, pp. 226-30.
Heckman, J.J. 1979, ‘Sample selection bias as a specification error’, Econometrica, Vol. 47 ,pp.153-161.
Henkel, M., & Vabo, A. 2000, Academic Identities. In M. Kogan, M. Bauer, I. Bleiklie & M. Henkel (Eds.), Transforming Higher Education, A Comparative Study. London: Jessica Kingsley, pp 6-11
Henry, T.C. & Smith, G.P. 1994, ‘Planning Student Success and Persistence: Implementing a State System Strategy’, Community College Review, Vol. 22, No. 2, pp. 26-36.
Heywood, J. ,2000, Assessment in HE: student learning, teaching, programmes and institutions. London: Jessica Kingsley, 29 pages
Improving the Retention of First year Students Page 169
Hill, P.W. 1995, ‘Value added measures of achievement’, Seminar Paper, IARTV, Australia.
Hill, P.W. et al. 1993, School and Teacher Effectiveness in Victoria. Key Findings from Phase 1 of the Victorian Quality Schools Project, Centre for Applied Educational Research, University of Melbourne.
Hinnett, K. 2003,. Failing to Assess or Assessing to Fail. In M. Peelo & T. Wareham (Eds.), Failing Students in Higher Education. Buckingham: Open University
Hisada, P. 1988, Studying Student Retention: the Requirements and Process of Retention Research, Hawaii University, Honolulu, 21 pages
Holdaway, E. & Kelloway, K. 1987, ‘First year at university: perceptions and experiences of students’, The Canadian Journal of Higher Education, Vol. 17, pp. 47-63.
Hong, S.M. 1982, ‘Age and achievement: the age factor in predicting academic success’, Australian Journal of Adult Education, Vol. 22, No. 3, pp. 21-28.
Hong, S.M. 1984, ‘The age factor in the prediction of tertiary academic success’, Higher Education Research and Development, Vol. 3, No. 1, pp. 61-70.
Horn, C., Bruning, R., Schraw, G., Curry, E. & Kathkanant, C. 1993, ‘Paths to success in the college classroom’, Contemporary Educational Psychology, Vol. 18, pp. 464-478.
Horvath, J., Beaudin, B.Q. & Wright, S.P. 1992, ‘Persisting in the Introductory Economics Course: An Exploration of Gender Differences’, Journal of Economic Education, Vol. 23, pp. 101-108.
Huang, G. 1995, ‘National Data for Studying Rural Education: Elementary and Secondary Education Applications’, ERIC Digest, 32 pages
Jackson, J. 1997, TQM in higher education: continuously improving the teaching and learning of introductory statistics, Unpublished PhD thesis, Department of Econometrics and Business Statistics, Monash University, 185 pages
Jacobi, M. 1991, ‘Mentoring and Undergraduate Academic Success: A Literature Review’, Review of Educational Research, Vol. 61, No. 4, pp. 505-532.
Jaques, D. 1990, Being a Personal Tutor. Oxford: Oxford Brookes University, 179 pages
Jenkins, N.J. 1992, ‘The Scholastic Aptitude Test as a predictor of academic success: A literature review’, ERIC ED354243.
Johnes, J. & Taylor, J. 1990, ‘Undergraduate Non-Completion Rates: A Reply’, Higher Education, Vol. 19, No. 3, pp. 385-90.
Johnson, G. A. 1994, ‘Undergraduate Student Attrition: A Comparison of the
Improving the Retention of First year Students Page 170
Characteristics of Students who Withdraw and Students who Persist’. The Alberta Journal of Educational Research, XL(3), 337-353. Johnston, V. 2001, Developing strategies to improve student retention: reflections from the work of Napier University's Student Retention Project. Retrieved 30 April, 2003, from http://www.napier.ac.uk/qes/studentretentionproject/Documents/SRHE%202001%20Cambrid
ge.doc Johnston, V. 2002, ‘Improving student retention - by accident or design’. Exchange(1), 9-11. Johnston, V. 2003, Using Research to Improve Student Retention and Progression: The Experiences of the Student Retention Project at Napier University. Paper used in support of a presentation given at the Institutional Research to Widen Participation Symposium held on 16th June. Retrieved 30 April, 2003, from http://www.ltsn.ac.uk/application.asp?app=resources.asp&process=full_record§ion
Jones, J. 1990, ‘Outcomes of Girls’ Schooling: Unravelling Some Social Differences’, Australian Journal of Education, Vol. 34, No. 2, pp. 153-167.
Jones, P. C. 2002, ‘Improved Academic and Pastoral Support: The University of Greenwich explores a possible way forward’. Exchange, 1, pp24-25.
Kantanis, T. 2002 Same of Different: Issues that affect mature age undergraduate students’ transition to university, presented at 6th Pacific Rim Conference 2002, 16 pages Kealy, M. J., & Rockel, M. L. 1987, ‘Student perceptions of college quality: the influence of college recruitment policies’. The Journal of Higher Education, 58, 683-703.
Keef, S.P. 1992, ‘The Comparative Advantage of Cognate Studies in the New Zealand University Bursaries Accounting Examination’, Australian Journal of Education, Vol. 36, No. 1, pp. 14-29.
Keeves, J.P. (ed) 1986, ‘Aspiration, motivation and achievement: different methods of analysis and different results’, International Journal of Educational Research, Vol. 10, No. 2.
Keeves, J.P. (ed) 1988, Educational research, methodology, and measurement: an international handbook, Pergamon, Potts Point, New South Wales, pp 32-40
Kember, D, Murphy, D., Siaw, I., & Yuen, K.S. ,1991, ‘Towards a Causal Model of Student Progress in Distance Education: Research in Hong Kong’, The American Journal of Distance Education, Vol. 5, No. 2, pp. 3-15.
Kember, D. 1989, ‘A Longitudinal-Process Model of Drop-Out from Distance Education’, Journal of Higher Education, Vol. 60, No. 3, pp. 278-301.
Improving the Retention of First year Students Page 171
Kember, D. 1990, ‘The use of a model to derive interventions which might reduce drop-out from distance education course’, Higher Education, Vol. 20, pp. 11-24.
King, P. 1992, ‘Issues of Curriculum and Comments for First-Generation Asian Americans in College’, New Directions for Community College, Vol. 20, No. 4, pp. 97-117.
Killen, R. 1994, ‘Differences between students’ and lecturers’ perceptions of factors influencing success at university’, Higher Education Research and Development, 13, pp. 199–211.
Koslowsky, M. 1993, ‘A Comparison of Two Attitude-Behaviour Models for Predicting Attrition in Higher Education’, Journal of Applied Behavioural Science, Vol. 29, No. 3, pp. 359-365.
Kraemer, B.A. 1993, ‘The Dimensionality of Academic and Social Integration in Persistence Studies of Hispanic Students’, Association for the Study of Higher Education, Conference Paper, Pittsburgh, 64 pages
Kram, K. E., & Isabella, L. A. 1985, ‘Mentoring alternatives: The role of peer relationships in career development’. Academy of Management Journal, 28, 110-132. Krause, K et al 2005 The first year experience in Australian universities: findings from a decade of national studies, Centre for the Study of HE, University of Melbourne, HEIP, Canberra. Krause, K.-L., Hartley, R., James, R., & McInnis, C. 2005. The First Year Experience in Australian Universities: findings from a decade of national studies: Centre for the Study of Higher Education, University of Melbourne. Kuh & Hu 2001,’ The effects of student-faculty interaction in the 1990s’. The Review of Higher Education, 24, 309-332.
Kuh, G. 1993, ‘In Their Own Words: What Students Learn Outside the Classroom’, American Educational Research Journal, Vol. 36, No. 2, pp. 277-304.
Kuh, G. 1995, ‘The Other Curriculum: Out of Class Experiences Associated with Student Learning and Personal Development’, Journal of Higher Education, Vol. 66, No. 2, pp. 123-153.
Laing, C., & Robinson, A. 2003. The Withdrawal of Non-traditional Students: developing an explanatory model. Journal of Further and Higher Education, 27(2), pp15-17
Lam, Y.L.J. 1984, ‘Predicting dropouts of university freshmen: a logic regression analysis’, Journal of Educational Administration, Vol. 22, No. 1, pp. 74-82.
Langston, P.D. & Boyles, C. 1987, ‘The search for a mission and new admission standards: A case study’, College and University, Spring, pp. 183-193.
Le Claire, K.A. 1988, ‘Higher education access and participation: political dependency and student choice’, International Journal of Education Research, Vol. 12, No. 4, pp. 375-393.

Improving the Retention of First year Students Page 172
Lenning, O.T., Beal, P.E. and Sauer, K. 1980 Retention and Attrition: Evidence for Action and Research, Boulder: National Centre for Higher Education Management Systems, 48 pages
Leppel, K. 1984, ‘The academic performance of returning and continuing college students’, Journal of Economic Education, Vol. 15, pp. 46-54.
Levin, J.R & Levin, M.E. 1993, ‘Methodological Problems in Research on Academic Retention Programs for At-Risk Minority College Students’, Journal of College Student Development, Vol. 34, No. 2, pp. 118-24.
Levin, M.E. & Levin, J.R. 1991, ‘A Critical Examination of Academic Retention Programs for At-Risk Minority College Students’, Journal of College Student Development, Vol. 32, No. 4, pp. 323-34.
Lewallen,W. 1993, ‘The Impact of Being ‘Undecided’ on College-Student Persistence’, Journal of College Student Development, Vol. 34, No. 2, pp. 103-12.
Lewis, D.E. 1991, Credit Transfers Between TAFE and Higher Education, University of Wollongong, DEET, Evaluations and Investigations Program, Australian Government Publishing Service, Canberra, 18 pages
Lewis, D.E. 1994, The Performance at University of Equity Groups and Students Admitted Via Alternative Modes of Entry, Higher Education Division, Evaluations and Investigations Program, Australian Government Publishing Service, Canberra., 21 pages
Light, G., & Cox, R. 2001, Learning and Teaching in Higher Education. London: PCP Publishing, 195 [ages
Light, R. J. 2001, Making the most of college: Students speak their minds. Cambridge, MA: Harvard University Press, 112 pages
Linke, R.D, Barton, A.R. & Cannon, A.R. 1985, Deferment of entry into higher education, Tertiary Education Authority of South Australia, 48 pages
Linke, R.D. 1992, ‘Some principles for application of performance indicators in higher education’, Higher Education Management, Vol. 4, No. 2, pp. 194-203.
Linke, R.D. et al. 1991, Performance indicators in higher education, DEET, Canberra AGPS, 17 pages
Lintern, S 2006, LOST Program for first year students, presented to 9th Pacific Rim Conference 2006 QUT, 6 pages
Logan, P.F & Bailey, D.E. 1983, ‘Diagnostic testing for success in tertiary physics’, Australian Physicist, Vol. 20, No. 3, pp. 62-65.
Logan, P.F. & Bailey, D.E. 1987, ‘Characteristics of students’, in Miller, A.H. & Sasche-Akerhurst, G The Learning in Higher Education: A Forgotten Species, ., pp. 240-247.
Improving the Retention of First year Students Page 173
Long, M. 1994, A Study of the Academic Results of On-Campus and Off-Campus Students: Comparative Performance Within Four Australian Tertiary Institutions, Australian Government Publishing Service, Canberra, 58 pages
Long, M., & Hayden, M. 2001, Paying their Way: A Survey of Australian Undergraduate University Student Finances, 2000. Retrieved 01 February 2006, 2006, from http://www.avcc.edu.au/documents/publications/policy/statements/final_report_re v_22_oct_01.pdf
Lowe, I. 1987, ‘Alternatives in tertiary selection’ Australian Mathematics Teacher, Vol. 43, No. 3, pp. 19-20.
Lublin. J. 1982, ‘Some alternative entry characteristics as factors in tertiary success’, Higher Education Research and Development, Vol. 1, No. 1, pp. 69-71.
Lumsden, K. & Scott, A. 1983, ‘The efficacy of innovative teaching techniques in economics: the UK experience’, American Economic Review, Vol. 73, pp. 13-17.
Lumsden, K.G. & Scott, A. 1987, ‘The economics student re-examined: Male-female differences in comprehension’, Journal of Economic Education, Vol. 18 pp. 365-375.
Lyons, L. 1991, ‘The Integration of Qualitative and Quantitative Research in a Longitudinal Retention Study’, Association for Institutional Research Forum Paper, San Francisco, 77 pages
Lysaght, P and Walton, R 2006, (University of Wollongong) A CD-ROM in Student Speak at the 2006 QUT 9th Pacific Conference
Mackie, S. E. ,2001, ‘Jumping the Hurdles - Undergraduate Student Withdrawal Behaviour’. Innovations in Education and Teaching International, 38(3).
Magel, R.C. 1996, ‘Increasing student participation in large introductory statistics courses’, The American Statistician, Vol. 50, No. 1, pp. 51-56.
Magolda, M. & Baxter, B. 1990, ‘The Impact of the Freshman Year on Epistemological Development: Gender Differences’, Review of Higher Education, Vol. 13, No. 3, pp. 259-84.
Marcoulides, G.A. & Goldstein, Z. 1992, ‘The Optimization of Multivariate Generalisability Studies with Budget Constraints’, Educational and Psychological Measurement, Vol. 52, No. 2, pp. 301-08.
Marsh, H. & Craven, R. 1994, ‘Who Benefits from Selective Schools? The Role of Academic Self Concept and a Call for Further Research’, Forum of Education, Vol. 49, No. 1, pp. 3-13.
Marsh, H.W. & Dunkin, J.J. 1991, ‘Student’s evaluations of university teaching: A multidimensional perspective’, in Higher Education: Handbook of Theory and Research, ed. J. Smart.
Improving the Retention of First year Students Page 174
Marsh, H.W. 1990, Self-Description Questionnaire – 1: Manual, Campbelltown, University of Western Sydney, 37 pages
Mason, P.M. et al. 1995, ‘Student Evaluations of Faculty: A New Procedure for Using Aggregate Measures of Performance’, Economics of Education Review, Vol. 14, No. 4, pp. 403-16.
McCaffrey, S. 1989, ‘A Key to Survival: The Retention of Adult Students in an External Degree Program’, ASHE Annual Meeting Paper.
McClelland, A.A. & Kruger, P.W. 1993, An Investigation of the Subsequent Performance in Tertiary Studies of Students Admitted Through the Queensland Tertiary Admissions Centre in 1989-90, Australian Government Publishing Service, Canberra, 14 pages
McInnes, C 2001 ‘Researching the first year experience: where to from here?’, Higher Education Research and Development, 20(2), pp. 105–114. McInnes, C, Griffin, P, James, R and Coates, H 2001 Development of the Course Experience Questionnaire (CEQ), Evaluations and Investigations Program, Higher Education Division, Department of Education, Training and Youth Affairs, Commonwealth of Australia, Canberra, 82 pages
McInnes, C., James, R, 2004 First Year Experience @ Griffith University Griffith University, 64 pages
McInnes, C., James, R. and McNaught, C. 1995 First Year on Campus Canberra: AGPS, 163 pages
McInnis C 1995, ‘Achieving quality learning in higher education’. Higher Education Research and
Development. 14 129-130.
McInnis, C. 2003, ‘From Marginal to Mainstream Strategies: responding to student diversity in Australian universities’. European Journal of Education, 38(4), 387 - 400.
McInnis, C., & James, R. 1995, First Year on Campus: Diversity in the Initial Experiences of Australian
Undergraduates. Canberra: Australian Government Publishing Service, 58 pages McInnis, C., James, R., & Hartley, R. 2000, Trends in the First Year Experience in Australian
Universities. Canberra: AGPS, 95 pages
McJamerson, E.McC. 1992, ‘Undergraduate Academic Major and Minority Student Persistence: Individual Choices, National Consequences’, Equity and Excellence, Vol. 25, No. 2-4, pp. 35-48.
McKeown, B., Macdonnell, A. & Bowen, C. 1993, ‘The Point of View of the Student in Attrition Research’, Canadian Journal of Higher Education, Vol. 23, No. 2, pp. 65-85.

Improving the Retention of First year Students Page 175
McClelland, A.A. and Kruger, P.W. 1993 An Investigation of the Subsequent Performance in Tertiary Studies of Students Admitted Through the Queensland Tertiary Admissions Centre in 1989-90, Canberra: Australian Government Publishing Service.
McPherson, A & Paterson, L. 1990, ‘Undergraduate Non-Completion Rates: A Comment’, Higher-Education, Vol. 19, No. 3, pp. 377-83.
Metzner, B.S. 1987, A Categorical Bibliography for Student Attrition Research. Review of Educational Research, 55(4), 485-540
Metzner,B.S. & Bean, J.P. 1987, ‘The Estimation of a Conceptual Model of Non-traditional Undergraduate Student Attrition’, Research in Higher Education, Vol. 27, No. 1, pp. 15-38.
Meyler, M.J. 1989, ‘A multivariate approach to the study of student success at university’, Higher Education Research and Development Society of Australia Conference, Perth, pp 36-39
Miller, M.T. & Dirkx, J.M. 1995, ‘Mentoring in Graduate Education: The Role of Graduate Student Organizations’, Journal of Adult Education, Vol. 23, No. 1, pp.20-30.
Minnaert, A. & Janssen, P.J. 1992, ‘Success and progress in higher education: A structural model of studying’, British Journal of Educational Psychology, Vol. 62, pp. 184-192.
Modk, D.H. 1989, ‘The education production function: its evaluating role in policy analysis’, Educational Evaluation and Policy Analysis, Vol. 11, No. 1, pp. 31-45.
Mortiboys, A. 2002, ‘Retention as a measure of university effectiveness’. Exchange, 1(14-16).
Moss, P. 1992, ‘Shifting Conceptions of Validity in Education of Management: Implications for Performance Indicators’, Review of Educational Research, Vol. 62, No. 3, pp. 229-288.
Muckert, T 2002 Investigating the Student Attrition Process and the Contribution of Peer-Mentoring Interventions in an Australian First Year University Program, Griffith University, pp 53-57
Muckert, T., Wilson, K. & Lizzio, A. 1996, ‘Can peer mentoring assist the adjustment of first year Psychology students in making the transition to university? A preliminary report of work in progress’, ‘First Year Experience’, Conference proceedings, University of Melbourne. pp 16-20
Munn, P. et al. 1994, The Effectiveness of Access Courses: Views of Access Students and Their Teachers, Research Report Series, Scottish Council for Research into Education, Edinburgh, pp 15-19
Munro, B. 1981, ‘Dropouts from higher education: Path analysis of a national sample’, American Educational Research Journal, Vol. 20, pp. 133-141.
Mutter, P. 1992, ‘Tinto's Theory of Departure and Community College Student Persistence’, Journal of College Student Development, Vol. 33, No. 4, pp. 310-18.

Improving the Retention of First year Students Page 176
Myers, R.S. & Pyles, M.R. 1992, ‘Relationships among high school grades, ACT test scores and college grades’, Mid-South Educational Research Association Conference Paper.
National Student Satisfaction Survey. 2005. Retrieved 21 February, 2006, from http://www1.tqi.ac.uk/sites/tqi/home/index.cfm National Audit Office. 2002, Improving Student Achievement in English Higher Education. London: The Stationery Office, 153 pages Nelson, K 2006, QUT presentation at the 9th Pacific Rim Conference ‘Engaging Students” 12 -14 July 2006, 47 slides
Neumann, Y. & Finaly-Neumann, E. 1989, ‘Predicting Juniors’ and Seniors’ Persistence and Attrition: A Quality of Learning Experience Approach’, Journal of Experimental Education, Vol. 59, pp. 129-140.
Neumann, Y., Finaly-Neumann, E. & Reichel, A. 1990, ‘Determinants and Consequences of Students’ Burnout in Universities’, Journal of Higher Education, Vol. 61, No. 1, pp. 21-31.
Nora, A. & Rendon, L.I. 1990, ‘Determinants of Predisposition to Transfer among Community College Students: A Structural Model’, Research in Higher Education, Vol. 31, No. 3, pp. 235-55.
Nora, A. 1987, ‘Determinants of Retention among Chicano College Students: A Structural Model’, Research in Higher Education, Vol. 26, No. 1, pp. 31-59.
Nora, A. et al. 1990, ‘Testing Qualitative Indicators of Precollege Factors in Tinto's Attrition Model: A Community College Student Population’, Review of Higher Education, Vol. 13, No. 3, pp. 337-55.
Nora, A., & Cabrera, A. F. 1996, ‘The role of perceptions of prejudice and discrimination on the adjustment of minority students to college’. Journal of Higher Education, 67, 119-148. Nora, A., Cabrera, A. F., Hagedorn, L. S., & Pascarella, E. T. 1996, ‘Differential impacts of academic and social experiences on college related behavioural outcomes across different ethnic and gender groups at four-year institutions’. . Research in Higher Education, 37 427- 452.
Norman, K.F. & Norman, J.E. 1995, ‘The Synergy of Minority Student Persistence and Faculty Renewal’, Innovative Higher Education, Vol. 20, No. 2, pp. 129-40.
Norton, C. & Reding, K. 1992, ‘Predicting Success in Collegiate Accounting Courses’, Journal of Education for Business, pp. 314-316.
Nourayi, M. & Cherry, A. 1993, ‘Accounting Students’ Performance and personality types’, Journal of Education for Business, pp. 111-115.
Improving the Retention of First year Students Page 177
O’Dowd, M. 1996, Young People At-Risk: Empowerment and Perspective, Unpublished PhD Thesis, Monash University, 175 pages
O’Dowd, M. 1997, The Transition Needs of Mature Age Students: An Evaluation of a Pilot Transition Program, Report to Monash University University Vice Chancellor (in process).
Orr, S., & Blythman, M. 2002, ‘Student success - a lesson from further education’. Exchange, 1(1), 20-22.
Ozga,J & Sukhnandan,L. 1998 "Undergraduate non-completion: Developing an explanatory model" Higher Education Quarterly vol.52 no.3 pp.316-333
Pacheco, A. 1994, ‘Bridging the Gaps in Retention: Metropolitan Universities, An International Forum, Vol. 5, No. 2, pp. 54-60.
Palmer, J., Carliner, G. & Romer, T. 1979, ‘Does high school economics help?’ Journal of Economic Education, Vol. 10, pp. 58-61.
Park, K.H. & Kerr, P.M. 1990, ‘Determinants of academic performance: A multinomial logit approach’, Journal of Economic Education, Vol. 21, pp. 101-111.
Parmar, D., & Trotter, E. 2005, ‘Keeping our Students: Identifying factors that influence student withdrawal and strategies to enhance the experience and retention of first year students’. Learning and Teaching in the Social Sciences, 1(3). Parry, G. 2003, A Short History of Failure. In M. Peelo & T. Wareham (Eds.), Failing Students in Higher Education (pp. 15-28). Buckingham: Open University Press/SRHE.
Pascarella, E & Terenzini, P, 1980 "Toward the validation of Tinto's model of college student attrition: A review of recent studies." Research in Higher Education, pp. 271-282.
Pascarella, E. T., & Chapman, D. W. 1983, ‘Validation of a theoretical model of college withdrawal: Interaction effects in a multi-institutional sample’. Research in Higher Education, 19, 25-48.
Pascarella, E. T., & Terenzini, P. T. 1991, How College Affects Students: Findings and Insights from Twenty Years of Research. San Francisco, CA: Jossey-Bass, 64 pages Pascarella, E. T., Pierson, C. T., Wolniak, G. C., & Terenzini, P. T. 2004 ‘First- Generation College Students: Additional Evidence on College Experiences and Outcomes’’. The Journal of Higher Education, 75(3).
Pascarella, E.T. & Chapman, D.W. 1983, ‘A Multi-Institutional, Path Analytic Validation of Tinto's Model of College Withdrawal’, American Educational Research Journal, Vol. 20, No. 1, pp. 87-102.

Improving the Retention of First year Students Page 178
Pascarella, E.T. & Terenzini, P.T. 1974, Ratings of the Academic Program by Freshman Students in Systematically Designed and Conventional Courses: A Discriminant Analysis, Syracuse University, N.Y, 95 pages
Pascarella, E.T. & Terenzini, P.T. 1977a, ‘Informal Interaction with Faculty and Freshman Ratings of Academic and Non-Academic Experience of College’, Journal of Educational Research, Vol. 70, No. 1, pp. 35-41.
Pascarella, E.T. & Terenzini, P.T. 1977b, ‘Patterns of Student-Faculty Informal Interaction Beyond the Classroom and Voluntary Freshman Attrition’, Journal of Higher Education, Vol. 48, No. 5, pp. 540-52.
Pascarella, E.T. & Terenzini, P.T. 1978, ‘Student-Faculty Informal Relationships and Freshman Year Educational Outcomes’, Journal of Educational Research, Vol. 71, No. 4, pp. 183-9.
Pascarella, E.T. & Terenzini, P.T. 1979a, ‘Interactive Influences in Spady and Tinto's Conceptual Models of College Attrition’, Sociology of Education, Vol. 52, No. 4, pp. 197-210.
Pascarella, E.T. & Terenzini, P.T. 1979b, ‘Student-Faculty Informal Contact and College Persistence: A Further Investigation’, Journal of Educational Research, Vol. 72, No. 4, pp. 214-18.
Pascarella, E.T. & Terenzini, P.T. 1980, ‘Predicting Freshman Persistence and Voluntary Dropout Decisions from a Theoretical Model’, Journal of Higher Education, Vol. 51, No. 1, pp. 60-75.
Pascarella, E.T. & Terenzini, P.T. 1981, ‘Residence Arrangement, Student/Faculty Relationships, and Freshman Year Educational Outcomes’, Journal of College Student Personnel, Vol. 22, No. 2, pp. 147-56.
Pascarella, E.T. & Terenzini, P.T. 1983, ‘Predicting Voluntary Freshman Year Persistence/Withdrawal Behavior in a Residential University: A Path Analytic Validation of Tinto's Model’, Journal of Educational Psychology, Vol. 75, No. 2, pp. 215-226.
Pascarella, E.T. & Terenzini, P.T. 1991, How College Affects Students: Findings and Insights from Twenty Years of Research, San Francisco, Josey-Bass, 47 pages
Pascarella, E.T. 1980, ‘Student-Faculty Informal Contact and College Outcomes’, Review of Educational Research, Vol. 50, pp. 545-95.
Pascarella, E.T. 1982a, ‘Perspectives on Quantitative Analysis for Research in Postsecondary Education’, Review of Higher Education, Vol. 5, No. 4, pp. 197-211.
Pascarella, E.T. 1982b, Validation of a Theoretical Model of College Dropouts, National Inst. of Education (ED) Washington, DC, 105 pages
Pascarella, E.T. 1986, ‘A Program for Research and Policy Development on Student Persistence at the Institutional Level’, Journal of College Student Personnel, Vol. 27, No. 2, pp. 100-107.

Improving the Retention of First year Students Page 179
Pascarella, E.T. et al. 1981, ‘Pre enrolment Variables and Academic Performance as Predictors of FreshmanYear Persistence, Early Withdrawal, and Stopout Behaviour in an Urban, Non-residential University’, Research in Higher Education, Vol. 15, No. 4, pp. 329-49.
Pascarella, E.T. et al. 1983a, ‘A Test and Reconceptualisation of a Theoretical Model of College Withdrawal in a Commuter Institution Setting’, Sociology of Education, Vol. 56, No. 2, pp. 88-100.
Pascarella, E.T. et al. 1983b, ‘Student-Faculty Relationships and Freshman Year Intellectual and Personal Growth in a Non-residential Setting’, Journal of College Student Personnel, Vol. 24, No. 5, pp. 395-402.
Pascarella, E.T. et al. 1986, ‘Long-Term Persistence of Two-Year College Students’, Research in Higher Education, Vol. 24, No. 1, pp. 47-71.
Pascarella, E.T. et al. 1994, ‘Impacts on 2-Year and 4-Year Colleges on Learning Orientations: A Preliminary Study, 1994, Community College Journal of Research and Practice, Vol. 18, No. 6, pp. 577-89.
Paterson, L. & Goldstein, H. 1991, ‘New Statistical Methods for Analysing Social Structures: An Introduction to Multilevel Models’, British Educational Research Journal, Vol. 17, No. 4, pp. 387-93.
Peat, M., Dalzeil, J., & Grant, A. M. 2001, ‘Enhancing the First Year Student Experience by Facilitating the Development of Peer Networks through a One-day Workshop’’. Higher Education Research & Development, 20(2), 199 - 215.
Peng, S.S. 1977, Transfer Students in Institutions of Higher Education, Research Triangle Institute, Durham, National Centre for Education Statistics,32 pages
Pharr, S., Bailey, J. & Dangerfield, B. 1993, ‘Admission/Continuance Standards as Predictors of Academic Performance of Business Students’, Journal of Education for Business, pp. 69-74.
Pitkethly, A., & Prosser, M. 2001 ‘The First Year Experience Project: a model for university-wide change’. Higher Education Research & Development, 20(2), 185 - 198.
Pongboriboon 1993, Variables influencing the mathematics performance of first-year tertiary students: a case study, Deakin University, Geelong, 52 pages
Pope, B., Cameron, B. & McClelland, A.A. 1991, Unmet Demand for Higher Education Places in Victoria and Queensland, Australian Government Printing Service, Canberra,. 153 pages
Pope, G. and Van Dyke, M. 1999 Mentoring.Value adding to the University In Success in Transition Years, proceedings of the 3rd Pacific Rim Conference on the First Year Experience. Auckland Institute of Technology, Auckland, New Zealand, 6 pages
Powell, J. 1979, ‘From School to University’, The Australian Journal of Education, Vol. 23, No. 2, pp. 113-120.
Improving the Retention of First year Students Page 180
Power, C & Robertson, F. 1987, Factors influencing participation in higher education in Australia, National Institute of Labour Studies, Flinders University, South Australia, 25 pages
Preston, D.L. 1993, ‘Using the CCSEQ in Institutional Effectiveness: The Role of Goal Commitment and Student's Perception of Gains’, Association for Institutional Research Conference Paper, Chicago, 16 pages
Price, D., Harte, J. & Cole, M. 1992 Student Progression in Higher Education: A Study of Attrition at Northern Territory University, DEET, Evaluation and Investigations Program, Australian Government Publishing Service, Canberra, 53 pages
Raaheim, K., Wankowski, J., & Radford, J. 1991, Helping Students to Learn: Teaching, Counselling, Research. Buckingham: SHRE and OUP, 118 pages
Raciti, M, 2006 Engaging first-year students through Relationship Marketing, 9th Pacific Rim in Higher Education Conference 2006 QUT, 42 slides and 12 pages
Ramirez, H. 1994, ‘Programs and Drop-out in Universidad Estatal a Distancia (UNED) of Costa Rica’, The American Journal of Distance Education, Vol. 8, No. 3, pp. 64-73.
Ramsay, A.L. & Baines, A.R. 1996, The Impact of Gender on Student Performance in Introductory Accounting Courses, Department of Accounting and Finance, Monash University, 63 pages
Ramsden, P. 1992. Learning to Teach in Higher Education. London: Routledge, 241 Pages
Ramsden, P. 1991, ‘Study processes in Grade 12 environments’, in Fraser, B.J. & Walberg, H.J. (eds) Educational Environments. Evaluation, Antecedents and Consequences, New York: Pergamon Press, pp 45-47
Ramsden, P., Martin E. & Bowden, J. 1989, ‘School environment and sixth form pupils’ approaches to learning’, Journal of Educational Psychology, Vol. 59, pp. 129-142.
Rasbash, J. & Goldstein, H. 1994, ‘Efficient Analysis of Mixed Hierarchical and Cross-Classified Random Structures Using a Multilevel Model’, Journal of Educational and Behavioural Statistics, Vol. 19, No. 4, pp. 337-50.
Rasell, E. & Rothstein, R. 1993, ‘School Choice: Examining the Evidence’, Economic Policy Institute, Washington, DC,37 pages
Raudenbush, S.W. & Chan, W.S. 1993, ‘Application of a Hierarchical Linear Model to the Study of Adolescent Deviance in an Overlapping Cohort Design’, Journal of Consulting and Clinical Psychology, Vol. 61, No. 6, pp. 941-51.
Raudenbush, S.W. & Willms, J.D. 1995, ‘The Estimation of School Effects’, Journal of Educational and Behavioural Statistics, Vol. 20, No. 4, pp. 307-35.
Improving the Retention of First year Students Page 181
Raudenbush, S.W. 1993, ‘A Crossed Random Effects Model for Unbalanced Data with Applications in Cross-Sectional and Longitudinal Research’, Journal of Educational Statistics, Vol. 18, No. 4, pp. 321-49.
Raudenbush, S.W. et al. 1991, ‘A Multilevel, Multivariate Model for Studying School Climate with Estimation via the EM Algorithm and Application to U.S. High-School Data’, Journal of Educational Statistics, Vol. 16, No. 4, pp. 295-330.
Riley, K.A. & Nuttall, D.L. (eds) 1994, Measuring Quality: Education Indicators-United Kingdom and International Perspectives, Falmer Press, Bristol, pp 25 - 27
Roberts, D. 1984 Ways and means of reducing early student drop-out rates, Distance Education, 5, pp. 50–71.
Rogosa, D. & Saner, H. 1995, ‘Longitudinal Data Analysis Examples with Random Coefficient Models’, Journal of Educational and Behavioural Statistics, Vol. 20, No. 2, pp. 149-70.
Romer, D. 1993, ‘Do students go to class? Should they?’, Journal of Economic Perspectives, Vol. 7, No. 3, pp. 167-174.
Rowe, K.J., Hill, P.W. & Holmes-Smith, P. 1995, ‘Methodological Issues in Education Performance and School Effectiveness Research: A Discussion with Worked Examples’, Australian Journal of Education, Vol. 39, No. 3, pp. 217-248.
Rudman, S, 2006 Mentors @Macquarie presented at 9th Pacific Rim Conference 2006 QUT, 38 slides
Rump, E. & Greeb, N. 1975, ‘The characteristics and motivations of students who withdraw without failing’, Vestes, Vol. 18, pp. 150-160.
Sadler, R. 1986, ‘The prediction of tertiary success: a cautionary note’, Journal of Tertiary Educational Administration, Vol. 8, No. 2, pp. 151-158.
Salemi, M.K. & Tauchen, G.E. 1980, ‘Guessing and the error structure of learning models’, American Economic Review, Vol. 70, No. 2, pp. 41-49.
Salganik, L.H. 1994, ‘Apples and Apples: Comparing Performance Indicators for Places with Similar Demographic Characteristics’, Educational Evaluation and Policy Analysis, Vol. 16, No. 2, pp. 125-41.
Sawchuk, M.T. 1991, Access and Persistence: An Educational Program Model. Celebrating Cultural Diversity in Higher Education, Mount St. Mary’s College, Los Angeles, 97 pages
SCEE. 2001, Select Committee on Education and Employment, Higher Education: Student Retention, Sixth Report, HC 124. Retrieved 16th April, 2003, from http://www.publications.parliament.uk/pa/cm200001/cmselect/cmeduemp/124/12408.ht

Improving the Retention of First year Students Page 182
Schedvin, M. 1985, ‘"Why we discontinued": an exploration of voluntary discontinuation of studies among first year students at a college of health science’, Higher Education Research Development, Vol. 4, No. 2, pp. 159-173.
Schofield, H. 1989, ‘The predictive value of school based assessment in tertiary selection’, Australian Association for Research in Education Conference, Adelaide Pp 43-45
Schuller,T. & Bamford,C. 2000 "A social capital approach to the analysis of continuing education: evidence from the UK Learning Society research programme" Oxford Review of Education vol.26 no.1 pp.5-19
Schultz, R.A. et al. 1992, ‘Assessing a Short-Term Intervention to Senior secondary school persistence and attrition: the development and testing of a theoretical model. Facilitate Academic Success’, NASPA Journal, Vol. 30, No. 1, pp. 43-50.
Scott, G 1999 Change Matters: Making a Difference in Education & Training, Allen & Unwin, Sydney, pp 140-160 Scott, G 2004 ‘Change matters; making a difference in higher education’, in Carmichael, R (ed) 2004, Quality in a time of change, Proceedings of AUQF 2004, AUQA Melbourne, pp. 35–51. Scott, G 2005 ‘Accessing the Student Voice’, Final Report, DEST,, 142 pages
Secretary of State for Education and Employment 2000,. Funding Letter to the Higher Education Funding Council for England, 29 November, cited in Floud (2002, p57).
Selby, P. & Hore, T. 1996, Cohort ‘94: A Longitudinal Study of Student Characteristics and Expectations, Professional Development Centre, Monash University, pp 46-49
Seltzer, M.H. 1993, ‘Sensitivity Analysis for Fixed Effects in the Hierarchical Model: A Gibbs Sampling Approach’, Journal of Educational Statistics, Vol. 18, No. 3 pp. 207-35.
Seltzer, M.H. 1994, ‘Studying Variation in Program Success: A Multilevel Modelling Approach’, Evaluation Review, Vol. 18, No. 3, pp. 342-61.
Seltzer, M.H. et al. 1994, ‘The Metric Matters: The Sensitivity of Conclusions about Growth in Student Achievement to Choice of Metric’, Educational Evaluation and Policy Analysis, Vol. 16, No. 1, pp. 41-49,
Shah, C. & Burke, G. 1996, Student Flows in Australian Higher Education, Monash, ACER, Centre for the Economics of Education and Training, Australian Government Publishing Service, Canberra, 107 pages
Sharma, R. & Dobson, I. 1995, Student Performance and the Diversification of Modes of University Study and Bases of Admission, Australian Government Publishing Service, Canberra, 113 pages
Improving the Retention of First year Students Page 183
Sharma, R. and Burgess, Z. 1994 Student discontinuation at a technological higher education institution, Journal of Tertiary Education Administration, 16, pp. 225–238.
Sheldrake, P. 1976, ‘Failure and Withdrawal: Student Dropout at Flinders University’, Vestes, Vol. 19, pp. 25-29.
Sherman, R.H. & Tinto, V. 1975, ‘The Effectiveness of Secondary and Higher Education Intervention Programs: A Critical Review of Research’, American Educational Research Association Conference Paper, Washington USA, 85 pages
Siegfried, J. & Fels, R. 1979, ‘Research on Teaching Economics: A Survey’, Journal of Economic Literature, Vol. 17, pp. 923-69.
Siegfried, J. & Walstead, W. 1991, Research on Teaching College Economics. In the Principles of Economics Comes: A Handbook, for instructors, ed. Saunders, P. & Walstead, W., N.Y., McGraw Hill, 254 pages
Simpson, C., Baker, K., & Mellinger, M. 1980, ‘Conventional failures and unconventional dropouts: Comparing different types of university withdrawals’. Sociology of education, 53, 203-214.
Singer, J.D. & Willett, J.B. 1993a, ‘It's about Time: Using Discrete Time Survival Analysis to Study Duration and the Timing of Events’, Journal of Educational Statistics, Vol. 18, No. 2, pp. 155-95.
Singer, J.D. & Willett, J.B. 1993b, ‘New Methods for Studying Event Occurrence: Using Survival Analysis in Early Intervention Research’, Journal of Early Intervention, Vol. 17, No. 3, pp. 322-39.
Sladden, J.D. 1979, ‘Secondary/tertiary transition’, Pivot, Vol. 6, No. 1, pp. 39-43.
Smith, P. 1990, ‘The Use of Performance Indicators in the Public Sector’, Journal of the Royal Statistical Society, A, Vol. 153, No. 1, pp. 53-72.
Smyth, G.K., Knuiman, M.W., Thornett, M.L. & Kiiveri, H. 1990, ‘Using the EM algorithm to predict first year university performance’, Australian Journal of Education, Vol. 34, No. 3, pp. 204-224.
Spady, W.D. 1970, ‘Dropouts for Higher Education: Towards an Empirical Model’, Interchange, Vol. 2, No. 3, pp. 38-62.
Spann, N.G. 1990, ‘Student Retention: An Interview with Vincent Tinto’, Journal of Developmental Education, Vol. 14, No. 1, pp. 18-20,22,24.
Spector, L.C. & Mazzeo, M. 1980, ‘Probit analysis and economic education’, Journal of Economic Education, Vol. 11, pp. 37-44.
Stage, F.K. & Rushin, P.W. 1993, ‘A Combined Model of Student Predisposition to College and Persistence in College’, Journal of College Student Development, Vol. 34, No. 4, pp. 276-82.
Improving the Retention of First year Students Page 184
Stage, F.K. 1987, ‘University Attrition: LISREL with Logistic Regression for the Persistence Criterion’, American Educational Research Association Conference paper, Washington.
Stage, F.K. 1989 ‘Motivation, Academic and Social Integration, and the Early Dropout, 1989’, American Educational Research Journal, Vol. 26, No. 3, pp. 385-402
Stahl, V.V, Pavel, D. & D. M. 1992, Assessing the Bean and Metzner Model with Community College Student Data.
Stanley, G. & Oliver, J. 1994, ‘Variation in student selection within the Australian Unified National System: a case study in undergraduate business studies from Western Australia’, Higher Education, Vol. 28, No. 3, pp. 113, 291-299
Steele, G.E. et al 1993, ‘The Retention of Major-Changers: A Longitudinal Study’, Journal of College Student Development, Vol. 34, No. 1, pp. 58-62.
Stone, H.R. 1988, ‘Capabilities of traditional quantitative admissions criteria in predicting performance of off campus engineering graduate students enrolled in videotaped courses’, Distance Education, Vol. 9, No. 2, pp. 250-272.
Sweet, R. 1986, ‘Student dropout in distance education: an application of Tinto's model’, Distance Education, Vol. 7, No. 2, pp. 201-213.
Swift, J.S. Jr. 1987, ‘Retention of Adult College Students’, NACADA Journal, Vol. 7, No. 2, pp. 7-19.
Szafran, R F. 2001 'The Effect of Academic Load on Success for New College Students: Is Lighter Better?', Research in Higher Education (2001) Vol. 42, No.1 pp.27-50
Tay, R.S. 1994, ‘Students' Performance in Economics: Does the Norm Hold across Cultural and Institutional Settings?’, Journal of Economic Education, Vol. 25, No. 4, pp. 291-301.
Terenzini, P.T. & Pascarella, E.T. 1977, ‘Voluntary Freshman Attrition and Patterns of Social and Academic Integration in a University: A Test of a Conceptual Model’, Research in Higher Education, Vol. 6, No. 1, pp. 25-43.
Terenzini, P.T. & Pascarella, E.T. 1980a, ‘Toward the Validation of Tinto's Model of College Student Attrition: A Review of Recent Studies’, Research in Higher Education, Vol. 12, No. 3, pp. 271-82.
Terenzini, P.T. & Pascarella, E.T. 1980b, ‘Student/Faculty Relationships and Freshman Year Educational Outcomes: A Further Investigation’, Journal of College Student Personnel, Vol. 21, No. 6, pp. 521-28.
Terenzini, P.T. & Pascarella, E.T. 1984, ‘Freshman Attrition and the Residential Context’, The Review of Higher Education, Vol. 7, No. 2, pp. 111-24.

Improving the Retention of First year Students Page 185
Terenzini, P.T. & Pascarella, E.T. 1990, ‘Twenty Years of Research on College Students: Lessons for Future Research’, Association for Institutional Research, forum paper, pp 33-37
Terenzini, P.T. & Wright, T.M. 1987a, ‘Differences in Academic Skill Development among Men and Women during the First Two Years of College’, American Education Research Association, Conference paper, Washington, 11-15
Terenzini, P.T. & Wright, T.M. 1987b, ‘Influences on Students' Academic Growth During Four Years of College’, Research in Higher Education, Vol. 26, No. 2, pp. 161-79.
Terenzini, P.T. 1993a, ‘On the Nature of Institutional Research and the Knowledge and Skills It Requires’, Research in Higher Education, Vol. 34, No. 1, pp. 1-10.
Terenzini,P.T. & Pascarella, E.T. 1978, The Role of Students' Backgrounds and Levels of Academic and Social Integration in College Attrition: A Test of a Model, Syracuse University, New York.
Thomas, L. 2001, ‘Power, assumptions and prescriptions: a critique of widening participation policy-making’. Higher Education Policy, 14(4), 361-376. Thomas, L. 2002, ‘Student retention in higher education: the role of institutional Habitus’. Journal of Education Policy, 17(4), 423-442.
Thomas, R.O. & Bean, J.P. 1988, ‘Student Retention at Liberal Arts Colleges: The Development and Test of a Model’, Association for the Study of Higher Education Conference paper, St. Louis, pp 41-47
Thomas, S. & Mortimore, P. 1996, ‘Comparison of value-added models for secondary-school effectiveness’, Research Papers in Education, Vol. 11, No. 1, pp. 5-33.
Thomas, S., Sammons, P. & Mortimore, P. 1995, ‘Determining What "Adds Value" to Student Achievement’, Educational Leadership International, pp. 19-22.
Thompson, A.P & Smith, L.M. 1982, ‘Conceptual, computational correlates of student performance in introductory statistics’, Australian Psychologist, Vol. 17, No. 2, pp. 191-197.
Thompson, G. 1984, ‘The Cognitive Style of Field-Dependence as an Explanatory Construct in Distance Education Drop-Out’, Distance Education, Vol. 5, No. 2, pp. 286-93.
Tiggemann, M. & A.H. Winefield, 1989, ‘Prediction of employment, unemployment and further study among school-leavers’, Journal of Occupational Psychology, Vol. 62, No. 3, pp. 213-221.
Tinto, V. & Wallace, D.L. 1986, ‘Retention: An Admission Concern’, College and University, Vol. 61, No. 4, pp. 290-93.
Tinto, V. 1988, ‘Stages of Student Departure: Reflections on The Longitudinal Character of Student Leaving’. The Journal of Higher Education, 59(4), 438-455.

Improving the Retention of First year Students Page 186
Tinto, V. 1993, Leaving College: rethinking the Causes and Cures of Student Attrition, 2nd edition. Chicago,
IL: The University of Chicago Press, pp 142 -150 Tinto, V. 1996, ‘Reconstructing the first year of college’. Planning for Higher Education, 25(1-6). Tinto, V. 1997, ‘Classrooms as Communities: Exploring the Educational Character of Student
Persistence’. The Journal of Higher Education, 68(6), 599-623.
Tinto, V. 1972, The Effect of College Proximity on Rates of College Attendance, Columbia University Teachers College, New York, 249 pages
Tinto, V. 1975, ‘Dropout from higher education: A theoretical synthesis of recent research’, Review of Educational Research, 45, pp. 89–125.
Tinto, V. 1982, ‘Limits of Theory and Practice in Student Attrition’, Journal of Higher Education, Vol. 53, No. 6, pp. 687-700.
Tinto, V. 1988, ‘Stages of Student Departure: Reflections on the Longitudinal Character of Student Leaving’, Journal of Higher Education, Vol. 59, No. 4, pp. 438-55.
Tinto, V. 1990, ‘Principles of Effective Retention’, Journal of the Freshman Year Experience, Vol. 2, No. 1, pp. 35-48.
Tinto, V. 1993 Leaving University: Rethinking the causes and cures of student attrition (Second Edition). Chicago: University of Chicago Press, 153 pages
Tinto, V. 1995, ‘Educational Communities and Student Success in the First Year of University’, Transition from Secondary School to University Conference Paper, Monash University, pp55-65
Tinto, V. 2002 Taking Student Learning Seriously, Maricopa Centre for Learning and Instruction http://www.mcli.dist.maricopa.edu
Trotter, E. 2003, Enhancing the Early Student Experience, from http://www.edu.salford.ac.uk/scd/documents/docs/enhancing_student_exp.rtf Trotter, E. 2006, ‘Student Perceptions of Continuous Summative Assessment’. Assessment and Evaluation in Higher Education, 31(5), forthcoming. Trotter, E., & Cove, G. 2005,. ‘Student retention: an exploration of the issues prevalent on a healthcare degree programme with mainly mature students’’ . Learning in Health and Social Care, 4(1), 29-42.
Tutton, P.J.M. & Wigg, S.J. 1990, ‘The influence of last secondary school attended, subjects taken in last year of secondary education and gender on preclinical performance of medical students’, Australian Journal of Education, Vol. 34, No. 2, pp. 168-173.

Improving the Retention of First year Students Page 187
Twomey, J.L. 1991 Academic performance and retention in a peer mentor program at a two-year campus of a four-year institution. Research report. Alamagordo, NM: New Mexico State University, pp 36-52
Tymms, P. 1995, ‘A Comment on Gray, Jesson, Goldstein, Hedger, and Rasbash’, School Effectiveness and School Improvement, Vol. 6, No. 2, pp. 115-17.
UAC Guide 2006 (University Admissions Centre (NSW & ACT) Pty Ltd) UAC Guide www.uac.ecu.au
Umoh,U.J. et al. 1994, ‘Factors Related to Student Retention in Community College Developmental Education Mathematics’, Community College Review, Vol. 22, No. 2, pp. 37-47.
Universities UK. 2002,. Higher Education in facts and figures. London: HESA. 69 pages University of Western Sydney 2004 UWS First Year Exit Survey, UWS, Sydney [available online at: www.uws.edu.au/quality ] Upcraft, L John N. Gardner, and Associates, 1989 The Freshman Year Experience: Helping Students Survive and Succeed in College, Jossey-Bass/Wiley, 189 pages UWS Performance Portfolio 2006 The University of Western Sydney, 64 pages
UWS Assessment Guide, 2008, UWS, 58 pages
UWS web site http://www.uws.edu.au/staff/adminorg/corpserv/opq/portfolio cited 1.4.2006 UWS 2005 Divisional Review – Project Management Information paper – see Appendix 6
UWS Academic Advising for New Students 2005 A working party chaired by Kim Nemetz – 9 May 2005 UWS Course Experience Questionnaire (CEQ) 2005 Office of Planning and Quality in association with Graduate Careers Australia UWS Course Guide/Handbook – Engineering cited 1.4.2006 http://handbook.uws.edu.au/hbook/course.asp?course=3621.2 UWS Course Report CSTE 2005 Engineering http://www.uws.edu.au/staff/adminorg/corpserv/opq/stats UWS Literature LEAFLETS 2005 “The Essential Guide”, “Dollars and Sense”, “Sleep Soundly for Success”, “Walk Before you Talk” UWS Retention Action Plan 2005. University of Western Sydney, 25 pages
UWS Tracking and Improvement System for Learning & Teaching (TILT) 2006
Improving the Retention of First year Students Page 188
UWS VICE-CHANCELLOR’S OPENING ADDRESS SENIOR MANAGEMENT CONFERENCE 19 AUGUST 2004 Sustainability UWS What Retains Students & Promotes Productive Learning in Higher Education 2005 Scott, G, Bond, N and Webb, C UWS, 44 pages
Van Rossum, E.J. & Schenk, S.M. 1984, ‘The relationship between learning conception, study strategy and learning outcome’, British Journal of Educational Psychology, Vol. 54, pp. 73-83.
Volkwein, J.F. 1991, ‘Improved Measures of Academic and Social Integration and Their Association with Measures of Student Growth’, Association for Institutional Research, Conference paper.
Walberg, H. & Haertel, G. 1990, The International Encyclopaedia of Educational Evaluation, Pergamon Press.
Walleri, R.D. & Peglow-Hock, M. 1988, ‘Case Studies of Non-Traditional High Risk Students: Does Social and Academic Integration Apply?’, Association for Institutional Research, Conference Paper, Phoenix, p 30-64
Walmsley, D.J 1990, ‘How well do HSC scaled aggregate scores predict university performance in geography?’ Geography Bulletin, Vol. 22, No. 3, pp. 241-245.
Warwick-James, J.J. 1994, Pilot Study: Retention and Withdrawal Among First Year Students in Science, Student Services, University of New South Wales, 52 pages
Watkins, D & Hattie, J. 1985, ‘A longitudinal study of the approaches to learning of Australian tertiary students’, Human Learning (UK) Vol. 4, No. 2, pp. 127-141.
Watkins, D & Hattie, J. 1990, ‘Individual and contextual differences in the approaches to learning of Australian secondary school students’, Educational Psychology (UK) Vol. 10, No. 4, pp. 33-342.
Watkins, D & Hattie, J. 1992, ‘The motive-strategy congruence model revisited’, Contemporary Educational Psychology (US) Vol. 17, No. 2, pp. 194-198.
Watkins, D. 1978, ‘A note on student satisfaction with university: a case study’, Education Research and Perspectives, Vol. 5, No. 2, pp. 45-53.
Watkins, D. 1979a, ‘Prediction of university success: a follow up study of the 1977 internal intake to the University of New England’, Australian Journal of Education, Vol. 23, No. 3, pp. 301-3.
Watkins, D. 1982a, ‘Factors influencing the study methods of Australian tertiary students’, Higher Education, Vol. 11, No. 4, pp. 369-380.
Watkins, D. 1982b, ‘Identifying the study process dimensions of Australian university students’, Australian Journal of Education, Vol. 26, No. 1, pp. 76-85.

Improving the Retention of First year Students Page 189
Watkins, D. 1982c, ‘Students' personality and satisfaction with an Australian University: a study of interdisciplinary differences’, Higher Education Research and Development, Vol. 1, No. 2, pp. 155-165.
Watkins, D. 1982d, ‘Academic achievement and the congruence of study motivation and strategy’, British Journal of Educational Psychology (UK) Vol. 52, No. 2, pp 572-581
Watkins, D. 1983, ‘Assessing tertiary study processes’, Human Learning (UK) Vol. 2, No. 1, pp. 29-37.
Watkins, D. 1984, ‘Student perceptions of factors influencing tertiary learning’, Higher Education Research and Development, Vol. 3, No. 1, pp. 33-50.
Watkins, D. 1985, ‘How students explain their academic performance’, Higher Education Research Development, Vol. 4, No. 1, pp. 89-93.
Watkins, D. 1986a, ‘The approaches to learning of Australian tertiary students: a replication’, Higher Education Research and Development Vol. 5, No. 2, pp. 185-190.
Watkins, D. 1986b, ‘Assessing Causal Dimensions’, Australian Psychologist, Vol. 21, No. 3, pp. 467-472.
Watkins. D. 1979b, ‘The adjustment of mature age un-matriculated entrants to life as internal students at the University of New England: a pilot study’, Vestes, Vol. 22, No. 1, pp. 48-51.
Watkins. D. 1981, ‘The relationship between student and lecturer educational orientations and voluntary withdrawal at an Australian university’, Education Research and Perspectives, Vol. 8, No. 2, pp. 79-82.
Watson, G., Johnson, G. C., & Austin, H. 2004, ‘Exploring relatedness to field of study as an indicator of student retention’. Higher Education Research & Development, 23(1), 57 - 72.
Watson, J.M. 1988, ‘Student characteristics and prediction of success in a conventional university mathematics course’, Journal of Experimental Education (US), Vol. 56, No. 4, pp. 203-212.
Waugh, R, 2001, ‘Quality of student experiences at university: A Rasch measurement model analysis’, Australian Journal of Education, 45 (2), pp.183-206.
Weidman, J.C. & White, R.N. 1985, ‘Post-secondary "High-Tech" Training for Women on Welfare: Correlates of Program Completion’, Journal of Higher Education, Vol. 56, No. 5, pp. 555.
West, L.H.T. 1986, ‘Differential prediction of first year university performance for students from different social backgrounds’, Australian Journal of Education, Vol. 29, No. 2, pp. 175-187.
Improving the Retention of First year Students Page 190
White, R. T., Gunstone, R., Elterman, E., Macdonald, I. D. H., McKittrick, B., Mills, D., & Mullhall, P. 1995, ‘Students’ perceptions of teaching and learning in first-year university physics’, Research in Science Education, Vol. 25, No. 4, pp. 465-478.
Wikipedia. (2005). Pierre Bourdieu. Retrieved 26 August, 2005, from http://en.wikipedia.org/wiki/Pierre_Bourdieu Wilcox, P, Winn, S, and Fyvie-Gauld, M 2005 ‘“It was nothing to do with the university, it was just the people”: the role of social support in the first-year experience of higher education’, Studies in Higher Education, 30(6), pp. 707–722.
Wilhite, S.C. 1990, ‘Self-efficacy, locus of control, self-assessment of memory ability, and study activities as predictors of college course achievement’, Journal of Educational Psychology, Vol. 82, No. 4, pp. 696-700.
Willett, J.B. & Singer, J.D. 1991, ‘From Whether to When: New Methods for Studying Student Dropout and Teacher Attrition’, Journal of Educational of Behavioural Statistics, Vol. 20, No. 1, pp. 41-67.
Willett, J.B. & Singer, J.D. 1995, ‘It's Deja Vu All over Again: Using Multiple-Spell Discrete-Time Survival Analysis’, Journal of Educational and Behavioural Statistics, Vol. 20, No. 1, pp. 41-67.
Williams, M.L., Waldauer, C. & Duggal, V.G. 1992, ‘Gender Differences in Economic Knowledge: An Extension of the Analysis’, Journal of Economic Education, pp. 219-231.
Willms, J. D. & Kerckhoff, A.C. 1995, ‘The Challenge of Developing New Educational Indicators’, Educational Evaluation and Policy Analysis, Vol. 17, No. 1, pp. 113-31.
Wilson, KL, Lizzio, A and Ramsden, P 1997 ‘The development, validation and application of the Course Experience Questionnaire’, Studies in Higher Education, 22, pp. 33–53. Wilson, KL, Lizzio, A, & Ramsden, P 1996 The Use and Validation of the Course Experience Questionnaire, Griffith Institute of Higher Education, Griffith University.
Winefield, H.R., Tiggeman, M., Goldney, R.D. & Winefield, A.H. 1992, ‘Predictors and consequences of tertiary education: A nine-year follow-up of academically capable school leavers’, British Journal of Educational Psychology, Vol. 62, No. 1, pp. 148-153.
Wood, R. 1986, ‘The agenda for educational measurement’, in Assessing Educational Achievement, ed. Nuttall, D.L., Falmer Press.
Woodhouse, G. & Goldstein, H. 1988, ‘Educational Performance Indicators and LEA League Tables’, Oxford Review of Education, Vol. 14, No. 3, pp. 301-20.
Woodhouse, G. Yang, M., Goldstein, H. & Rasbash, J. 1996, ‘Adjusting for Measurement Error in Multilevel Analysis’, J.R. Statist. Soc. A. Vol. 159, No. 2, pp. 202-212.
Improving the Retention of First year Students Page 191
Wright, R.E. & Palmer, J. 1994, ‘GMAT Scores and Undergraduate GPAs as Predictors of Performance in Graduate Business Programs’, Journal of Education for Business, pp. 344-348.
Yorke, M., 2001, ‘Formative assessment and its relevance to retention’, Higher Education Research and Development, 20(2), pp. 115–126. Yorke, M and Thomas, L 2003 ‘Improving the retention of students from lower socio- economic groups’, Journal of Higher Education Policy and Management, 25(1), pp. 63–74. Yorke, M. 2002, ‘Formative assessment - the key to a richer learning experience in semester one’. Exchange(1), 12-13. Yorke, M., & Thomas, L. 2003, ‘Improving the Retention of Students from Lower Socio-economic Groups’. Journal of Higher Education Policy and Management, 25(1), 63-74.
Youngs, G.A. Jr., Rathge, R., Mullis, R. & Mullis, A. 1990, ‘Adolescent stress and self-esteem’, Adolescence, Vol. 25, pp. 333-341.
Zahrly, J. 1990, ‘The Use of Discriminant Analyses to Determine Subject Attrition Bias in Field Research’, Educational and Psychological Measurement, Vol. 50, pp. 505-514.
Zeegers, P., & Martin, L. 2001, ‘A Learning-to-learn Program in a First-year Chemistry Class’. Higher Education Research & Development, 20(1), 35 - 52.
Zimitat, C, 2006 Improving Quality of Teaching is Improving Retention, a paper presented to the 9th Pacific Rim Conference 2006 QU
Improving the Retention of First year Students Page 192
Chapter 10
Appendices These materials in the appendices are copies of documents and have not been rearranged.
Page
Appendix 1 DEST Tables of Higher Education attrition and enrolment rates 193
Appendix 2 Notes to accompany DEST Tables of attrition data 207
Appendix 3 Questionnaires to Students regarding (1) Enrolment October 2005 209 and (2) Orientation March 2006 Appendix 4 Orientation Program 2006 222
Appendix 5 Factor Analysis for CEQ Good teaching Scale 1999 226 Appendix 6 Analysis of Mathematics entry and exam data for UWS 228
School of Engineering students 2005
Appendix 7 The UWS College 3-semester program 235
Appendix 8 Report of the Group reviewing enrolment 2005 237
Appendix 9 “First Year Central” website Checklist 242
Improving the Retention of First year Students Page 193
Appendix 1
DEST Tables of Student Retention
Please note that the DEST tables include data related to all universities across Australia whereas this thesis focuses on UWS and comparisons with other universities in NSW. A comparison is also made with the “total” Australia figures at the foot of each table. Please refer to Appendix 2 for accompanying notes relating to these tables.
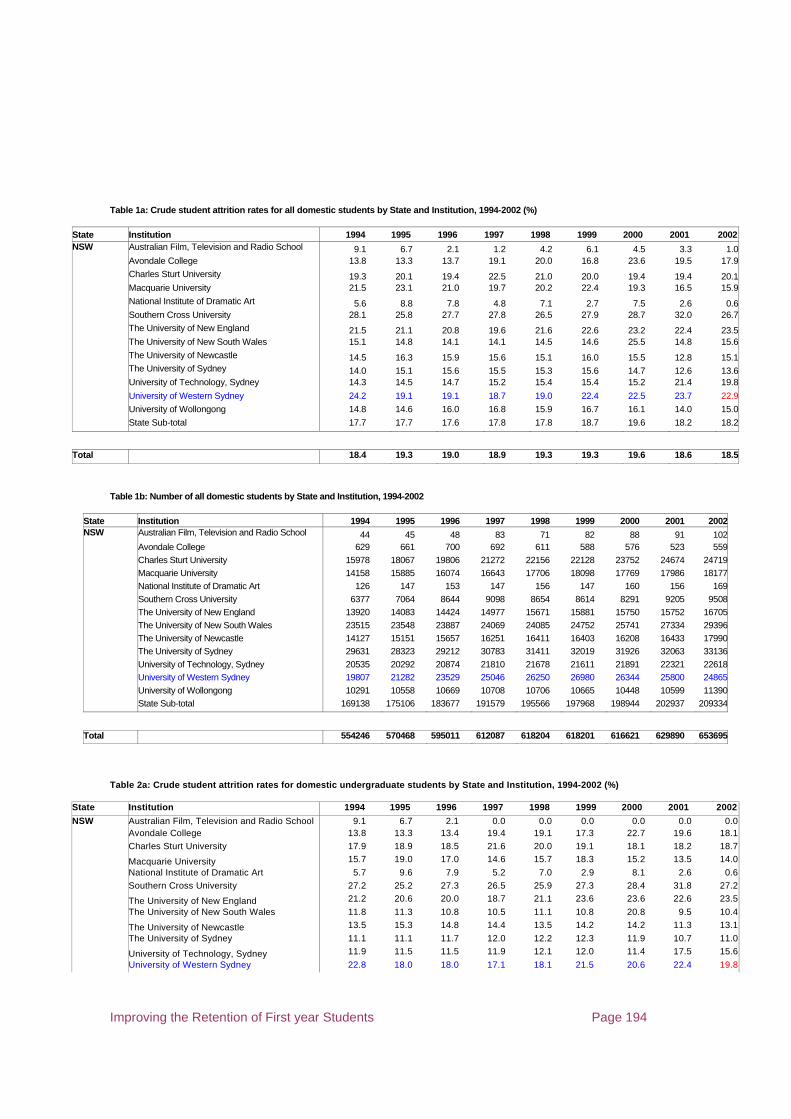
Improving the Retention of First year Students Page 194
Table 1a: Crude student attrition rates for all domestic students by State and Institution, 19 94-2002 (%)
State Institution 1994 1995 1996 1997 1998 1999 2000 2001 2002NSW Australian Film, Television and Radio School 9.1 6.7 2.1 1.2 4.2 6.1 4.5 3.3 1.0 Avondale College 13.8 13.3 13.7 19.1 20.0 16.8 23.6 19.5 17.9
Charles Sturt University 19.3 20.1 19.4 22.5 21.0 20.0 19.4 19.4 20.1 Macquarie University 21.5 23.1 21.0 19.7 20.2 22.4 19.3 16.5 15.9
National Institute of Dramatic Art 5.6 8.8 7.8 4.8 7.1 2.7 7.5 2.6 0.6 Southern Cross University 28.1 25.8 27.7 27.8 26.5 27.9 28.7 32.0 26.7
The University of New England 21.5 21.1 20.8 19.6 21.6 22.6 23.2 22.4 23.5 The University of New South Wales 15.1 14.8 14.1 14.1 14.5 14.6 25.5 14.8 15.6
The University of Newcastle 14.5 16.3 15.9 15.6 15.1 16.0 15.5 12.8 15.1 The University of Sydney 14.0 15.1 15.6 15.5 15.3 15.6 14.7 12.6 13.6 University of Technology, Sydney 14.3 14.5 14.7 15.2 15.4 15.4 15.2 21.4 19.8
University of Western Sydney 24.2 19.1 19.1 18.7 19.0 22.4 22.5 23.7 22.9
University of Wollongong 14.8 14.6 16.0 16.8 15.9 16.7 16.1 14.0 15.0
State Sub-total 17.7 17.7 17.6 17.8 17.8 18.7 19.6 18.2 18.2
Total 18.4 19.3 19.0 18.9 19.3 19.3 19.6 18.6 18.5
Table 1b: Number of all domestic students by State and Institution, 1994-2002
State Institution 1994 1995 1996 1997 1998 1999 2000 2001 2002NSW Australian Film, Television and Radio School 44 45 48 83 71 82 88 91 102 Avondale College 629 661 700 692 611 588 576 523 559 Charles Sturt University 15978 18067 19806 21272 22156 22128 23752 24674 24719 Macquarie University 14158 15885 16074 16643 17706 18098 17769 17986 18177 National Institute of Dramatic Art 126 147 153 147 156 147 160 156 169 Southern Cross University 6377 7064 8644 9098 8654 8614 8291 9205 9508 The University of New England 13920 14083 14424 14977 15671 15881 15750 15752 16705 The University of New South Wales 23515 23548 23887 24069 24085 24752 25741 27334 29396 The University of Newcastle 14127 15151 15657 16251 16411 16403 16208 16433 17990 The University of Sydney 29631 28323 29212 30783 31411 32019 31926 32063 33136 University of Technology, Sydney 20535 20292 20874 21810 21678 21611 21891 22321 22618 University of Western Sydney 19807 21282 23529 25046 26250 26980 26344 25800 24865
University of Wollongong 10291 10558 10669 10708 10706 10665 10448 10599 11390 State Sub-total 169138 175106 183677 191579 195566 197968 198944 202937 209334
Total 554246 570468 595011 612087 618204 618201 616621 629890 653695
Table 2a: Crude student attrition rates for domestic undergraduate students by State and In stitution, 1994-2002 (%)
State Institution 1994 1995 1996 1997 1998 1999 2000 2001 2002
NSW Australian Film, Television and Radio School 9.1 6.7 2.1 0.0 0.0 0.0 0.0 0.0 0.0 Avondale College 13.8 13.3 13.4 19.4 19.1 17.3 22.7 19.6 18.1 Charles Sturt University 17.9 18.9 18.5 21.6 20.0 19.1 18.1 18.2 18.7 Macquarie University 15.7 19.0 17.0 14.6 15.7 18.3 15.2 13.5 14.0
National Institute of Dramatic Art 5.7 9.6 7.9 5.2 7.0 2.9 8.1 2.6 0.6 Southern Cross University 27.2 25.2 27.3 26.5 25.9 27.3 28.4 31.8 27.2 The University of New England 21.2 20.6 20.0 18.7 21.1 23.6 23.6 22.6 23.5
The University of New South Wales 11.8 11.3 10.8 10.5 11.1 10.8 20.8 9.5 10.4 The University of Newcastle 13.5 15.3 14.8 14.4 13.5 14.2 14.2 11.3 13.1
The University of Sydney 11.1 11.1 11.7 12.0 12.2 12.3 11.9 10.7 11.0 University of Technology, Sydney 11.9 11.5 11.5 11.9 12.1 12.0 11.4 17.5 15.6
University of Western Sydney 22.8 18.0 18.0 17.1 18.1 21.5 20.6 22.4 19.8

Improving the Retention of First year Students Page 195
University of Wollongong 12.3 12.1 12.5 13.5 12.5 14.8 14.2 12.8 13.2
State Sub-total 15.6 15.4 15.4 15.4 15.6 16.7 17.2 16.2 15.9
Total 16.3 17.0 17.0 16.6 17.1 17.6 17.7 16.7 16.6
Sta te Institution 1994 1995 1996 1997 1998 1999 2000 2001 2002NSW Australian Film, Television and Radio School 44 45 48 32 10 0 0 0 0 Avondale College 629 611 648 624 554 538 537 500 519 Charles Sturt University 13142 14592 15875 16748 17555 17732 19221 19956 19752 Macquarie University 10547 11947 11860 12077 12866 13364 13162 13317 13129 National Institute of Dramatic Art 123 136 139 135 142 138 149 151 154 Southern Cross University 5361 5910 7225 7635 7536 7510 7230 7952 8065 The University of New England 9818 9800 9794 9835 10690 11592 12009 12332 12957 The University of New South Wales 16832 16562 16482 16669 16718 16779 17560 18454 19372 The University of Newcastle 12603 13503 13896 14123 14138 14152 14060 14027 15117 The University of Sydney 22607 21180 21803 23501 24259 25177 25503 25917 26364 University of Technology, Sydney 14894 14762 15241 15918 15450 15089 15344 15852 15759 University of Western Sydney 16929 18008 19774 21048 22323 22915 22169 22232 21430 University of Wollongong 7959 7936 8025 8217 8364 8691 8655 8907 9534 State Sub-total 131488 134992 140810 146562 150605 153677 155599 159597 162152
Total 22.2 22.8 23.1 22.3 22.9 23.0 22.1 21.2
Table 3a: Crude student attrition rates for domestic commenci ng undergraduate students by State and Institution, 1994-2002 (%)
State Institution 1994 1995 1996 1997 1998 1999 2000 2002NSW Australian Film, Television and Radio School 9.1 6.7 0.0 0.0 0.0 0.0 0.0 0.0 Avondale College 20.5 18.5 21.4 23.3 30.4 23.3 35.7 28.3 Charles Sturt University 25.3 25.3 25.4 27.7 26.0 22.6 21.3 24.0 Macquarie University 21.9 25.6 23.7 20.6 20.8 20.7 18.7 17.6 National Institute of Dramatic Art 7.7 18.5 7.4 12.7 11.5 5.6 16.1 1.9 Southern Cross University 33.1 30.6 34.4 34.7 34.0 35.9 32.4 32.8 The University of New England 27.8 28.7 28.0 26.7 28.5 30.2 29.9 30.7 The University of New South Wales 14.0 13.0 13.2 12.5 13.5 13.1 13.5 13.3 The University of Newcastle 19.4 21.7 21.1 19.9 18.2 18.5 18.4 18.1 The University of Sydney 16.1 15.7 17.2 16.7 16.8 17.5 17.0 14.6 University of Technology, Sydney 16.0 14.5 15.8 16.1 15.9 15.9 13.8 13.4 University of Western Sydney 31.8 25.1 24.2 23.1 24.1 27.7 25.2 21.3 University of Wollongong 14.9 16.7 16.0 17.3 16.4 18.6 17.1 15.6 State Sub-total 21.7 21.5 21.6 21.1 21.3 21.8 20.4 19.7
Total 22.2 22.8 23.1 22.3 22.9 23.0 22.1 21.2
Table 195b: Number of domestic commencing undergraduate students by State and Institution, 1 994-2002
State Institution 1994 1995 1996 1997 1998 1999 2000 2002NSW Australian Film, Television and Radio School 44 45 15 0 0 0 0 0 Avondale College 234 243 294 219 230 193 182 180 Charles Sturt University 5194 6485 6334 6520 7288 6834 8084 5917 Macquarie University 3148 4613 4056 3619 4088 4294 3926 2924 National Institute of Dramatic Art 52 54 54 55 52 54 56 53 Southern Cross University 2426 2782 3475 3262 3077 2938 2688 2990 The University of New England 3419 3565 3567 3434 4005 4813 4591 4445 The University of New South Wales 4887 4735 4798 5005 4927 5164 5693 4958
Table 2b: Number of domestic undergraduate st udents by State and Institution, 1994-2002

Improving the Retention of First year Students Page 196
The University of Newcastle 4225 5342 4983 4951 4371 4541 4596 4949 The University of Sydney 6667 6443 8292 8366 8326 8879 8789 7994 University of Technology, Sydney 4500 4374 4695 5071 4306 4243 4677 4077 University of Western Sydney 6242 7588 8321 8038 8402 8470 7896 7131 University of Wollongong 2480 2601 2655 2752 2779 2919 2864 2982 State Sub-total 43518 48870 51539 51292 51851 53342 54042 48600
Total 148318 160077 169109 168560 168666 170701 171135 162387
Table 4a: Crude student attrition rates in second year after commencement, for domestic commencing
undergraduate students by State and Institution, 1994-2001 (%)
State Institution 1994 1995 1996 1997 1998 1999 2001NSW Australian Film, Television and Radio School 4.8 0.0 0.0 0.0 0.0 0.0 0.0 Avondale College 6.4 8.6 20.1 9.6 13.0 16.6 9.9 Charles Sturt University 11.6 11.9 12.3 12.0 11.7 11.1 11.7 Macquarie University 11.7 10.2 9.0 11.1 10.6 9.8 9.0 National Institute of Dramatic Art 5.8 11.1 0.0 7.3 1.9 5.6 0.0 Southern Cross University 10.9 12.0 13.9 13.8 13.6 13.2 14.2 The University of New England 12.6 11.8 10.7 12.6 14.2 14.3 14.3 The University of New South Wales 8.4 8.0 8.6 8.1 7.8 9.7 6.6 The University of Newcastle 9.7 9.9 9.9 9.6 10.1 9.8 9.1 The University of Sydney 7.2 7.3 8.0 8.2 8.5 8.5 7.1 University of Technology, Sydney 8.0 7.1 8.3 8.1 7.3 7.5 8.5 University of Western Sydney 9.1 10.2 10.0 10.6 12.8 12.0 9.3 University of Wollongong 9.1 8.3 9.1 8.9 9.8 9.6 8.0 State Sub-total 9.6 9.6 9.9 10.1 10.6 10.5 9.7Total 10.7 10.4 11.7 11.0 11.2 11.2 10.2
Table 196b: Number of domestic commencing undergraduate students by State and Institution, 1994-2001
State Institution 1994 1995 1996 1997 1998 1999 2001NSW Australian Film, Television and Radio School 44 45 15 0 0 0 0 Avondale College 234 243 294 219 230 193 172 Charles Sturt University 5194 6485 6334 6520 7288 6834 7611 Macquarie University 3148 4613 4056 3619 4088 4294 3899 National Institute of Dramatic Art 52 54 54 55 52 54 59 Southern Cross University 2426 2782 3475 3262 3077 2938 3228 The University of New England 3419 3565 3567 3434 4005 4813 4481 The University of New South Wales 4887 4735 4798 5005 4927 5164 6070 The University of Newcastle 4225 5342 4983 4951 4371 4541 4912 The University of Sydney 6667 6443 8292 8366 8326 8879 8359 University of Technology, Sydney 4500 4374 4695 5071 4306 4243 4755 University of Western Sydney 6242 7588 8321 8038 8402 8470 7995 University of Wollongong 2480 2601 2655 2752 2779 2919 2995 State Sub-total 43518 48870 51539 51292 51851 53342 54536
Total 148318 160077 169109 168560 168666 170701 174714

Improving the Retention of First year Students Page 197
Table 5a: Crude student attrition rates for domestic commencing undergraduate 'new to higher
education' students by State and Institution, 1994-2002 (%)
State Institution 1994 1995 1996 1997 1998 1999 2000 2002NSW Australian Film, Television and Radio School 0.0 0.0 0.0 0.0 0.0 0.0 0.0 0.0 Avondale College 20.7 16.9 24.7 23.8 29.0 21.4 35.0 29.5 Charles Sturt University 24.5 25.4 26.2 27.1 25.7 23.2 19.4 21.5 Macquarie University 21.4 25.4 23.9 19.5 19.7 20.9 18.1 15.5 National Institute of Dramatic Art 3.7 14.8 8.3 14.3 14.8 7.1 17.2 4.2 Southern Cross University 33.5 29.6 33.8 34.3 32.9 34.9 27.3 32.9 The University of New England 29.2 27.5 26.9 28.0 28.5 30.2 28.0 29.2 The University of New South Wales 13.2 12.6 11.6 10.8 11.5 11.8 13.2 12.1 The University of Newcastle 20.3 22.0 20.9 19.8 17.9 18.6 18.3 17.7 The University of Sydney 15.6 14.9 17.1 15.5 16.1 17.9 18.1 14.3 University of Technology, Sydney 15.0 14.0 14.8 15.3 14.4 14.9 13.0 12.7 University of Western Sydney 28.7 25.2 23.6 23.0 23.2 26.9 24.3 20.4 University of Wollongong 13.3 16.4 14.7 16.4 14.9 16.8 14.9 15.3 State Sub-total 20.9 20.9 20.8 20.4 20.0 21.1 19.1 18.0Total 21.9 22.3 22.5 21.7 22.6 22.7 21.7 20.6

Improving the Retention of First year Students Page 198
Institution 1994 1995 1996 1997 1998 1999 2000 2002NSW Australian Film, Television and Radio School 12 20 3 0 0 0 0 0 Avondale College 174 172 198 168 183 145 143 149 Charles Sturt University 3309 3894 3987 3988 4324 3610 4450 3215 Macquarie University 2333 3238 2616 2642 2814 2892 2573 2023 National Institute of Dramatic Art 27 27 24 28 27 28 29 24 Southern Cross University 1757 1929 2172 2278 1890 1896 1403 1789 The University of New England 2052 1942 2007 1863 2044 2280 2125 1968 The University of New South Wales 3980 3686 3567 3550 3421 3680 4147 3879 The University of Newcastle 2961 3224 3610 3665 3206 3269 3235 3530 The University of Sydney 4575 4522 6337 5338 5524 6271 6407 5670 University of Technology, Sydney 3296 3279 3201 3429 2979 3024 3437 3182 University of Western Sydney 4622 5560 6183 5924 5598 6060 6096 5606 University of Wollongong 1717 2009 2026 1949 1886 2050 1863 2536 State Sub-total 30815 33502 35931 34822 33896 35205 35908 33571
Total 103500 110025 117508 115565 112107 113606 113172 108663
Table 6a: Crude student attrition rates for domestic commencing undergraduate ' NOT new to higher
education' students by State and Institution, 1994-2002 (%)
State Institution 1994 1995 1996 1997 1998 1999 2000 2002NSW Australian Film, Television and Radio School 6.7 12.5 0.0 0.0 0.0 0.0 0.0 0.0
Avondale College 20.0 22.5 14.6 21.6 36.2 29.2 37.1 22.6 Charles Sturt University 26.6 27.8 28.0 29.6 26.4 21.9 23.6 27.0 Macquarie University 23.3 26.0 23.5 23.5 23.1 20.4 19.9 22.5 National Institute of Dramatic Art 12.0 22.2 6.7 11.1 8.0 3.8 14.8 0.0 Southern Cross University 31.8 32.7 34.7 35.8 34.6 37.2 29.4 28.3 The University of New England 25.9 30.1 29.9 25.2 28.3 30.2 31.5 31.5 The University of New South Wales 17.4 14.5 17.8 16.6 18.3 16.5 20.1 17.7 The University of Newcastle 18.2 20.2 21.7 20.5 18.9 18.3 18.4 17.8 The University of Sydney 17.7 16.6 17.7 17.6 18.3 16.8 15.7 15.6 University of Technology, Sydney 18.1 15.8 18.1 17.8 19.3 18.0 16.1 16.1 University of Western Sydney 40.9 24.9 26.2 24.7 25.6 28.6 26.9 25.0 University of Wollongong 18.8 18.6 19.6 19.9 17.4 19.1 18.1 17.2 State Sub-total 24.6 23.3 23.7 22.8 23.3 22.7 22.3 22.8Total 23.4 24.1 24.5 23.9 23.7 23.4 22.9 22.5
Table 198b: Number of domestic commencing undergraduate 'new to higher education' students by State and Instit ution, 1994-2002

Improving the Retention of First year Students Page 199
Table 199b: Number of domestic commencing undergraduate 'NOT new to higher education students by State and Institution, 1994-2002
State Institution 1994 1995 1996 1997 1998 1999 2000 2002NSW Australian Film, Television and Radio School 30 24 11 0 0 0 0 0 Avondale College 60 71 96 51 47 48 35 31
Charles Sturt University 1636 2191 2299 2253 2959 3219 3631 2700 Macquarie University 815 1375 1440 977 1274 1402 1353 901 National Institute of Dramatic Art 25 27 30 27 25 26 27 29 Southern Cross University 669 853 1046 970 1096 956 296 769 The University of New England 1367 1527 1474 1549 1951 2507 2447 2270 The University of New South Wales 906 1048 1231 1455 1506 1484 1546 1079 The University of Newcastle 1245 1867 1372 1286 1154 1271 1361 1260 The University of Sydney 1236 1359 1933 2433 2802 2608 2382 2324 University of Technology, Sydney 1180 1072 1487 1632 1322 1179 1230 890 University of Western Sydney 1558 1785 1839 1742 2489 2016 1661 1311 University of Wollongong 480 592 581 738 765 592 635 419 State Sub-total 11207 13791 14839 15113 17390 17308 16604 13983
Total 41353 46295 49547 50756 54494 54033 54721 48904
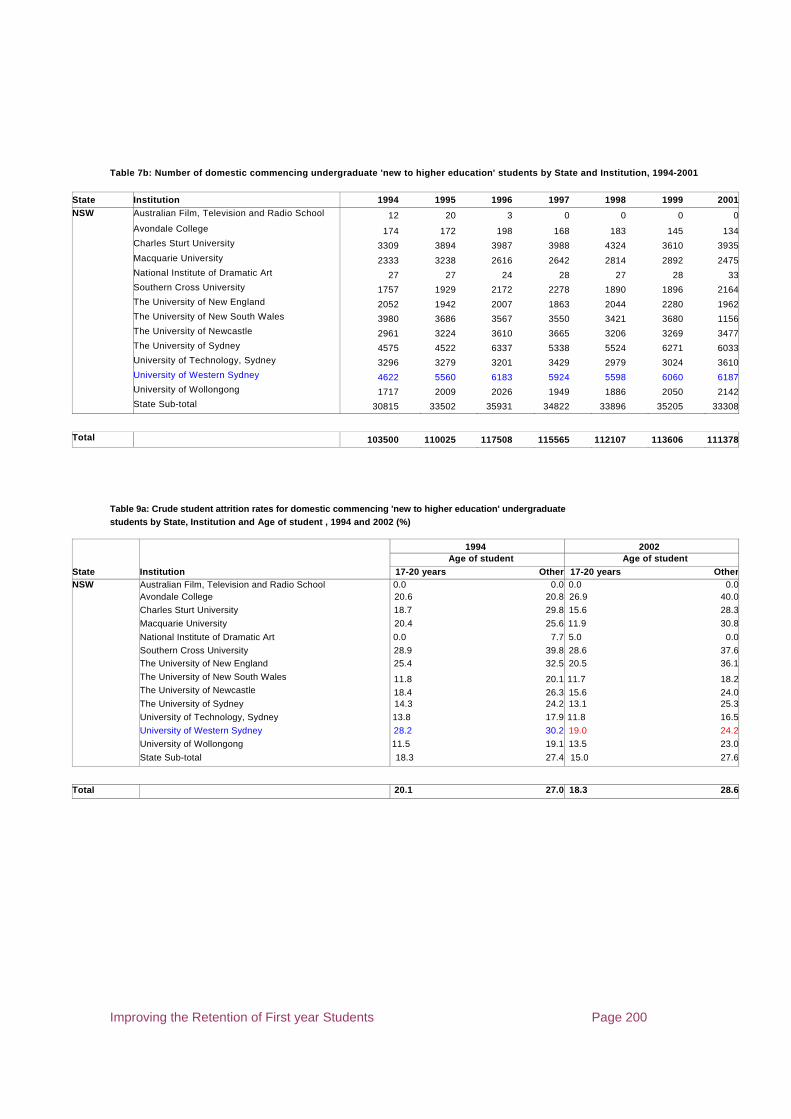
Improving the Retention of First year Students Page 200
Table 7b: Number of domestic commencing underg raduate 'new to hi gher education' students by State and Institution, 1994-2001
State Institution 1994 1995 1996 1997 1998 1999 2001NSW Australian Film, Television and Radio School 12 20 3 0 0 0 0
Avondale College 174 172 198 168 183 145 134 Charles Sturt University 3309 3894 3987 3988 4324 3610 3935 Macquarie University 2333 3238 2616 2642 2814 2892 2475 National Institute of Dramatic Art 27 27 24 28 27 28 33 Southern Cross University 1757 1929 2172 2278 1890 1896 2164 The University of New England 2052 1942 2007 1863 2044 2280 1962 The University of New South Wales 3980 3686 3567 3550 3421 3680 1156 The University of Newcastle 2961 3224 3610 3665 3206 3269 3477 The University of Sydney 4575 4522 6337 5338 5524 6271 6033 University of Technology, Sydney 3296 3279 3201 3429 2979 3024 3610 University of Western Sydney 4622 5560 6183 5924 5598 6060 6187 University of Wollongong 1717 2009 2026 1949 1886 2050 2142 State Sub-total 30815 33502 35931 34822 33896 35205 33308
Total 103500 110025 117508 115565 112107 113606 111378
Table 9a: Crude student attrition rates for domestic commencing 'new to higher education' undergr aduate students by State, Institution and Age of student , 1994 and 2002 (%)
1994 2002 Age of student Age of student State Institution 17-20 years Other 17-20 years Othe rNSW Australian Film, Television and Radio School 0.0 0.0 0.0 0.0 Avondale College 20.6 20.8 26.9 40.0
Charles Sturt University 18.7 29.8 15.6 28.3
Macquarie University 20.4 25.6 11.9 30.8
National Institute of Dramatic Art 0.0 7.7 5.0 0.0
Southern Cross University 28.9 39.8 28.6 37.6 The University of New England 25.4 32.5 20.5 36.1
The University of New South Wales 11.8 20.1 11.7 18.2 The University of Newcastle 18.4 26.3 15.6 24.0 The University of Sydney 14.3 24.2 13.1 25.3
University of Technology, Sydney 13.8 17.9 11.8 16.5
University of Western Sydney 28.2 30.2 19.0 24.2
University of Wollongong 11.5 19.1 13.5 23.0
State Sub-total 18.3 27.4 15.0 27.6
Total 20.1 27.0 18.3 28.6

Improving the Retention of First year Students Page 201
Table 9b: Number of domestic commencing 'new to higher education' undergraduate students by State, Institution and Age of student , 1994 and 2002
1994 2000 Age of student Age of student State Institution 17-20 years Other 17-20 years OtherNSW Australian Film, Television and Radio School 0 12 0 0 Avondale College 126 48 119 30 Charles Sturt University 1587 1722 1720 1495 Macquarie University 1880 453 1640 383 National Institute of Dramatic Art 14 13 20 4 Southern Cross University 1019 738 928 861 The University of New England 961 1091 878 1090 The University of New South Wales 3280 700 3626 253 The University of Newcastle 2270 691 2647 883 The University of Sydney 3971 604 5116 554 University of Technology, Sydney 2279 1017 2625 557 University of Western Sydney 3393 1229 4054 1552 University of Wollongong 1304 413 2041 495 State Sub-total 22084 8731 25414 8157
Total 75482 2801883751 24912
Table 10a: Crude student attrition rates for domestic commencing 'NOT new to higher education' undergraduate students by State, Institution and Age of student , 19 94 and 2002 (%)
1994 2002 Age of student Age of student State Institution 17-20 years Othe r 17-20 years Othe rNSW Australian Film, Television and Radio School 0.0 6.7 0.0 0.0 Avondale College 30.8 17.0 12.5 33.3 Charles Sturt University 20.4 27.4 13.8 29.6 Macquarie University 17.2 25.9 9.9 28.0 National Institute of Dramatic Art 14.3 11.1 0.0 0.0 Southern Cross University 20.5 34.4 20.3 29.8 The University of New England 25.8 25.9 24.7 32.6 The University of New South Wales 15.4 18.6 10.7 24.2 The University of Newcastle 13.2 21.1 11.6 22.5 The University of Sydney 13.0 19.7 13.3 16.9 University of Technology, Sydney 8.7 21.4 9.3 19.2 University of Western Sydney 37.1 42.2 9.1 33.9 University of Wollongong 12.9 21.3 13.2 19.6 State Sub-total 18.5 26.5 12.9 26.8
Total 18.1 25.5 16.2 25.8
Table 10b: Number of domestic commencing 'NOT new to higher education' undergraduate students by State, Institution and Age of student, 1994 and 2002
1994 2002 Age of student Age of student State Institution 17-20 years Other 17-20 years OtherNSW Australian Film, Television and Radio School 0 30 0 0 Avondale College 13 47 16 15 Charles Sturt University 181 1455 441 2259 Macquarie University 244 571 272 629 National Institute of Dramatic Art 7 18 16 13 Southern Cross University 122 547 118 651 The University of New England 159 1208 332 1938 The University of New South Wales 337 569 516 563 The University of Newcastle 454 791 543 717 The University of Sydney 362 874 842 1482 University of Technology, Sydney 300 880 280 610 University of Western Sydney 410 1148 470 841 University of Wollongong 147 333 159 260 State Sub-total 2736 8471 4005 9978
Total 11639 29714 17058 31846
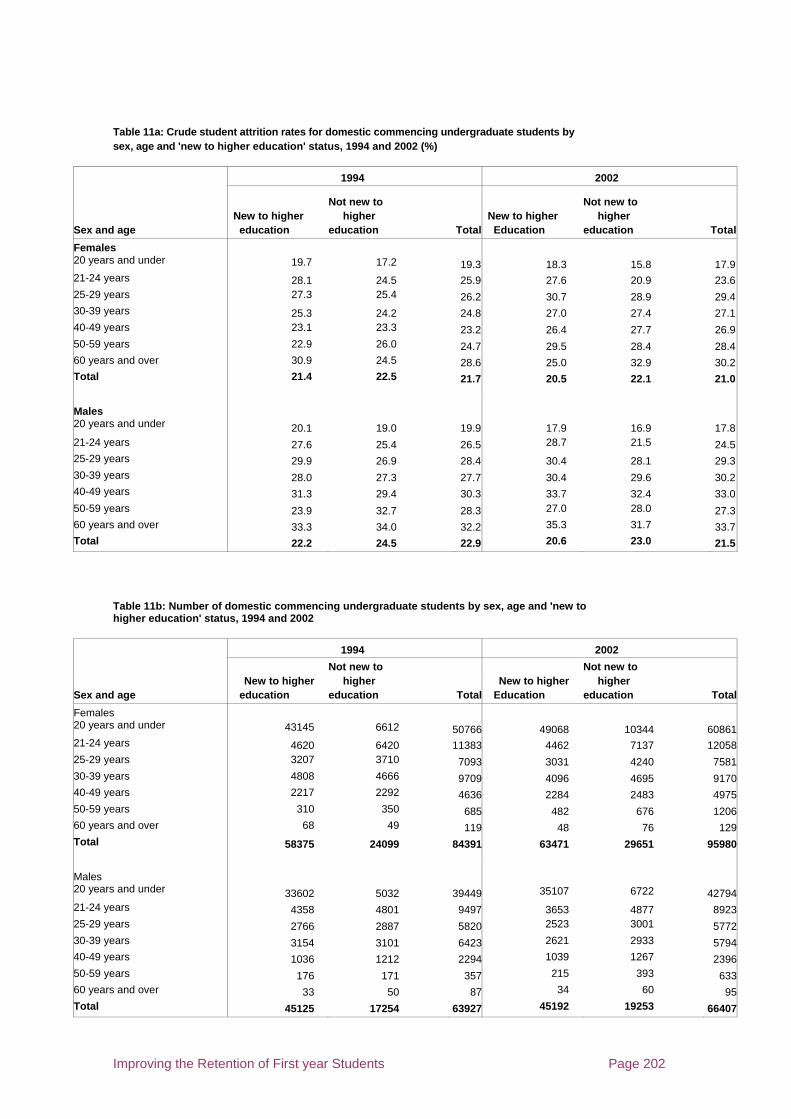
Improving the Retention of First year Students Page 202
Table 11a: Crude student attrition rates for domestic commencing undergraduate students by sex, age and 'new to higher education' status, 1994 and 2002 (%)
1994 2002
Not new to
Not new to
New to higher higher New to higher higher Sex and age education education Total Education education Total
Females 20 years and under 19.7 17.2 19.3 18.3 15.8 17.921-24 years 28.1 24.5 25.9 27.6 20.9 23.625-29 years 27.3 25.4 26.2 30.7 28.9 29.430-39 years 25.3 24.2 24.8 27.0 27.4 27.140-49 years 23.1 23.3 23.2 26.4 27.7 26.950-59 years 22.9 26.0 24.7 29.5 28.4 28.460 years and over 30.9 24.5 28.6 25.0 32.9 30.2Total 21.4 22.5 21.7 20.5 22.1 21.0
Males 20 years and under 20.1 19.0 19.9 17.9 16.9 17.821-24 years 27.6 25.4 26.5 28.7 21.5 24.525-29 years 29.9 26.9 28.4 30.4 28.1 29.330-39 years 28.0 27.3 27.7 30.4 29.6 30.240-49 years 31.3 29.4 30.3 33.7 32.4 33.050-59 years 23.9 32.7 28.3 27.0 28.0 27.360 years and over 33.3 34.0 32.2 35.3 31.7 33.7Total 22.2 24.5 22.9 20.6 23.0 21.5
Table 11b: Number of domestic commencing undergraduate students by sex, age and 'new to higher education' status, 1994 and 2002
1994 2002
Not new to Not new to
New to higher higher New to higher higher Sex and age education education Total Education education Total
Females 20 years and under 43145 6612 50766 49068 10344 6086121-24 years 4620 6420 11383 4462 7137 1205825-29 years 3207 3710 7093 3031 4240 758130-39 years 4808 4666 9709 4096 4695 917040-49 years 2217 2292 4636 2284 2483 497550-59 years 310 350 685 482 676 120660 years and over 68 49 119 48 76 129Total 58375 24099 84391 63471 29651 95980
Males 20 years and under 33602 5032 39449 35107 6722 4279421-24 years 4358 4801 9497 3653 4877 892325-29 years 2766 2887 5820 2523 3001 577230-39 years 3154 3101 6423 2621 2933 579440-49 years 1036 1212 2294 1039 1267 239650-59 years 176 171 357 215 393 63360 years and over 33 50 87 34 60 95Total 45125 17254 63927 45192 19253 66407
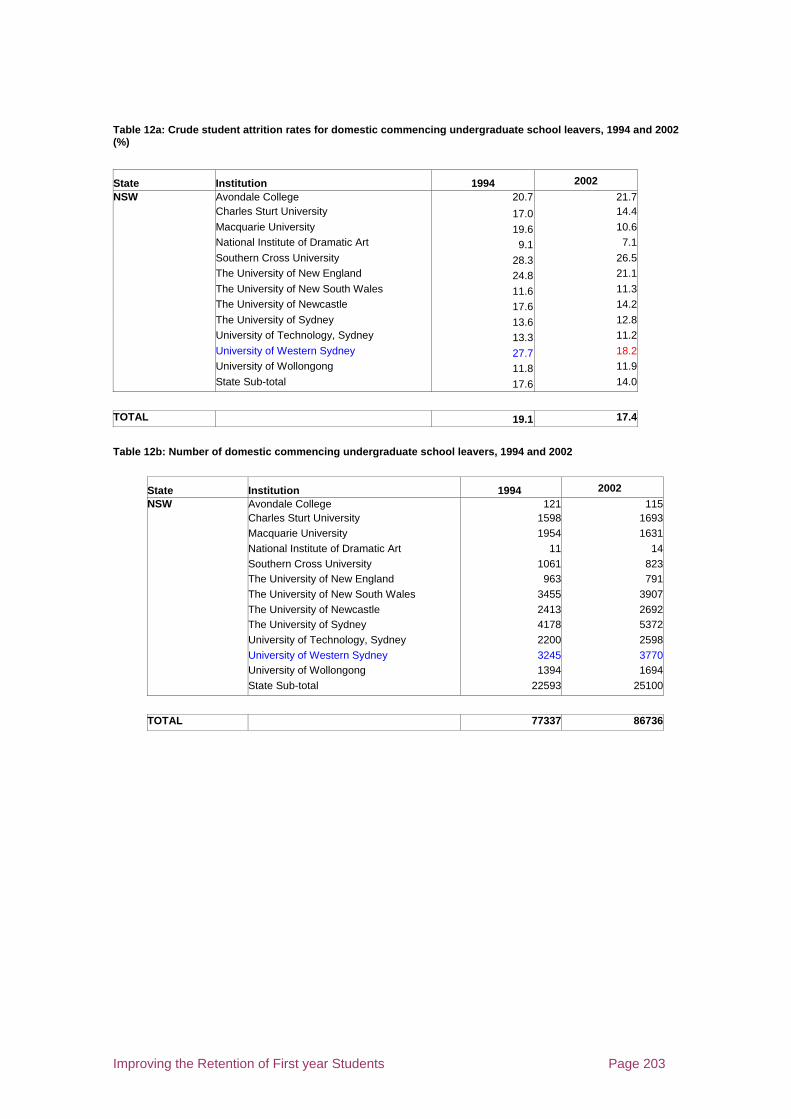
Improving the Retention of First year Students Page 203
Table 12a: Crude student attrition rates for domestic commencing undergraduate school leavers, 1994 and 2002 (%)
State Institution 1994 2002
NSW Avondale College 20.7 21.7 Charles Sturt University 17.0 14.4
Macquarie University 19.6 10.6 National Institute of Dramatic Art 9.1 7.1
Southern Cross University 28.3 26.5 The University of New England 24.8 21.1
The University of New South Wales 11.6 11.3 The University of Newcastle 17.6 14.2
The University of Sydney 13.6 12.8 University of Technology, Sydney 13.3 11.2
University of Western Sydney 27.7 18.2 University of Wollongong 11.8 11.9
State Sub-total 17.6 14.0
TOTAL 19.1 17.4
Table 12b: Number of domestic commencing undergraduate school leavers, 1994 and 2002
State Institution 1994 2002 NSW Avondale College 121 115 Charles Sturt University 1598 1693 Macquarie University 1954 1631 National Institute of Dramatic Art 11 14 Southern Cross University 1061 823 The University of New England 963 791 The University of New South Wales 3455 3907 The University of Newcastle 2413 2692 The University of Sydney 4178 5372 University of Technology, Sydney 2200 2598
University of Western Sydney 3245 3770 University of Wollongong 1394 1694
State Sub-total 22593 25100
TOTAL 77337 86736
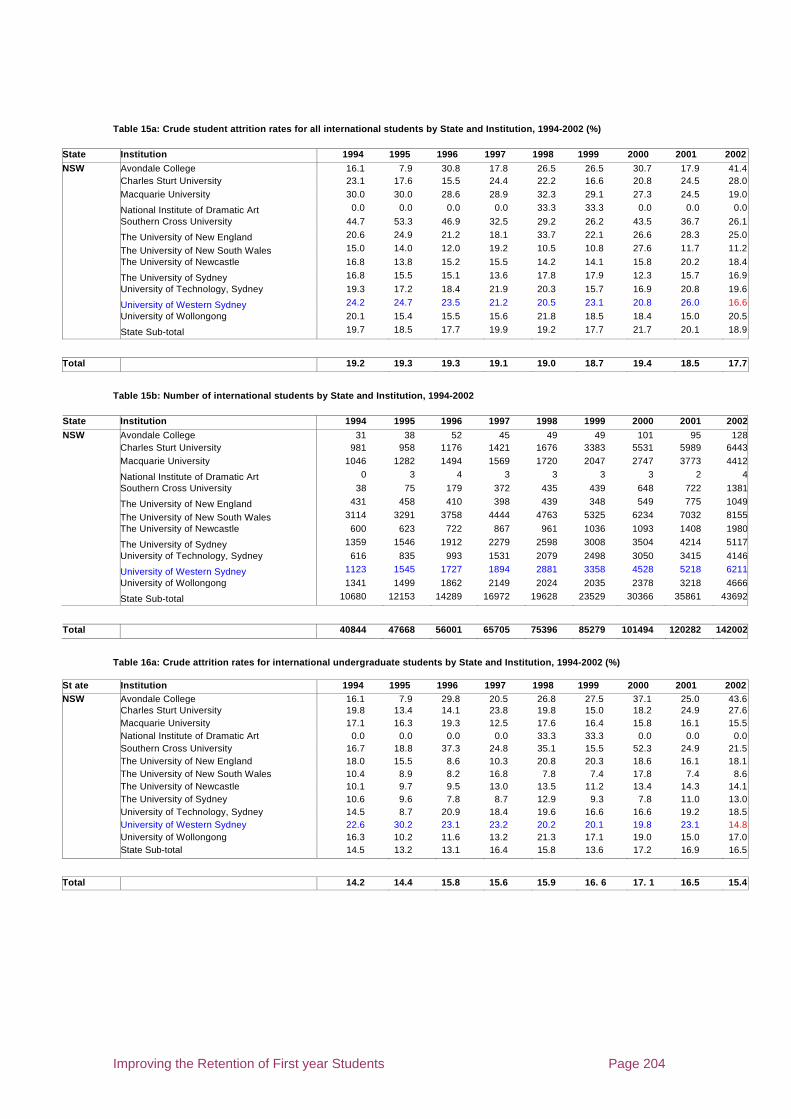
Improving the Retention of First year Students Page 204
Table 15a: Crude student attrition rates for all internat ional students by State and Institution, 1994-2002 (%)
State Institution 1994 1995 1996 1997 1998 1999 2000 2001 2002
NSW Avondale College 16.1 7.9 30.8 17.8 26.5 26.5 30.7 17.9 41.4 Charles Sturt University 23.1 17.6 15.5 24.4 22.2 16.6 20.8 24.5 28.0 Macquarie University 30.0 30.0 28.6 28.9 32.3 29.1 27.3 24.5 19.0 National Institute of Dramatic Art 0.0 0.0 0.0 0.0 33.3 33.3 0.0 0.0 0.0
Southern Cross University 44.7 53.3 46.9 32.5 29.2 26.2 43.5 36.7 26.1 The University of New England 20.6 24.9 21.2 18.1 33.7 22.1 26.6 28.3 25.0 The University of New South Wales 15.0 14.0 12.0 19.2 10.5 10.8 27.6 11.7 11.2
The University of Newcastle 16.8 13.8 15.2 15.5 14.2 14.1 15.8 20.2 18.4 The University of Sydney 16.8 15.5 15.1 13.6 17.8 17.9 12.3 15.7 16.9
University of Technology, Sydney 19.3 17.2 18.4 21.9 20.3 15.7 16.9 20.8 19.6 University of Western Sydney 24.2 24.7 23.5 21.2 20.5 23.1 20.8 26.0 16.6
University of Wollongong 20.1 15.4 15.5 15.6 21.8 18.5 18.4 15.0 20.5 State Sub-total 19.7 18.5 17.7 19.9 19.2 17.7 21.7 20.1 18.9
Total 19.2 19.3 19.3 19.1 19.0 18.7 19.4 18.5 17.7
Table 15b: Number of international students by State and Institution, 1994-2002
State Institution 1994 1995 1996 1997 1998 1999 2000 2001 2002
NSW Avondale College 31 38 52 45 49 49 101 95 128 Charles Sturt University 981 958 1176 1421 1676 3383 5531 5989 6443 Macquarie University 1046 1282 1494 1569 1720 2047 2747 3773 4412 National Institute of Dramatic Art 0 3 4 3 3 3 3 2 4
Southern Cross University 38 75 179 372 435 439 648 722 1381 The University of New England 431 458 410 398 439 348 549 775 1049 The University of New South Wales 3114 3291 3758 4444 4763 5325 6234 7032 8155
The University of Newcastle 600 623 722 867 961 1036 1093 1408 1980 The University of Sydney 1359 1546 1912 2279 2598 3008 3504 4214 5117
University of Technology, Sydney 616 835 993 1531 2079 2498 3050 3415 4146 University of Western Sydney 1123 1545 1727 1894 2881 3358 4528 5218 6211
University of Wollongong 1341 1499 1862 2149 2024 2035 2378 3218 4666 State Sub-total 10680 12153 14289 16972 19628 23529 30366 35861 43692
Total 40844 47668 56001 65705 75396 85279 101494 120282 142002
Table 16a: Crude attrition rates for international undergra duate students by State and Institution, 1994-2002 (%)
St ate Institution 1994 1995 1996 1997 1998 1999 2000 2001 2002NSW Avondale College 16.1 7.9 29.8 20.5 26.8 27.5 37.1 25.0 43.6 Charles Sturt University 19.8 13.4 14.1 23.8 19.8 15.0 18.2 24.9 27.6 Macquarie University 17.1 16.3 19.3 12.5 17.6 16.4 15.8 16.1 15.5 National Institute of Dramatic Art 0.0 0.0 0.0 0.0 33.3 33.3 0.0 0.0 0.0 Southern Cross University 16.7 18.8 37.3 24.8 35.1 15.5 52.3 24.9 21.5 The University of New England 18.0 15.5 8.6 10.3 20.8 20.3 18.6 16.1 18.1 The University of New South Wales 10.4 8.9 8.2 16.8 7.8 7.4 17.8 7.4 8.6 The University of Newcastle 10.1 9.7 9.5 13.0 13.5 11.2 13.4 14.3 14.1 The University of Sydney 10.6 9.6 7.8 8.7 12.9 9.3 7.8 11.0 13.0 University of Technology, Sydney 14.5 8.7 20.9 18.4 19.6 16.6 16.6 19.2 18.5 University of Western Sydney 22.6 30.2 23.1 23.2 20.2 20.1 19.8 23.1 14.8 University of Wollongong 16.3 10.2 11.6 13.2 21.3 17.1 19.0 15.0 17.0 State Sub-total 14.5 13.2 13.1 16.4 15.8 13.6 17.2 16.9 16.5
Total 14.2 14.4 15.8 15.6 15.9 16. 6 17. 1 16.5 15.4

Improving the Retention of First year Students Page 205
Table 16b: Number of international undergraduate students by State and Institution, 1994-2002
Sta te Institution 1994 1995 1996 1997 1998 1999 2000 2001 2002NSW Avondale College 31 38 47 39 41 40 62 68 11 7 Charles Sturt University 637 626 790 974 1198 2230 3818 4025 4002 Macquarie University 434 412 460 423 535 818 1201 1676 2237 National Institute of Dramatic Art 0 3 3 3 3 3 3 1 3 Southern Cross University 18 16 59 113 134 148 258 362 963 The University of New England 111 110 116 117 120 118 204 403 541 The University of New South Wales 1932 2027 2305 2662 2874 3102 3433 3904 4490 The University of Newcastle 414 474 545 644 630 607 574 671 1021 The University of Sydney 803 899 1163 1410 1587 1886 2238 2725 3195 University of Technology, Sydney 386 497 671 901 1222 1352 1412 1722 1985 University of Western Sydney 833 987 1035 1114 1858 2189 2712 3148 4044 University of Wollongong 731 764 1009 1269 1280 1066 1078 1378 2032 State Sub-total 6330 6853 8203 9669 11482 13559 16993 20083 24630
Total 29736 34225 40282 46782 54091 60185 69174 78499 90982
Table 17a: Crude student attrition rates for international co mmencing undergraduate students by State and Institution, 1994-2002 (%)
Sta te Institution 1994 1995 1996 1997 1998 1999 2000 2001 2002NSW Avondale College 26.7 15.8 41.7 36.8 33.3 47.6 47.5 38.9 58.3 Charles Sturt University 24.6 13.6 14.5 26.8 21.4 15.6 20.0 19.4 25.8 Macquarie University 24.8 28.2 23.0 13.2 20.9 17.5 17.0 16.0 12.8 National Institute of Dramatic Art 0.0 0.0 0.0 0.0 33.3 100.0 0.0 0.0 0.0 Southern Cross University 0.0 0.0 35.4 25.6 47.1 14.4 64.4 33.8 58.3 The University of New England 25.0 19.6 14.6 10.5 31.7 28.1 18.0 15.9 18.8 The University of New South Wales 10.1 9.9 8.9 9.5 9.1 8.8 9.5 7.9 9.3 The University of Newcastle 8.4 8.5 9.6 11.5 14.9 13.8 16.1 17.1 14.3 The University of Sydney 16.7 15.5 13.6 14.8 11.6 14.0 9.4 12.1 11.3 University of Technology, Sydney 12.8 9.0 22.7 21.6 23.2 11.9 14.5 12.5 9.9 University of Western Sydney 30.0 43.7 29.2 30.3 21.4 21.3 17.7 16.6 8.0 University of Wollongong 13.5 7.8 11.2 13.2 28.9 21.8 22.3 13.7 15.7 State Sub-total 17.7 17.5 16.1 17.6 19. 0 15.6 17.3 14.8 14.7
Total 18.0 17.7 18.6 18.5 19.1 18.4 19.1 17.8 18.0
Table 17b: Number of international commencing undergraduate students by State and Inst itution, 1994-2002
Sta te Institution 1994 1995 1996 1997 1998 1999 2000 2001 2002NSW Avondale College 15 19 24 19 24 21 40 36 60 Charles Sturt University 248 317 495 567 781 1531 2330 1682 1088 Macquarie University 153 142 239 144 253 451 631 777 763 National Institute of Dramatic Art 0 3 0 0 3 1 1 0 2 Southern Cross University 9 5 48 82 87 104 177 160 218 The University of New England 52 46 48 57 41 57 133 145 260 The University of New South Wales 631 700 843 987 981 1115 1238 1530 1135 The University of Newcastle 178 212 272 338 242 232 248 334 414 The University of Sydney 264 271 447 555 623 773 989 1067 1062 University of Technology, Sydney 133 266 396 514 643 513 580 874 698 University of Western Sydney 433 503 497 535 1048 1187 1609 1762 1718 University of Wollongong 282 344 509 589 439 367 516 795 869 State Sub-total 2398 2828 3818 4387 5165 6352 8492 9162 8287
Total 12226 15172 18914 22030 24626 27978 33247 37403 29624
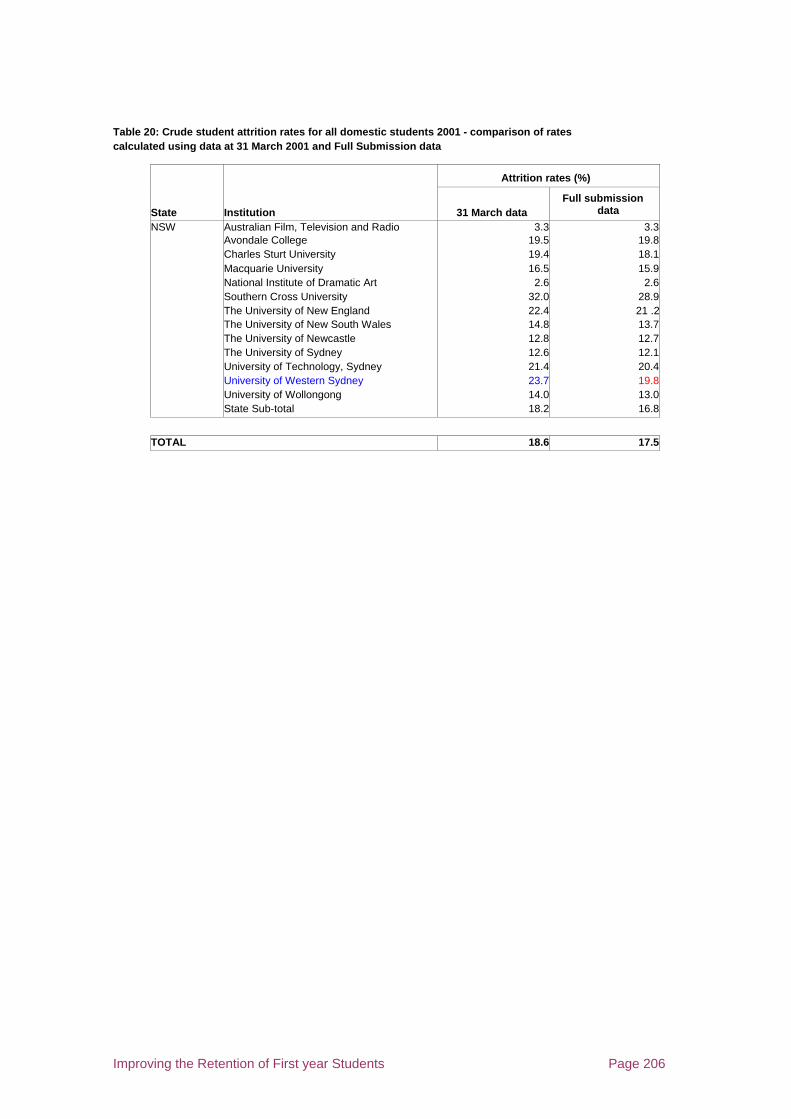
Improving the Retention of First year Students Page 206
Table 20: Crude student attrition rates for all domestic students 2001 - comparison of rates calculated using data at 31 March 2001 and Full Submission data
Attrition rates (%)
State Institution 31 March data Full submission
data
NSW Australian Film, Television and Radio 3.3 3.3 Avondale College 19.5 19.8 Charles Sturt University 19.4 18.1 Macquarie University 16.5 15.9 National Institute of Dramatic Art 2.6 2.6 Southern Cross University 32.0 28.9 The University of New England 22.4 21 .2 The University of New South Wales 14.8 13.7 The University of Newcastle 12.8 12.7 The University of Sydney 12.6 12.1 University of Technology, Sydney 21.4 20.4 University of Western Sydney 23.7 19.8 University of Wollongong 14.0 13.0 State Sub-total 18.2 16.8
TOTAL 18.6 17.5

Improving the Retention of First year Students Page 207
Appendix 2 Notes to accompany DEST Tables of attrition data
• The sources for data in this report are the enrolment and completion files in the Higher Education Student Collection, DEST. Due to data availability, and for consistency over time, enrolment data at 31 March each year has been used rather than full submission data (for example, as published in the Selected Higher Education Statistics 2002). It should be noted that the use of 31 March data may result in slightly higher attrition rates than would be obtained by using the full submission data. A test on full submission data for all domestic students was undertaken to measure the extent of this effect. The results are provided in Table 20. The overall attrition rate for domestic students for 2001 using all submissions data was 17.5%, which is slightly lower than the rate calculated using the 31 March higher education data (18.6%). This should be taken into account when interpreting the results. The data excludes the Australian Maritime College, Open Learning Studies, other than major sole courses, Enabling, Cross-Institutional and Non-award courses.
• In 2002 a change was made to the definition of a commencing student. In simple terms, prior to 2002 the count of students in a reference year included students who were enrolled in a course between 1 April of the year prior to the reference year and 31 March of the reference year. From 2002, the count includes those enrolled between 1 September of the year prior to the reference year and August 31 of the reference year. The calculation of first year attrition rates for 2001 and second year attrition rates for 2000 for commencing students may be affected by this change and are therefore not included in this paper. Care should also be taken in comparing the rates for the years prior to 2001 with rates for 2002 as the population of commencing students is not identical.
• Most of the tables provide first year crude attrition rates. This measures the proportion of students in a year who neither graduate nor continue studying at the same institution in the following year. For example, the 2002 figure refers to the proportion of 2002 students who neither graduate nor continue studying at the same university in 2003. Students who enrol at another institution in the following year will be counted in those that have 'dropped out', as will those that deferred.
• For commencing undergraduate students, and commencing undergraduate ‘new to higher education’ and ‘not new to higher education’ students, second year crude attrition rates have also been calculated. The crude attrition rate for the second year measures the proportion of students in a year who neither graduate nor continue studying at the same institution in the year after the following year. For example, the 2001 figure refers to the proportion of 2001 students who neither graduated in 2001 or 2002 nor are enrolled at the same university in 2003.
• The calculation of attrition rates involves matching administrative data from a number of different files from one year to another. Whilst all care has been taken to ensure that the matching is undertaken accurately, it is possible that some changes in the administrative data of some institutions have not been accounted for. This may result in some anomalies

Improving the Retention of First year Students Page 208
in attrition rates from one year to another at the institution level. In addition, small numbers at some institutions may lead to variability in the calculated rates. As a result, care should be taken in comparing rates from one year to another at the institution level.
• The categories of students used in the tables (such as domestic commencing undergraduates, international students, etc) are not homogenous, being made up of different sub-populations in varying proportions. These subpopulations may very well have different attrition rates, due to different characteristics, study patterns and so on. Unfortunately, it is not possible to disaggregate the groups further in this paper (for example to look at attrition rates of overseas students who reside in Australia and those that reside overseas). However, when interpreting the rates, it should be borne in mind that the aggregate attrition rate may not provide the whole picture. It should also be borne in mind that a change in the student mix may result in changes in the attrition rates at an aggregate level over time.
• Only award courses are included in the calculations of attrition rates. Students undertaking enabling or non-award courses are not included. For example, if a student leaves a Bachelor course in one year and starts an Enabling course or Non-award course the following year, the student would be counted as part of the attrition. However, if the student left a Bachelor course and enrolled the next year at the same institution in a Postgraduate course or in any award course then he would not be counted as attrition.
• A student is classified as a commencing student in relation to a particular course. A commencing student is one who has enrolled for the first time to undertake a particular higher education course at a particular higher education institution in the reference year.
• New to higher education refers to those commencing undergraduate students who have never commenced a higher education course prior to the first enrolment in the current course.
• School leavers are defined as students who completed their final year of secondary education in the previous year or the year prior to the previous year. For example, 2002 school leavers are defined as students who commenced at the university in 2002 and completed their final year of secondary education in 2000 or 2001. The variable used to identify school leavers is 'a prior secondary education course at school' (e365). It does not include those who completed secondary education at a TAFE.
• The age of a student is calculated at 31 December in the year prior to the reference year. For example for 2002 students, age is calculated at 31 Dec 2001.
• Citizenship and residence status are used to determine if the student is considered to be a ‘domestic’ student or an overseas (or international) student. Domestic students include those who are Australian citizens, New Zealand citizens and students with permanent resident status. Overseas students are the remainder.
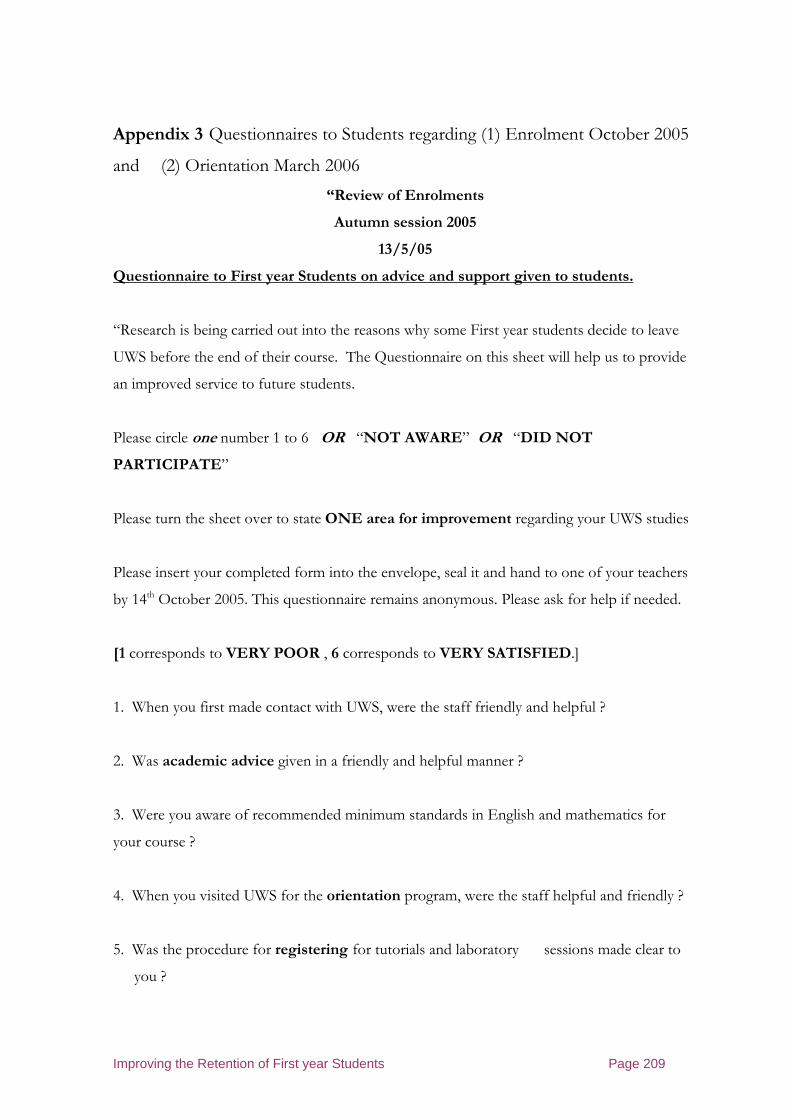
Improving the Retention of First year Students Page 209
Appendix 3 Questionnaires to Students regarding (1) Enrolment October 2005
and (2) Orientation March 2006
“Review of Enrolments
Autumn session 2005
13/5/05
Questionnaire to First year Students on advice and support given to students.
“Research is being carried out into the reasons why some First year students decide to leave
UWS before the end of their course. The Questionnaire on this sheet will help us to provide
an improved service to future students.
Please circle one number 1 to 6 OR “NOT AWARE” OR “DID NOT
PARTICIPATE”
Please turn the sheet over to state ONE area for improvement regarding your UWS studies
Please insert your completed form into the envelope, seal it and hand to one of your teachers
by 14th October 2005. This questionnaire remains anonymous. Please ask for help if needed.
[1 corresponds to VERY POOR , 6 corresponds to VERY SATISFIED.]
1. When you first made contact with UWS, were the staff friendly and helpful ?
2. Was academic advice given in a friendly and helpful manner ?
3. Were you aware of recommended minimum standards in English and mathematics for
your course ?
4. When you visited UWS for the orientation program, were the staff helpful and friendly ?
5. Was the procedure for registering for tutorials and laboratory sessions made clear to
you ?

Improving the Retention of First year Students Page 210
6. Was the importance of attending tutorials and laboratory sessions made clear to you ?
7. Was the importance of regular participation in WebCT and e-mails made clear to you ?
8. Did you find the peer mentoring useful to you ?
9. Did you find the academic mentoring useful to you ?
10. Have academic staff been helpful, approachable and friendly to you ?
Improving the Retention of First year Students Page 211
[INFORMATION SHEET accompanying the enrolment 2005 Survey] UWS Letterhead Survey into the retention, performance and satisfaction of students. You are invited to take part in a survey of first year students which is planned to collect information which will be used to improve the advice and support given to first year students in future years. This survey is purely voluntary and should take you about 5 minutes to complete. The survey is looking into the reasons why some students discontinue their studies during their first year. A number of measures have been recently introduced to offer help and assistance to students and your answers will help us to make any adjustments in future years. The researcher is Graham Bishop, Teaching Fellow from the School of Engineering and Industrial Design, telephone 2105, [email protected] For each question, please circle ONE NUMBER 0 to 6 with
0 indicating VERY POOR and 6 indicating VERY SATISFIED OR circle NOT AWARE OR circle DID NOT PARTICIPATE. The results of this survey will enable the School and the University to modify the measures described so that the retention, performance and satisfaction of future students can improve This survey is anonymous and completely confidential. The results will be posted on WebCT for information. You are free to withdraw at any time without explanation. Please contact the researcher at any time for further explanation. NOTE: This study has been approved by the University of Western Sydney Human Research Ethics Committee or Panel (indicate Committee or Panel). The Approval Number is …………………… If you have any complaints or reservations about the ethical conduct of this research, you may contact the Ethics Committee/Panel through the Research Ethics Officers (tel:: 02 4736 0883 or 4736 0884). Any issues you raise will be treated in confidence and investigated fully, and you will be informed of the outcome. PLEASE RETURN YOUR QUESTIONNAIRE, WITH THE SIGNED CONSENT FORM, TO GRAHAM BISHOP BY 1 st OCTOBER 2005 IN THE ENVELOPE PROVIDED
Improving the Retention of First year Students Page 212
The following pages list the 2006 Survey questions, 1 to 26, referred to in Chapter 4:
Improving the Retention of First year Students Page 213
Improving the Retention of First year Students Page 214
Improving the Retention of First year Students Page 215
Improving the Retention of First year Students Page 216
Improving the Retention of First year Students Page 217
Improving the Retention of First year Students Page 218
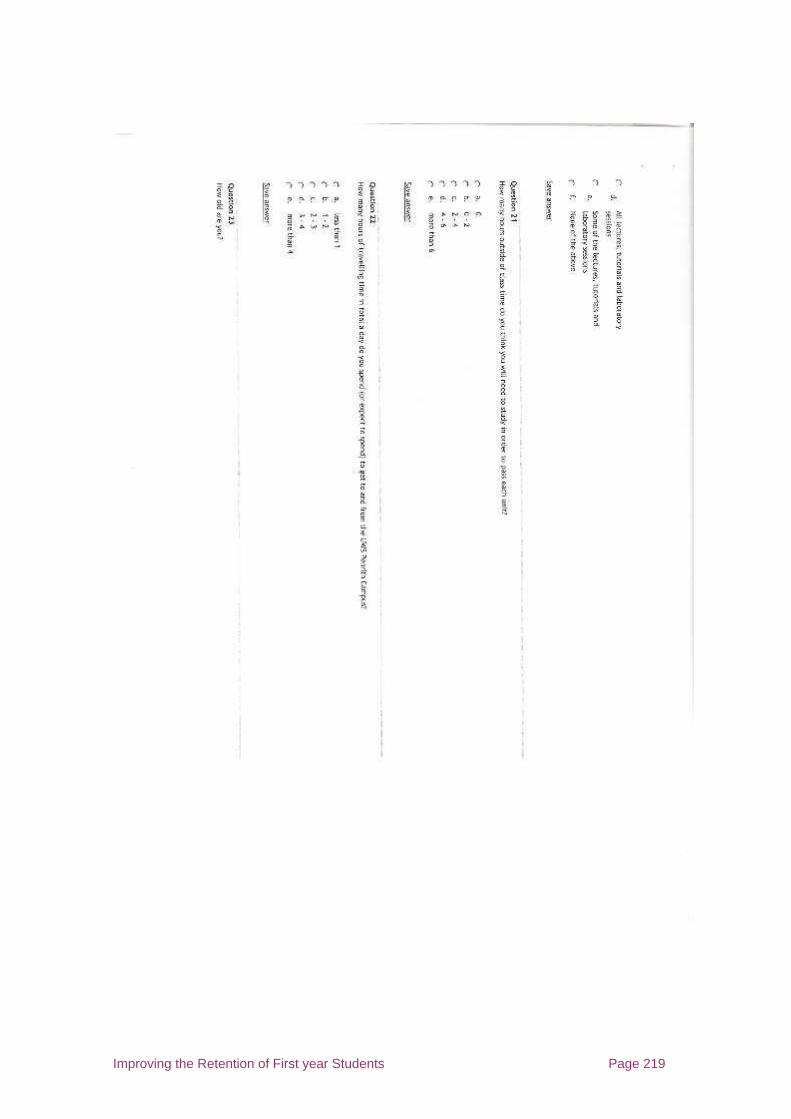
Improving the Retention of First year Students Page 219
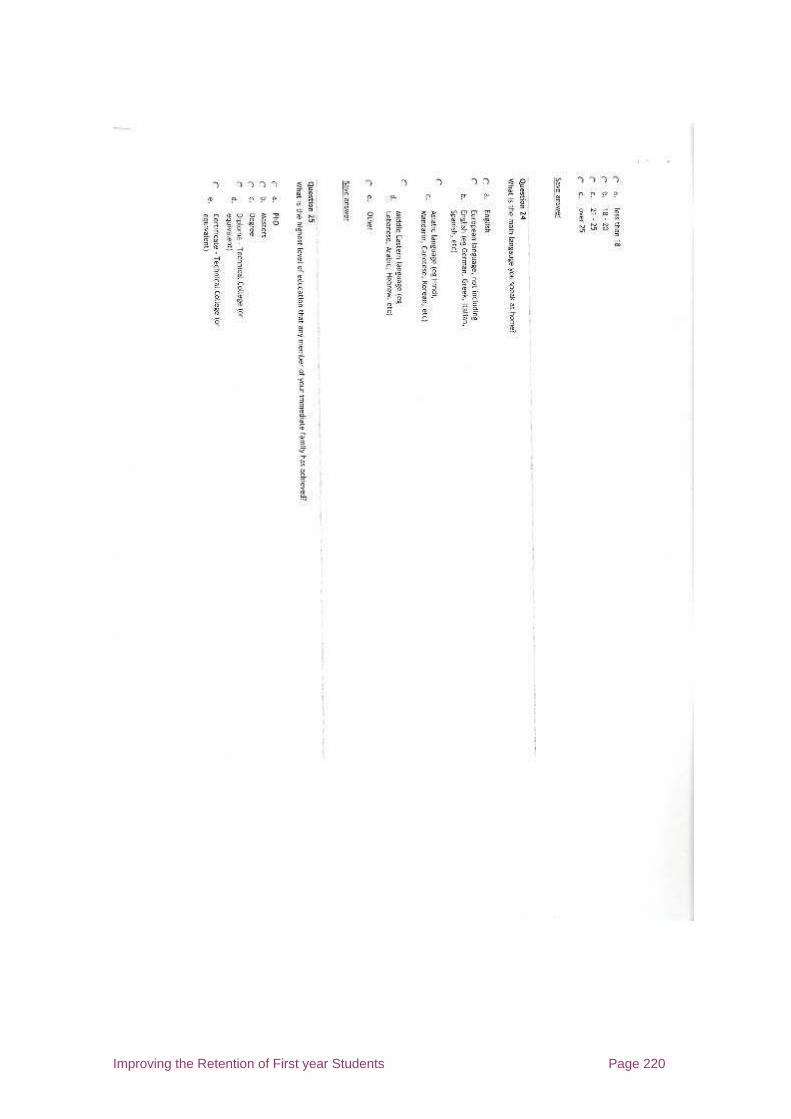
Improving the Retention of First year Students Page 220
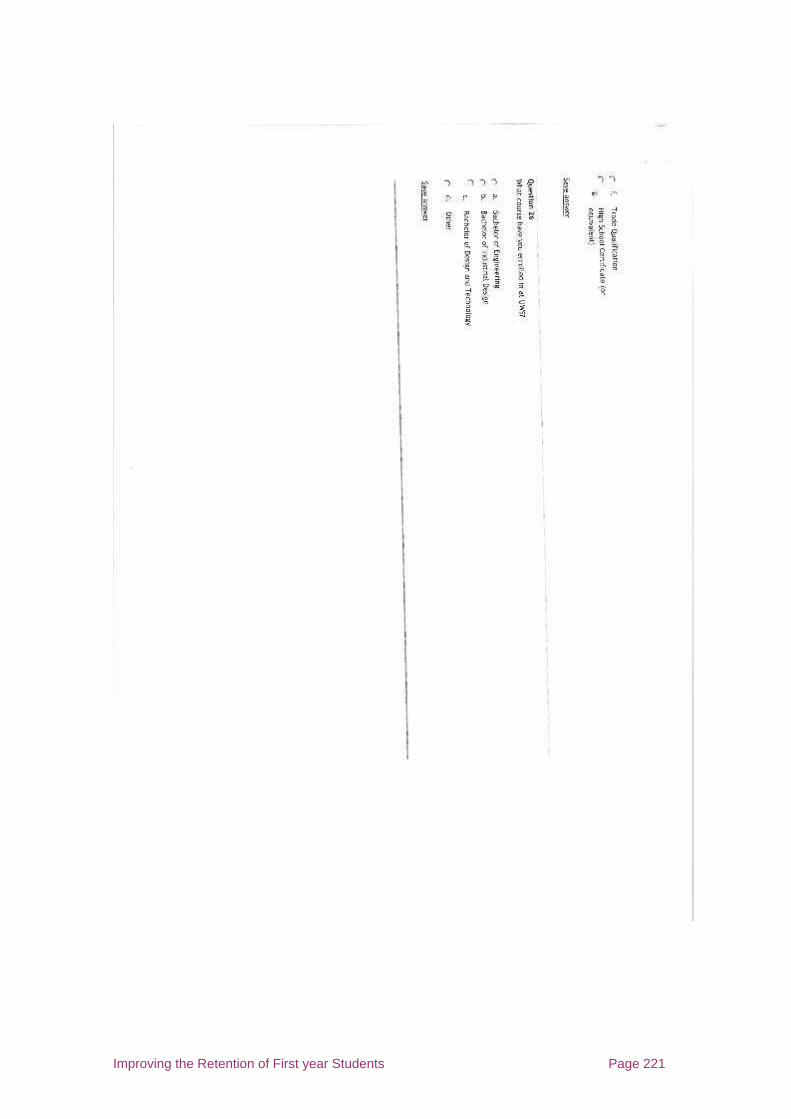
Improving the Retention of First year Students Page 221
Improving the Retention of First year Students Page 222
Appendix 4 Orientation Program 2006 for the School of Engineering
Assembly in Lecture Theatre K
10.00 am Welcome by
Chair of School – Professor Steven Riley
10.20 am Careers and Employment Jackie Simpson
10.30 am Engineers Australia Pamela Noal
10.40 am The Learning Centre Lyn Armstrong
10.50 am Introduction to key Staff Bruce Campbell
Eric Bohemia, Phil Madigan, John Gal, Ataur Rahman
10.55 am Library Services Rohini Patil
11.00 am Separation into Tutorial Groups in X Building
Academic Mentors will each then conduct tutor groups of 22 students to allocated
rooms in X Building to introduce, with the Peer Mentors, the Orientation topics
listed below, using prepared OHP slides.
12.00 noon BBQ Lunch provided for Staff and New Students
Further re-enforcement of topics, and answering of queries from students, also
scheduled for the first week of the semester during a one hour timetabled tutorial
session.
Orientation Topics :
a. The physical environment, as applied to the School –
Layout of the campuses
Parking arrangements
Bus travel between the campuses and to/from Kingswood Rail Station
Code of Conduct within the buildings
Improving the Retention of First year Students Page 223
b. The electronic environment, as applied to the School
Activating and using MyUWS Account
Using WebCT
Regular checking for messages - * IMPORTANT *
Regular checking for course information, notes, assessments
Checking for available supplementary Learning Skills programs
Useful web sites, including the Orientation site for 2006
[ http://www.uws.edu.au/students/orientation2006/faqs ] and the School site
[http://www.uws.edu.au/about/acadorg/cste/seid ]
Referring students to the e-learning resource page [
http://www.uws.edu.au/students/onlinesupport ].
c. Staff information
First Year Teaching team
Names, with photographs
Contact details, rooms, e-mails etc
Consultation procedures
Administrative staff [with photographs] and locations, access
d. Help ? - as applied to the School –
Referring to the School Student Handbook
The role of the Course or Unit Co-ordinator
Notice Boards
Academic mentors, their role, names, locations, access
Peer mentors, their role, names, locations, access
Student Support Services
Careers, Employment, Counselling, Disabilities
Learning Skills Unit and Bridging programs - * IMPORTANT *
The Student Centre
Central and School Student Administration – their role

Improving the Retention of First year Students Page 224
Minimising stress and anxiety
Key contact numbers, e-mail addresses and web sites
e. Administration
School Printing facilities
Computer access within the School
E-mail access within the School
Census Dates: 31st March, 31st August 2006
Honours or Non-Honours Stream choice
f. Class/Course procedures – Referring to the School student handbook
Registering procedure for tutorials
Registering procedure for practical classes
Your weekly timetable
The School timetable/Dateline 2006
[http://www.uws.edu.au/about/adminorg/academic/oar/info/dateline/2006] ,
referring to student vacations, public holidays etc.
Importance of attendance at lectures
Importance of full attendance at tutorials and other sessions
What to do if sick or absent for classes
Importance of prompt arrival at lectures, tutorials etc.
Code of Conduct in lectures, tutorials etc
Your work must be your own
Accumulation of marks/scores during the first year
Obtaining recommended text books and materials
Security issues – responsibility for student belongings, including USB
drives.
g. Occupational Health & Safety – Referring to the School student Handbook:
The Importance of a safe learning and working environment

Improving the Retention of First year Students Page 225
Risk assessments
Using equipment and facilities
h. Laboratory work – Referring to the School student handbook
Procedures for the completion of assessment and assignment work
Importance of following safety procedures in the laboratories
The role of the Technical staff
Pre-work, recording and location of laboratory work
8. Examinations – Referring to the School student handbook
Attendance and procedure “If I cannot attend”
Timing
Code of Conduct
Food & Drink
Mobile phones
ID checks
Deferred examinations
h. Questions and answers on:
The academic culture and expectations
School policies and procedures
The common First Year
The 10 Generic Attributes
Degree structures
The transition from School to University
“Engineers Australia”
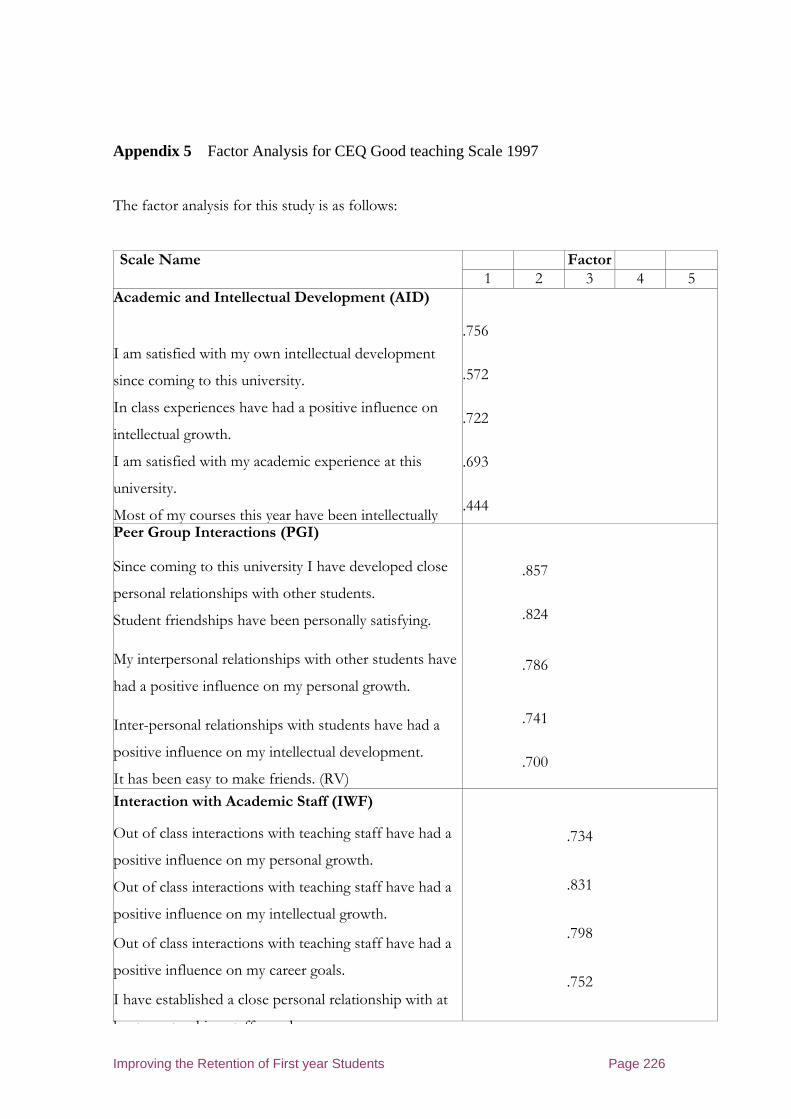
Improving the Retention of First year Students Page 226
Appendix 5 Factor Analysis for CEQ Good teaching Scale 1997
The factor analysis for this study is as follows:
Factor Scale Name 1 2 3 4 5
Academic and Intellectual Development (AID)
I am satisfied with my own intellectual development
since coming to this university.
In class experiences have had a positive influence on
intellectual growth.
I am satisfied with my academic experience at this
university.
Most of my courses this year have been intellectually
.756
.572
.722
.693
.444
Peer Group Interactions (PGI)
Since coming to this university I have developed close
personal relationships with other students.
Student friendships have been personally satisfying.
My interpersonal relationships with other students have
had a positive influence on my personal growth.
Inter-personal relationships with students have had a
positive influence on my intellectual development.
It has been easy to make friends. (RV)
.857
.824
.786
.741
.700
Interaction with Academic Staff (IWF)
Out of class interactions with teaching staff have had a
positive influence on my personal growth.
Out of class interactions with teaching staff have had a
positive influence on my intellectual growth.
Out of class interactions with teaching staff have had a
positive influence on my career goals.
I have established a close personal relationship with at
l t t hi t ff b
.734
.831
.798
.752
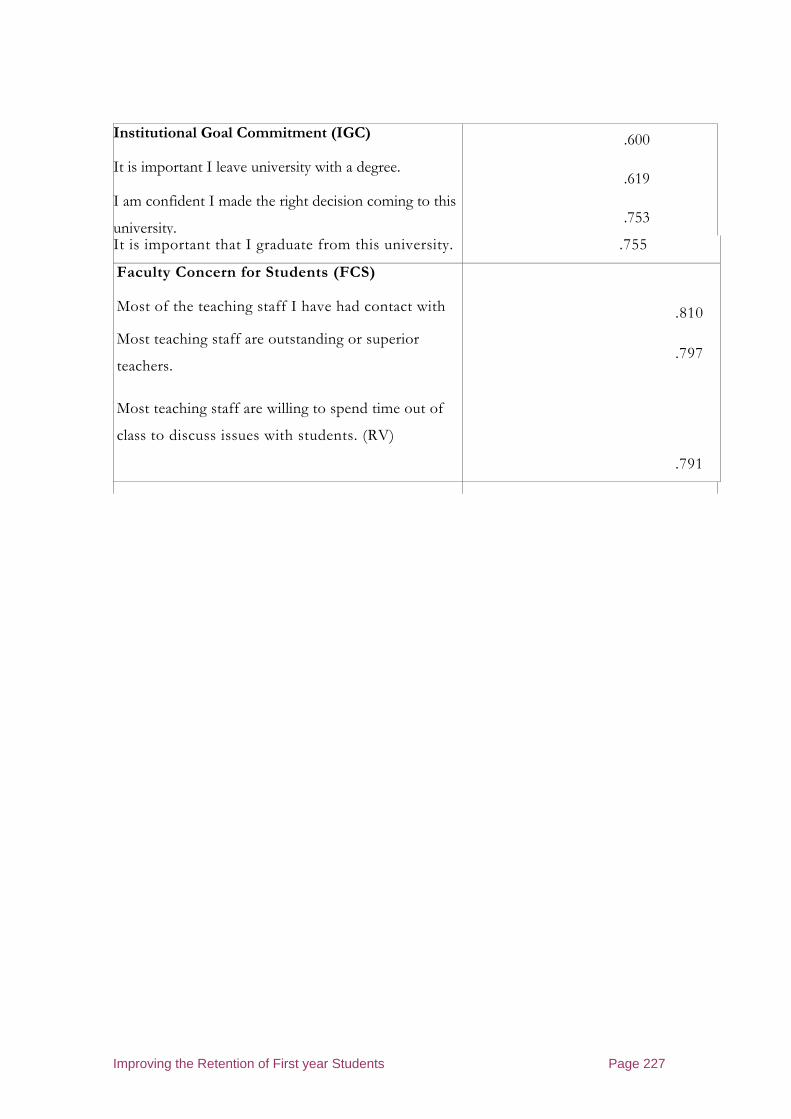
Improving the Retention of First year Students Page 227
Institutional Goal Commitment (IGC)
It is important I leave university with a degree.
I am confident I made the right decision coming to this
university.
.600
.619
.753
It is important that I graduate from this university. .755
Faculty Concern for Students (FCS)
Most of the teaching staff I have had contact with .810
Most teaching staff are outstanding or superior
teachers. .797
Most teaching staff are willing to spend time out of
class to discuss issues with students. (RV)
.791

Improving the Retention of First year Students Page 228
Appendix 6 Analysis of Mathematics entry and exam data for UWS School of Engineering students 2005
Sheet 1
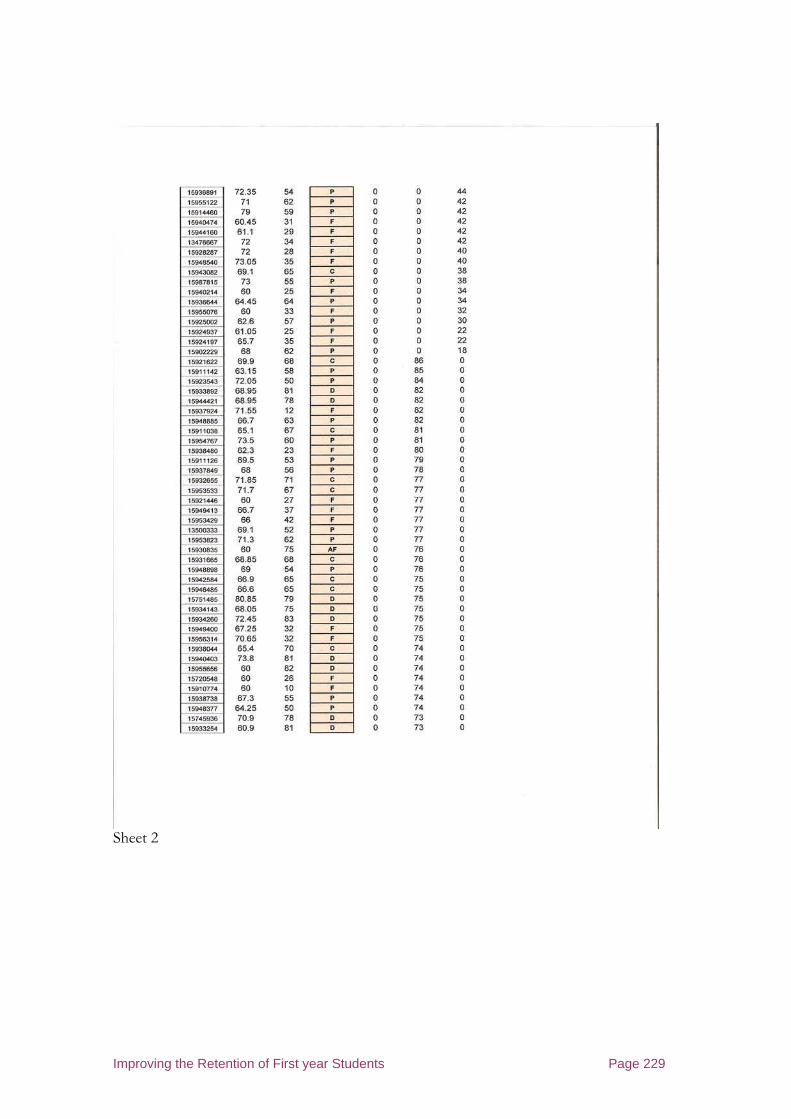
Improving the Retention of First year Students Page 229
Sheet 2

Improving the Retention of First year Students Page 230
Sheet 3

Improving the Retention of First year Students Page 231
Sheet 4
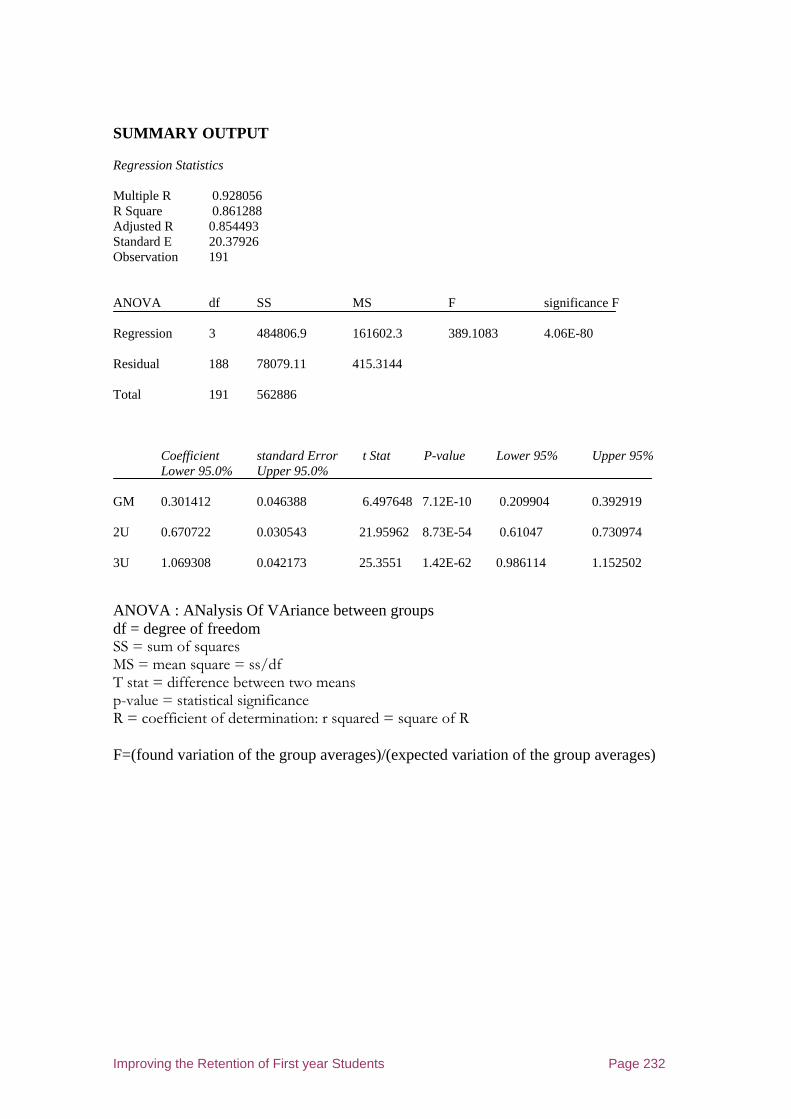
Improving the Retention of First year Students Page 232
SUMMARY OUTPUT Regression Statistics Multiple R 0.928056 R Square 0.861288 Adjusted R 0.854493 Standard E 20.37926 Observation 191 ANOVA df SS MS F significance F Regression 3 484806.9 161602.3 389.1083 4.06E-80 Residual 188 78079.11 415.3144 Total 191 562886
Coefficient standard Error t Stat P-value Lower 95% Upper 95% Lower 95.0% Upper 95.0% GM 0.301412 0.046388 6.497648 7.12E-10 0.209904 0.392919 2U 0.670722 0.030543 21.95962 8.73E-54 0.61047 0.730974 3U 1.069308 0.042173 25.3551 1.42E-62 0.986114 1.152502 ANOVA : ANalysis Of VAriance between groups df = degree of freedom SS = sum of squares MS = mean square = ss/df T stat = difference between two means p-value = statistical significance R = coefficient of determination: r squared = square of R F=(found variation of the group averages)/(expected variation of the group averages)
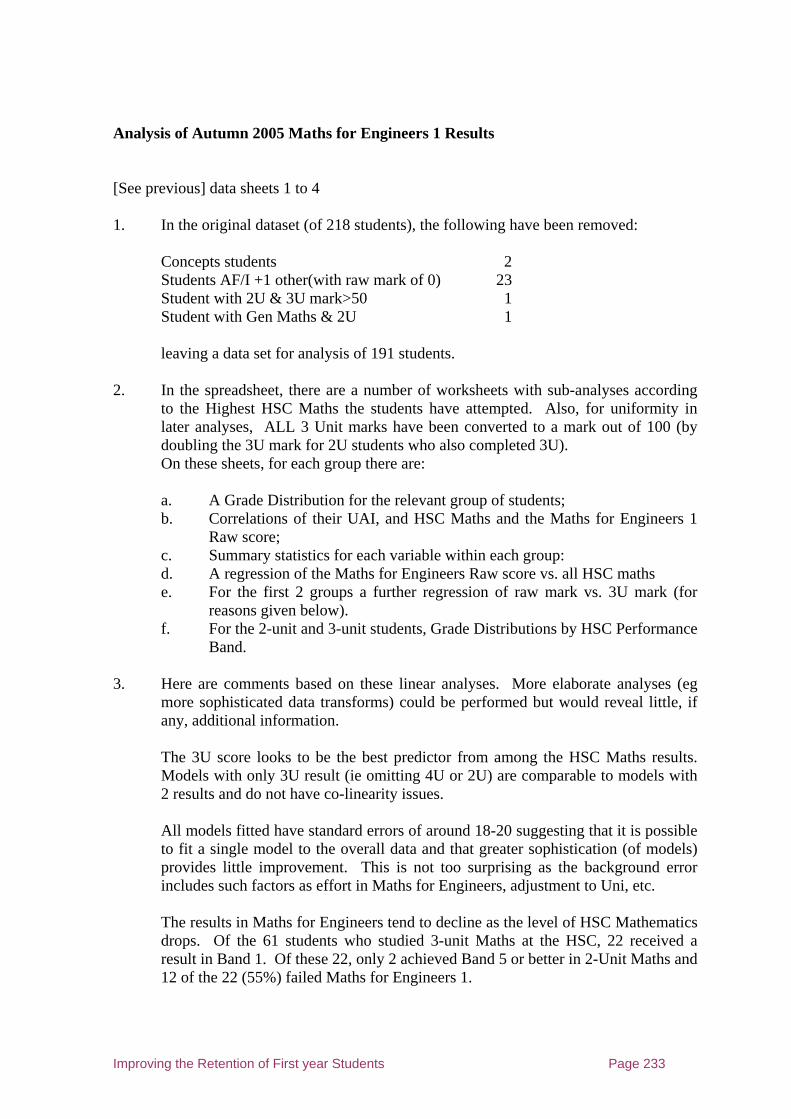
Improving the Retention of First year Students Page 233
Analysis of Autumn 2005 Maths for Engineers 1 Results [See previous] data sheets 1 to 4 1. In the original dataset (of 218 students), the following have been removed: Concepts students 2 Students AF/I +1 other(with raw mark of 0) 23 Student with 2U & 3U mark>50 1 Student with Gen Maths & 2U 1 leaving a data set for analysis of 191 students. 2. In the spreadsheet, there are a number of worksheets with sub-analyses according
to the Highest HSC Maths the students have attempted. Also, for uniformity in later analyses, ALL 3 Unit marks have been converted to a mark out of 100 (by doubling the 3U mark for 2U students who also completed 3U).
On these sheets, for each group there are:
a. A Grade Distribution for the relevant group of students; b. Correlations of their UAI, and HSC Maths and the Maths for Engineers 1
Raw score; c. Summary statistics for each variable within each group: d. A regression of the Maths for Engineers Raw score vs. all HSC maths e. For the first 2 groups a further regression of raw mark vs. 3U mark (for
reasons given below). f. For the 2-unit and 3-unit students, Grade Distributions by HSC Performance
Band. 3. Here are comments based on these linear analyses. More elaborate analyses (eg
more sophisticated data transforms) could be performed but would reveal little, if any, additional information.
The 3U score looks to be the best predictor from among the HSC Maths results.
Models with only 3U result (ie omitting 4U or 2U) are comparable to models with 2 results and do not have co-linearity issues.
All models fitted have standard errors of around 18-20 suggesting that it is possible
to fit a single model to the overall data and that greater sophistication (of models) provides little improvement. This is not too surprising as the background error includes such factors as effort in Maths for Engineers, adjustment to Uni, etc.
The results in Maths for Engineers tend to decline as the level of HSC Mathematics
drops. Of the 61 students who studied 3-unit Maths at the HSC, 22 received a result in Band 1. Of these 22, only 2 achieved Band 5 or better in 2-Unit Maths and 12 of the 22 (55%) failed Maths for Engineers 1.
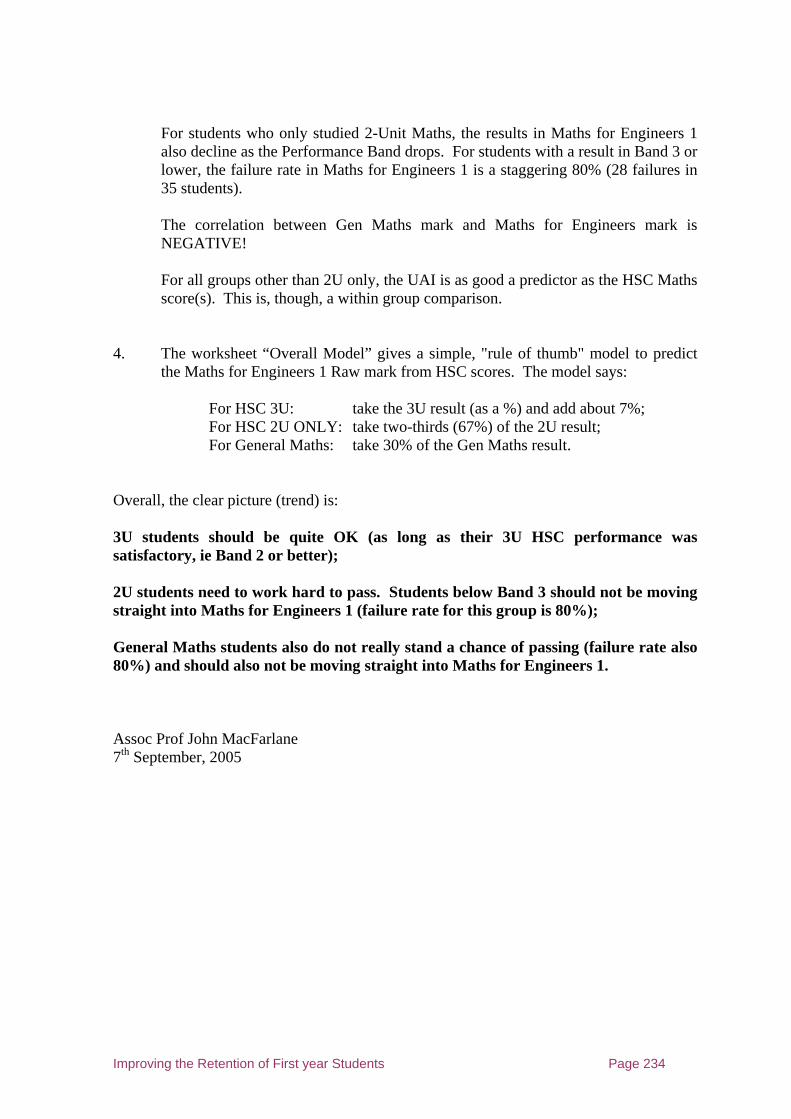
Improving the Retention of First year Students Page 234
For students who only studied 2-Unit Maths, the results in Maths for Engineers 1 also decline as the Performance Band drops. For students with a result in Band 3 or lower, the failure rate in Maths for Engineers 1 is a staggering 80% (28 failures in 35 students).
The correlation between Gen Maths mark and Maths for Engineers mark is
NEGATIVE!
For all groups other than 2U only, the UAI is as good a predictor as the HSC Maths score(s). This is, though, a within group comparison.
4. The worksheet “Overall Model” gives a simple, "rule of thumb" model to predict
the Maths for Engineers 1 Raw mark from HSC scores. The model says: For HSC 3U: take the 3U result (as a %) and add about 7%; For HSC 2U ONLY: take two-thirds (67%) of the 2U result; For General Maths: take 30% of the Gen Maths result. Overall, the clear picture (trend) is: 3U students should be quite OK (as long as their 3U HSC performance was satisfactory, ie Band 2 or better); 2U students need to work hard to pass. Students below Band 3 should not be moving straight into Math s for Engineers 1 (failure rate for this group is 80%); General Maths students also do not really stand a chance of passing (failure rate also 80%) and should also not be moving straight into Maths for Engineers 1. Assoc Prof John MacFarlane 7th September, 2005
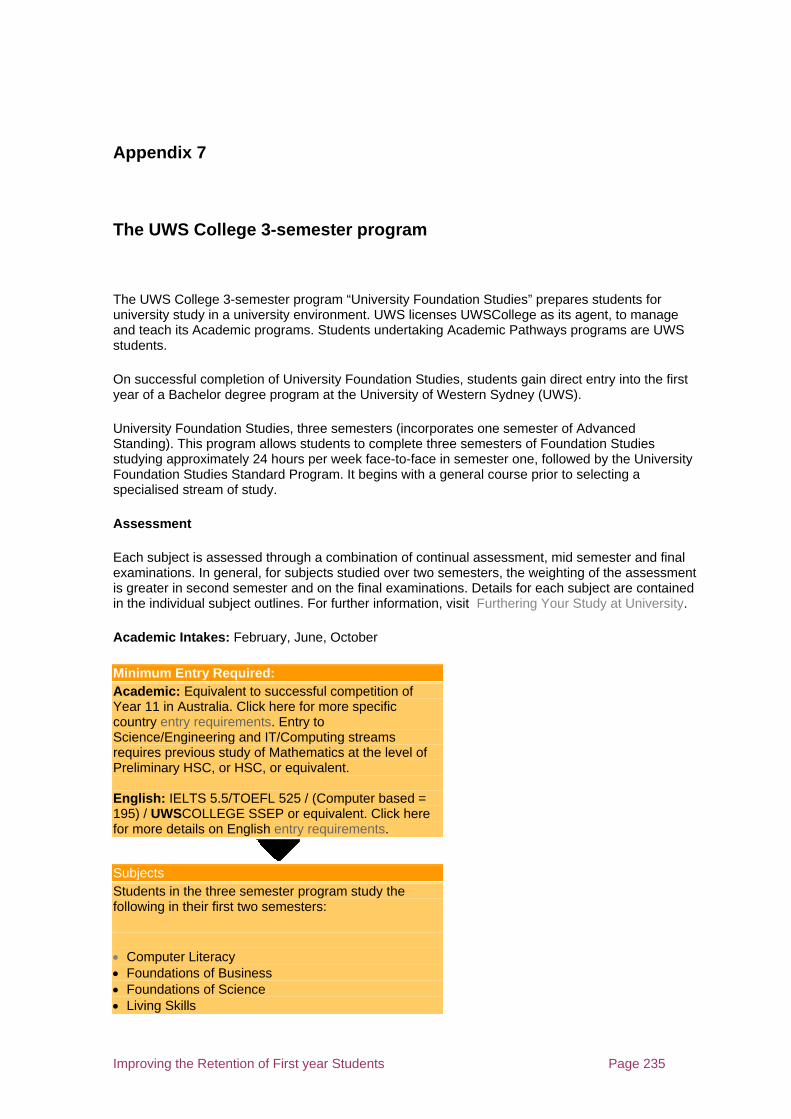
Improving the Retention of First year Students Page 235
Appendix 7
The UWS College 3-semester program
The UWS College 3-semester program “University Foundation Studies” prepares students for university study in a university environment. UWS licenses UWSCollege as its agent, to manage and teach its Academic programs. Students undertaking Academic Pathways programs are UWS students.
On successful completion of University Foundation Studies, students gain direct entry into the first year of a Bachelor degree program at the University of Western Sydney (UWS).
University Foundation Studies, three semesters (incorporates one semester of Advanced Standing). This program allows students to complete three semesters of Foundation Studies studying approximately 24 hours per week face-to-face in semester one, followed by the University Foundation Studies Standard Program. It begins with a general course prior to selecting a specialised stream of study.
Assessment
Each subject is assessed through a combination of continual assessment, mid semester and final examinations. In general, for subjects studied over two semesters, the weighting of the assessment is greater in second semester and on the final examinations. Details for each subject are contained in the individual subject outlines. For further information, visit Furthering Your Study at University.
Academic Intakes: February, June, October
Minimum Entry Required: Academic: Equivalent to successful competition of Year 11 in Australia. Click here for more specific country entry requirements. Entry to Science/Engineering and IT/Computing streams requires previous study of Mathematics at the level of Preliminary HSC, or HSC, or equivalent. English: IELTS 5.5/TOEFL 525 / (Computer based = 195) / UWSCOLLEGE SSEP or equivalent. Click here for more details on English entry requirements.
Subjects Students in the three semester program study the following in their first two semesters:
• Computer Literacy • Foundations of Business • Foundations of Science • Living Skills
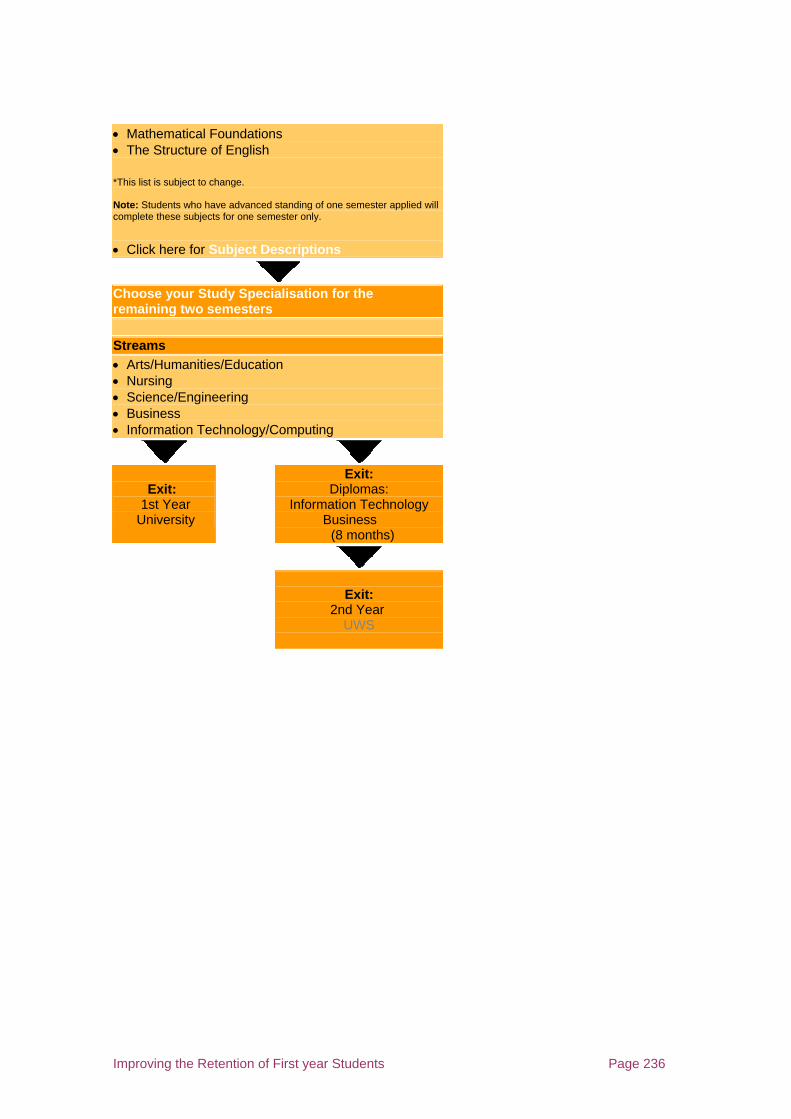
Improving the Retention of First year Students Page 236
• Mathematical Foundations • The Structure of English
*This list is subject to change. Note: Students who have advanced standing of one semester applied will complete these subjects for one semester only.
• Click here for Subject Descriptions
Choose your Study Specialisation for the remaining two semesters Streams • Arts/Humanities/Education • Nursing • Science/Engineering • Business • Information Technology/Computing
Exit: 1st Year University
Exit: Diplomas:
Information Technology Business (8 months)
Exit:
2nd Year UWS
Improving the Retention of First year Students Page 237
Appendix 8 Report of the Group reviewing enrolment 2005
Staff of the Enrolments and Student Finance Unit met and evaluated the process, with the
following comments:
What went well.
1) Set up and flow of students through the process.
Staff commented that the set up of the rooms at Werrington South meant that
students moved through the process well, with few bottlenecks. Most students easily
completed enrolments within 2 hours.
2) Change of approach to academic advising: having non-compulsory advisory sessions meant
that students had flexibility in terms of when they could enrol
3) The introduction of a colour-coded enrolment pack system meant that distribution of the right
type of enrolment forms to students went smoothly.
4) Student satisfaction with process: surveys conducted by The UWS Planning and Quality
Unit indicated that overall, students were satisfied with the overall enrolment event.
5) Bus service: provision of the bus service from the station to the venue was well received.
6) The hours of opening – 8am – 8pm on 13 consecutive work days, and 10 – 3 pm on 2
Saturdays, meant that students had ample opportunity to attend an enrolment session.
7) Being at one venue meant that staff could pool resources and adequately resource each
other. It was a more effective use of resources. Casual staff undertaking data could
check their work and the way to manage particular issues with each other to ensure
consistency of approach.

Improving the Retention of First year Students Page 238
What Needs Work
1) Academic Advising – more pre-set units should be explored, as many students still
seemed unclear as to what units they needed to select.
2) External Packs – Students enrolling by mail do not receive enough advice as to what
units to select, which meant that the error rate was very high.
3) Times for advising – some advising sessions went for 4 to 5 hours. Some academic
staff seeing each individual student, and attempting to solve academic credit issues
on the spot.
4) Technology failures: E&SF had two major technology failures that had a major
impact on the effectiveness of enrolments:
• Failure of the admissions upload/pre-enrolment job meant that manual enrolment
forms had to be created by staff for the first week of enrolment. This meant that
no students could obtain their ID card at their enrolment session; and staff had no
way of checking if student had a valid offer. This affected approximately 1/3rd of
all Autumn session enrolments.
• COFI job corrupting the production database, resulting in a 48 hour roll back
meant that much data was lost and could not be retrieved, and forms had to
collected and entered again. For data entry to be completed by tute reg opening,
work had to be prioritized in order of tute reg opening times and staff were
required to work on weekends, in addition to long days during the week.
5) Quota problems: many units had quotas on them (including core units), and these
enrolments remained unresolved for some time, despite numerous correspondence
with the college and schools and delayed tute reg
6) Late Enrolment: Feedback, particularly from academic staff, indicated that staff and
students would prefer that late enrolment should be conducted at the student

Improving the Retention of First year Students Page 239
centres, rather than making late enrollers go to the Hawkesbury campus to enrol. It
was also noted that staff spent a lot of energy dealing with students who are
attempting to enrol late (after the last agreed day)
7) Conditional Offers – many students seemed unaware of their conditional status. The
letter received from UAC needs to be changed to emphasise the conditional nature
of the offer
8) Enrolling special groups: despite having a mail enrolment option, many Schools and
Colleges would like E&SF to arrange special enrolment sessions for different groups
of students. This usually entails much resource allocation, and when offered, is
underutilized by the groups being targeted by this special service.
9) Courses that are not flagged as external, but contain externally taught units. E&SF
will organise mail enrolment for any externally coded course. However many courses
are not flagged as external, even though the units contained within the course are.
This caused problems with students expecting a mail enrolment package, but E&SF
unable to identify them
10) Parents and friends caused some problems with queue flow.
11) Arrangement to cover “base camp”. Arrangements with the student centres to
cover base operations during the enrolment period was not considered a success, as
there was confusion over when the arrangement finished
Issues concerning enrolment are listed below to indicate the efforts made to address the
comments from staff and students from previous years:
i) To ensure that the feedback on advising session be given to the academic staff and
their assistance in better management of these sessions is sought.
ii) E&SF to liaise with Systems and Admissions to ensure that pre-enrol
problems experienced in Autumn session will not be replicated in Spring
Improving the Retention of First year Students Page 240
Session
iii) E&SF to develop a merge template pre- set up to be ready in advance if problem
does re-occur
iv) Ensure that we have high speed printers to print off manual enrolment forms
(current printers very slow)
v) To liaise with Systems to ensure that invoicing of students does not occur during
the same week of enrolment
vi) To determine an agreed escalation process with the Colleges and Schools to
resolve quota restriction issues in a timely manner.
vii) That late enrolling students be allowed to enrol via the student centres. Good
training and support materials (such as a check list) should be provided to Student
Centre staff to assist them in this.
viii) That all students be allowed to enrol up to the end of week 2 of session, without
having to apply for late enrolment. No new students to be charged the late fee.
Continuing students may be charged the late fee after the session starts only. The
issue of these students not receiving an invoice may be alleviated by the ad hoc
statement of account functionality that is proposed for mid year.
ix) To discuss with admissions the possibility of amending the UAC offer letter to
make the conditional enrolment more prominent.
x) To provide three types of enrolment services only: mail enrolment, or enrolment
during standard sessions, or late enrolment through a student centre.
xi) To send an email to the School Administrative Coordinators, advising of the
courses we intend to mail enrol, and giving them the opportunity to add ones

Improving the Retention of First year Students Page 241
where E&SF cannot easily determine eligibility for mail enrolment.
xii) To organize a separate area for friends and parents to wait at the enrolment event,
and provide free tea/coffee for them. To display signs asking friends and family to
wait and not join the queues.
xiii) To revisit the arrangement of covering base camp during enrolment period with
the student centres, to ensure that the basis of the arrangement is clear for both
parties.
Other Issues Identified:
• The organisation of a Prayer room for students
• To investigate child care arrangements with the UWS Childcare centre.
To buy lollies, as the benefit of this outweighs the minimal costs.

Improving the Retention of First year Students Page 242
Appendix 9 “First Year Central” website Checklist
• Starting out checklist
o Do you have a copy of your enrolment form showing which units you are
enrolled in?
o Have you completed your Commonwealth Assistance Form?
o If you do not qualify for Commonwealth support, have you paid your tuition
fees?
o Have you paid your student activities fee?
o Do you have your student ID card?
• FAQs for first year students
o - How will I find my way around the campus?
o - How do I know I am enrolled in a Unit?
o - What is an elective?
o - What if I don't hand my Commonwealth Assistance Form (CAF) in by the
approved census date?
o - When do I get my timetable?
o - What is the difference between a lecture and a tutorial?
o - Are lectures and tutorials compulsory?
o - How do I register for tutorials?
o - How do I know which text books I will need?
o - Where can I get text books?
o - I am not very confident taking notes or writing essays. What can I do?
o - Does the University have computers I can use?
o - Do I have a UWS email account?
o - How can I gain access to the University computer network and activate my
email account?
o - How do I use the library?
o - Can I park my car on campus?
o - Am I entitled to travel concession?
o - Where can I find out about clubs and social activities?
o - What costs are involved with studying?
o - How do I contact my lecturer or tutor?
o - What do I do if I miss a compulsory component of my course?
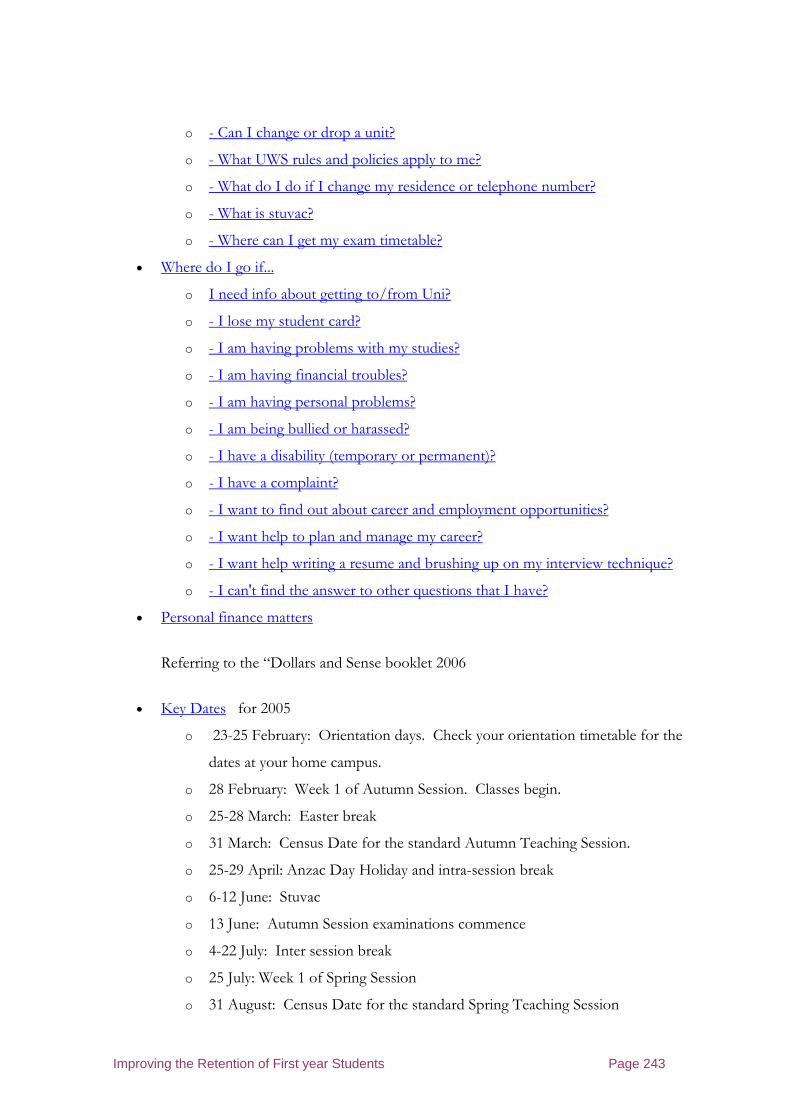
Improving the Retention of First year Students Page 243
o - Can I change or drop a unit?
o - What UWS rules and policies apply to me?
o - What do I do if I change my residence or telephone number?
o - What is stuvac?
o - Where can I get my exam timetable?
• Where do I go if...
o I need info about getting to/from Uni?
o - I lose my student card?
o - I am having problems with my studies?
o - I am having financial troubles?
o - I am having personal problems?
o - I am being bullied or harassed?
o - I have a disability (temporary or permanent)?
o - I have a complaint?
o - I want to find out about career and employment opportunities?
o - I want help to plan and manage my career?
o - I want help writing a resume and brushing up on my interview technique?
o - I can't find the answer to other questions that I have?
• Personal finance matters
Referring to the “Dollars and Sense booklet 2006
• Key Dates for 2005
o 23-25 February: Orientation days. Check your orientation timetable for the
dates at your home campus.
o 28 February: Week 1 of Autumn Session. Classes begin.
o 25-28 March: Easter break
o 31 March: Census Date for the standard Autumn Teaching Session.
o 25-29 April: Anzac Day Holiday and intra-session break
o 6-12 June: Stuvac
o 13 June: Autumn Session examinations commence
o 4-22 July: Inter session break
o 25 July: Week 1 of Spring Session
o 31 August: Census Date for the standard Spring Teaching Session
Improving the Retention of First year Students Page 244
o 12-16 September: Intra session break
o 31 October-6 November: Stuvac
o 7 November: Spring Session examinations commence
o 28 November: Inter session break, followed by Christmas/New Year break
• WebCT
Describing e-learning WebCT and how to log on
• Enrolment matters
• Timetables and Tutorial Registration
• Fee matters
• Exam matters
• Course matters
Listing the degree courses and Schools
• College matters
Listing the Colleges
• University Policies & Procedures
With an emphasis on
o Leave of absence from studies
o Assessment and examinations
o Transfer of course
o Student misconduct
• Mature age students
Describing MASK, a workshop and mentoring program specifically designed for
mature aged students returning to study after a gap.
• What to do if you're thinking of dropping out
Which suggests
Improving the Retention of First year Students Page 245
o Take a short break
o Manage your stress
o Get back on track
o Improve your study skills
o Drop a unit or transfer to part-time study
o Change your Course
• Time management
Giving advice on
o Be aware of how you spend your time each day.
o Set priorities so you know what's important to you - and what isn't.
o Establish goals for your personal, work and family life.
o Plan a strategy to meet your goals.
o Develop habits that will help you get what you want in life.
• Tips for success at uni
suggesting 10 handy tips developed by the UWS Counselling Service to help students survive
university study.
1. Go to class!
2. Keep up with your readings
3. Talk to other students in your class and think about forming a study group
4. Talk to your lecturer or tutor
5. Know what is expected of you
6. Be prepared for assignments and exams
7. Know your resources
8. Have a study plan
9. Ask for help if you need it
10. Have fun!
• Helping to Make the Most of your First Year Experience with
o Handy Guides some of which are distributed at the orientation session

Improving the Retention of First year Students Page 246
o Surf the Web , with links to careers advice and a student chat room, and
o Programs and Workshops where students are directed to Student Support
Services, learning support workshops, where needed and the peer mentoring
program.
• Ask Us
Directing students to [email protected] [fyc = first year central] id required
• Updates
REVIEW FINDING: Students have access to a significant amount of online information
when selecting UWS or their course or available help and facilities – often supplemented by
telephone numbers and other contacts or links.
(xi) Borrowing books from the Library
Access to the UWS Libraries requires a Student ID card, after which students can
borrow books and materials in a similar way to most libraries. Also students have
access to a worldwide library of e-material necessary for their studies.
(xii) Clarifying the course timetable