{72079307-8b70-4814-b91a-3ad48351bd53} · 2018. 11. 30. · title: microsoft word -...
TRANSCRIPT
COMPREHENSIVE ANNUAL FINANCIAL REPORT YEAR ENDED JUNE 30, 20�2

CITY OF MARTINSVILLE, VIRGINIA
COMPREHENSIVE ANNUAL FINANCIAL REPORT
YEAR ENDED JUNE 30, 2012
PREPARED BY:
Finance Department
1

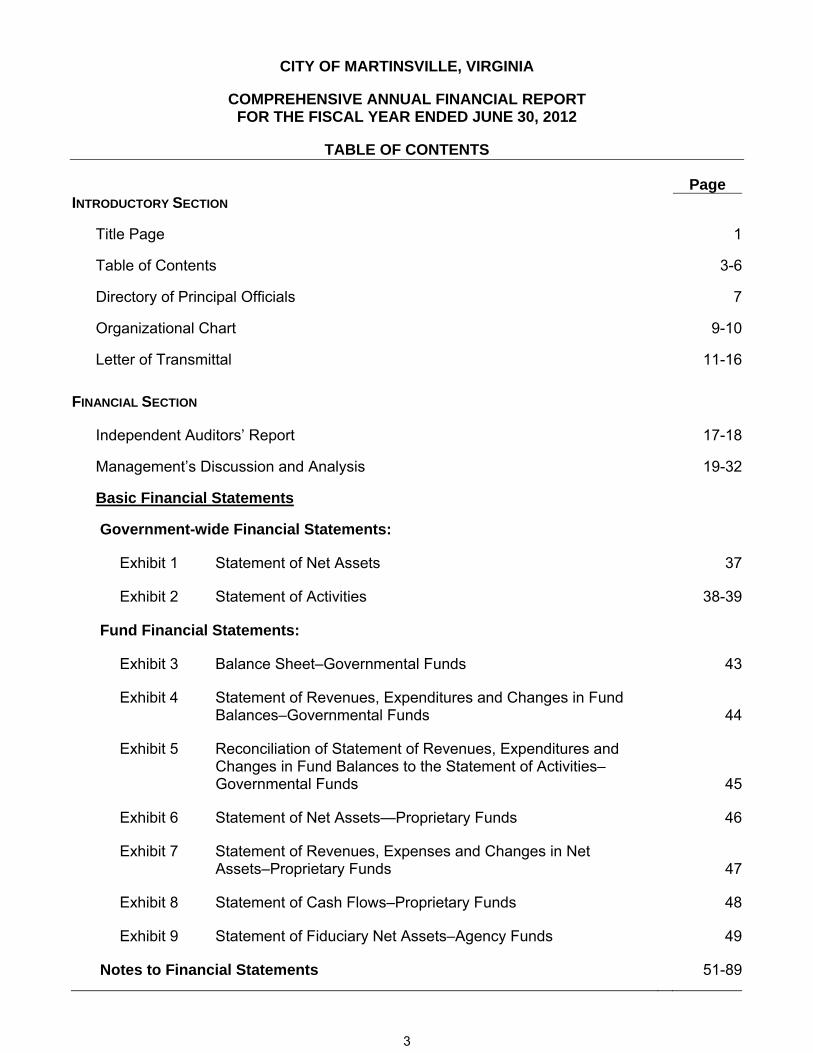
CITY OF MARTINSVILLE, VIRGINIA
COMPREHENSIVE ANNUAL FINANCIAL REPORT FOR THE FISCAL YEAR ENDED JUNE 30, 2012
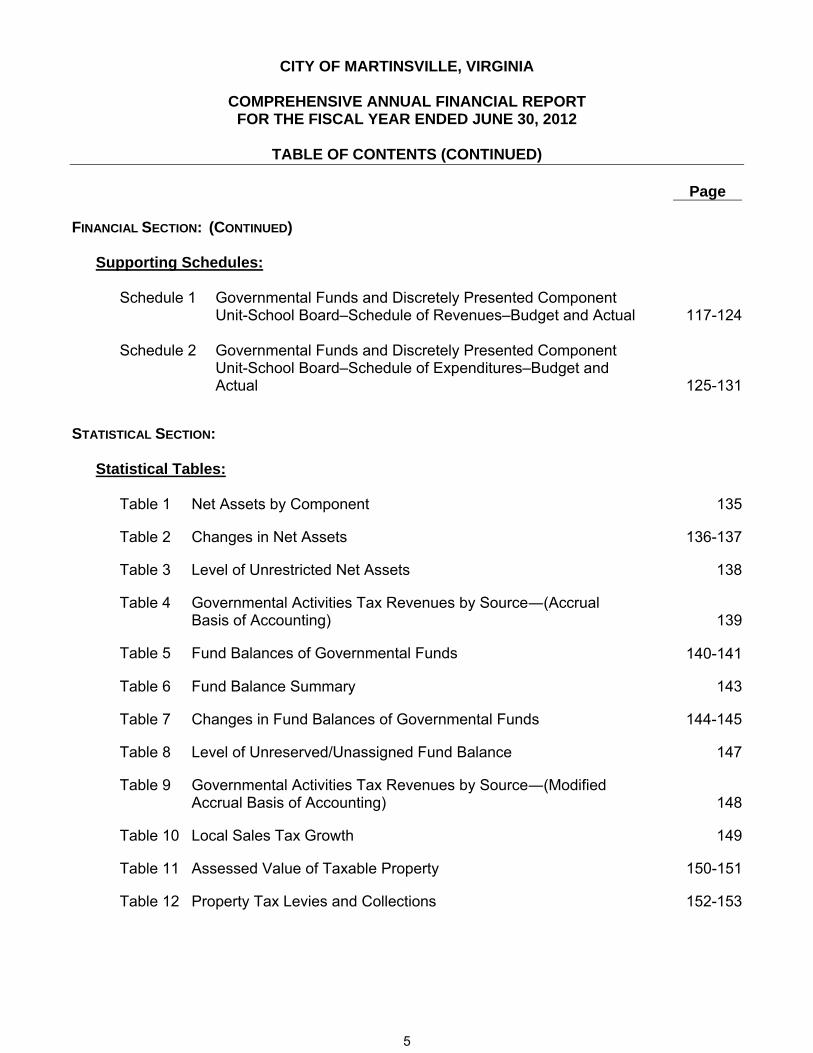
TABLE OF CONTENTS
Page INTRODUCTORY SECTION
Title Page 1
Table of Contents 3-6
Directory of Principal Officials 7
Organizational Chart 9-10
Letter of Transmittal 11-16
FINANCIAL SECTION
Independent Auditors’ Report 17-18
Management’s Discussion and Analysis 19-32
Basic Financial Statements
Government-wide Financial Statements: Exhibit 1 Statement of Net Assets 37 Exhibit 2 Statement of Activities 38-39 Fund Financial Statements: Exhibit 3 Balance Sheet–Governmental Funds 43 Exhibit 4 Statement of Revenues, Expenditures and Changes in Fund Balances–Governmental Funds
44
Exhibit 5 Reconciliation of Statement of Revenues, Expenditures and Changes in Fund Balances to the Statement of Activities– Governmental Funds
45 Exhibit 6 Statement of Net Assets—Proprietary Funds 46 Exhibit 7 Statement of Revenues, Expenses and Changes in Net Assets–Proprietary Funds
47
Exhibit 8 Statement of Cash Flows–Proprietary Funds 48 Exhibit 9 Statement of Fiduciary Net Assets–Agency Funds 49 Notes to Financial Statements 51-89
3
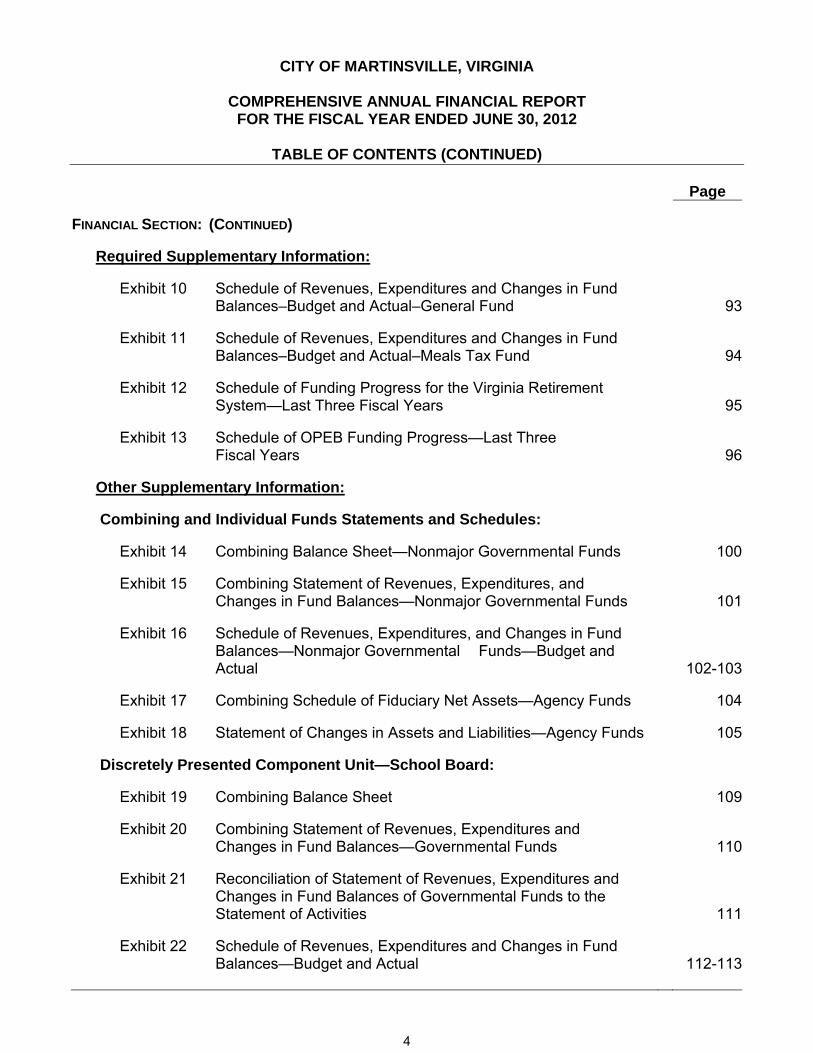
CITY OF MARTINSVILLE, VIRGINIA
COMPREHENSIVE ANNUAL FINANCIAL REPORT FOR THE FISCAL YEAR ENDED JUNE 30, 2012
TABLE OF CONTENTS (CONTINUED)
Page FINANCIAL SECTION: (CONTINUED) Required Supplementary Information: Exhibit 10 Schedule of Revenues, Expenditures and Changes in Fund Balances–Budget and Actual–General Fund
93
Exhibit 11 Schedule of Revenues, Expenditures and Changes in Fund Balances–Budget and Actual–Meals Tax Fund
94
Exhibit 12 Schedule of Funding Progress for the Virginia Retirement System—Last Three Fiscal Years
95
Exhibit 13 Schedule of OPEB Funding Progress—Last Three Fiscal Years
96
Other Supplementary Information: Combining and Individual Funds Statements and Schedules: Exhibit 14 Combining Balance Sheet—Nonmajor Governmental Funds 100 Exhibit 15 Combining Statement of Revenues, Expenditures, and Changes in Fund Balances—Nonmajor Governmental Funds
101
Exhibit 16 Schedule of Revenues, Expenditures, and Changes in Fund Balances—Nonmajor Governmental Funds—Budget and Actual
102-103 Exhibit 17 Combining Schedule of Fiduciary Net Assets—Agency Funds 104 Exhibit 18 Statement of Changes in Assets and Liabilities—Agency Funds 105 Discretely Presented Component Unit—School Board: Exhibit 19 Combining Balance Sheet 109 Exhibit 20 Combining Statement of Revenues, Expenditures and Changes in Fund Balances—Governmental Funds
110
Exhibit 21 Reconciliation of Statement of Revenues, Expenditures and Changes in Fund Balances of Governmental Funds to the Statement of Activities
111 Exhibit 22 Schedule of Revenues, Expenditures and Changes in Fund Balances—Budget and Actual
112-113
4
CITY OF MARTINSVILLE, VIRGINIA
COMPREHENSIVE ANNUAL FINANCIAL REPORT FOR THE FISCAL YEAR ENDED JUNE 30, 2012
TABLE OF CONTENTS (CONTINUED)
Page FINANCIAL SECTION: (CONTINUED) Supporting Schedules: Schedule 1 Governmental Funds and Discretely Presented Component Unit-School Board–Schedule of Revenues–Budget and Actual
117-124
Schedule 2 Governmental Funds and Discretely Presented Component Unit-School Board–Schedule of Expenditures–Budget and Actual
125-131 STATISTICAL SECTION: Statistical Tables: Table 1 Net Assets by Component 135 Table 2 Changes in Net Assets 136-137 Table 3 Level of Unrestricted Net Assets 138 Table 4 Governmental Activities Tax Revenues by Source―(Accrual Basis of Accounting)
139
Table 5 Fund Balances of Governmental Funds 140-141 Table 6 Fund Balance Summary 143 Table 7 Changes in Fund Balances of Governmental Funds 144-145 Table 8 Level of Unreserved/Unassigned Fund Balance 147 Table 9 Governmental Activities Tax Revenues by Source―(Modified Accrual Basis of Accounting)
148
Table 10 Local Sales Tax Growth 149 Table 11 Assessed Value of Taxable Property 150-151 Table 12 Property Tax Levies and Collections 152-153
5
CITY OF MARTINSVILLE, VIRGINIA
COMPREHENSIVE ANNUAL FINANCIAL REPORT FOR THE FISCAL YEAR ENDED JUNE 30, 2012
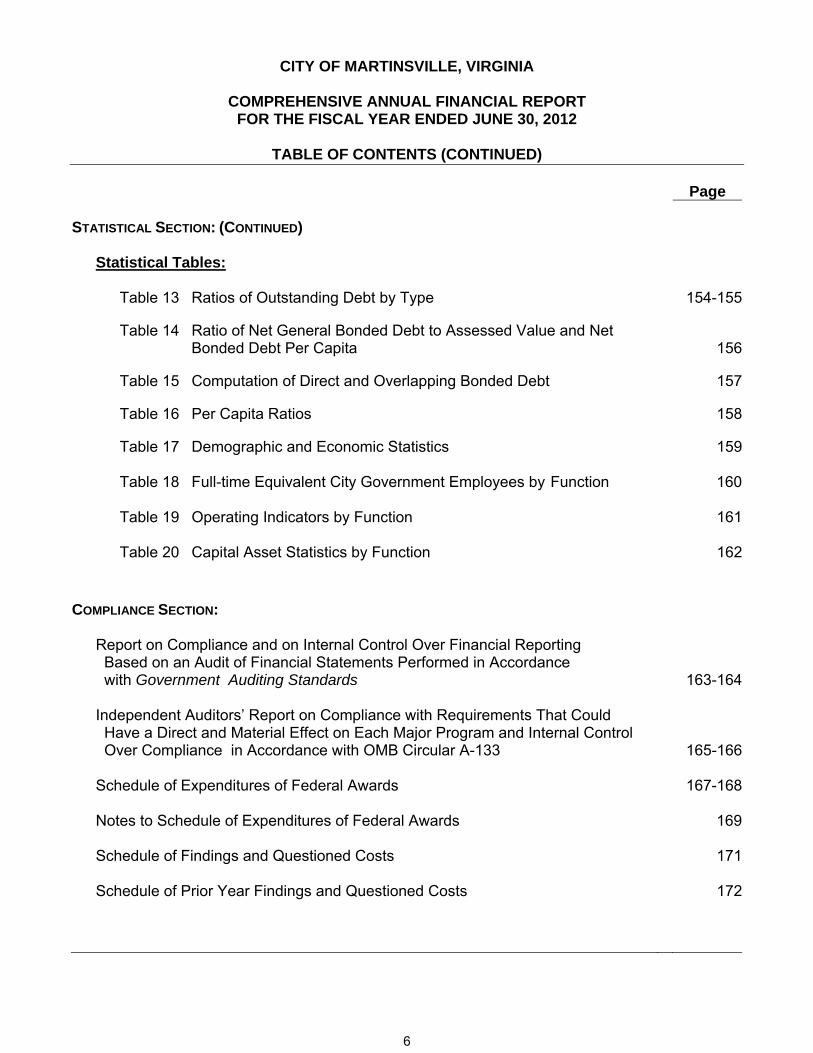
TABLE OF CONTENTS (CONTINUED)
Page STATISTICAL SECTION: (CONTINUED) Statistical Tables: Table 13 Ratios of Outstanding Debt by Type 154-155 Table 14 Ratio of Net General Bonded Debt to Assessed Value and Net Bonded Debt Per Capita
156
Table 15 Computation of Direct and Overlapping Bonded Debt 157 Table 16 Per Capita Ratios 158 Table 17 Demographic and Economic Statistics 159 Table 18 Full-time Equivalent City Government Employees by Function 160 Table 19 Operating Indicators by Function 161 Table 20 Capital Asset Statistics by Function 162
COMPLIANCE SECTION: Report on Compliance and on Internal Control Over Financial Reporting Based on an Audit of Financial Statements Performed in Accordance with Government Auditing Standards
163-164 Independent Auditors’ Report on Compliance with Requirements That Could Have a Direct and Material Effect on Each Major Program and Internal Control Over Compliance in Accordance with OMB Circular A-133
165-166 Schedule of Expenditures of Federal Awards 167-168 Notes to Schedule of Expenditures of Federal Awards 169 Schedule of Findings and Questioned Costs 171 Schedule of Prior Year Findings and Questioned Costs 172
6
CITY OF MARTINSVILLE, VIRGINIA
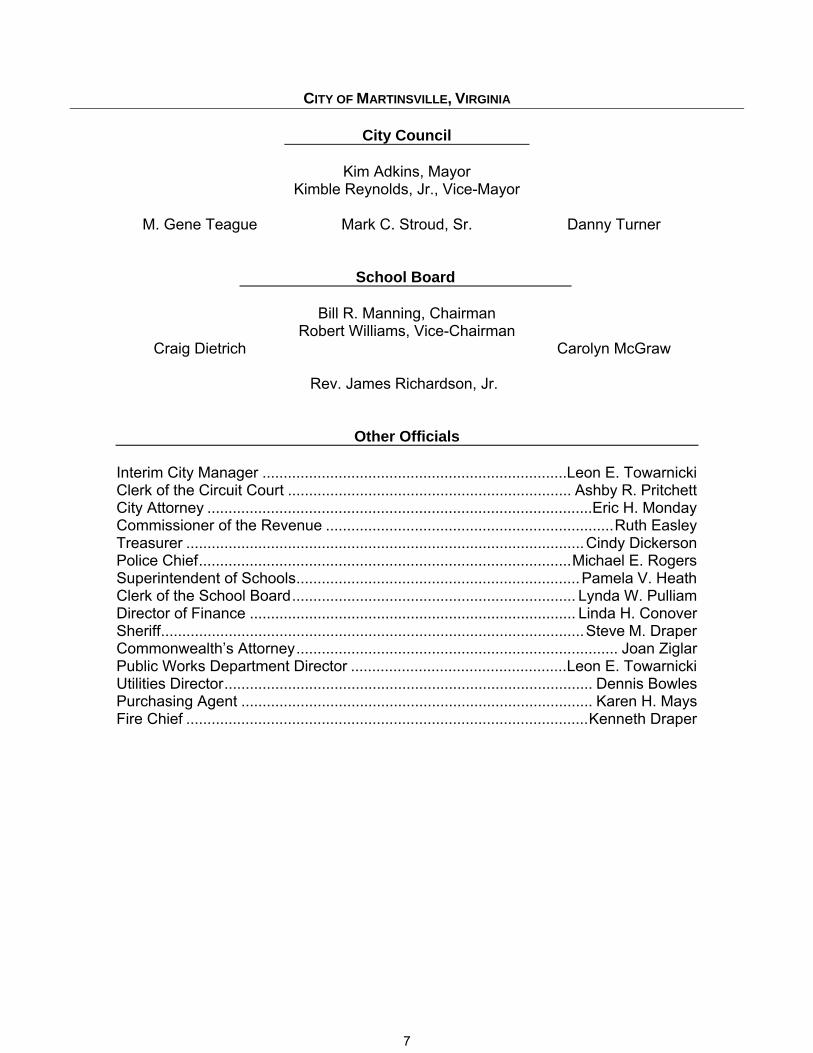
City Council
Kim Adkins, Mayor Kimble Reynolds, Jr., Vice-Mayor
M. Gene Teague Mark C. Stroud, Sr. Danny Turner
School Board
Bill R. Manning, Chairman
Robert Williams, Vice-Chairman Craig Dietrich Carolyn McGraw
Rev. James Richardson, Jr.
Other Officials
Interim City Manager ........................................................................ Leon E. TowarnickiClerk of the Circuit Court ................................................................... Ashby R. PritchettCity Attorney ........................................................................................... Eric H. MondayCommissioner of the Revenue .................................................................... Ruth EasleyTreasurer .............................................................................................. Cindy DickersonPolice Chief ........................................................................................ Michael E. RogersSuperintendent of Schools ................................................................... Pamela V. HeathClerk of the School Board ................................................................... Lynda W. PulliamDirector of Finance ............................................................................. Linda H. ConoverSheriff .................................................................................................... Steve M. DraperCommonwealth’s Attorney ............................................................................ Joan ZiglarPublic Works Department Director ................................................... Leon E. TowarnickiUtilities Director ....................................................................................... Dennis BowlesPurchasing Agent ................................................................................... Karen H. MaysFire Chief ............................................................................................... Kenneth Draper
7

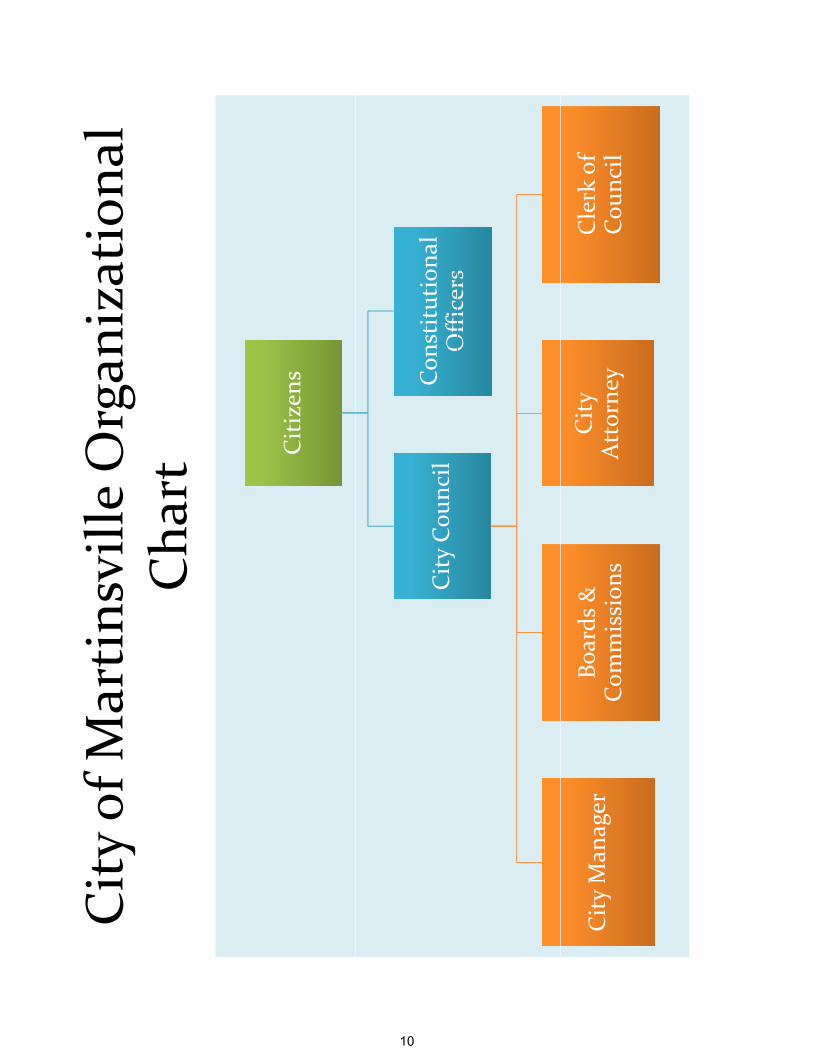
City of M
artins
ville O
rgan
izationa
l Cha
rty
g City Man
ager
City Man
ager
Ait
t Cit
Ait
t Cit
Di
t H
Di
t H
Director,
Director,
Executive
Assistant
Executive
Assistant
Assistant City
Man
ager
Assistant City
Man
ager
Director,
Inform
ation
Services
Director,
Inform
ation
Services
Director,
Public W
orks
Director,
Public W
orks
Director, Parks
and Re
creatio
nDirector, Parks
and Re
creatio
nDirector,
Utilities
Director,
Utilities
Polic
e Chief
Polic
e Chief
Director, H
uman
Resource
Director, H
uman
Resource
Director, Finan
ceDirector, Finan
ce
Purcha
sing
Purcha
sing
Fire Chief
Fire Chief
Emerge
ncy
Mgm
t and Safety
Emerge
ncy
Mgm
t and Safety
,Com
mun
ity
Develop
men
t
,Com
mun
ity
Develop
men
t
Hou
sing
Hou
sing
Senior Cen
ter
Senior Cen
ter
Electric
Electric
Inspectio
ns and
Cod
e
Enforcem
ent
Inspectio
ns and
Cod
e
Enforcem
ent
Plan
ning
Plan
ning
Mus
tang
s Ba
seba
llMus
tang
s Ba
seba
llUtility Billing
Utility Billing
Water Resou
rces
Water Resou
rces
Zoning
Zoning
9
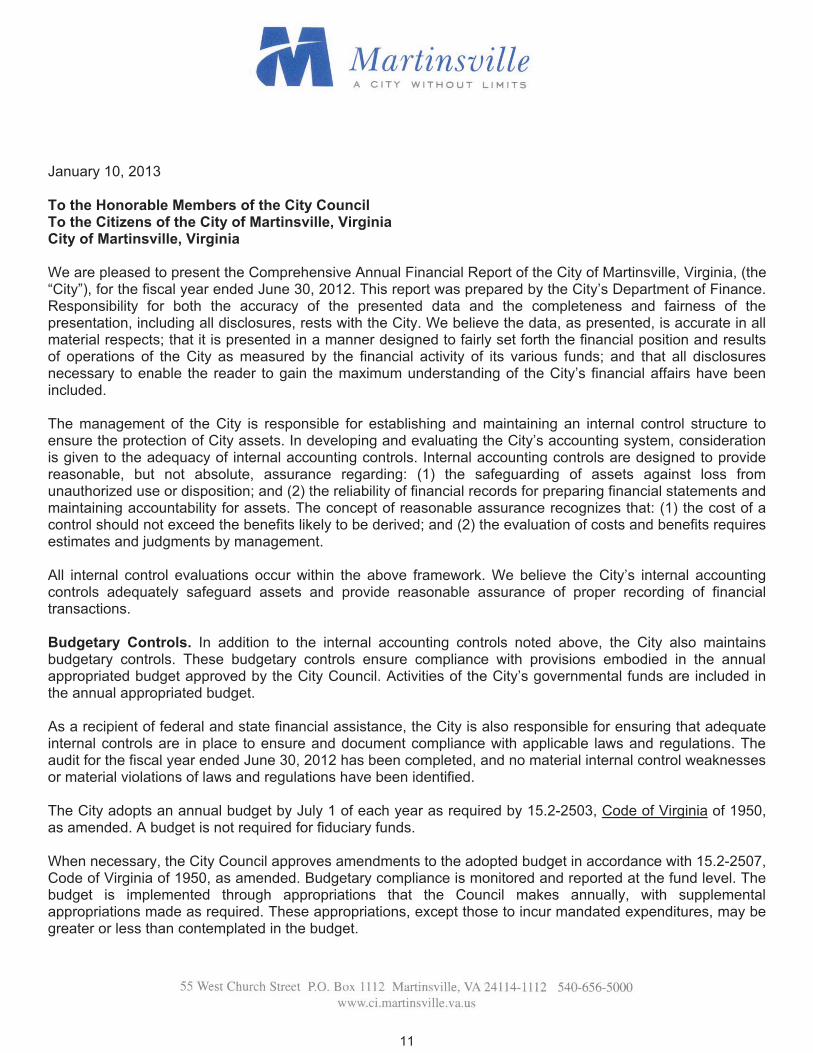
City of M
artins
ville O
rgan
izationa
l Ch
Cha
rt
Citizen
sCitizen
s
City Cou
ncil
City Cou
ncil
Con
stitutiona
l Officers
Con
stitutiona
l Officers
Officers
Officers
City Man
ager
City Man
ager
Boards &
Com
mission
sBo
ards &
Com
mission
sCity
Attorne
yCity
Attorne
yClerk of
Cou
ncil
Clerk of
Cou
ncil
10
January 10, 2013
To the Honorable Members of the City Council To the Citizens of the City of Martinsville, Virginia City of Martinsville, Virginia
We are pleased to present the Comprehensive Annual Financial Report of the City of Martinsville, Virginia, (the “City”), for the fiscal year ended June 30, 2012. This report was prepared by the City’s Department of Finance. Responsibility for both the accuracy of the presented data and the completeness and fairness of the presentation, including all disclosures, rests with the City. We believe the data, as presented, is accurate in all material respects; that it is presented in a manner designed to fairly set forth the financial position and results of operations of the City as measured by the financial activity of its various funds; and that all disclosures necessary to enable the reader to gain the maximum understanding of the City’s financial affairs have been included.
The management of the City is responsible for establishing and maintaining an internal control structure to ensure the protection of City assets. In developing and evaluating the City’s accounting system, consideration is given to the adequacy of internal accounting controls. Internal accounting controls are designed to provide reasonable, but not absolute, assurance regarding: (1) the safeguarding of assets against loss from unauthorized use or disposition; and (2) the reliability of financial records for preparing financial statements and maintaining accountability for assets. The concept of reasonable assurance recognizes that: (1) the cost of a control should not exceed the benefits likely to be derived; and (2) the evaluation of costs and benefits requires estimates and judgments by management.
All internal control evaluations occur within the above framework. We believe the City’s internal accounting controls adequately safeguard assets and provide reasonable assurance of proper recording of financial transactions.
Budgetary Controls. In addition to the internal accounting controls noted above, the City also maintains budgetary controls. These budgetary controls ensure compliance with provisions embodied in the annual appropriated budget approved by the City Council. Activities of the City’s governmental funds are included in the annual appropriated budget.
As a recipient of federal and state financial assistance, the City is also responsible for ensuring that adequate internal controls are in place to ensure and document compliance with applicable laws and regulations. The audit for the fiscal year ended June 30, 2012 has been completed, and no material internal control weaknesses or material violations of laws and regulations have been identified.
The City adopts an annual budget by July 1 of each year as required by 15.2-2503, Code of Virginia of 1950, as amended. A budget is not required for fiduciary funds.
When necessary, the City Council approves amendments to the adopted budget in accordance with 15.2-2507, Code of Virginia of 1950, as amended. Budgetary compliance is monitored and reported at the fund level. The budget is implemented through appropriations that the Council makes annually, with supplemental appropriations made as required. These appropriations, except those to incur mandated expenditures, may be greater or less than contemplated in the budget.
11
THE REPORTING ENTITY AND ITS SERVICES
The City of Martinsville’s report includes all funds of the “primary government.” In Virginia, cities and counties are distinct units of government; therefore, the City is responsible for providing all services normally provided by a local government. These services include public safety, social services, recreation and cultural activities, and community development. Additionally, the City operates an electric generation and distribution system, water and wastewater utility system and garbage collection services. For financial reporting purposes and in accordance with the Governmental Accounting Standards Board (GASB), Statement 14, “The Financial Reporting Entity,” the City has identified one discrete component unit. The GASB statement establishes the criteria used in making this determination and identifies each as a blended component unit or discretely presented component unit. Blended component units, although legally separate entities, are in substance, part of the primary government’s operations, and therefore are included as part of the primary government. Discretely presented component units are reported in a separate column in the combined financial statements to emphasize that they are legally separate from the primary government and to differentiate their financial position and results of operations from those of this primary government. Therefore, the City School Board is reported in a discrete presentation. Based on GASB Statement 14 criteria, the School Board is a legally separate organization providing educational services to the public whose board is appointed by City Council and is fiscally dependent on the local government.
The financial statements for the Blue Ridge Regional Library and the Henry-Martinsville Social Services Board are not included in the City report. Boards separate from, and independent of, the City Council administer these organizations.
LOCAL ECONOMY
Martinsville encompasses a land area of 11 square miles. The City is located in Southside Virginia, approximately midway between Roanoke, Virginia and Greensboro, North Carolina. Two U.S. primary highways (57 & 58) and one U.S Route (220) traverse the City. For decades the City’s economy was dominated by the textile and furniture manufacturing. The evolution of these businesses has moved a large portion of the manufacturing process overseas. This caused several local plants to close and others to downsize. The end result has been drastic elimination of textiles in the local economy and a significant reduction in the furniture industry. The remaining manufacturing companies located in the City appear to have weathered this trend.
Based on available economic data, the local economy’s growth is slow, at best. The unemployment rate for the City on June 30, 2012 was 14.3%. While this was a decrease of 15.9% from the previous year’s rate of 17%, the City’s unemployment rates still compares unfavorably to the state’s average unemployment rate of 5.7% and the national average of 8.2% for the same time.
The City has responded to the economic declines by implementing a proactive economic development program and streamlining expenditures. The City has confidence that the economic development program will improve the local economy, which is now just beginning to slowly produce results. Present economic development efforts focus on diversification of jobs, by actively recruiting a variety of industry and business partners.
12
MAJOR INITIATIVES
For Fiscal Year 2012: Following the goals and objectives established by the City of Martinsville Council, and with the assistance and guidance of the City Manager, City staff implemented and continued a number of specific “programs“ designed to provide City residents with cost efficient government while enhancing their community.
Major initiatives begun, continued, or completed during this fiscal year are:
o Shared Economic Development with Henry County o Revenue-sharing Agreements with Henry County o Phoenix CDC (Community Development Corporation) o Completion of ARRA (Stimulus Grant) Projects o Rails-to-Trails Program o Agreement with Henry County for a Regional Public Transit Service o Comprehensive Plan for Revitalization of the Uptown Area (Central Business District) o Commonwealth Crossing Business Center
Shared Economic Development. The City shares an economic development initiative with the County to combine and greatly expand the development efforts of our two communities. The Economic Development Corporation has a holistic approach to development. Instead of merely focusing on recruitment of new business, this office has resources and staff to work with existing businesses on retention and expansion, develop projects geared toward community revitalization, manage tourism programs, and foster small business development.
Revenue-sharing Agreement. The City and Henry County have entered into a revenue-sharing agreement for three separate industrial parks. Within the agreement, the City will receive one-third of the tax revenue generated after Henry County recovers its initial investment.
Phoenix CDC. The Phoenix Community Development Corporation engaged in efforts to implement parts of the City’s Comprehensive Master Plan assisting with Uptown revitalization and to manage property-related efforts as identified.
Completion of ARRA (Stimulus Grant) Projects - In FY10, the City received three ARRA/Stimulus grants for energy related projects – Landfill Methane/Electric project, Building Energy Retrofit project; and Turbine Rehab project at the City’s hydroelectric plant. The landfill project was completed and began operation in February, 2012, generating electricity and reducing the City’s need for purchased power. Likewise, the building energy retrofit project was completed in early FY13, reducing power consumption in City buildings and facilities. The hydroelectric project is nearing completion with an expected increase in generation efficiency in the range of 6%.
Rails-to-Trails Program. The 4.5 mile Dick & Willie Rail Trail project continues to be a popular attraction, widely used by many community residents. The D & W Trail connects to a 6/10 of a mile spur-trail running into the City’s central business district and a newly renovated Depot Street Parking Lot and Comfort Station. In FY12, the City partnered with private entities to add another half-mile extension – The Silverbell Spur Trail - connecting the City’s Spur Trail and the D & W Trail to the intersection of East Church Street and Church Street Extension, providing convenient access to the Virginia Museum of Natural History, the YMCA, and the City’s Frank Wilson Park. The trail system adds to the quality of life in the region and attracts walkers, joggers, and bicyclists. There are also plans for future expansion connecting locally to the Smith River Sports Complex and the Fieldale Trail, and connecting regionally to the Beaches to Blue Grass Trail, which runs from Kentucky to the Eastern Shore of Virginia.
13
Regional Transit Service – the City and County jointly launched a regional bus system that started in January 2009. This two-bus system operates from 8:00 AM – 5:30 PM, Monday through Friday. Riders pay a 50 cent fare per ride and can access the bus at stops throughout the main travel routes of the City and can even go into various parts of the County. Stops are mostly through the business district, local hospital, retail sector, and at many community organizations. Both buses were paid with funds from the CTB, and both localities pay a small portion of operational expenses. Usage of the transit service continues to increase - ridership in FY12 was up approximately 30% from FY11 - more than 22,000 rides were counted in FY12.
Uptown Revitalization Project. In 2005, The Harvest Foundation of the Piedmont announced a plan to revitalize the area which included a $6M state-of-the art Soccer Complex in Henry County and a $14M Sports Arena/Multi-Purpose Facility in the Uptown Business District. The project moved forward with the Soccer Complex being completed in FY09 with a price tag of over $8M. The final product not only involves soccer, but additionally focuses on an outdoor venue for multiple sports and water related activities. In order to determine the best fit for Uptown and to achieve the end results desired, the Sports Arena facility concept was slowed, pending a comprehensive community review process that started in February 2009. After many stakeholder meetings, visits to other successful business districts, and expertise from facilitators, engineers, and consultants, the following has occurred:
A) Renewed commitment from The Harvest Foundation to honor the original pledge so that the Uptown area is truly revitalized, in a sustainable manner that adds value to the region as a whole.
B) Another grant from The Harvest Foundation to unify the community and facilitate an inclusive planning process. The end question being, “What will add the most value to transform the Uptown area into a sustainable, thriving economic engine?”
C) More buy-in and collaboration from the community, Planning Commission, City Council, and Department of Housing and Community Development.
D) The Comprehensive Master Plan for the Uptown area was completed February 2010. Economic restructuring strategies for the Uptown Revitalization Project include: o business, retail, and education o visual and performing arts o recreation o cultural heritage o housing and uptown living
E) The formation of Phoenix CDC (Community Development Corporation) to implement parts of the Master Plan and to manage property related efforts as identified.
F) Grant of $654,957 for improvements to the City’s Spur Trailhead, preplanning for enhancements to the Historic Courthouse’s North Lawn, Uptown Gateway entrances, and way finding signs. Many of these programmed improvements were either completed or saw substantial progress in FY12.
Commonwealth Crossing Business Centre – In FY12 efforts continued to move the Commonwealth Crossing Business Centre project forward. Permitting issues with Army Corps of Engineers have yet to be resolved which has delayed the start of site grading. The site has tremendous potential as a “mega-site” with rail access and close proximity to the Greensboro, High Point, Winston-Salem area, and continues to attract interest through marketing efforts by the EDC. The site is a revenue sharing lot and has the potential for significant economic impact to the community.
Prospects for the Future. In the fall of 2012, New College Institute broke ground on an approximate $15 million building project on the Baldwin Block located in uptown Martinsville. The building will house an advanced manufacturing lab, various New College and Economic Development Corporation offices, and a “great hall” that will provide state-of-the-art meeting space not currently available in our community. The project is expected to fuel continued growth of NCI, bolstered by a renewed collaborative effort with Patrick Henry Community College. Also during 2012, an announcement was made regarding plans for development of a new medical school – The Integrative Centers for Science and Medicine – College of Henricopolis School of Medicine. Dr. Noel Boaz is spear-heading the effort with initial plans to use an existing building located at the corner of Moss and Fayette Streets, with eventual plans to expand to other sites.
14
Plans are also being aggressively pursued to redevelop the Henry Hotel located in uptown Martinsville to accommodate a combination of commercial and residential usages. Other projects include completion of relocation of Depot Street and redevelopment of the Depot Street parking lot; installation of new way-finding signs directing traffic to various City features, gateway and landscaping improvements at several key intersections leading into the uptown area, opening of the Silverbell Spur trail – a new section of walking trail connecting to the City’s spur trail and the Dick & Willie trail, continuation of improvements to the historic courthouse in uptown Martinsville, and façade and other improvements through a Community Development Block Grant. New Revenue Opportunities. With direction from City Council, staff continues to explore opportunities for revenue growth and one project that continues to show promise is the landfill methane/electric project. In FY10, the City developed a two-phased project. Phase 1, collection and flaring (burning) of methane and generation of carbon credits, with an $800,000 price tag was completed in May, 2010, and Phase 2, electric generation using collected methane gas coupled with the same benefits of Phase 1, was completed in February, 2012 at a cost of $1.7 million. Depending on power costs, Phase 2 could reduce purchased power costs by several hundred thousand dollars per year. The City received a $1 million stimulus package grant to reduce capital project costs associated with Phase 2. Staff and its consultant continues to fine-tune the system to optimize power production while minimizing costs. Options regarding possible sale of carbon credits continue to be evaluated as well. Another project being investigated is expansion/growth of the City’s fiber optic system. Various options are currently being explored particularly with service to business/industrial clients that could prove significant in retaining current businesses, attracting new business opportunities, and potentially generating a revenue stream that not only supports the system, but also supports other City needs. OTHER INFORMATION Management’s Discussion and Analysis. Generally accepted accounting principles (GAAP) require management provide a narrative introduction, overview, and analysis to accompany the basic financial statements in the form of Management’s Discussion and Analysis (MD&A). This letter of transmittal is designed to complement the MD&A and should be read in conjunction with it. The City of Martinsville’s MD&A can be found immediately following the report of the independent auditors. Independent Audit. The Commonwealth of Virginia requires an annual audit of the financial records and transactions of all departments of the City by independent certified public accountants selected by the City Council. The City is required to undergo an annual single audit in conformity with the provisions of the Single Audit Act Amendments of 1996 and U.S. Office of Management and Budget Circular A-133, Audits of States, Local Government and Non-Profit Organizations. Information related to this single audit, including the findings and recommendations, and auditors’ reports on the internal control structure and compliance with laws and regulations, is contained in this report. These requirements have been complied with and the auditor’s opinion is included in this report. Awards. The Certificate of Achievement is a prestigious national award recognizing conformance with the highest standards for preparation of state and local government financial reports. In order to be awarded a Certificate of Achievement, a government unit must publish an easily readable and efficiently organized Comprehensive Annual Financial Report (CAFR), whose contents conform to program standards. Such CAFR must satisfy both generally accepted accounting principles and applicable legal requirements.
15
A Certificate of Achievement is valid for a period of one (1) year only. We believe our current report continues to conform to the Certificate of Achievement program requirements, and we are submitting it to GFOA for consideration. Acknowledgments. The preparation of this report on a timely basis could not have been accomplished without the dedicated services of the entire Department of Finance. We would also like to thank the City Council for their interest and support in planning and conducting the financial operation of the City in a responsible and progressive manner. We would also like to thank the employees of the Treasurer’s Office, Commissioner of the Revenue, Clerk’s Office and numerous other offices for their assistance in preparing this report. Respectfully submitted, Interim City Manager Director of Finance
16
ROBINSON, FARMER, COX ASSOCIATES
CERTIFIED PUBLIC ACCOUNTANTS A PROFESSIONAL LIMITED LIABILITY COMPANY
Independent Auditors’ Report To The Honorable Members of City Council City of Martinsville Martinsville, Virginia We have audited the accompanying financial statements of the governmental activities, the business-type activities, the discretely presented component unit, each major fund, and the aggregate remaining fund information of the City of Martinsville, Virginia, as of and for the year ended June 30, 2012, which collectively comprise the City’s basic financial statements, as listed in the table of contents. These financial statements are the responsibility of the City of Martinsville, Virginia’s management. Our responsibility is to express opinions on these financial statements based on our audit. We conducted our audit in accordance with auditing standards generally accepted in the United States of America; the Specifications for Audits of Counties, Cities and Towns, issued by the Auditor of Public Accounts of the Commonwealth of Virginia; and the standards applicable to financial audits contained in Government Auditing Standards, issued by the Comptroller General of the United States. Those standards require that we plan and perform the audit to obtain reasonable assurance about whether the financial statements are free of material misstatement. An audit includes examining, on a test basis, evidence supporting the amounts and disclosures in the financial statements. An audit also includes assessing the accounting principles used and significant estimates made by management, as well as evaluating the overall financial statement presentation. We believe that our audit provides a reasonable basis for our opinions. In our opinion, the financial statements referred to above present fairly, in all material respects, the respective financial position of the governmental activities, the business-type activities, the discretely presented component unit, the major fund, and the aggregate remaining fund information of the City of Martinsville, Virginia, as of June 30, 2012, and the respective changes in financial position and cash flows, where applicable, thereof for the year then ended in conformity with accounting principles generally accepted in the United States of America. In accordance with Government Auditing Standards, we have also issued our report dated December 12, 2012, on our consideration of the City of Martinsville, Virginia’s internal control over financial reporting and on our tests of its compliance with certain provisions of laws, regulations, contracts, and grant agreements and other matters. The purpose of that report is to describe the scope of our testing of internal control over financial reporting and compliance and the results of that testing, and not to provide an opinion on the internal control over financial reporting or on compliance. That report is an integral part of an audit performed in accordance with Government Auditing Standards and should be considered in assessing the results of our audit.
17
Accounting principles generally accepted in the United States of America require that the management’s discussion and analysis, budgetary comparison information, and schedules of pension and OPEB funding progress be presented to supplement the basic financial statements. Such information, although not a part of the basic financial statements, is required by the Governmental Accounting Standards Board, who considers it to be an essential part of financial reporting for placing the basic financial statements in an appropriate operational, economic, or historical context. We have applied certain limited procedures to the management’s discussion and analysis and schedule of pension funding progress in accordance with auditing standards generally accepted in the United States of America, which consisted of inquiries of management about the methods of preparing the information and comparing the information for consistency with management’s responses to our inquiries, the basic financial statements, and other knowledge we obtained during our audit of the basic financial statements. We do not express an opinion or provide any assurance on the management’s discussion and analysis and schedule of pension funding progress because the limited procedures do not provide us with sufficient evidence to express an opinion or provide any assurance. The budgetary comparison information has been subjected to the auditing procedures applied in the audit of the basic financial statements and, in our opinion, is fairly stated in all material respects in relation to the basic financial statements taken as a whole. Our audit was conducted for the purpose of forming opinions on the financial statements that collectively comprise the City of Martinsville, Virginia’s financial statements as a whole. The introductory section, other supplementary information, and statistical section, are presented for purposes of additional analysis and are not a required part of the financial statements. The accompanying schedule of expenditures of federal awards is presented for purposes of additional analysis as required by U.S. Office of Management and Budget Circular A-133, Audits of States, Local Governments, and Non-Profit Organizations, and is also not a required part of the financial statements. The other supplementary information and the schedule of expenditures of federal awards are the responsibility of management and were derived from and relate directly to the underlying accounting and other records used to prepare the financial statements. The information has been subjected to the auditing procedures applied in the audit of the financial statements and certain additional procedures, including comparing and reconciling such information directly to the underlying accounting and other records used to prepare the financial statements or to the financial statements themselves, and other additional procedures in accordance with auditing standards generally accepted in the United States of America. In our opinion, the information is fairly stated in all material respects in relation to the financial statements as a whole. The introductory and statistical sections have not been subjected to the auditing procedures applied in the audit of the basic financial statements and, accordingly, we do not express an opinion or provide any assurance on them. Charlottesville, Virginia December 12, 2012
18
Management's Discussion and Analysis
To the Honorable Members of the City Council To the Citizens of the City of Martinsville The management of the City of Martinsville, Virginia, presents this narrative overview and analysis of the financial activities for the fiscal year ended June 30, 2012. We encourage you to read this discussion and analysis in conjunction with the accompanying management letter on internal controls, the basic financial statements and the notes to the financial statements. Financial Highlights Government-wide Financial Statements The assets of the City exceeded its liabilities at the close of the most recent fiscal year by
$41,142,852 (total net assets). Of this amount $18,892,244 (unrestricted net assets) may be used to meet the City’s ongoing obligations to citizens and creditors.
The Governmental activities net assets were $16,072,847 of the City’s total, an increase of
$5,267,972 or 48.7% in comparison with net assets of $10,804,875 at June 30, 2011.
Net assets of the City’s various business type activities totaled $25,070,005. This is an increase of $3,050,333 or 13.8% compared with net assets of $22,019,672 reported on June 30, 2011.
The School Board’s assets exceeded its liabilities by $8,360,658, a decrease of $1,999,432 when
compared to the amount on June 30, 2011. However, $7,605,347 of this amount reflects the School Board’s net investment in capital assets leaving $755,311 in unrestricted assets available to meet ongoing obligations. This is a decrease of $2,096,336 or 73.5% in the School Board’s unrestricted assets for the fiscal year.
Fund Financial Statements The Governmental Funds, on a current financial resource basis, reported revenues and other financing sources in excess of expenditures and other financing uses by $13,929,127 (Exhibit 4) after making direct contributions totaling $3,076,122 to the School Board. An additional $1,314,821 was expended from the Meals Tax Fund used to retire School related debt. A total of $4,390,943 was expended on School activities from Governmental Funds. At the close of the current fiscal year, the City’s Governmental funds reported ending fund
balances of $17,830,792, which is an increase of $13,929,127 in comparison with the prior fiscal year.
At the close of the current fiscal year, the unassigned fund balance for the general fund was
$4,734,167 or 18.6% of total general fund expenditures. The combined long-term Governmental obligations increased $9,374,378 or 87.4% during the
current fiscal year.
19
Overview of the Financial Statements The discussion and analysis are intended to serve as an introduction to the City’s basic financial statements. These financial statements are comprised of three (3) components: 1. Government-wide financial statements. 2. Fund financial statements. 3. Notes to the financial statements. This report also contains other information to supplement the basic financial statements. Government-wide financial statements - The Government-wide financial statements are designed to provide readers with a broad overview of the City’s finances in a manner similar to a private-sector business. Government-wide financial reporting consists of two statements: (1) The Statement of Net Assets and (2) The Statement of Activities. The Statement of Net Assets (exhibit one) presents information on all of the City’s assets and liabilities. The difference between assets and liabilities is reported as net assets. Net assets are presented in three categories: invested in capital assets net of related debt, restricted and unrestricted. Over time, increases or decreases in net assets may serve as a useful indicator of whether the financial position of the City is improving or deteriorating. The Statement of Activities (exhibit two) presents information showing how the City’s net assets changed during the fiscal year. All changes in net assets are reported as soon as the underlying event giving rise to the change occurs, regardless of the timing of related cash flows. Thus, revenues and expenses are reported in this statement for some items which result in cash flows in future fiscal periods (e.g., uncollected taxes and earned but unused vacation leave). The Statement of Net Assets and The Statement of Activities are both divided into three types of activities: 1. Governmental Activities – Most of the City’s basic services are reported in this column to include:
Police, Fire, Courts, Recreation, Social Services, Economic Development, Community Development, Capital Projects, and General Administration. Governmental Activities are supported primarily by taxes, state and federal grants, and transfers from the City’s Enterprise funds (Electric, Water, Sewer, and Refuse).
2. Business-Type Activities – The City has four business-type activities: Electric, Water, Sewer, and
Refuse. The City recovers all or a significant portion of the costs associated with providing these services through user fees and charges to the customers receiving these services.
3. Component Unit – The City has one component unit, the Martinsville Public Schools. While the
School System is a legally separate entity, the City of Martinsville is financially accountable for the School System. Financial information for the component unit is reported separately from the financial information presented for the primary government.
20
Overview of the Financial Statements: (Continued) Fund financial statements - A fund is a grouping of related accounts that is used to maintain control over resources that have been segregated for specific activities or objectives. The City, like other local governments, uses fund accounting to ensure and demonstrate compliance with finance-related legal requirements. All of these funds can be placed in either of three (3) categories: governmental funds, proprietary funds, and fiduciary funds. Governmental funds – A governmental fund is used to account for essentially the same functions or services reported as governmental activities in the government-wide financial statements. However, government-wide financial statements are prepared on the accrual basis of accounting while governmental fund financial statements are prepared on the modified accrual basis of accounting. Thus, governmental fund financial statements focus on near-term inflows and outflows of financial resources and the balance of financial resources available at the end of the fiscal year. Such information is useful in evaluating the City’s ability to satisfy near-term financing requirements. Since the focus of governmental funds is narrower than that of government-wide financial statements, a reconciliation between the two methods used is provided at the bottom of the governmental fund balance sheet (exhibit 3) and the governmental fund statement of revenues, expenditures and changes in fund balances (exhibit 5). By comparing the information presented for governmental funds with similar information presented for governmental activities in the government-wide financial statements readers may better understand the long-term impact of the City’s near-term financing decisions. The City has one major governmental fund - the General Fund. The City has four funds considered Non-major funds. These are the Community Development Block Grant Fund (CDBG), the Housing Choice Fund, the Capital Reserve Fund, and the Meals Tax Fund. For reporting purposes, the CDBG Fund is called the City Grants Fund. The City Grants Fund is then combined with the Housing Choice Fund to create the Special Revenue Funds. The Capital Reserve Fund and the Meals Tax Fund are combined to form the Capital Projects Funds. Together the Special Revenue Funds and the Capital Projects Funds comprise the City’s Non-major Governmental Funds. Information on these funds are contained in Exhibits twelve and thirteen. This data is then combined in a single column for the governmental fund balance sheet (exhibit 3) and the governmental fund statement of revenues, expenditures, changes in fund balances (exhibit 4). Proprietary funds – Proprietary funds consist of enterprise funds which are established to account for the delivery of goods and services to the public. These funds use the accrual basis of accounting, similar to private businesses. Enterprise funds are used to report the same functions as the business-type activities in the government-wide financial statements. Electric, Water, Sewer and Refuse/Landfill funds are presented on the statements individually as major funds (exhibits 6-8). Enterprise funds are used to account for operations that are financed and operated in a manner similar to private business. The intent of the governing body is to finance these services primarily through user charges and fees. Notes to the financial statements - Notes provide additional information that is essential to a full understanding of the data provided in the government-wide and fund financial statements. Other information - In addition to the basic financial statement and accompanying notes, this report presents certain required information supplements including budgetary comparison schedules and presentation of combining financial statements for the discretely presented component unit School Board. The School Board does not issue separate financial statements.
21
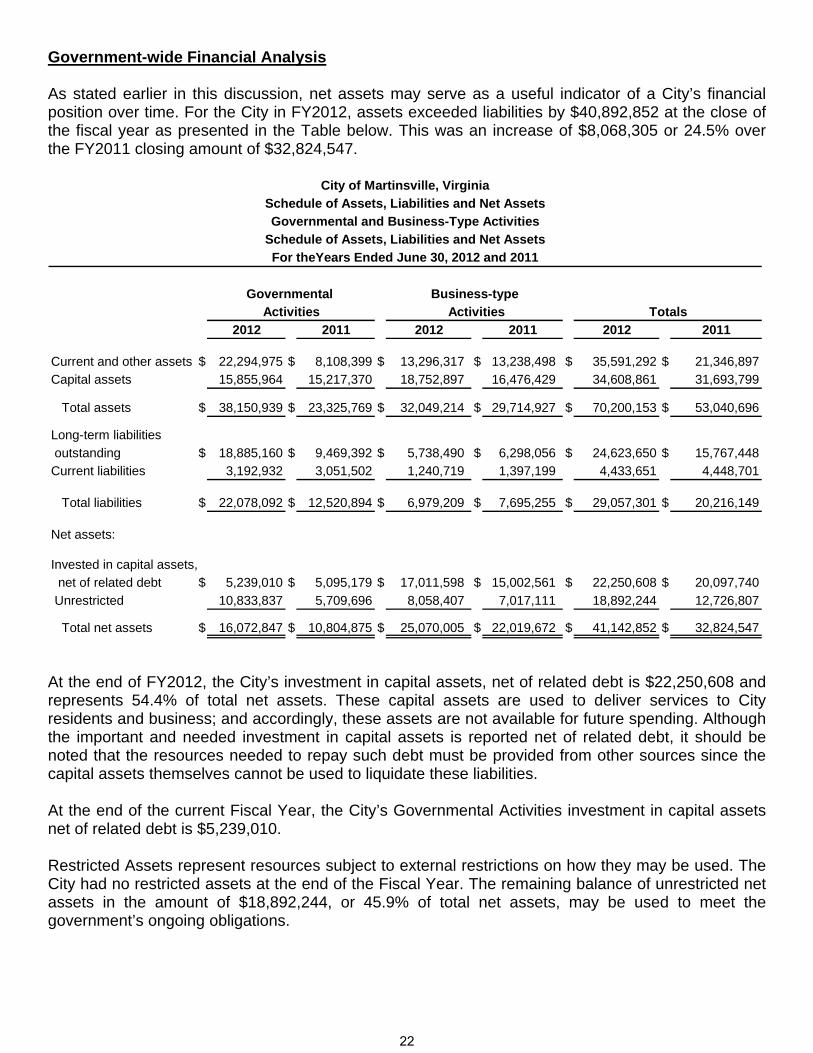
Government-wide Financial Analysis As stated earlier in this discussion, net assets may serve as a useful indicator of a City’s financial position over time. For the City in FY2012, assets exceeded liabilities by $40,892,852 at the close of the fiscal year as presented in the Table below. This was an increase of $8,068,305 or 24.5% over the FY2011 closing amount of $32,824,547.
Governmental Business-type
Activities Activities Totals
2012 2011 2012 2011 2012 2011
Current and other assets $ 22,294,975 $ 8,108,399 $ 13,296,317 $ 13,238,498 $ 35,591,292 $ 21,346,897
Capital assets 15,855,964 15,217,370 18,752,897 16,476,429 34,608,861 31,693,799
Total assets $ 38,150,939 $ 23,325,769 $ 32,049,214 $ 29,714,927 $ 70,200,153 $ 53,040,696
Long-term liabilities
outstanding $ 18,885,160 $ 9,469,392 $ 5,738,490 $ 6,298,056 $ 24,623,650 $ 15,767,448
Current liabilities 3,192,932 3,051,502 1,240,719 1,397,199 4,433,651 4,448,701
Total liabilities $ 22,078,092 $ 12,520,894 $ 6,979,209 $ 7,695,255 $ 29,057,301 $ 20,216,149
Net assets:
Invested in capital assets,
net of related debt $ 5,239,010 $ 5,095,179 $ 17,011,598 $ 15,002,561 $ 22,250,608 $ 20,097,740
Unrestricted 10,833,837 5,709,696 8,058,407 7,017,111 18,892,244 12,726,807
Total net assets $ 16,072,847 $ 10,804,875 $ 25,070,005 $ 22,019,672 $ 41,142,852 $ 32,824,547
City of Martinsville, Virginia
Schedule of Assets, Liabilities and Net Assets
Governmental and Business-Type Activities
For theYears Ended June 30, 2012 and 2011
Schedule of Assets, Liabilities and Net Assets
At the end of FY2012, the City’s investment in capital assets, net of related debt is $22,250,608 and represents 54.4% of total net assets. These capital assets are used to deliver services to City residents and business; and accordingly, these assets are not available for future spending. Although the important and needed investment in capital assets is reported net of related debt, it should be noted that the resources needed to repay such debt must be provided from other sources since the capital assets themselves cannot be used to liquidate these liabilities. At the end of the current Fiscal Year, the City’s Governmental Activities investment in capital assets net of related debt is $5,239,010. Restricted Assets represent resources subject to external restrictions on how they may be used. The City had no restricted assets at the end of the Fiscal Year. The remaining balance of unrestricted net assets in the amount of $18,892,244, or 45.9% of total net assets, may be used to meet the government’s ongoing obligations.
22

Government-wide Financial Analysis (Continued) Governmental Activities - Governmental activities increased Martinsville City’s net assets by $5,267,972. The key elements of this increase are found in exhibit 5. Among the primary reasons for this increase is that the fund balances increased by $13,929,127 less the $9,342,158 by which issuances of debt exceeded retirement of debt.
Changes in Net AssetsGovernmental and Business-Type Activities
Governmental Activities Business-type Activities Totals2012 2011 2012 2011 2012 2011
Revenues:Program revenues:Charges for services $ 1,167,737 $ 1,066,107 $ 25,828,934 $ 25,903,593 $ 26,996,671 $ 26,969,700 Operating grants and contributions 9,966,207 9,743,507 - - 9,966,207 9,743,507 Capital grants andcontributions - - 1,878,298 - 1,878,298 - General revenues:General property taxes 8,667,298 8,878,758 - - 8,667,298 8,878,758 Other local taxes 6,621,038 6,794,798 - - 6,621,038 6,794,798 Commonwealth non- categorial aid 1,631,430 1,657,430 - - 1,631,430 1,657,430 Other general revenues 1,236,088 1,529,039 30,599 38,698 1,266,687 1,567,737
Total revenues $ 29,289,798 $ 29,669,639 $ 27,737,831 $ 25,942,291 $ 57,027,629 $ 55,611,930
Expenses:General government administration $ 3,637,285 $ 3,814,802 $ - $ - $ 3,637,285 $ 3,814,802 Judicial administration 1,918,028 1,878,258 - - 1,918,028 1,878,258 Public safety 9,228,325 8,997,810 - - 9,228,325 8,997,810 Public works 4,011,222 4,178,766 - - 4,011,222 4,178,766 Health and welfare 563,668 606,262 - - 563,668 606,262 Education 3,525,833 6,400,860 - - 3,525,833 6,400,860 Parks, recreation, and cultural 1,254,795 1,340,515 - - 1,254,795 1,340,515 Community development 3,498,547 4,117,538 - - 3,498,547 4,117,538 Interest on long-term debt 395,761 348,232 - - 395,761 348,232 Electric - - 14,987,140 17,175,908 14,987,140 17,175,908 Water - - 1,713,386 1,694,197 1,713,386 1,694,197 Sewer - - 2,712,919 2,652,619 2,712,919 2,652,619 Refuse collection/landfill - - 1,262,415 1,095,958 1,262,415 1,095,958
Total expenses $ 28,033,464 $ 31,683,043 $ 20,675,860 $ 22,618,682 $ 48,709,324 $ 54,301,725
Increase in net assetsbefore transfers $ 1,256,334 $ (2,013,404) $ 7,061,971 $ 3,323,609 $ 8,318,305 $ 1,310,205
Transfers 4,011,638 2,736,292 (4,011,638) $ (2,736,292) - -
Increase in net assets $ 5,267,972 $ 722,888 $ 3,050,333 $ 587,317 $ 8,318,305 $ 1,310,205
Net assets-beginning 10,804,875 10,081,987 22,019,672 21,432,355 32,824,547 31,514,342
Net assets - ending $ 16,072,847 $ 10,804,875 $ 25,070,005 $ 22,019,672 $ 41,142,852 $ 32,824,547
For the Years Ended June 30, 2012 and 2011
City of Martinsville, Virginia
23

Government-wide Financial Analysis: (Continued) Revenues from governmental activities totaled $33,301,436 with operating grants and contributions (29.9%), general property taxes (26%), and other local taxes (19.9%) comprising 75.8% of the City’s revenues. Expenses for public safety (32.9%), education (12.6%), public works (14.3%), community development (12.5%), and general government administration (13%), account for 85.3% of total governmental expenses of $28,033,464. The chart below compares the revenues and expenses by program for governmental activities. In every category expenses outpace the revenues generated. This is common throughout the Commonwealth because most of the programs are not able to generate revenue. For those programs that can generate revenue (Recreation, Building Inspections etc.) the City has traditionally followed a policy of maintaining associated charges at a minimal level and funding the expenses from other revenue sources.
Expenses Revenues
General government administration 3,637,285$ 609,574$
Judicial administration 1,918,028 929,478
Public safety 9,228,325 3,882,142
Public works 4,011,222 3,298,179
Health and welfare 563,668 51,227
Education 3,525,833 -
Parks, recreation, and cultural 1,254,795 183,516
Community development 3,498,547 2,179,828
Interest on long-term debt 395,761 -
0
1,000,000
2,000,000
3,000,000
4,000,000
5,000,000
6,000,000
7,000,000
8,000,000
9,000,000
10,000,000
Expenses and Revenues - Governmental Activities
Expenses
Revenues
24
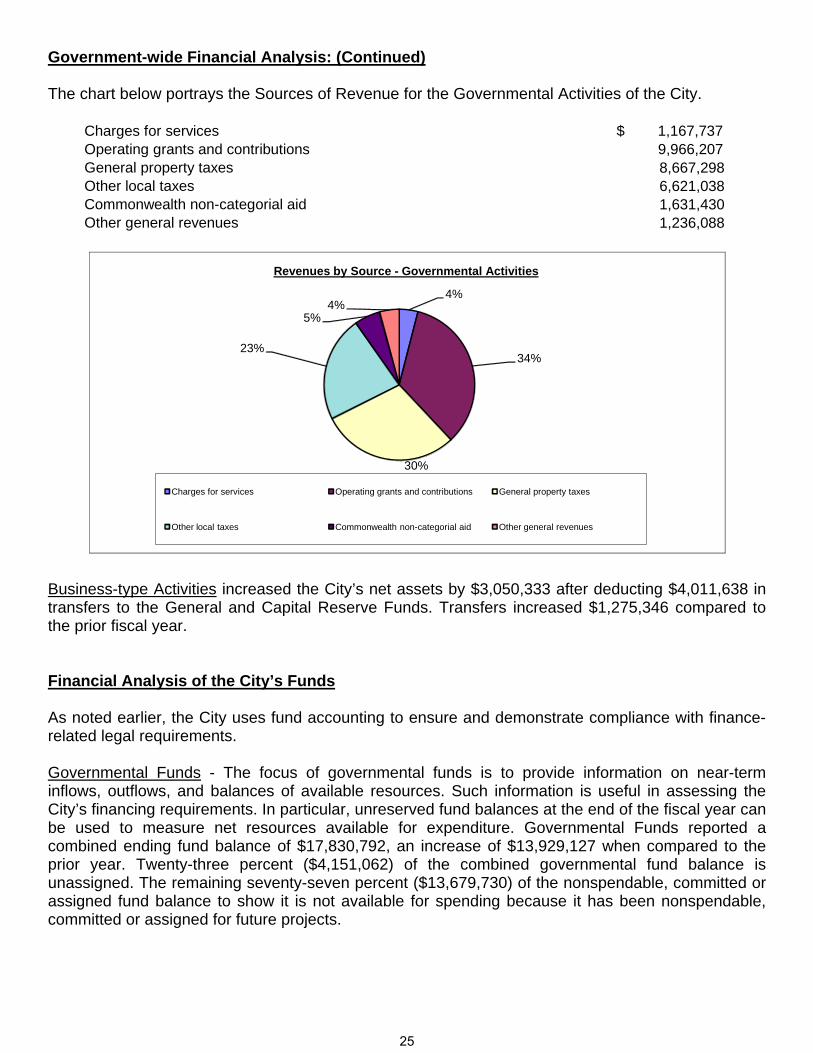
Government-wide Financial Analysis: (Continued) The chart below portrays the Sources of Revenue for the Governmental Activities of the City.
Charges for services $ 1,167,737 Operating grants and contributions 9,966,207 General property taxes 8,667,298 Other local taxes 6,621,038 Commonwealth non-categorial aid 1,631,430 Other general revenues 1,236,088
4%
34%
30%
23%
5%4%
Revenues by Source - Governmental Activities
Charges for services Operating grants and contributions General property taxes
Other local taxes Commonwealth non-categorial aid Other general revenues
Business-type Activities increased the City’s net assets by $3,050,333 after deducting $4,011,638 in transfers to the General and Capital Reserve Funds. Transfers increased $1,275,346 compared to the prior fiscal year. Financial Analysis of the City’s Funds As noted earlier, the City uses fund accounting to ensure and demonstrate compliance with finance-related legal requirements. Governmental Funds - The focus of governmental funds is to provide information on near-term inflows, outflows, and balances of available resources. Such information is useful in assessing the City’s financing requirements. In particular, unreserved fund balances at the end of the fiscal year can be used to measure net resources available for expenditure. Governmental Funds reported a combined ending fund balance of $17,830,792, an increase of $13,929,127 when compared to the prior year. Twenty-three percent ($4,151,062) of the combined governmental fund balance is unassigned. The remaining seventy-seven percent ($13,679,730) of the nonspendable, committed or assigned fund balance to show it is not available for spending because it has been nonspendable, committed or assigned for future projects.
25
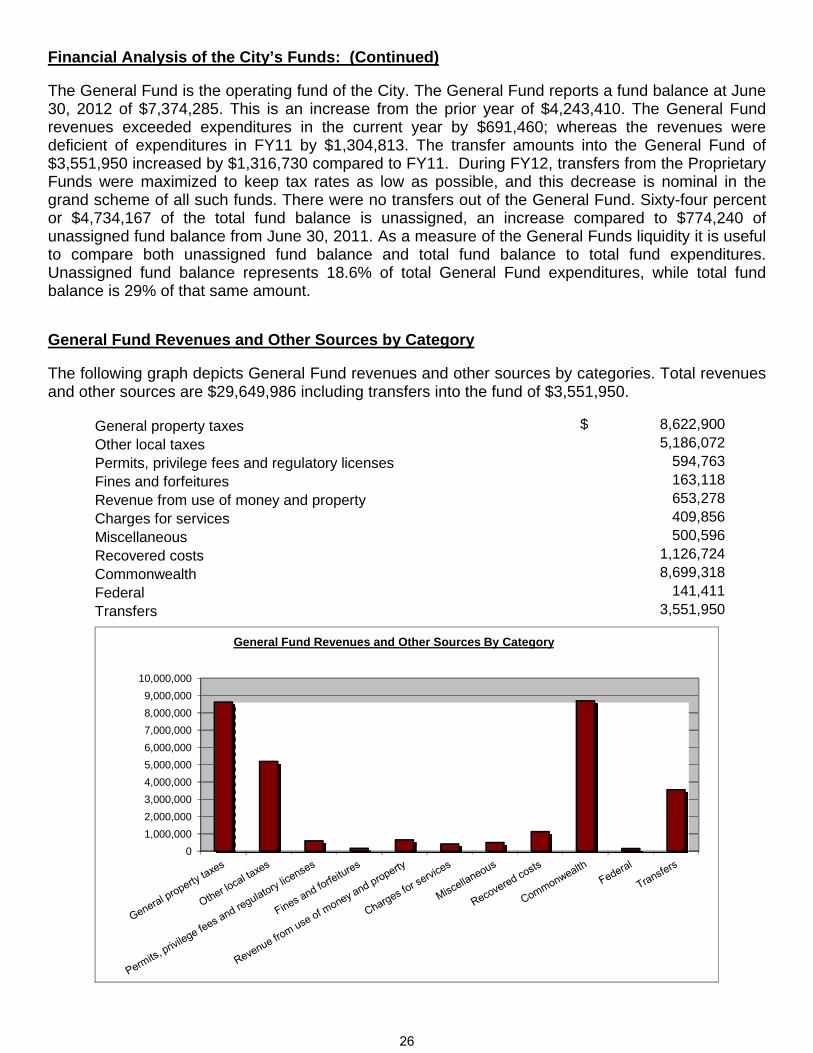
Financial Analysis of the City’s Funds: (Continued) The General Fund is the operating fund of the City. The General Fund reports a fund balance at June 30, 2012 of $7,374,285. This is an increase from the prior year of $4,243,410. The General Fund revenues exceeded expenditures in the current year by $691,460; whereas the revenues were deficient of expenditures in FY11 by $1,304,813. The transfer amounts into the General Fund of $3,551,950 increased by $1,316,730 compared to FY11. During FY12, transfers from the Proprietary Funds were maximized to keep tax rates as low as possible, and this decrease is nominal in the grand scheme of all such funds. There were no transfers out of the General Fund. Sixty-four percent or $4,734,167 of the total fund balance is unassigned, an increase compared to $774,240 of unassigned fund balance from June 30, 2011. As a measure of the General Funds liquidity it is useful to compare both unassigned fund balance and total fund balance to total fund expenditures. Unassigned fund balance represents 18.6% of total General Fund expenditures, while total fund balance is 29% of that same amount. General Fund Revenues and Other Sources by Category The following graph depicts General Fund revenues and other sources by categories. Total revenues and other sources are $29,649,986 including transfers into the fund of $3,551,950.
General property taxes 8,622,900$ Other local taxes 5,186,072 Permits, privilege fees and regulatory licenses 594,763 Fines and forfeitures 163,118 Revenue from use of money and property 653,278 Charges for services 409,856 Miscellaneous 500,596 Recovered costs 1,126,724 Commonwealth 8,699,318 Federal 141,411 Transfers 3,551,950
0
1,000,000
2,000,000
3,000,000
4,000,000
5,000,000
6,000,000
7,000,000
8,000,000
9,000,000
10,000,000
General Fund Revenues and Other Sources By Category
26
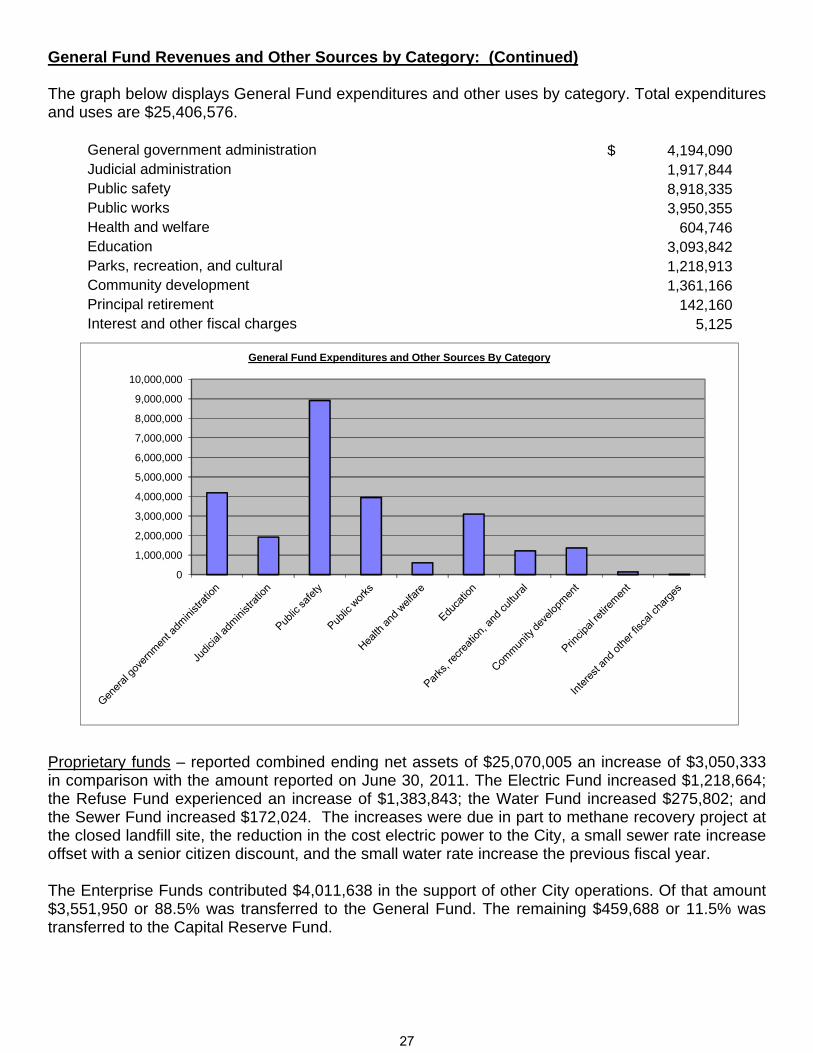
General Fund Revenues and Other Sources by Category: (Continued) The graph below displays General Fund expenditures and other uses by category. Total expenditures and uses are $25,406,576.
General government administration 4,194,090$ Judicial administration 1,917,844 Public safety 8,918,335 Public works 3,950,355 Health and welfare 604,746 Education 3,093,842 Parks, recreation, and cultural 1,218,913 Community development 1,361,166 Principal retirement 142,160 Interest and other fiscal charges 5,125
0
1,000,000
2,000,000
3,000,000
4,000,000
5,000,000
6,000,000
7,000,000
8,000,000
9,000,000
10,000,000
General Fund Expenditures and Other Sources By Category
Proprietary funds – reported combined ending net assets of $25,070,005 an increase of $3,050,333 in comparison with the amount reported on June 30, 2011. The Electric Fund increased $1,218,664; the Refuse Fund experienced an increase of $1,383,843; the Water Fund increased $275,802; and the Sewer Fund increased $172,024. The increases were due in part to methane recovery project at the closed landfill site, the reduction in the cost electric power to the City, a small sewer rate increase offset with a senior citizen discount, and the small water rate increase the previous fiscal year. The Enterprise Funds contributed $4,011,638 in the support of other City operations. Of that amount $3,551,950 or 88.5% was transferred to the General Fund. The remaining $459,688 or 11.5% was transferred to the Capital Reserve Fund.
27
General Fund Budgetary Highlights Differences between the original budget and the final amended budget were relatively minor. Revenues were increased by $337,926 or 1.2% while expenditures increased by $1,448,946 or 5.1%. The Revenue increases were as follows:
$600 in Charges for Services $400 in Fines & Forfeitures $10,128 in Miscellaneous Revenue $126,252 in Recovered Costs $182,111 in Intergovernmental revenues from the Commonwealth $18,435 in Intergovernmental revenues from the Federal Government The Expenditure amendments were as follows:
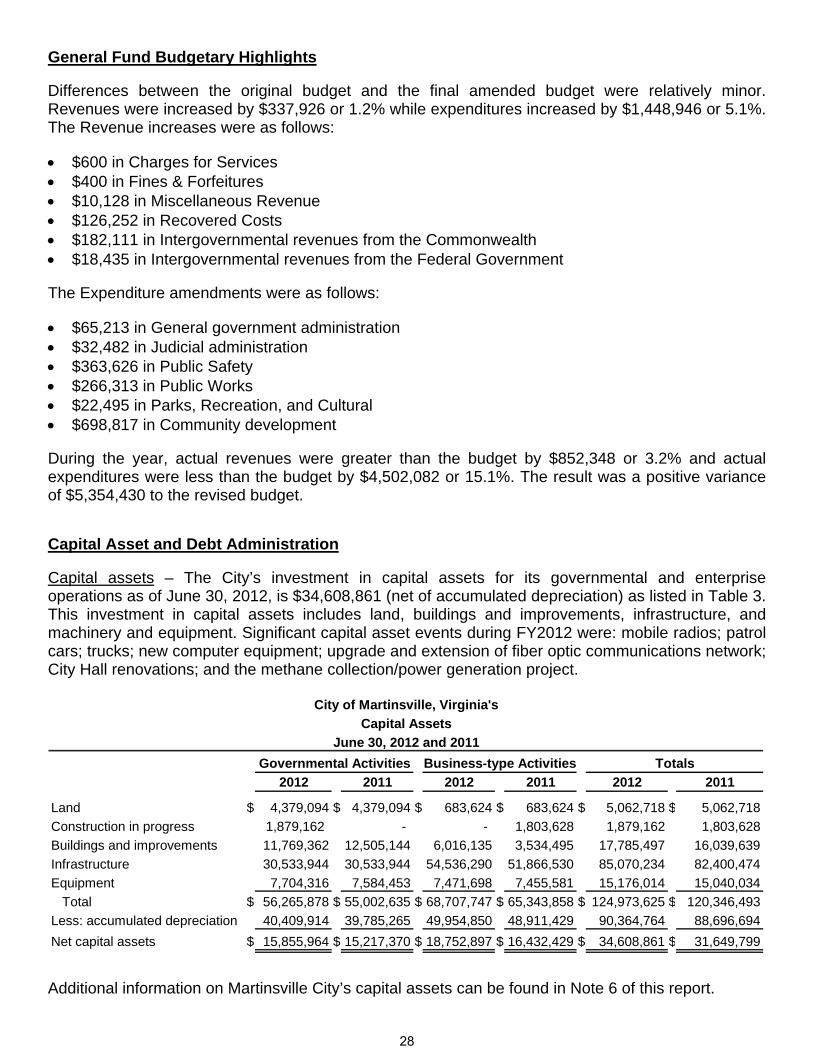
$65,213 in General government administration $32,482 in Judicial administration $363,626 in Public Safety $266,313 in Public Works $22,495 in Parks, Recreation, and Cultural $698,817 in Community development During the year, actual revenues were greater than the budget by $852,348 or 3.2% and actual expenditures were less than the budget by $4,502,082 or 15.1%. The result was a positive variance of $5,354,430 to the revised budget. Capital Asset and Debt Administration Capital assets – The City’s investment in capital assets for its governmental and enterprise operations as of June 30, 2012, is $34,608,861 (net of accumulated depreciation) as listed in Table 3. This investment in capital assets includes land, buildings and improvements, infrastructure, and machinery and equipment. Significant capital asset events during FY2012 were: mobile radios; patrol cars; trucks; new computer equipment; upgrade and extension of fiber optic communications network; City Hall renovations; and the methane collection/power generation project.
Governmental Activities Business-type Activities Totals
2012 2011 2012 2011 2012 2011
Land $ 4,379,094 $ 4,379,094 $ 683,624 $ 683,624 $ 5,062,718 $ 5,062,718
Construction in progress 1,879,162 - - 1,803,628 1,879,162 1,803,628
Buildings and improvements 11,769,362 12,505,144 6,016,135 3,534,495 17,785,497 16,039,639
Infrastructure 30,533,944 30,533,944 54,536,290 51,866,530 85,070,234 82,400,474
Equipment 7,704,316 7,584,453 7,471,698 7,455,581 15,176,014 15,040,034
Total $ 56,265,878 $ 55,002,635 $ 68,707,747 $ 65,343,858 $ 124,973,625 $ 120,346,493
Less: accumulated depreciation 40,409,914 39,785,265 49,954,850 48,911,429 90,364,764 88,696,694
Net capital assets $ 15,855,964 $ 15,217,370 $ 18,752,897 $ 16,432,429 $ 34,608,861 $ 31,649,799
June 30, 2012 and 2011
Capital Assets
City of Martinsville, Virginia's
Additional information on Martinsville City’s capital assets can be found in Note 6 of this report.
28
Capital Asset and Debt Administration: (Continued) Long-term debt – At the close of FY2012, Martinsville City had total outstanding obligations of $26,453,156. Of this amount $21,710,962 comprises debt backed by the full faith and credit of the City. The remainder of the City’s debt represents bonds secured solely by specified revenue sources, i.e., revenue bonds, landfill closure and post-closure liability, compensated absences, notes payable and capital lease obligations. During the Fiscal Year the City increased its long-term obligations by $8,764,956 or 49.6%. The City’s obligations decreased $1,979,979. $10,550,000 in new debt was issued. The Commonwealth of Virginia imposes a legal limit of 10% of the assessed valuation of taxable real property on the amount of general obligation borrowing which a City may issue. On June 30, 2012 the City’s ratio of Net General Obligation Debt to Assessed Value was 2.76%. This was an increase from the previous fiscal year. Additional information on the Martinsville City’s long-term debt can be found in Note No. 8 of this report. Economic Factors Influencing FY2012 Budgets and Tax Rates With continued weak economic growth, diminishing population, continued but improving national recessionary factors, and a strategy of maintaining current levels of City services, the FY12 budget continued the strategy of streamlining expenses, funding essential capital expenditures, reducing personnel through attrition wherever possible, and evaluating all vacancies on a case-by-case basis. In FY12, the Commonwealth of Virginia continued the reduction in aid-to-localities that occurred in FY09, FY10, and FY11. The sum of such budgetary adjustments over these budget years has totaled almost $800,000 in various categories including HB 599 Funds (state aid for localities with police departments) and reduced funding for constitutional offices. Outlook for FY2013 - Opportunities and Challenges The City faces opportunities and challenges in FY13, including the following issues: 1. Continued high levels of unemployment – Martinsville continues to consistently have one of the
highest unemployment rates in the state - the unemployment rate for the City on June 30, 2012 was 14.3%. While this was a decrease of 15.9% from the previous year’s rate of 17%, the City’s unemployment rates still compares unfavorably to the state’s average unemployment rate of 5.7% and the national average of 8.2% for the same time. While the need for jobs for a wide ranging level of skills continues to be an issue, a growing concern is an inadequately prepared workforce for emerging advanced manufacturing jobs.
29
FY2013 Opportunities and Challenges: (Continued) 2. Reductions in state aid – Again, In FY 13, the Commonwealth of Virginia continued the
reduction in aid-to-localities that occurred in FY09 through FY12. The sum of the City’s budgetary reductions over this five year period will total $924,678. An encouraging sign, however, is due to improving state revenue it is possible that reductions in state aid to localities will be eliminated in FY14.
3. Personnel Costs – FY13 marked the 5th consecutive year the City’s budget did not provide a
general cost of living pay increase for employees. City Council members have noted this cannot continue indefinitely and efforts will continue through FY13 and into FY14 to develop options for funding employee salary adjustments. Additionally, in FY13 and beyond, the rising cost of employee health care coupled with state required increases in Virginia Retirement System contributions will place an additional burden on an already-stretched budget.
4. Policy - The City Council approves the annual budget following staff recommendations, its own
analysis of the needs of the City, the City’s overall financial position, economic conditions, and after careful consideration of input and comments from the citizens. This methodical process has led to the development of budget principles of minimizing increases in taxes and fees and the continuation of offering the same levels of service that citizens are accustomed to receiving. Increasing costs coupled lack of revenue growth necessitated the need for increases in the meals tax rate in FY13 as well as significant adjustments in both water and sewer rates. Management realizes that the trend of providing current levels of services cannot continue without increasing revenues/fees for service and/or without making changes in the manner at which local funds are expended. Since 2006, the policy of reducing staffing has cut the City workforce by43 net FTE positions.
5. Exploration of new revenue opportunities – With direction from City Council, staff continues to
explore opportunities for revenue growth and one project that continues to show promise is the landfill methane/electric project. The City operated a municipal landfill until 2006, at which time changes in landfill regulations led the City to close the operation. Deteriorating landfill wastes yield methane gas, and the City’s disposal of sewer wastes adds even more of a prosperous environment for more methane gas as compared to residential garbage alone. In FY10, the City developed a two-phased project. Phase 1, collection and flaring (burning) of methane and generation of carbon credits, with an $800,000 price tag was completed in May, 2010, and Phase 2, electric generation using collected methane gas coupled with the same benefits of Phase 1, was completed in February, 2012 at a cost of $1.7 million. Depending on power costs, Phase 2 could reduce purchased power costs by several hundred thousand dollars per year. The City received a $1 million stimulus package grant to reduce capital project costs associated with Phase 2. Staff and its consultant continues to fine-tune the system to optimize power production while minimizing costs. Options regarding possible sale of carbon credits continue to be evaluated as well.
Another project being investigated is expansion/growth of the City’s fiber optic system. Various options are currently being explored particularly with service to business/industrial clients that could prove significant in retaining current businesses as well as attracting new business opportunities.
30
FY2013 Opportunities and Challenges: (Continued) 6. Uptown Revitalization Projects –In the fall of 2013, New College Institute broke ground on an
approximate $15 million building project on the Baldwin Block located in uptown Martinsville. The building will house an advanced manufacturing lab, various New College and Economic Development Corporation offices, and a “great hall” that will provide state-of-the-art meeting space not currently available in our community. The project is expected to fuel continued growth of NCI, bolstered by a renewed collaborative effort with Patrick Henry Community College.
During 2012, an announcement was made regarding plans for development of a new medical school – The Integrative Centers for Science and Medicine – College of Henricopolis School of Medicine. Dr. Noel Boaz is spear-heading the effort with initial plans to use an existing building located at the corner of Moss and Fayette Streets, with eventual plans to expand to other sites.
Plans are also being aggressively pursued to redevelop the Henry Hotel. Purchased in 2009 by the City, the four-story Henry Hotel is located in uptown Martinsville and could potentially house a combination of commercial space on the first floor, and market-rate apartments on floors 2 through 4.
Other projects occurring in FY13 include completion of relocation of Depot Street and redevelopment of the Depot Street parking lot; installation of new way-finding signs directing traffic to various City features, gateway and landscaping improvements at several key intersections leading into the uptown area, opening of the Silverbell Spur trail – a new section of walking trail connecting to the City’s spur trail and the Dick & Willie trail, continuation of improvements to the historic courthouse in uptown Martinsville, and façade and other improvements through a Community Development Block Grant.
7. Energy Efficiency Grants—In FY10, the City received two federal grants aimed at decreasing
energy expense – one for $400,000 for the purchase of equipment/enhancements to lighting, heating/cooling, etc. within City government buildings, and also a grant for $506,681 to renovate turbines and generating equipment at the City’s hydroelectric facility that will improve plant efficiency as well as to automate the plant for 24/7 operation. These projects will be completed in FY 13 and will reduce the City’s electric costs in buildings and yield an approximate 6% increase in the efficiency of hydro-electricity generation.
8. Job Creation—The City continues to partner with Henry County in economic development. In
FY13, efforts will continue to retain current business and industry, provide an atmosphere conducive to expansion, as well as to attract new business and industry.
9. One-Time Capital Expenditures—In FY13, Council approved one major capital expenditure - the
purchase of a new fire truck, replacing an older unit that was becoming unreliable and costly to repair. Cost of the new truck is $472,583, financed over five years with debt service beginning in FY14.
31

FY2013 Opportunities and Challenges: (Continued) 10. Industrial Park Development—The City and Henry County partner in economic development
through joint funding of the Martinsville-Henry County Economic Development Corporation and also through a revenue sharing agreement for three separate industrial parks. Under the agreement, the City is to receive one-third of the tax revenue generated after Henry County recoups its initial investment. One particular industrial park, Commonwealth Crossing Business Centre, approximately 600 acres in size , has become the focus of aggressive development efforts projected to continue into FY13 and beyond. Various funding sources were secured, including a City contribution of $292,400 for installation of water and sewer infrastructure and a City commitment of $1,700,000 for the grading of the site. Although local officials are still optimistic for a positive outcome, In FY13, efforts have stalled to begin grading of the site due to permitting issues through the Army Corps of Engineers. The City must plan for its share of the grading costs in subsequent budgets.
All these factors were considered in preparing the City’s budgets for the 2012 and 2013 fiscal years. For fiscal year 2013, City Council approved a General Fund Budget of $28,459,712. The fiscal year 2013 budget maintains the real estate tax rate at $1.018 per $100 of assessed value, provides for an increase in the meals tax from 6% to 6.5%; an increase in the water rate of $2.50 per month, from $19.81 to $22.31 for minimum bills; and an increase in the sewer rate of $2.50 per month, from $18.14 to $20.64 for minimum bills. Requests for Information This financial report is designed to provide a general overview of the City of Martinsville’s finances. Questions concerning any of the information provided in this report or requests for additional financial information should be addressed to the City of Martinsville, Finance Department, 55 West Church Street, Martinsville, Virginia 24112.
32
Basic Financial Statements
33

This page intentionally left blank
Government-wide Financial Statements
35

This page intentionally left blank
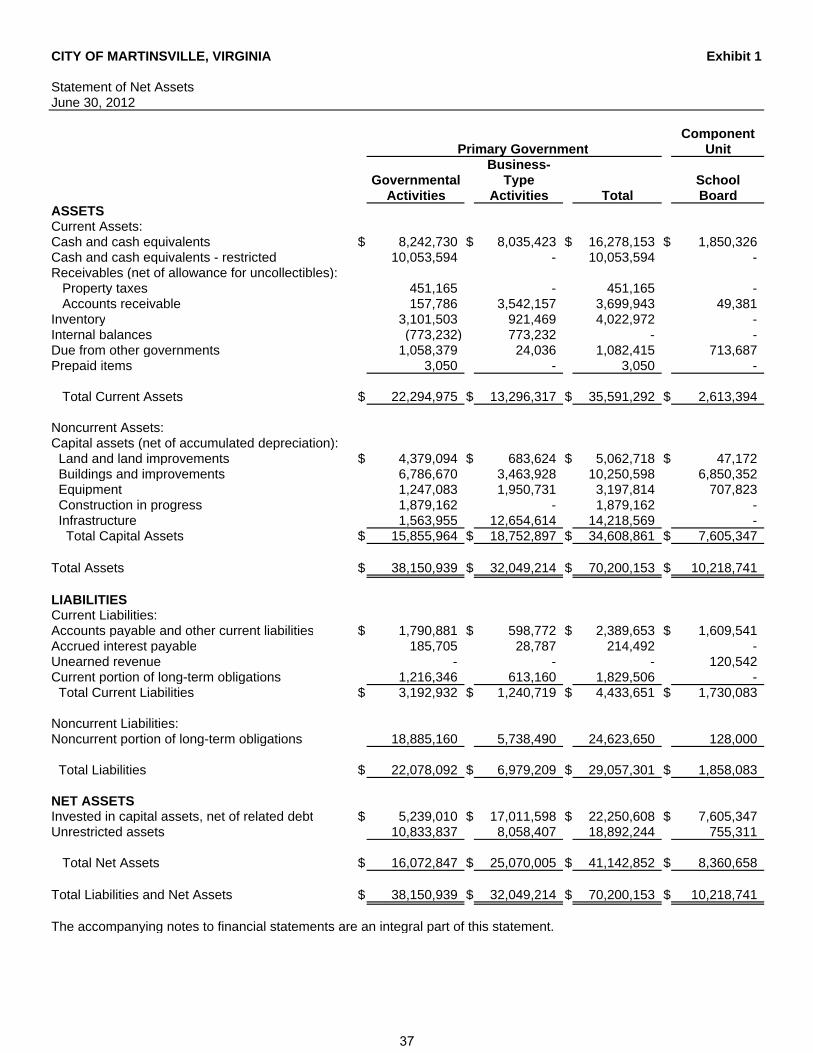
CITY OF MARTINSVILLE, VIRGINIA Exhibit 1
Statement of Net AssetsJune 30, 2012
Component Primary Government Unit
Business-Governmental Type School
Activities Activities Total BoardASSETSCurrent Assets:Cash and cash equivalents $ 8,242,730 $ 8,035,423 $ 16,278,153 $ 1,850,326 Cash and cash equivalents - restricted 10,053,594 - 10,053,594 - Receivables (net of allowance for uncollectibles): Property taxes 451,165 - 451,165 - Accounts receivable 157,786 3,542,157 3,699,943 49,381 Inventory 3,101,503 921,469 4,022,972 - Internal balances (773,232) 773,232 - - Due from other governments 1,058,379 24,036 1,082,415 713,687 Prepaid items 3,050 - 3,050 -
Total Current Assets $ 22,294,975 $ 13,296,317 $ 35,591,292 $ 2,613,394
Noncurrent Assets:Capital assets (net of accumulated depreciation): Land and land improvements $ 4,379,094 $ 683,624 $ 5,062,718 $ 47,172 Buildings and improvements 6,786,670 3,463,928 10,250,598 6,850,352 Equipment 1,247,083 1,950,731 3,197,814 707,823 Construction in progress 1,879,162 - 1,879,162 - Infrastructure 1,563,955 12,654,614 14,218,569 - Total Capital Assets $ 15,855,964 $ 18,752,897 $ 34,608,861 $ 7,605,347
Total Assets $ 38,150,939 $ 32,049,214 $ 70,200,153 $ 10,218,741
LIABILITIESCurrent Liabilities:Accounts payable and other current liabilities $ 1,790,881 $ 598,772 $ 2,389,653 $ 1,609,541Accrued interest payable 185,705 28,787 214,492 - Unearned revenue - - - 120,542 Current portion of long-term obligations 1,216,346 613,160 1,829,506 - Total Current Liabilities $ 3,192,932 $ 1,240,719 $ 4,433,651 $ 1,730,083
Noncurrent Liabilities:Noncurrent portion of long-term obligations 18,885,160 5,738,490 24,623,650 128,000
Total Liabilities $ 22,078,092 $ 6,979,209 $ 29,057,301 $ 1,858,083
NET ASSETSInvested in capital assets, net of related debt $ 5,239,010 $ 17,011,598 $ 22,250,608 $ 7,605,347 Unrestricted assets 10,833,837 8,058,407 18,892,244 755,311
Total Net Assets $ 16,072,847 $ 25,070,005 $ 41,142,852 $ 8,360,658
Total Liabilities and Net Assets $ 38,150,939 $ 32,049,214 $ 70,200,153 $ 10,218,741
The accompanying notes to financial statements are an integral part of this statement.
37
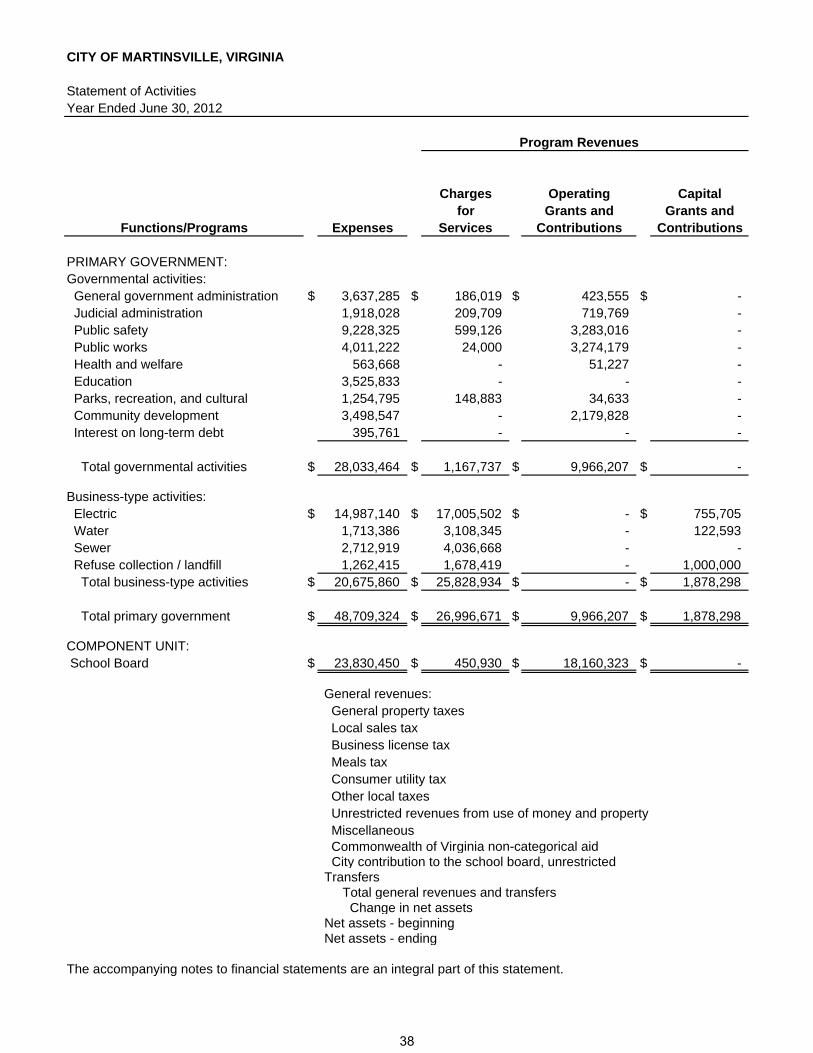
CITY OF MARTINSVILLE, VIRGINIA
Statement of ActivitiesYear Ended June 30, 2012
Program Revenues
Charges Operating Capitalfor Grants and Grants and
Functions/Programs Expenses Services Contributions Contributions
PRIMARY GOVERNMENT:Governmental activities: General government administration $ 3,637,285 $ 186,019 $ 423,555 $ - Judicial administration 1,918,028 209,709 719,769 - Public safety 9,228,325 599,126 3,283,016 - Public works 4,011,222 24,000 3,274,179 - Health and welfare 563,668 - 51,227 - Education 3,525,833 - - - Parks, recreation, and cultural 1,254,795 148,883 34,633 - Community development 3,498,547 - 2,179,828 - Interest on long-term debt 395,761 - - -
Total governmental activities $ 28,033,464 $ 1,167,737 $ 9,966,207 $ -
Business-type activities: Electric $ 14,987,140 $ 17,005,502 $ - $ 755,705 Water 1,713,386 3,108,345 - 122,593 Sewer 2,712,919 4,036,668 - - Refuse collection / landfill 1,262,415 1,678,419 - 1,000,000 Total business-type activities $ 20,675,860 $ 25,828,934 $ - $ 1,878,298
Total primary government $ 48,709,324 $ 26,996,671 $ 9,966,207 $ 1,878,298
COMPONENT UNIT: School Board $ 23,830,450 $ 450,930 $ 18,160,323 $ -
General revenues: General property taxes Local sales tax Business license tax Meals tax Consumer utility tax Other local taxes Unrestricted revenues from use of money and property Miscellaneous Commonwealth of Virginia non-categorical aid City contribution to the school board, unrestrictedTransfers Total general revenues and transfers Change in net assetsNet assets - beginningNet assets - ending
The accompanying notes to financial statements are an integral part of this statement.
38

Exhibit 2
ComponentUnit
BusinessGovernmental Type School
Activities Activities Total Board Functions/Programs
PRIMARY GOVERNMENT:Governmental activities:
$ (3,027,711) $ - $ (3,027,711) $ - General government administration(988,550) - (988,550) - Judicial administration
(5,346,183) - (5,346,183) - Public safety(713,043) - (713,043) - Public works(512,441) - (512,441) - Health and welfare
(3,525,833) - (3,525,833) - Education(1,071,279) - (1,071,279) - Parks, recreation, and cultural(1,318,719) - (1,318,719) - Community development
(395,761) - (395,761) - Interest on long-term debt
$ (16,899,520) $ - $ (16,899,520) $ - Total government activities
Business-type activities:$ - $ 2,774,067 $ 2,774,067 $ - Electric
- 1,517,552 1,517,552 - Water- 1,323,749 1,323,749 - Sewer- 1,416,004 1,416,004 - Refuse collection / landfill
$ - $ 7,031,372 $ 7,031,372 $ - Total business-type activities
$ (16,899,520) $ 7,031,372 $ (9,868,148) $ - Total primary government
COMPONENT UNIT:$ - $ - $ - $ (5,219,197) School Board
General revenues:$ 8,667,298 $ - $ 8,667,298 $ - General property taxes
1,891,909 - 1,891,909 - Local sales tax1,720,315 - 1,720,315 - Business license tax1,434,966 - 1,434,966 - Meals tax
695,041 - 695,041 - Consumer utility tax878,807 - 878,807 - Other local taxes725,358 30,599 755,957 46,213 Unrestricted revenues from use of money and property510,730 - 510,730 97,430 Miscellaneous
1,631,430 - 1,631,430 - Commonwealth of Virginia non-categorical aid- - - 3,076,122 City contribution to the school board, unrestricted
4,011,638 (4,011,638) - - Transfers$ 22,167,492 $ (3,981,039) $ 18,186,453 $ 3,219,765 Total general revenues and transfers$ 5,267,972 $ 3,050,333 $ 8,318,305 $ (1,999,432) Change in net assets
10,804,875 22,019,672 32,824,547 10,360,090 Net assets - beginning$ 16,072,847 $ 25,070,005 $ 41,142,852 $ 8,360,658 Net assets - ending
Primary Government
Net (Expense) Revenue and Changes in Net Assets
39

This page intentionally left blank
Fund Financial Statements
41

This page intentionally left blank
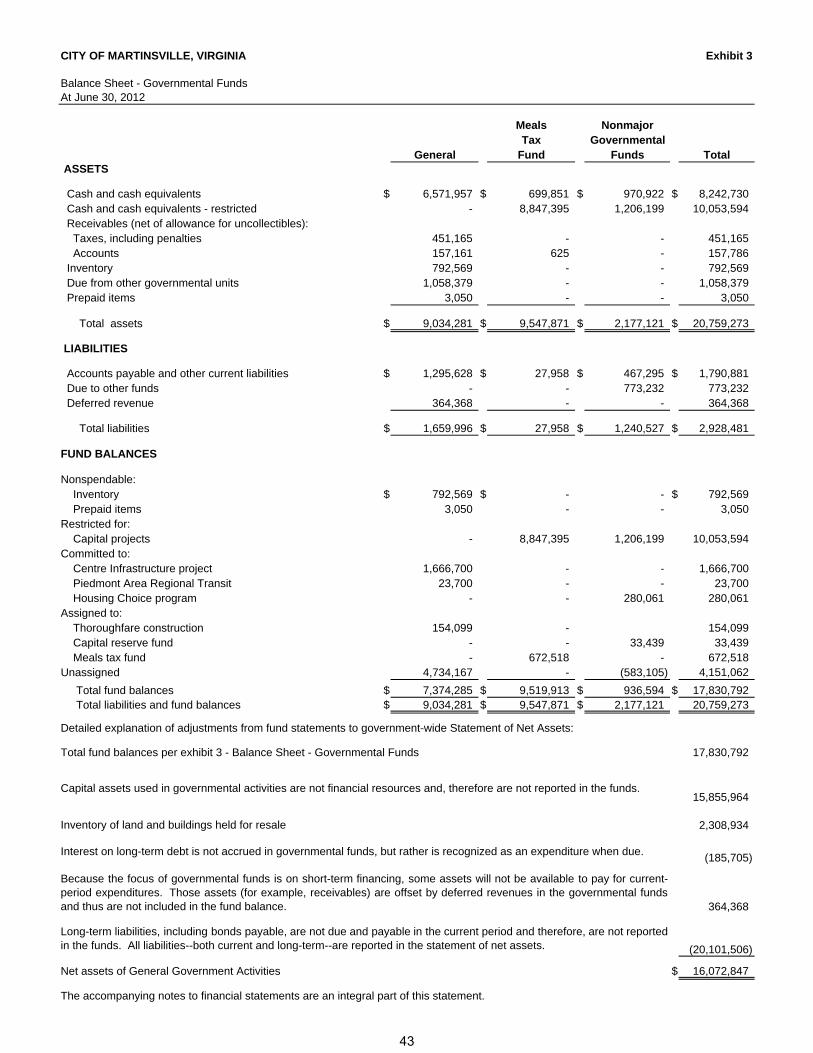
CITY OF MARTINSVILLE, VIRGINIA Exhibit 3
Balance Sheet - Governmental Funds At June 30, 2012
Meals NonmajorTax Governmental
General Fund Funds Total ASSETS
Cash and cash equivalents $ 6,571,957 $ 699,851 $ 970,922 $ 8,242,730 Cash and cash equivalents - restricted - 8,847,395 1,206,199 10,053,594 Receivables (net of allowance for uncollectibles): Taxes, including penalties 451,165 - - 451,165 Accounts 157,161 625 - 157,786 Inventory 792,569 - - 792,569 Due from other governmental units 1,058,379 - - 1,058,379 Prepaid items 3,050 - - 3,050
Total assets $ 9,034,281 $ 9,547,871 $ 2,177,121 $ 20,759,273
LIABILITIES
Accounts payable and other current liabilities $ 1,295,628 $ 27,958 $ 467,295 $ 1,790,881 Due to other funds - - 773,232 773,232 Deferred revenue 364,368 - - 364,368
Total liabilities $ 1,659,996 $ 27,958 $ 1,240,527 $ 2,928,481
FUND BALANCES
Nonspendable: Inventory $ 792,569 $ - - $ 792,569 Prepaid items 3,050 - - 3,050 Restricted for: Capital projects - 8,847,395 1,206,199 10,053,594 Committed to: Centre Infrastructure project 1,666,700 - - 1,666,700 Piedmont Area Regional Transit 23,700 - - 23,700 Housing Choice program - - 280,061 280,061 Assigned to: Thoroughfare construction 154,099 - 154,099 Capital reserve fund - - 33,439 33,439 Meals tax fund - 672,518 - 672,518 Unassigned 4,734,167 - (583,105) 4,151,062
Total fund balances $ 7,374,285 $ 9,519,913 $ 936,594 $ 17,830,792 Total liabilities and fund balances $ 9,034,281 $ 9,547,871 $ 2,177,121 20,759,273
Detailed explanation of adjustments from fund statements to government-wide Statement of Net Assets:
Total fund balances per exhibit 3 - Balance Sheet - Governmental Funds 17,830,792
15,855,964
Inventory of land and buildings held for resale 2,308,934
(185,705)
364,368
(20,101,506)
Net assets of General Government Activities $ 16,072,847
The accompanying notes to financial statements are an integral part of this statement.
Interest on long-term debt is not accrued in governmental funds, but rather is recognized as an expenditure when due.
Because the focus of governmental funds is on short-term financing, some assets will not be available to pay for current-period expenditures. Those assets (for example, receivables) are offset by deferred revenues in the governmental fundsand thus are not included in the fund balance.
Long-term liabilities, including bonds payable, are not due and payable in the current period and therefore, are not reportedin the funds. All liabilities--both current and long-term--are reported in the statement of net assets.
Capital assets used in governmental activities are not financial resources and, therefore are not reported in the funds.
43
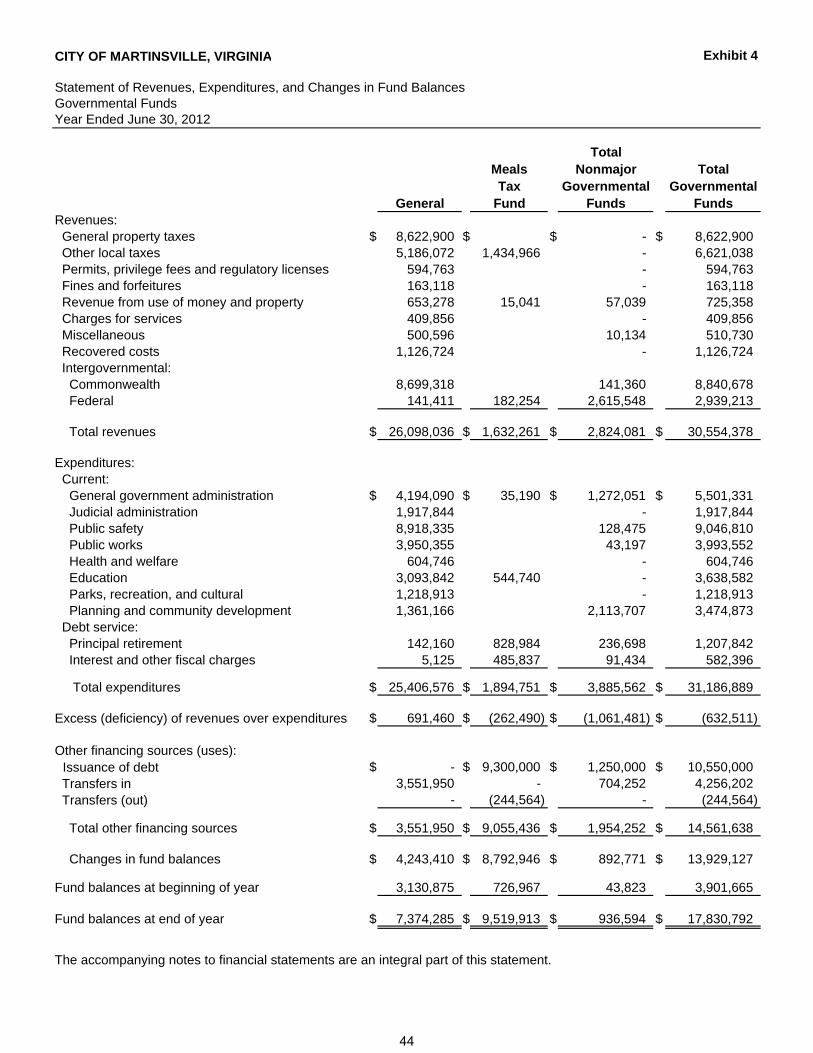
CITY OF MARTINSVILLE, VIRGINIA Exhibit 4
Statement of Revenues, Expenditures, and Changes in Fund BalancesGovernmental Funds Year Ended June 30, 2012
TotalMeals Nonmajor TotalTax Governmental Governmental
General Fund Funds FundsRevenues: General property taxes $ 8,622,900 $ $ - $ 8,622,900 Other local taxes 5,186,072 1,434,966 - 6,621,038 Permits, privilege fees and regulatory licenses 594,763 - 594,763 Fines and forfeitures 163,118 - 163,118 Revenue from use of money and property 653,278 15,041 57,039 725,358 Charges for services 409,856 - 409,856 Miscellaneous 500,596 10,134 510,730 Recovered costs 1,126,724 - 1,126,724 Intergovernmental: Commonwealth 8,699,318 141,360 8,840,678 Federal 141,411 182,254 2,615,548 2,939,213
Total revenues $ 26,098,036 $ 1,632,261 $ 2,824,081 $ 30,554,378
Expenditures: Current: General government administration $ 4,194,090 $ 35,190 $ 1,272,051 $ 5,501,331 Judicial administration 1,917,844 - 1,917,844 Public safety 8,918,335 128,475 9,046,810 Public works 3,950,355 43,197 3,993,552 Health and welfare 604,746 - 604,746 Education 3,093,842 544,740 - 3,638,582 Parks, recreation, and cultural 1,218,913 - 1,218,913 Planning and community development 1,361,166 2,113,707 3,474,873 Debt service: Principal retirement 142,160 828,984 236,698 1,207,842 Interest and other fiscal charges 5,125 485,837 91,434 582,396
Total expenditures $ 25,406,576 $ 1,894,751 $ 3,885,562 $ 31,186,889
Excess (deficiency) of revenues over expenditures $ 691,460 $ (262,490) $ (1,061,481) $ (632,511)
Other financing sources (uses): Issuance of debt $ - $ 9,300,000 $ 1,250,000 $ 10,550,000
Transfers in 3,551,950 - 704,252 4,256,202 Transfers (out) - (244,564) - (244,564)
Total other financing sources $ 3,551,950 $ 9,055,436 $ 1,954,252 $ 14,561,638
Changes in fund balances $ 4,243,410 $ 8,792,946 $ 892,771 $ 13,929,127
Fund balances at beginning of year 3,130,875 726,967 43,823 3,901,665
Fund balances at end of year $ 7,374,285 $ 9,519,913 $ 936,594 $ 17,830,792
The accompanying notes to financial statements are an integral part of this statement.
44
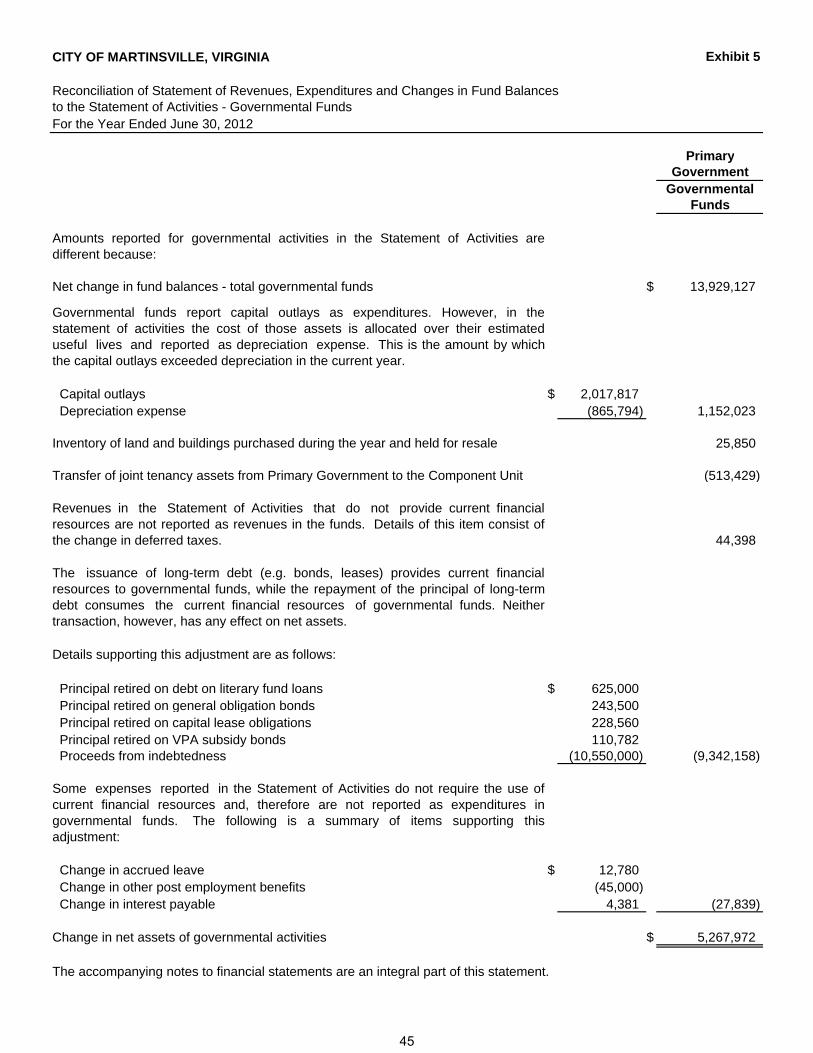
CITY OF MARTINSVILLE, VIRGINIA Exhibit 5
Reconciliation of Statement of Revenues, Expenditures and Changes in Fund Balances to the Statement of Activities - Governmental Funds For the Year Ended June 30, 2012
PrimaryGovernment
GovernmentalFunds
Amounts reported for governmental activities in the Statement of Activities aredifferent because:
Net change in fund balances - total governmental funds $ 13,929,127
Governmental funds report capital outlays as expenditures. However, in thestatement of activities the cost of those assets is allocated over their estimateduseful lives and reported as depreciation expense. This is the amount by whichthe capital outlays exceeded depreciation in the current year.
Capital outlays $ 2,017,817 Depreciation expense (865,794) 1,152,023
Inventory of land and buildings purchased during the year and held for resale 25,850
Transfer of joint tenancy assets from Primary Government to the Component Unit (513,429)
Revenues in the Statement of Activities that do not provide current financialresources are not reported as revenues in the funds. Details of this item consist ofthe change in deferred taxes. 44,398
The issuance of long-term debt (e.g. bonds, leases) provides current financialresources to governmental funds, while the repayment of the principal of long-termdebt consumes the current financial resources of governmental funds. Neithertransaction, however, has any effect on net assets.
Details supporting this adjustment are as follows:
Principal retired on debt on literary fund loans $ 625,000 Principal retired on general obligation bonds 243,500 Principal retired on capital lease obligations 228,560 Principal retired on VPA subsidy bonds 110,782 Proceeds from indebtedness (10,550,000) (9,342,158)
Some expenses reported in the Statement of Activities do not require the use ofcurrent financial resources and, therefore are not reported as expenditures ingovernmental funds. The following is a summary of items supporting thisadjustment:
Change in accrued leave $ 12,780 Change in other post employment benefits (45,000) Change in interest payable 4,381 (27,839)
Change in net assets of governmental activities $ 5,267,972
The accompanying notes to financial statements are an integral part of this statement.
45
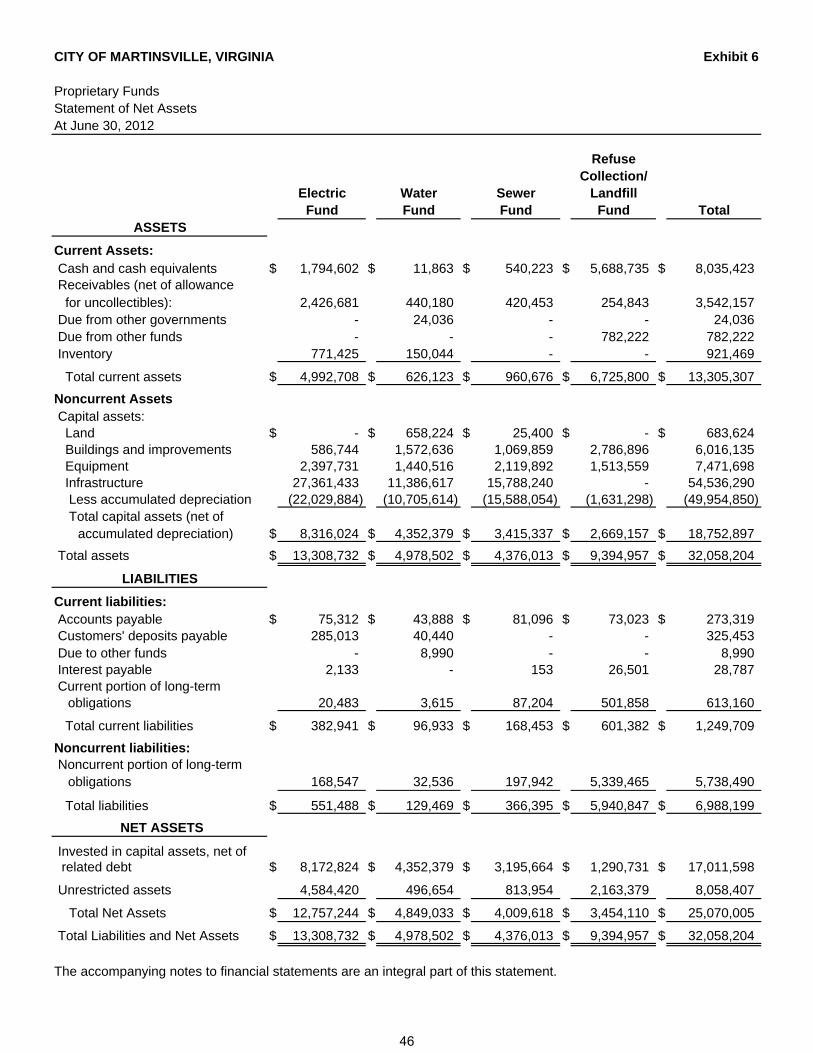
CITY OF MARTINSVILLE, VIRGINIA Exhibit 6
Proprietary FundsStatement of Net Assets At June 30, 2012
RefuseCollection/
Electric Water Sewer LandfillFund Fund Fund Fund Total
ASSETS
Current Assets:Cash and cash equivalents $ 1,794,602 $ 11,863 $ 540,223 $ 5,688,735 $ 8,035,423 Receivables (net of allowance for uncollectibles): 2,426,681 440,180 420,453 254,843 3,542,157 Due from other governments - 24,036 - - 24,036 Due from other funds - - - 782,222 782,222 Inventory 771,425 150,044 - - 921,469
Total current assets $ 4,992,708 $ 626,123 $ 960,676 $ 6,725,800 $ 13,305,307
Noncurrent AssetsCapital assets: Land $ - $ 658,224 $ 25,400 $ - $ 683,624 Buildings and improvements 586,744 1,572,636 1,069,859 2,786,896 6,016,135 Equipment 2,397,731 1,440,516 2,119,892 1,513,559 7,471,698 Infrastructure 27,361,433 11,386,617 15,788,240 - 54,536,290 Less accumulated depreciation (22,029,884) (10,705,614) (15,588,054) (1,631,298) (49,954,850) Total capital assets (net of
accumulated depreciation) $ 8,316,024 $ 4,352,379 $ 3,415,337 $ 2,669,157 $ 18,752,897
Total assets $ 13,308,732 $ 4,978,502 $ 4,376,013 $ 9,394,957 $ 32,058,204
LIABILITIES
Current liabilities:Accounts payable $ 75,312 $ 43,888 $ 81,096 $ 73,023 $ 273,319 Customers' deposits payable 285,013 40,440 - - 325,453 Due to other funds - 8,990 - - 8,990 Interest payable 2,133 - 153 26,501 28,787 Current portion of long-term
obligations 20,483 3,615 87,204 501,858 613,160
Total current liabilities $ 382,941 $ 96,933 $ 168,453 $ 601,382 $ 1,249,709
Noncurrent liabilities:Noncurrent portion of long-term
obligations 168,547 32,536 197,942 5,339,465 5,738,490
Total liabilities $ 551,488 $ 129,469 $ 366,395 $ 5,940,847 $ 6,988,199
NET ASSETS
Invested in capital assets, net of related debt $ 8,172,824 $ 4,352,379 $ 3,195,664 $ 1,290,731 $ 17,011,598
Unrestricted assets 4,584,420 496,654 813,954 2,163,379 8,058,407
Total Net Assets $ 12,757,244 $ 4,849,033 $ 4,009,618 $ 3,454,110 $ 25,070,005
Total Liabilities and Net Assets $ 13,308,732 $ 4,978,502 $ 4,376,013 $ 9,394,957 $ 32,058,204
The accompanying notes to financial statements are an integral part of this statement.
46
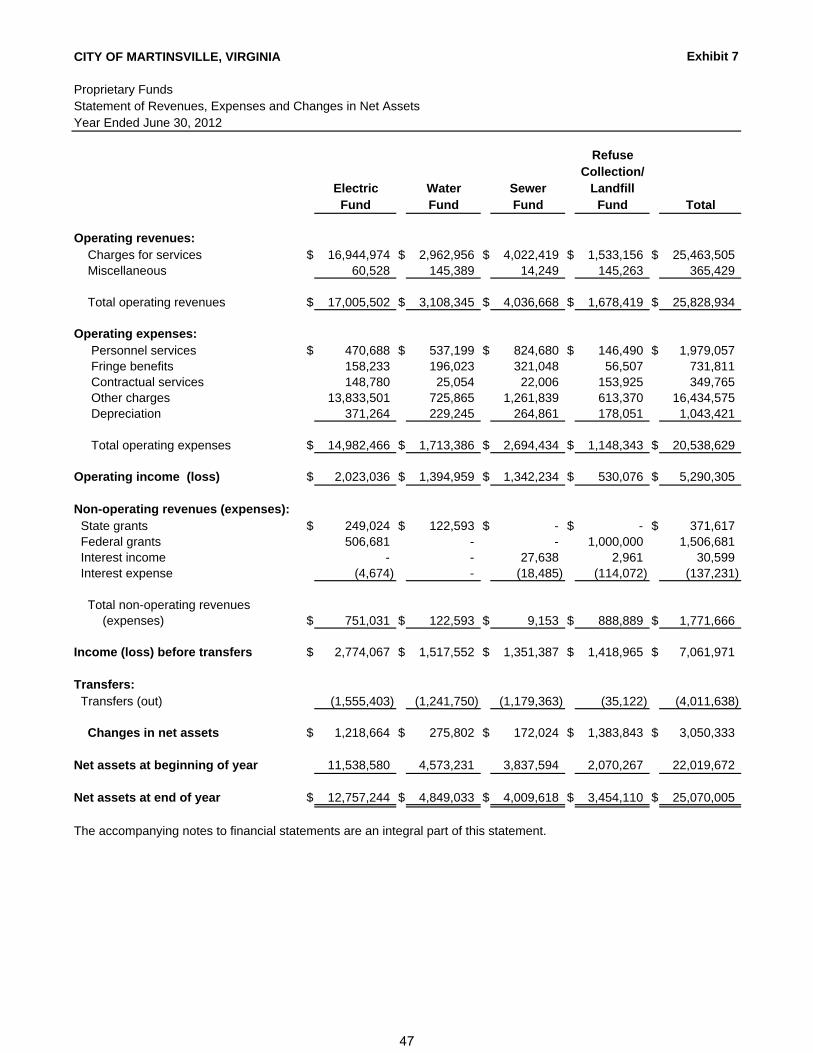
CITY OF MARTINSVILLE, VIRGINIA Exhibit 7
Proprietary FundsStatement of Revenues, Expenses and Changes in Net AssetsYear Ended June 30, 2012
RefuseCollection/
Electric Water Sewer LandfillFund Fund Fund Fund Total
Operating revenues: Charges for services $ 16,944,974 $ 2,962,956 $ 4,022,419 $ 1,533,156 $ 25,463,505 Miscellaneous 60,528 145,389 14,249 145,263 365,429
Total operating revenues $ 17,005,502 $ 3,108,345 $ 4,036,668 $ 1,678,419 $ 25,828,934
Operating expenses: Personnel services $ 470,688 $ 537,199 $ 824,680 $ 146,490 $ 1,979,057 Fringe benefits 158,233 196,023 321,048 56,507 731,811 Contractual services 148,780 25,054 22,006 153,925 349,765 Other charges 13,833,501 725,865 1,261,839 613,370 16,434,575 Depreciation 371,264 229,245 264,861 178,051 1,043,421
Total operating expenses $ 14,982,466 $ 1,713,386 $ 2,694,434 $ 1,148,343 $ 20,538,629
Operating income (loss) $ 2,023,036 $ 1,394,959 $ 1,342,234 $ 530,076 $ 5,290,305
Non-operating revenues (expenses): State grants $ 249,024 $ 122,593 $ - $ - $ 371,617 Federal grants 506,681 - - 1,000,000 1,506,681 Interest income - - 27,638 2,961 30,599 Interest expense (4,674) - (18,485) (114,072) (137,231)
Total non-operating revenues(expenses) $ 751,031 $ 122,593 $ 9,153 $ 888,889 $ 1,771,666
Income (loss) before transfers $ 2,774,067 $ 1,517,552 $ 1,351,387 $ 1,418,965 $ 7,061,971
Transfers: Transfers (out) (1,555,403) (1,241,750) (1,179,363) (35,122) (4,011,638)
Changes in net assets $ 1,218,664 $ 275,802 $ 172,024 $ 1,383,843 $ 3,050,333
Net assets at beginning of year 11,538,580 4,573,231 3,837,594 2,070,267 22,019,672
Net assets at end of year $ 12,757,244 $ 4,849,033 $ 4,009,618 $ 3,454,110 $ 25,070,005
The accompanying notes to financial statements are an integral part of this statement.
47
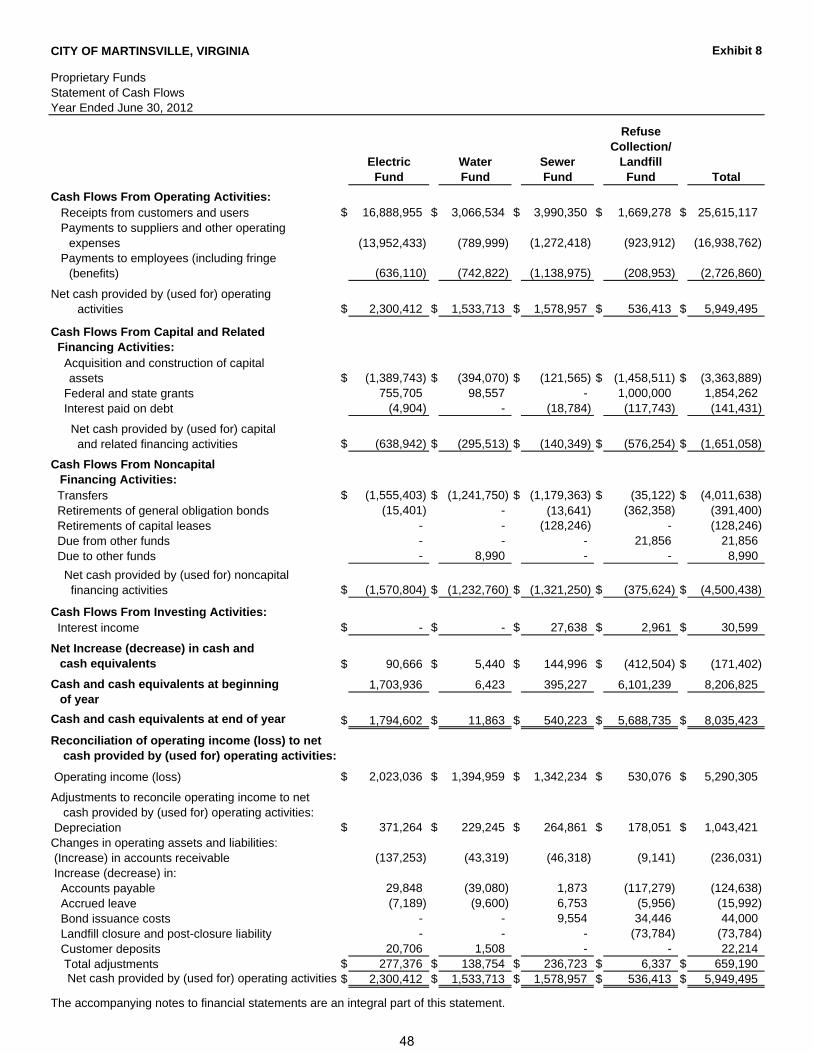
CITY OF MARTINSVILLE, VIRGINIA Exhibit 8
Proprietary FundsStatement of Cash FlowsYear Ended June 30, 2012
RefuseCollection/
Electric Water Sewer LandfillFund Fund Fund Fund Total
Cash Flows From Operating Activities: Receipts from customers and users $ 16,888,955 $ 3,066,534 $ 3,990,350 $ 1,669,278 $ 25,615,117 Payments to suppliers and other operating
expenses (13,952,433) (789,999) (1,272,418) (923,912) (16,938,762) Payments to employees (including fringe
(benefits) (636,110) (742,822) (1,138,975) (208,953) (2,726,860)
Net cash provided by (used for) operating activities $ 2,300,412 $ 1,533,713 $ 1,578,957 $ 536,413 $ 5,949,495
Cash Flows From Capital and Related Financing Activities: Acquisition and construction of capital
assets $ (1,389,743) $ (394,070) $ (121,565) $ (1,458,511) $ (3,363,889) Federal and state grants 755,705 98,557 - 1,000,000 1,854,262 Interest paid on debt (4,904) - (18,784) (117,743) (141,431)
Net cash provided by (used for) capital and related financing activities $ (638,942) $ (295,513) $ (140,349) $ (576,254) $ (1,651,058) Cash Flows From Noncapital
Financing Activities: Transfers $ (1,555,403) $ (1,241,750) $ (1,179,363) $ (35,122) $ (4,011,638) Retirements of general obligation bonds (15,401) - (13,641) (362,358) (391,400) Retirements of capital leases - - (128,246) - (128,246) Due from other funds - - - 21,856 21,856 Due to other funds - 8,990 - - 8,990
Net cash provided by (used for) noncapital financing activities $ (1,570,804) $ (1,232,760) $ (1,321,250) $ (375,624) $ (4,500,438)
Cash Flows From Investing Activities: Interest income $ - $ - $ 27,638 $ 2,961 $ 30,599
Net Increase (decrease) in cash andcash equivalents $ 90,666 $ 5,440 $ 144,996 $ (412,504) $ (171,402)
Cash and cash equivalents at beginning 1,703,936 6,423 395,227 6,101,239 8,206,825of year
Cash and cash equivalents at end of year $ 1,794,602 $ 11,863 $ 540,223 $ 5,688,735 $ 8,035,423
Reconciliation of operating income (loss) to net cash provided by (used for) operating activities:
Operating income (loss) $ 2,023,036 $ 1,394,959 $ 1,342,234 $ 530,076 $ 5,290,305
Adjustments to reconcile operating income to net cash provided by (used for) operating activities:
Depreciation $ 371,264 $ 229,245 $ 264,861 $ 178,051 $ 1,043,421Changes in operating assets and liabilities: (Increase) in accounts receivable (137,253) (43,319) (46,318) (9,141) (236,031) Increase (decrease) in: Accounts payable 29,848 (39,080) 1,873 (117,279) (124,638) Accrued leave (7,189) (9,600) 6,753 (5,956) (15,992) Bond issuance costs - - 9,554 34,446 44,000 Landfill closure and post-closure liability - - - (73,784) (73,784) Customer deposits 20,706 1,508 - - 22,214 Total adjustments $ 277,376 $ 138,754 $ 236,723 $ 6,337 $ 659,190 Net cash provided by (used for) operating activities $ 2,300,412 $ 1,533,713 $ 1,578,957 $ 536,413 $ 5,949,495
The accompanying notes to financial statements are an integral part of this statement.
48
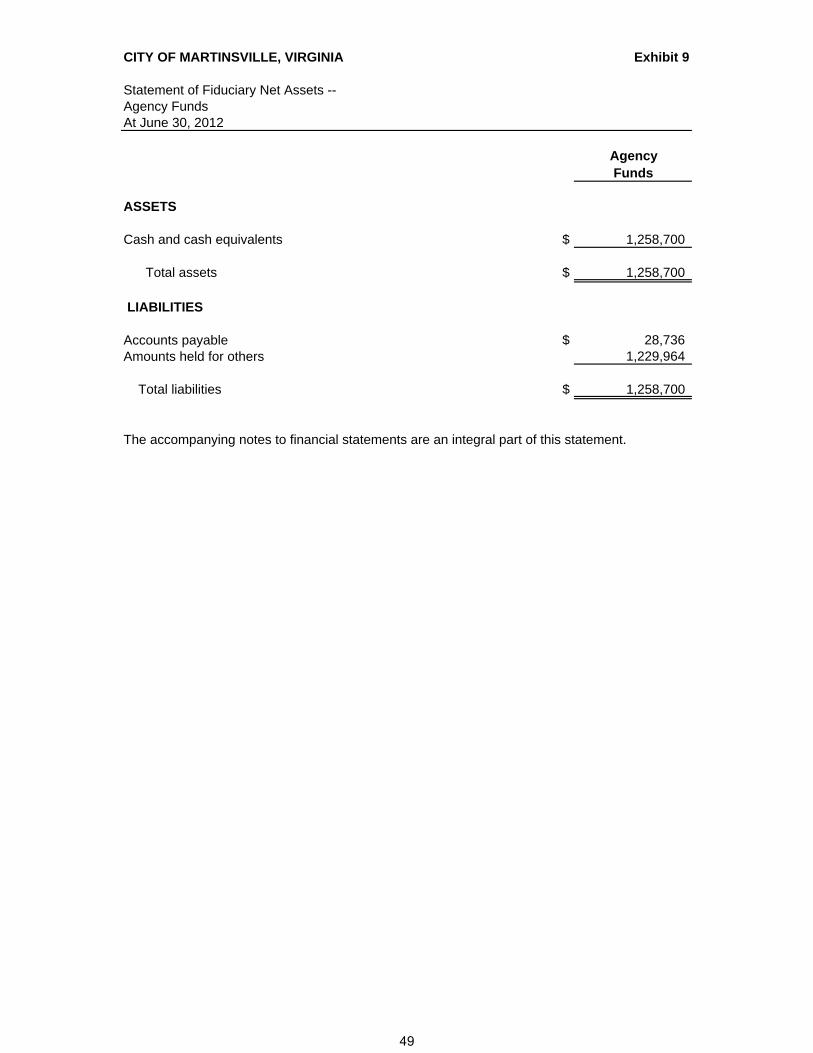
CITY OF MARTINSVILLE, VIRGINIA Exhibit 9
Statement of Fiduciary Net Assets --Agency FundsAt June 30, 2012
AgencyFunds
ASSETS
Cash and cash equivalents $ 1,258,700
Total assets $ 1,258,700
LIABILITIES
Accounts payable $ 28,736Amounts held for others 1,229,964
Total liabilities $ 1,258,700
The accompanying notes to financial statements are an integral part of this statement.
49

This page intentionally left blank

CITY OF MARTINSVILLE, VIRGINIA
Notes to Financial Statements As of June 30, 2012
Note 1—Summary of Significant Accounting Policies: The City of Martinsville, Virginia (the "City") was incorporated in 1940 and its current Charter was granted in 1942. The City operates under a Council/Manager form of government. The Council consists of a Mayor and four (4) council members. The Council is responsible for appointing the City Manager. The City provides a full range of services as authorized by its Charter. These services include police and fire protection; sanitation services; the construction and maintenance of highways, streets, and infrastructure; recreational activities, cultural events, education, social services, water and sewer and electric. The financial statements of the City of Martinsville, Virginia have been prepared in conformity with the specifications promulgated by the Auditor of Public Accounts (APA) of the Commonwealth of Virginia, and the accounting principles generally accepted in the United States as specified by the Governmental Accounting Standards Board. The more significant of the government’s accounting policies are described below. Management’s Discussion and Analysis - GASB Statement No. 34 requires the financial statements be accompanied by a narrative introduction and analytical overview of the government’s financial activities in the form of “management’s discussion and analysis” (MD&A). Government-wide and Fund Financial Statements Government-wide financial statements - The reporting model includes financial statements prepared using full accrual accounting for all of the government activities. This approach includes not just current assets and liabilities but also capital assets and long-term liabilities (such as buildings and general obligation debt). The government-wide financial statements (i.e., the statement of net assets and the statement of activities) report information on all of nonfiduciary activities of the primary government and its component unit. For the most part, the effect of interfund activity has been removed from these statements. Governmental activities, which normally are supported by taxes and intergovernmental revenues, are reported separately from business-type activities, which rely to a significant extent on fees and charges for support. Likewise, the primary government is reported separately from certain legally separate component units for which the primary government is financially accountable. Statement of Net Assets - The Statement of Net Assets is designed to display financial position of the primary government (government and business-type activities) and its discretely presented component unit. Governments will report all capital assets, in the government-wide Statement of Net Assets and will report depreciation expense - the cost of “using up” capital assets - in the Statement of Activities. The net assets of a government will be broken down into three categories - 1) invested in capital assets, net of related debt; 2) restricted; and 3) unrestricted.
51
CITY OF MARTINSVILLE, VIRGINIA Notes to Financial Statements As of June 30, 2012 (Continued)
Note 1—Summary of Significant Accounting Policies: (Continued) Statement of Activities - The government-wide statement of activities reports expenses and revenues in a format that focuses on the cost of each of the government’s functions. The expense of individual functions is compared to the revenues generated directly by the function (for instance, through user charges or intergovernmental grants). The statement of activities demonstrates the degree to which the direct expenses of a given function or segment are offset by program revenues. Direct expenses are those that are clearly identifiable with a specific function or segment. Program revenues include 1) charges to customers or applicants who purchase, use, or directly benefit from goods, services, or privileges provided by a given function or segment and 2) grants and contributions that are restricted to meeting the operational or capital requirements of a particular function or segment. Taxes and other items not properly included among program revenues are reported instead as general revenues. Fund Financial Statements - Separate financial statements are provided for governmental funds, proprietary funds, and fiduciary funds, even though the latter are excluded from the government-wide financial statements. Major individual governmental funds and major individual enterprise funds are reported as separate columns in the fund financial statements. Budgetary comparison schedules - Demonstrating compliance with the adopted budget is an important component of a government’s accountability to the public. Many citizens participate in one way or another in the process of establishing the annual operating budgets of state and local governments, and have a keen interest in following the actual financial progress of their governments over the course of the year. Many governments revise their original budgets over the course of the year for a variety of reasons. Under the GASB 34 reporting model, governments provide budgetary comparison information in their annual reports, including the government’s original budget, final budget and actual results. A. Financial Reporting Entity
The basic criterion for determining whether a governmental department, agency, institution, commission, public authority, or other governmental organization should be included in a primary governmental unit's reporting entity for the basic financial statements is financial accountability. Financial accountability includes the appointment of a voting majority of the organization’s governing body and the ability of the primary government to impose its will on the organization or if there is a financial benefit/burden relationship. In addition, an organization which is fiscally dependent on the primary government should be included in its reporting entity. These financial statements present the City of Martinsville (the primary government) and its component units. Blended component units, although legally separate entities, are, in substance, part of the government's operations and so data from these units are combined with data of the primary government. Each discretely presented component unit, on the other hand, is reported in a separate column in the combined financial statements to emphasize it is legally separate from the government.
52

CITY OF MARTINSVILLE, VIRGINIA Notes to Financial Statements As of June 30, 2012 (Continued)
Note 1—Summary of Significant Accounting Policies: (Continued) A. Individual Component Unit Disclosures
Blended Component Unit. The City has no blended component units at June 30, 2012. Discretely Presented Component Unit School Board. The School Board members are appointed by the City Council and are responsible for the operations of the City's School System within the City boundaries. The School Board is fiscally dependent on the City. The City has the ability to approve its budget and any amendments. The primary funding is from the General Fund of the City. The School Fund does not issue a separate financial report. The financial statements of the School Board are presented as a discrete presentation of the City financial statements for the fiscal year ended June 30, 2012.
C. Other Related Organizations Included in the City's Financial Report None Excluded from the City's Financial Report
Blue Ridge Regional Library — The Blue Ridge Regional Library is considered an intergovernmental (joint) venture and therefore its operations are not included in the City's financial statements. The counties of Henry and Patrick and the City provide the financial support for the Library and appoint its governing Board, in which is vested the ability to execute contracts and to budget and expend funds. No one locality contributes more than 50% of the Library's funding or has oversight responsibility over its operations.
Henry-Martinsville Social Services Board — The Henry-Martinsville Social Services Board is considered a component unit of Henry County and therefore its operations are not included in the City’s financial statements. Henry County and the City provide the financial support for the Board and appoint its governing Board. Henry County appoints 6 members of the Board and the City appoints 3 members.
D. Measurement Focus, Basis of Accounting and Financial Statement Presentation
The accompanying financial statements are prepared in accordance with pronouncements issued by the Governmental Accounting Standards Board. The principles prescribed by GASB represent generally accepted accounting principles applicable to governmental units. The City applies all GASB pronouncements as well as the Financial Accounting Standards Board pronouncements issued on or before November 30, 1989 unless these pronouncements conflict with or contradict GASB pronouncements.
53
CITY OF MARTINSVILLE, VIRGINIA Notes to Financial Statements As of June 30, 2012 (Continued)
Note 1—Summary of Significant Accounting Policies: (Continued)
D. Measurement Focus, Basis of Accounting and Financial Statement Presentation: (Continued)
The government-wide financial statements are reported using the economic resources measurement focus and the accrual basis of accounting, as are the proprietary fund financial statements. Revenues are recorded when earned and expenses are recorded when a liability is incurred, regardless of timing of related cash flows. Property taxes are recognized as revenues in the year for which they are levied. Grants and similar items are recognized as revenue as soon as all eligibility requirements imposed by the provider have been met. The government-wide statement of activities reflects both the gross and net cost per functional category (public safety, public works, health and welfare, etc.) which are otherwise being supported by general government revenues (property, sales and use taxes, certain intergovernmental revenues, fines, permits and charges, etc.). The Statement of Activities reduces gross expenses (including depreciation) by related program revenues, operating and capital grants, and contributions. The program revenues must be directly associated with the function (public safety, public works, health and welfare, etc.) or a business-type activity. Generally the effect of interfund activity has been eliminated from the City’s government-wide financial statements for internal service funds. Exceptions to our general rule are payments-in-lieu of taxes where the amounts are equivalent to interfund services provided and other charges between the government’s proprietary funds and various other functions of government. Elimination of these charges would distort the direct costs and program revenues reported for the various functions concerned. Governmental fund financial statements are reported using the current financial resources measurement focus and the modified accrual basis of accounting. This is the manner in which these funds are normally budgeted. Revenues are recognized as soon as they are both measurable and available. Revenues are considered to be available when they are collectible within the current period or soon enough thereafter to pay liabilities of the current period. For this purpose, the government considers revenues to be available if they are collected within 60 days of the end of the current fiscal period. All other revenue items are considered to be measurable and available only when cash is received by the government. Expenditures generally are recorded when a liability is incurred, as under accrual accounting. However, debt service expenditures as well as expenditures related to compensated absences and claims and judgments, are recorded only when payment is due. Property taxes, franchise taxes, licenses, and interest associated with the current fiscal period are all considered to be susceptible to accrual and so have been recognized as revenues of the current fiscal period. Accordingly, real and personal property taxes are recorded as revenues and receivables when billed, net of allowances for uncollectible amounts. Property taxes not collected within 60 days after year-end are reflected as deferred revenues. Sales and utility taxes, which are collected by the state or utilities and subsequently remitted to the City, are recognized as revenues and receivables upon collection by the state or utility, which is generally in the month preceding receipt by the City.
54
CITY OF MARTINSVILLE, VIRGINIA Notes to Financial Statements As of June 30, 2012 (Continued)
Note 1—Summary of Significant Accounting Policies: (Continued)
D. Measurement Focus, Basis of Accounting and Financial Statement Presentation: (Continued) Licenses, permits, fines and rents are recorded as revenues when received. Intergovernmental revenues, consisting primarily of federal, state and other grants for the purpose of funding specific expenditures, are recognized when earned or at the time of the specific expenditures. Revenues from general purpose grants are recognized in the period to which the grant applies. All other revenue items are considered to be measurable and available only when cash is received by the government.
In the fund financial statements, financial transactions and accounts of the City are organized on the basis of funds. The operation of each fund is considered to be an independent fiscal and separate accounting entity, with a self-balancing set of accounts recording cash and/or other financial resources together with all related liabilities and residual equities or balances, and changes therein, which are segregated for the purpose of carrying on specific activities or attaining certain objectives in accordance with special regulations, restrictions, or limitations. 1. Governmental Funds
Governmental Funds are those through which most governmental functions typically are financed. The City reports the following major governmental funds. The General Fund is the primary operating fund of the City. This fund is used to account for and report all financial resources except those required to be accounted for and reported in another fund. Revenues are derived primarily from property and other local taxes, state and federal distributions, licenses, permits, charges for service, and interest income. A significant part of the General Fund’s revenues is used principally to finance the operations of the Component Unit School Board. The Meals Tax fund is a Capital Projects Fund of the City. This fund accounts for and reports financial resources that are restricted, committed or assigned to expenditure for the acquisition or construction of major capital facilities. The City reports the following non-major governmental funds: Special Revenue Funds: Special Revenue Funds account for and report the proceeds of specific revenue sources that are restricted or committed to expenditure for specified purposes other than debt service or capital projects. Special Revenue Funds consist of the City Grants Fund and the Housing Choice Fund. Capital Projects Funds - The Capital Projects Funds account for and report financial resources that are restricted, committed or assigned to expenditure for capital outlays, except for those financed by proprietary funds or for assets held in trust for individuals, private organizations, or other governments. The only non-major Capital Projects Fund is the Capital Reserve Fund.
55
CITY OF MARTINSVILLE, VIRGINIA Notes to Financial Statements As of June 30, 2012 (Continued)
Note 1—Summary of Significant Accounting Policies: (Continued)
D. Measurement Focus, Basis of Accounting and Financial Statement Presentation: (Continued) 2. Proprietary Funds – account for operations that are financed in a manner similar to private business
enterprises. The Proprietary Fund measurement focus is upon determination of net income, financial position, and changes in financial position. Proprietary Funds consist of Enterprise Funds. The City reports the electric, water, sewer and refuse collection/landfill funds as major enterprise funds.
Enterprise Funds – Enterprise funds distinguish operating revenues and expenses from nonoperating items. Operating revenues and expenses generally result from providing services and producing and delivering goods in connection with a proprietary fund’s principal ongoing operations. The principal operating revenues of the City’s enterprise funds are charges to customers for sales and services. Operating expenses for enterprise funds include the cost of sales and services, administrative expenses, and depreciation on capital assets. All revenues and expenses not meeting this definition are reported as non-operating revenues and expenses.
When both restricted and unrestricted resources are available for use, it is the government’s policy to use restricted resources first, then unrestricted resources as they are needed.
Fiduciary Funds – (Trust and Agency Funds) – account for assets held by the City unit in a trustee capacity or as an agent or custodian for individuals, private organizations, other governmental units, or other funds. These funds include Agency Funds. Agency funds utilize the accrual basis of accounting to recognize receivables and payables. Fiduciary funds are not included in the government-wide financial statements. Agency funds include the Insurance Fund, Sheriff’s Fund, West Piedmont Business Development Center Fund (WPBDC), Police Academy Fund, and the Southern Virginia Recreation Facility Authority Fund.
The City applies all GASB pronouncements as well as the Financial Accounting Standards Board pronouncements issued on or before November 30, 1989 unless these pronouncements conflict with or contradict GASB pronouncements.
As a general rule the effect of interfund activity has been eliminated from the government-wide financial statements. Exceptions to this general rule are charges between the government’s Electric, Water, Sewer, and Refuse Collection/Landfill funds and various other functions of the government. Elimination of these charges would distort the direct costs and program revenues reported for the various funds concerned.
E. Cash and Cash Equivalents
Cash and cash equivalents include amounts in demand deposits as well as short-term investments with a maturity date within three months of the date acquired by the government.
56
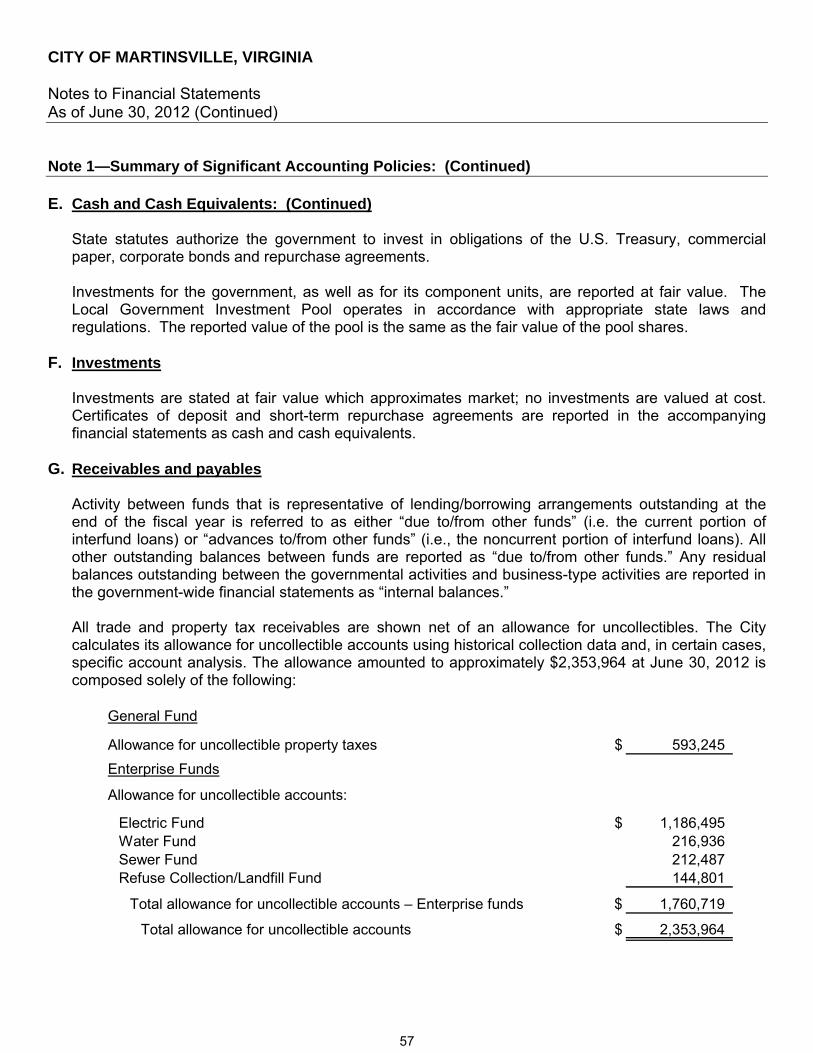
CITY OF MARTINSVILLE, VIRGINIA Notes to Financial Statements As of June 30, 2012 (Continued)
Note 1—Summary of Significant Accounting Policies: (Continued)
E. Cash and Cash Equivalents: (Continued) State statutes authorize the government to invest in obligations of the U.S. Treasury, commercial paper, corporate bonds and repurchase agreements. Investments for the government, as well as for its component units, are reported at fair value. The Local Government Investment Pool operates in accordance with appropriate state laws and regulations. The reported value of the pool is the same as the fair value of the pool shares.
F. Investments
Investments are stated at fair value which approximates market; no investments are valued at cost. Certificates of deposit and short-term repurchase agreements are reported in the accompanying financial statements as cash and cash equivalents.
G. Receivables and payables
Activity between funds that is representative of lending/borrowing arrangements outstanding at the end of the fiscal year is referred to as either “due to/from other funds” (i.e. the current portion of interfund loans) or “advances to/from other funds” (i.e., the noncurrent portion of interfund loans). All other outstanding balances between funds are reported as “due to/from other funds.” Any residual balances outstanding between the governmental activities and business-type activities are reported in the government-wide financial statements as “internal balances.”
All trade and property tax receivables are shown net of an allowance for uncollectibles. The City calculates its allowance for uncollectible accounts using historical collection data and, in certain cases, specific account analysis. The allowance amounted to approximately $2,353,964 at June 30, 2012 is composed solely of the following:
General Fund
Allowance for uncollectible property taxes $ 593,245
Enterprise Funds
Allowance for uncollectible accounts:
Electric Fund $ 1,186,495Water Fund 216,936Sewer Fund 212,487Refuse Collection/Landfill Fund 144,801
Total allowance for uncollectible accounts – Enterprise funds $ 1,760,719
Total allowance for uncollectible accounts $ 2,353,964
57

CITY OF MARTINSVILLE, VIRGINIA Notes to Financial Statements As of June 30, 2012 (Continued)
Note 1—Summary of Significant Accounting Policies: (Continued) G. Receivables and payables: (Continued)
Real and Personal Property Tax Data: The tax calendars for real and personal property taxes are summarized below.
Real Property Personal Property
Levy January 1 January 1Due Date December 5/June 5 December 5th
(50% each date)Lien Date January 1 January 1
The City bills and collects its own property taxes.
H. Inventory
Inventory consists of expendable supplies held for consumption and commercial and residential property held for resale. Inventories are valued at cost or weighted average cost for the supplies held for consumption.
I. Prepaid Items
Payments made for services that will benefit periods beyond June 30 are reported as prepaid items using the consumption method by recording a current asset for the prepaid amount at the time of purchase and reflecting the expenditure/expense in the year in which the services are consumed.
J. Capital Assets
Capital assets, which include property, plant and equipment, are reported in the applicable governmental columns in the government-wide financial statements. Capital assets are defined by the City as land, buildings, road registered vehicles, and equipment with an initial individual cost of more than $5,000 (amount not rounded) and an estimated useful life in excess of two years. Such assets are recorded at historical cost or estimated historical cost if purchased or constructed. Donated capital assets are recorded at estimated fair market value at the date of donation.
The costs of normal maintenance and repairs that do not add to the value of the asset or materially extend the asset’s life are not capitalized.
Major outlays for capital assets and improvements are capitalized as projects are constructed. Interest incurred during the construction phase of capital assets of business-type activities is included as part of the capitalized value of the assets constructed. Interest attributable to capitalized assets as of June 30, 2012 was immaterial.
58
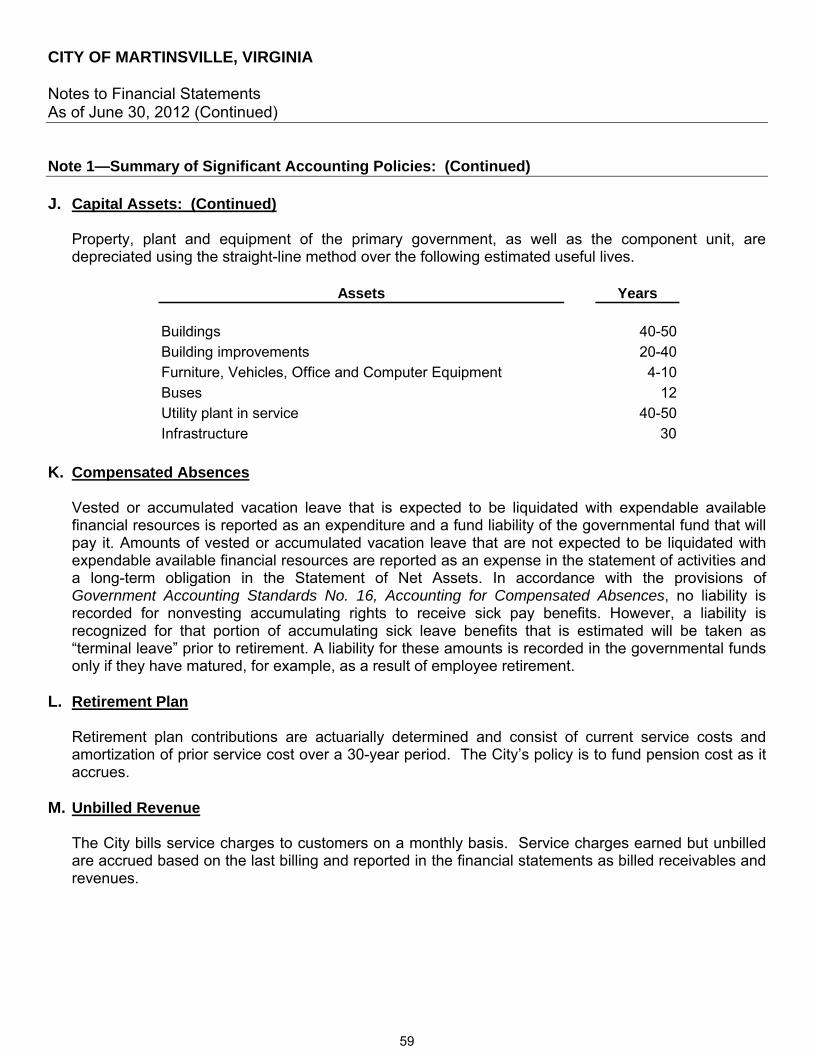
CITY OF MARTINSVILLE, VIRGINIA Notes to Financial Statements As of June 30, 2012 (Continued)
Note 1—Summary of Significant Accounting Policies: (Continued) J. Capital Assets: (Continued)
Property, plant and equipment of the primary government, as well as the component unit, are depreciated using the straight-line method over the following estimated useful lives.
Assets Years
Buildings 40-50Building improvements 20-40Furniture, Vehicles, Office and Computer Equipment 4-10Buses 12Utility plant in service 40-50Infrastructure 30
K. Compensated Absences
Vested or accumulated vacation leave that is expected to be liquidated with expendable available financial resources is reported as an expenditure and a fund liability of the governmental fund that will pay it. Amounts of vested or accumulated vacation leave that are not expected to be liquidated with expendable available financial resources are reported as an expense in the statement of activities and a long-term obligation in the Statement of Net Assets. In accordance with the provisions of Government Accounting Standards No. 16, Accounting for Compensated Absences, no liability is recorded for nonvesting accumulating rights to receive sick pay benefits. However, a liability is recognized for that portion of accumulating sick leave benefits that is estimated will be taken as “terminal leave” prior to retirement. A liability for these amounts is recorded in the governmental funds only if they have matured, for example, as a result of employee retirement.
L. Retirement Plan
Retirement plan contributions are actuarially determined and consist of current service costs and amortization of prior service cost over a 30-year period. The City’s policy is to fund pension cost as it accrues.
M. Unbilled Revenue
The City bills service charges to customers on a monthly basis. Service charges earned but unbilled are accrued based on the last billing and reported in the financial statements as billed receivables and revenues.
59

CITY OF MARTINSVILLE, VIRGINIA Notes to Financial Statements As of June 30, 2012 (Continued)
Note 1—Summary of Significant Accounting Policies: (Continued) N. Use of Estimates
The preparation of financial statements in conformity with generally accepted accounting principles requires management to make estimates and assumptions that affect certain reported amounts and disclosures. Accordingly, actual results could differ from those estimates.
O. Fund Equity
Beginning with fiscal year 2011, the City implemented GASB Statement 54, Fund Balance Reporting and Governmental Fund Type Definitions. This Statement provides more clearly defined fund balance categories to make the nature and extent of the constraints placed on a government’s fund balance more transparent. The following classifications describe the relative strength of the spending constraints placed on the purposes for which resources can be used:
Nonspendable fund balance – amounts that are not in spendable form (such as inventory and prepaids) or are required to be maintained intact (corpus of a permanent fund);
Restricted fund balance – amounts constrained to specific purposes by their providers (such as grantors, bondholders, and higher levels of government), through constitutional provisions, or by enabling legislation;
Committed fund balance – amounts constrained to specific purposes by a government itself, using its highest level of decision-making authority; to be reported as committed, amounts cannot be used for any other purpose unless the government takes the same highest level action to remove or change the constraint;
Assigned fund balance – amounts a government intends to use for a specific purpose; intent can be expressed by the governing body or by an official or body to which the governing body delegates the authority;
Unassigned fund balance – amounts that are available for any purpose; positive amounts are only reported in the general fund.
When fund balance resources are available for a specific purpose in more than one classification, it is the City’s policy to use the most restrictive funds first in the following order: restricted, committed, assigned, and unassigned as they are needed.
City Council establishes (and modifies or rescinds) fund balance commitments by passage of a resolution. This is typically done through adoption and amendment of the budget. A fund balance commitment is further indicated in the budget document as a designation or commitment of the fund (such as for special incentives). Assigned fund balance is established by City Council through adoption or amendment of the budget as intended for specific purpose (such as the purchase of capital assets, construction, debt service, or for other purposes).
60
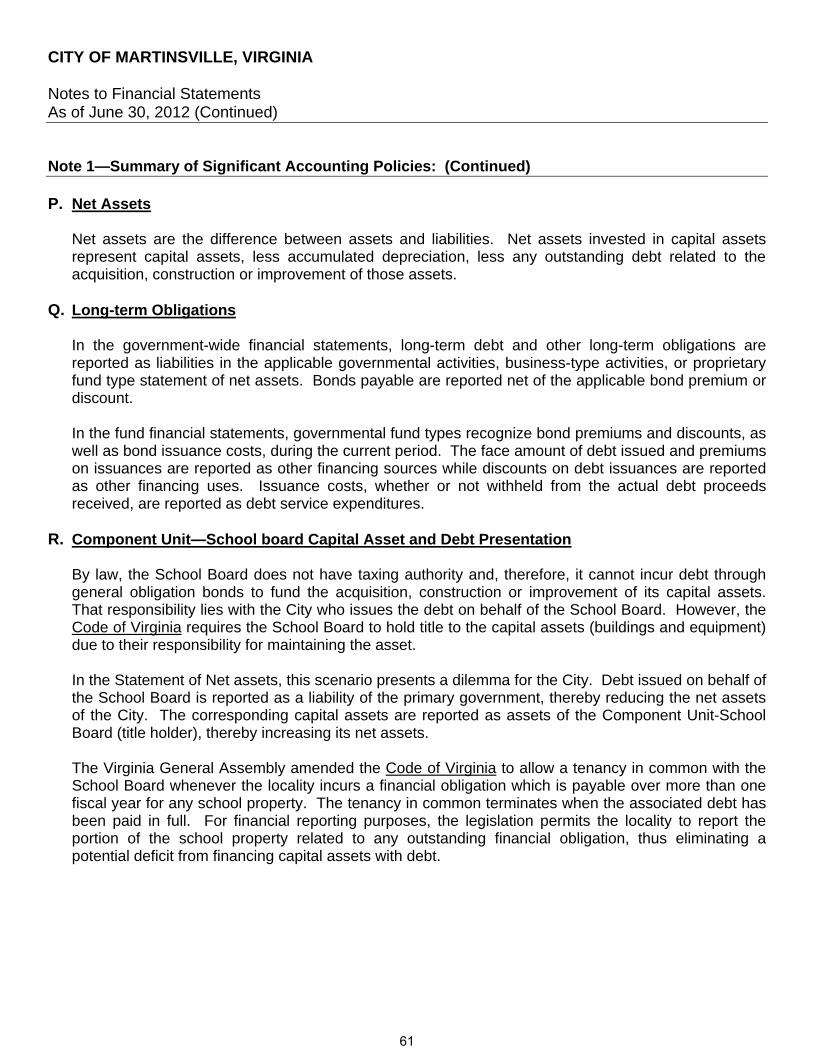
CITY OF MARTINSVILLE, VIRGINIA Notes to Financial Statements As of June 30, 2012 (Continued)
Note 1—Summary of Significant Accounting Policies: (Continued) P. Net Assets
Net assets are the difference between assets and liabilities. Net assets invested in capital assets represent capital assets, less accumulated depreciation, less any outstanding debt related to the acquisition, construction or improvement of those assets.
Q. Long-term Obligations
In the government-wide financial statements, long-term debt and other long-term obligations are reported as liabilities in the applicable governmental activities, business-type activities, or proprietary fund type statement of net assets. Bonds payable are reported net of the applicable bond premium or discount.
In the fund financial statements, governmental fund types recognize bond premiums and discounts, as well as bond issuance costs, during the current period. The face amount of debt issued and premiums on issuances are reported as other financing sources while discounts on debt issuances are reported as other financing uses. Issuance costs, whether or not withheld from the actual debt proceeds received, are reported as debt service expenditures.
R. Component Unit—School board Capital Asset and Debt Presentation
By law, the School Board does not have taxing authority and, therefore, it cannot incur debt through general obligation bonds to fund the acquisition, construction or improvement of its capital assets. That responsibility lies with the City who issues the debt on behalf of the School Board. However, the Code of Virginia requires the School Board to hold title to the capital assets (buildings and equipment) due to their responsibility for maintaining the asset.
In the Statement of Net assets, this scenario presents a dilemma for the City. Debt issued on behalf of the School Board is reported as a liability of the primary government, thereby reducing the net assets of the City. The corresponding capital assets are reported as assets of the Component Unit-School Board (title holder), thereby increasing its net assets. The Virginia General Assembly amended the Code of Virginia to allow a tenancy in common with the School Board whenever the locality incurs a financial obligation which is payable over more than one fiscal year for any school property. The tenancy in common terminates when the associated debt has been paid in full. For financial reporting purposes, the legislation permits the locality to report the portion of the school property related to any outstanding financial obligation, thus eliminating a potential deficit from financing capital assets with debt.
61
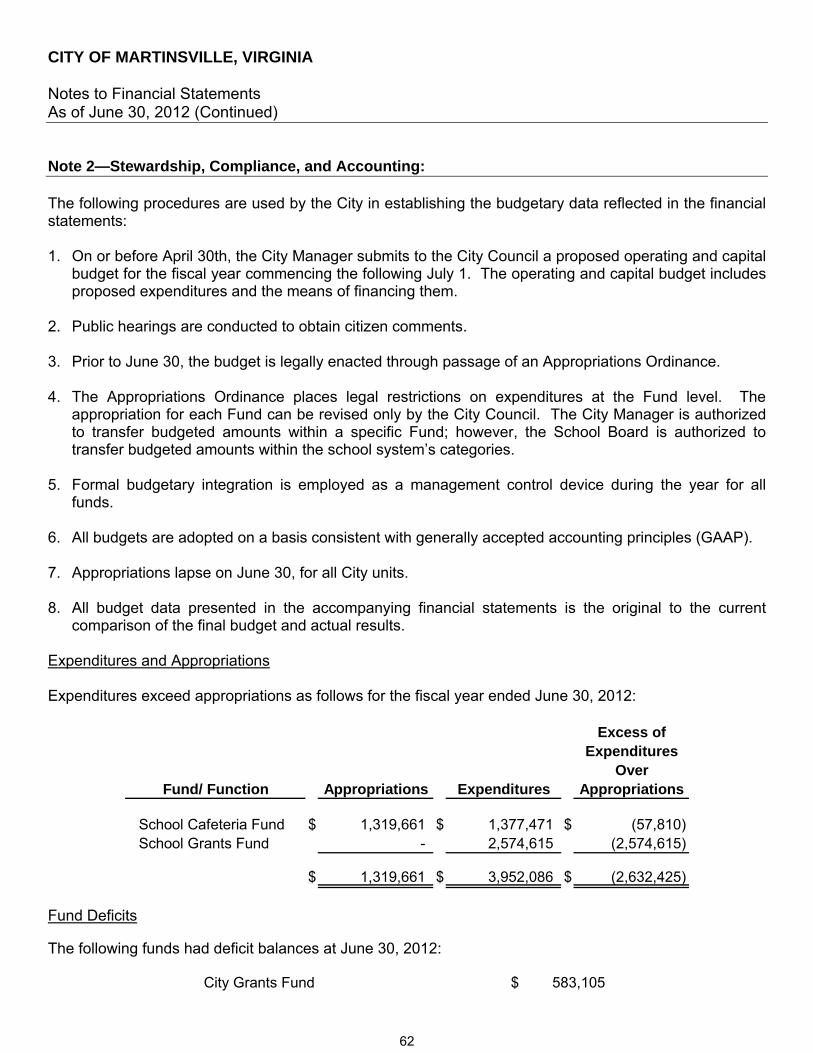
CITY OF MARTINSVILLE, VIRGINIA Notes to Financial Statements As of June 30, 2012 (Continued)
Note 2—Stewardship, Compliance, and Accounting: The following procedures are used by the City in establishing the budgetary data reflected in the financial statements: 1. On or before April 30th, the City Manager submits to the City Council a proposed operating and capital
budget for the fiscal year commencing the following July 1. The operating and capital budget includes proposed expenditures and the means of financing them.
2. Public hearings are conducted to obtain citizen comments. 3. Prior to June 30, the budget is legally enacted through passage of an Appropriations Ordinance. 4. The Appropriations Ordinance places legal restrictions on expenditures at the Fund level. The
appropriation for each Fund can be revised only by the City Council. The City Manager is authorized to transfer budgeted amounts within a specific Fund; however, the School Board is authorized to transfer budgeted amounts within the school system’s categories.
5. Formal budgetary integration is employed as a management control device during the year for all
funds. 6. All budgets are adopted on a basis consistent with generally accepted accounting principles (GAAP). 7. Appropriations lapse on June 30, for all City units. 8. All budget data presented in the accompanying financial statements is the original to the current
comparison of the final budget and actual results. Expenditures and Appropriations Expenditures exceed appropriations as follows for the fiscal year ended June 30, 2012:
Excess ofExpenditures
OverFund/ Function Appropriations Expenditures Appropriations
School Cafeteria Fund $ 1,319,661 $ 1,377,471 $ (57,810) School Grants Fund - 2,574,615 (2,574,615)
$ 1,319,661 $ 3,952,086 $ (2,632,425)
Fund Deficits The following funds had deficit balances at June 30, 2012:
City Grants Fund $ 583,105
62
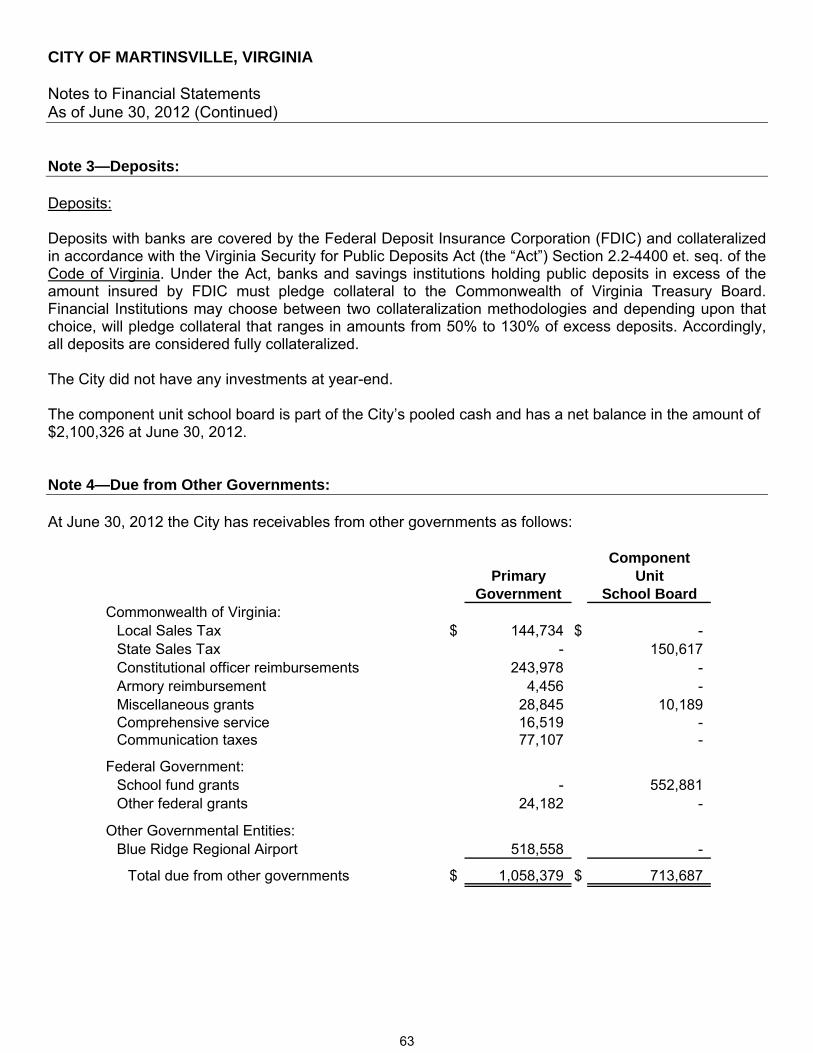
CITY OF MARTINSVILLE, VIRGINIA Notes to Financial Statements As of June 30, 2012 (Continued)
Note 3—Deposits: Deposits: Deposits with banks are covered by the Federal Deposit Insurance Corporation (FDIC) and collateralized in accordance with the Virginia Security for Public Deposits Act (the “Act”) Section 2.2-4400 et. seq. of the Code of Virginia. Under the Act, banks and savings institutions holding public deposits in excess of the amount insured by FDIC must pledge collateral to the Commonwealth of Virginia Treasury Board. Financial Institutions may choose between two collateralization methodologies and depending upon that choice, will pledge collateral that ranges in amounts from 50% to 130% of excess deposits. Accordingly, all deposits are considered fully collateralized. The City did not have any investments at year-end. The component unit school board is part of the City’s pooled cash and has a net balance in the amount of $2,100,326 at June 30, 2012. Note 4—Due from Other Governments: At June 30, 2012 the City has receivables from other governments as follows:
ComponentPrimary Unit
Government School BoardCommonwealth of Virginia:
Local Sales Tax $ 144,734 $ - State Sales Tax - 150,617 Constitutional officer reimbursements 243,978 - Armory reimbursement 4,456 - Miscellaneous grants 28,845 10,189 Comprehensive service 16,519 - Communication taxes 77,107 -
Federal Government:School fund grants - 552,881 Other federal grants 24,182 -
Other Governmental Entities:Blue Ridge Regional Airport 518,558 -
Total due from other governments $ 1,058,379 $ 713,687
63
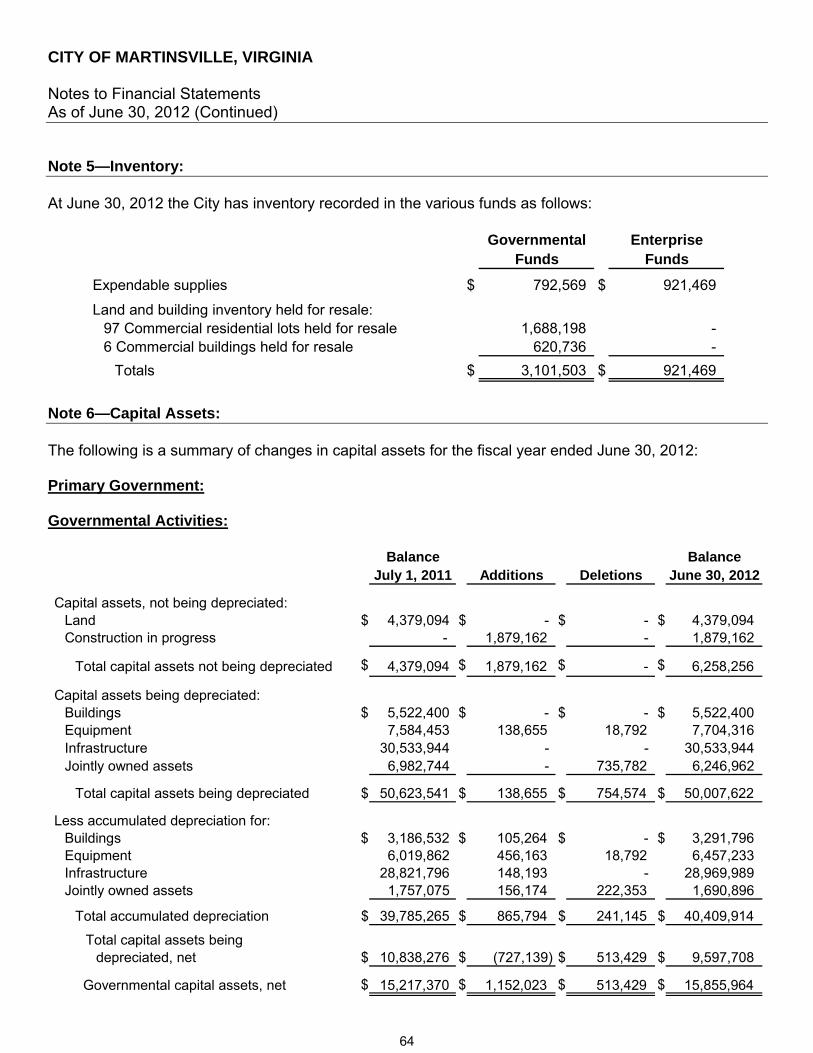
CITY OF MARTINSVILLE, VIRGINIA Notes to Financial Statements As of June 30, 2012 (Continued)
Note 5—Inventory: At June 30, 2012 the City has inventory recorded in the various funds as follows:
Governmental EnterpriseFunds Funds
Expendable supplies $ 792,569 $ 921,469
Land and building inventory held for resale:97 Commercial residential lots held for resale 1,688,198 - 6 Commercial buildings held for resale 620,736 -
Totals $ 3,101,503 $ 921,469
Note 6—Capital Assets: The following is a summary of changes in capital assets for the fiscal year ended June 30, 2012: Primary Government: Governmental Activities:
Balance BalanceJuly 1, 2011 Additions Deletions June 30, 2012
Capital assets, not being depreciated:Land $ 4,379,094 $ - $ - $ 4,379,094 Construction in progress - 1,879,162 - 1,879,162
Total capital assets not being depreciated $ 4,379,094 $ 1,879,162 $ - $ 6,258,256
Capital assets being depreciated:Buildings $ 5,522,400 $ - $ - $ 5,522,400 Equipment 7,584,453 138,655 18,792 7,704,316 Infrastructure 30,533,944 - - 30,533,944 Jointly owned assets 6,982,744 - 735,782 6,246,962
Total capital assets being depreciated $ 50,623,541 $ 138,655 $ 754,574 $ 50,007,622
Less accumulated depreciation for:Buildings $ 3,186,532 $ 105,264 $ - $ 3,291,796 Equipment 6,019,862 456,163 18,792 6,457,233 Infrastructure 28,821,796 148,193 - 28,969,989 Jointly owned assets 1,757,075 156,174 222,353 1,690,896
Total accumulated depreciation $ 39,785,265 $ 865,794 $ 241,145 $ 40,409,914
Total capital assets being depreciated, net $ 10,838,276 $ (727,139) $ 513,429 $ 9,597,708
Governmental capital assets, net $ 15,217,370 $ 1,152,023 $ 513,429 $ 15,855,964
64
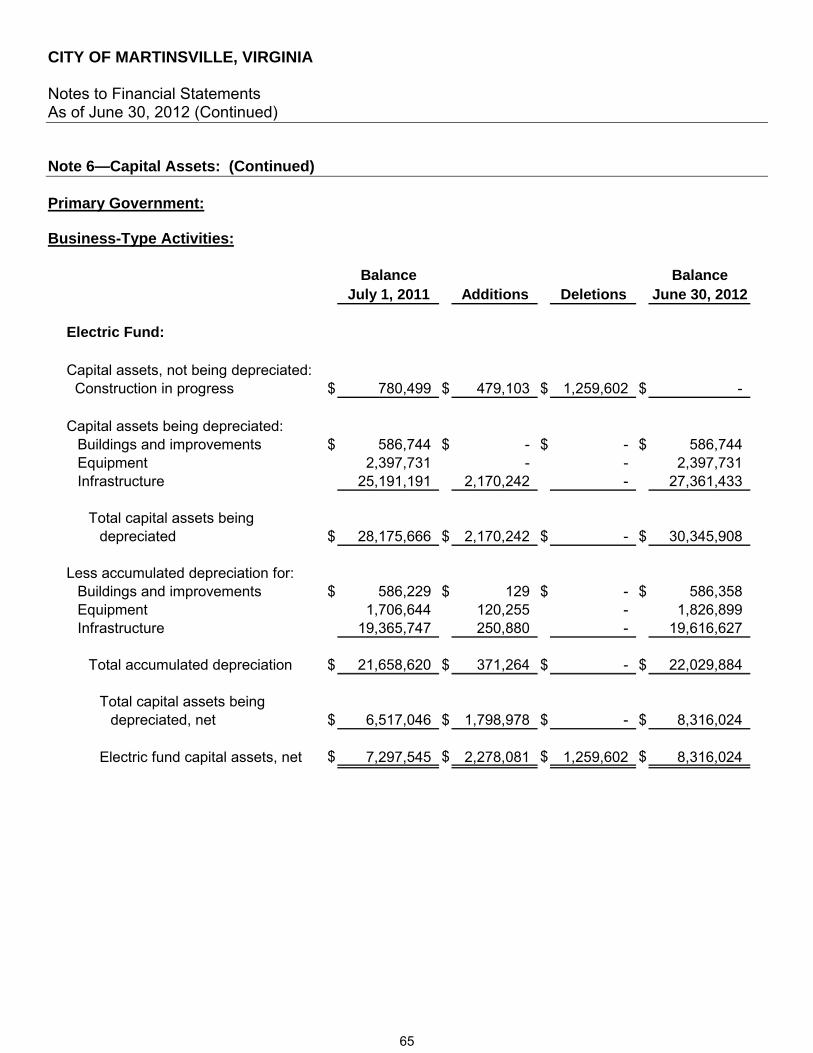
CITY OF MARTINSVILLE, VIRGINIA Notes to Financial Statements As of June 30, 2012 (Continued)
Note 6—Capital Assets: (Continued) Primary Government: Business-Type Activities:
Balance BalanceJuly 1, 2011 Additions Deletions June 30, 2012
Electric Fund:
Capital assets, not being depreciated: Construction in progress $ 780,499 $ 479,103 $ 1,259,602 $ -
Capital assets being depreciated:Buildings and improvements $ 586,744 $ - $ - $ 586,744 Equipment 2,397,731 - - 2,397,731 Infrastructure 25,191,191 2,170,242 - 27,361,433
Total capital assets being depreciated $ 28,175,666 $ 2,170,242 $ - $ 30,345,908
Less accumulated depreciation for:Buildings and improvements $ 586,229 $ 129 $ - $ 586,358 Equipment 1,706,644 120,255 - 1,826,899 Infrastructure 19,365,747 250,880 - 19,616,627
Total accumulated depreciation $ 21,658,620 $ 371,264 $ - $ 22,029,884
Total capital assets being depreciated, net $ 6,517,046 $ 1,798,978 $ - $ 8,316,024
Electric fund capital assets, net $ 7,297,545 $ 2,278,081 $ 1,259,602 $ 8,316,024
65

CITY OF MARTINSVILLE, VIRGINIA Notes to Financial Statements As of June 30, 2012 (Continued)
Note 6—Capital Assets: (Continued) Primary Government: (Continued) Business-Type Activities: (Continued)
Balance BalanceJuly 1, 2011 Additions Deletions June 30, 2012
Water Fund:
Capital assets, not being depreciated:Land and land improvements $ 658,224 $ - $ - $ 658,224
Capital assets being depreciated:Buildings and improvements $ 1,572,636 $ - $ - $ 1,572,636 Equipment 1,438,201 2,315 - 1,440,516 Infrastructure 10,994,862 391,755 - 11,386,617
Total capital assets being depreciated $ 14,005,699 $ 394,070 $ - $ 14,399,769
Less accumulated depreciation for:Buildings and improvements $ 991,114 $ 35,716 $ - $ 1,026,830 Equipment 906,450 46,007 - 952,457 Infrastructure 8,578,805 147,522 - 8,726,327
Total accumulated depreciation $ 10,476,369 $ 229,245 $ - $ 10,705,614
Total capital assets being depreciated, net $ 3,529,330 $ 164,825 $ - $ 3,694,155
Water fund capital assets, net $ 4,187,554 $ 164,825 $ - $ 4,352,379
66
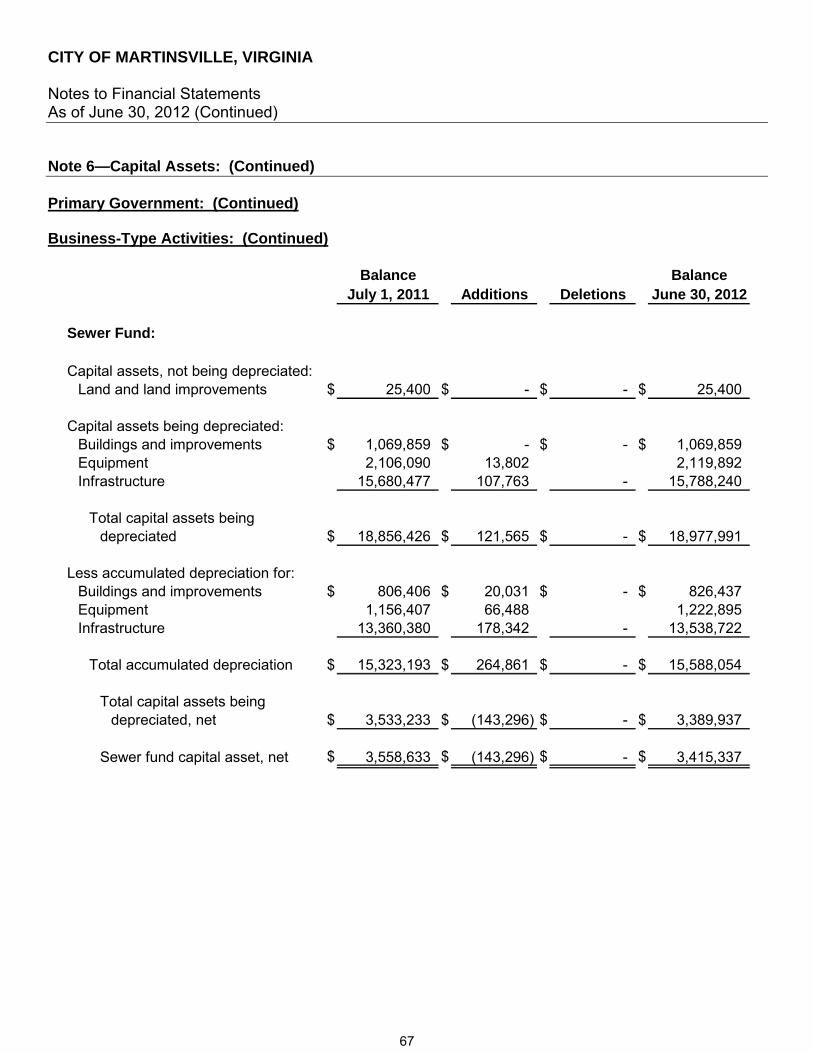
CITY OF MARTINSVILLE, VIRGINIA Notes to Financial Statements As of June 30, 2012 (Continued)
Note 6—Capital Assets: (Continued) Primary Government: (Continued) Business-Type Activities: (Continued)
Balance BalanceJuly 1, 2011 Additions Deletions June 30, 2012
Sewer Fund:
Capital assets, not being depreciated:Land and land improvements $ 25,400 $ - $ - $ 25,400
Capital assets being depreciated:Buildings and improvements $ 1,069,859 $ - $ - $ 1,069,859 Equipment 2,106,090 13,802 2,119,892 Infrastructure 15,680,477 107,763 - 15,788,240
Total capital assets being depreciated $ 18,856,426 $ 121,565 $ - $ 18,977,991
Less accumulated depreciation for:Buildings and improvements $ 806,406 $ 20,031 $ - $ 826,437 Equipment 1,156,407 66,488 1,222,895 Infrastructure 13,360,380 178,342 - 13,538,722
Total accumulated depreciation $ 15,323,193 $ 264,861 $ - $ 15,588,054
Total capital assets being depreciated, net $ 3,533,233 $ (143,296) $ - $ 3,389,937
Sewer fund capital asset, net $ 3,558,633 $ (143,296) $ - $ 3,415,337
67
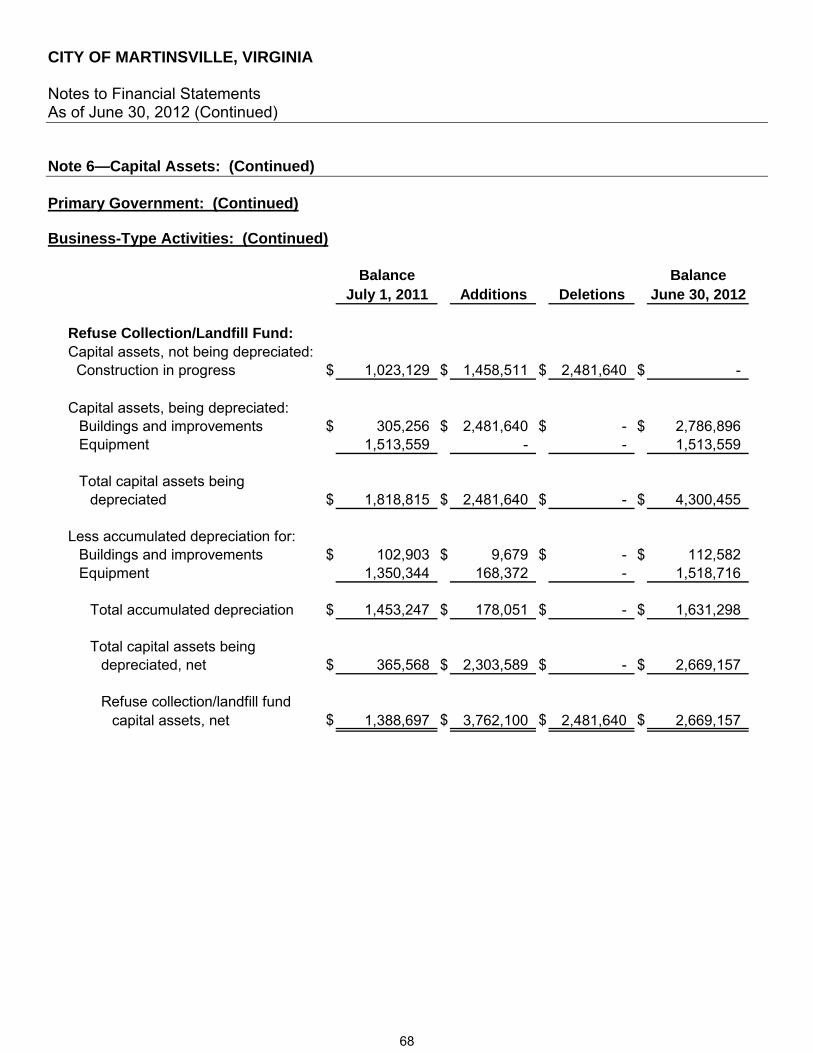
CITY OF MARTINSVILLE, VIRGINIA Notes to Financial Statements As of June 30, 2012 (Continued)
Note 6—Capital Assets: (Continued) Primary Government: (Continued) Business-Type Activities: (Continued)
Balance BalanceJuly 1, 2011 Additions Deletions June 30, 2012
Refuse Collection/Landfill Fund:Capital assets, not being depreciated: Construction in progress $ 1,023,129 $ 1,458,511 $ 2,481,640 $ -
Capital assets, being depreciated:Buildings and improvements $ 305,256 $ 2,481,640 $ - $ 2,786,896 Equipment 1,513,559 - - 1,513,559
Total capital assets being depreciated $ 1,818,815 $ 2,481,640 $ - $ 4,300,455
Less accumulated depreciation for:Buildings and improvements $ 102,903 $ 9,679 $ - $ 112,582 Equipment 1,350,344 168,372 - 1,518,716
Total accumulated depreciation $ 1,453,247 $ 178,051 $ - $ 1,631,298
Total capital assets being depreciated, net $ 365,568 $ 2,303,589 $ - $ 2,669,157
Refuse collection/landfill fund capital assets, net $ 1,388,697 $ 3,762,100 $ 2,481,640 $ 2,669,157
68
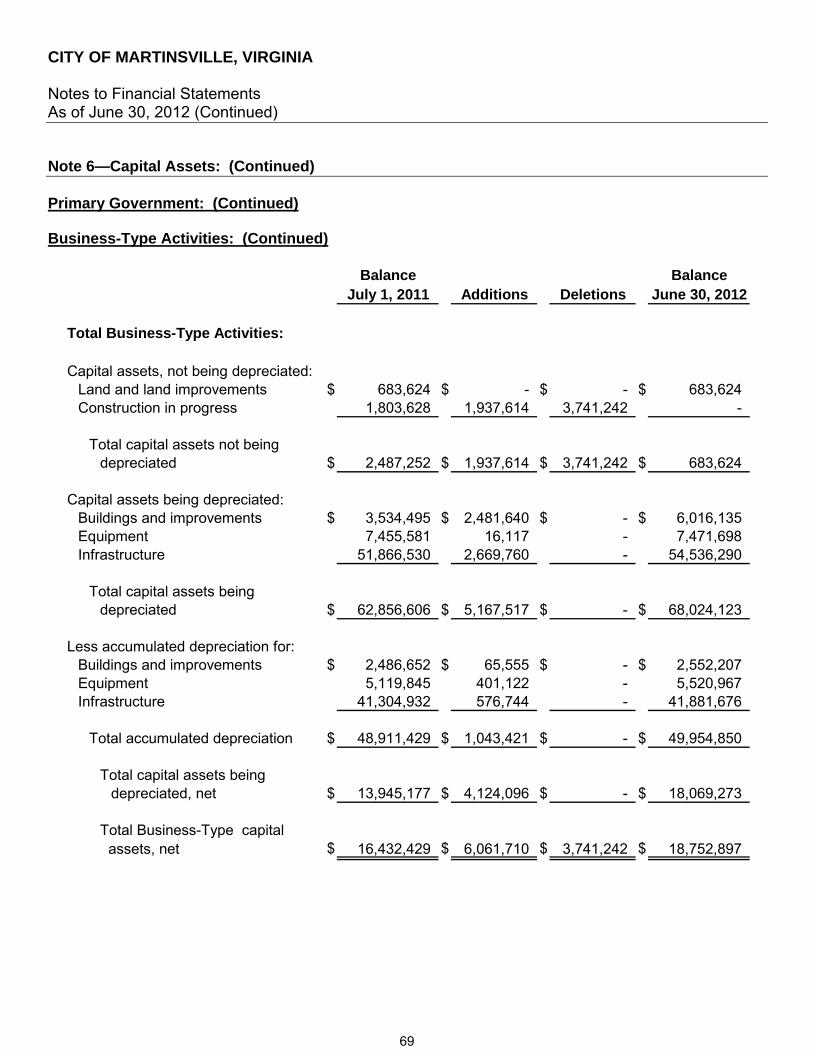
CITY OF MARTINSVILLE, VIRGINIA Notes to Financial Statements As of June 30, 2012 (Continued)
Note 6—Capital Assets: (Continued) Primary Government: (Continued) Business-Type Activities: (Continued)
Balance BalanceJuly 1, 2011 Additions Deletions June 30, 2012
Total Business-Type Activities:
Capital assets, not being depreciated:Land and land improvements $ 683,624 $ - $ - $ 683,624 Construction in progress 1,803,628 1,937,614 3,741,242 -
Total capital assets not being depreciated $ 2,487,252 $ 1,937,614 $ 3,741,242 $ 683,624
Capital assets being depreciated:Buildings and improvements $ 3,534,495 $ 2,481,640 $ - $ 6,016,135 Equipment 7,455,581 16,117 - 7,471,698 Infrastructure 51,866,530 2,669,760 - 54,536,290
Total capital assets being depreciated $ 62,856,606 $ 5,167,517 $ - $ 68,024,123
Less accumulated depreciation for:Buildings and improvements $ 2,486,652 $ 65,555 $ - $ 2,552,207 Equipment 5,119,845 401,122 - 5,520,967 Infrastructure 41,304,932 576,744 - 41,881,676
Total accumulated depreciation $ 48,911,429 $ 1,043,421 $ - $ 49,954,850
Total capital assets being depreciated, net $ 13,945,177 $ 4,124,096 $ - $ 18,069,273
Total Business-Type capital assets, net $ 16,432,429 $ 6,061,710 $ 3,741,242 $ 18,752,897
69
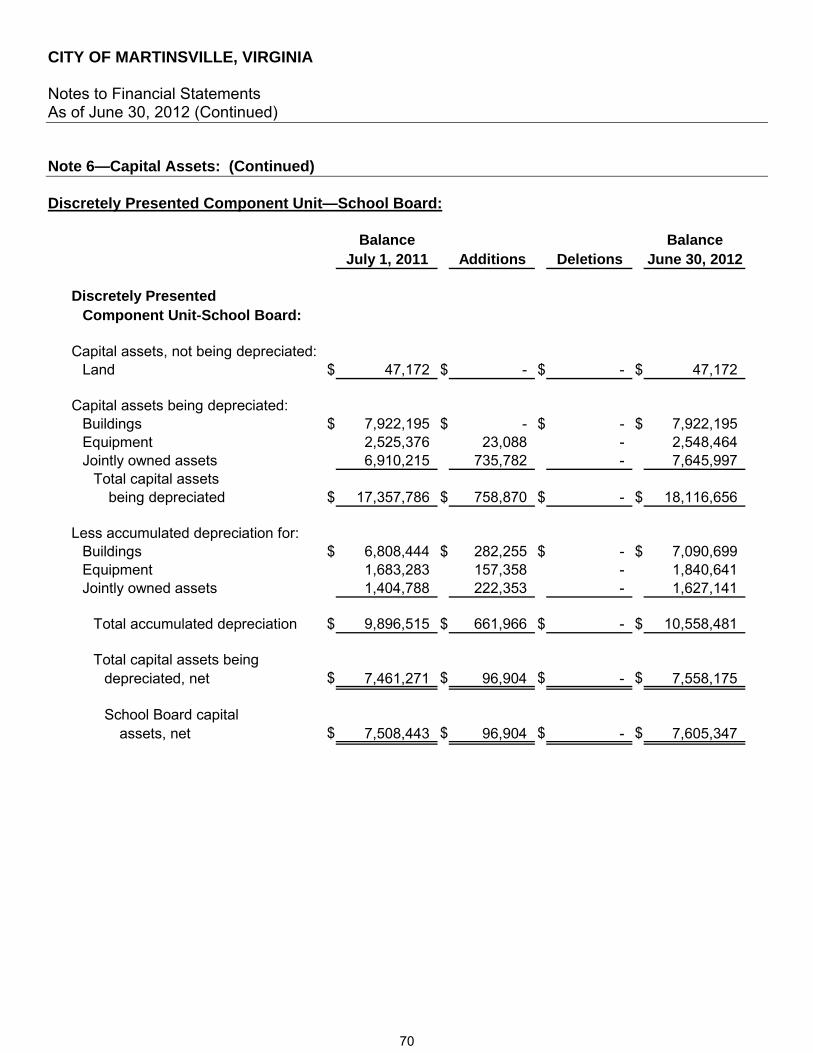
CITY OF MARTINSVILLE, VIRGINIA Notes to Financial Statements As of June 30, 2012 (Continued)
Note 6—Capital Assets: (Continued) Discretely Presented Component Unit—School Board:
Balance BalanceJuly 1, 2011 Additions Deletions June 30, 2012
Discretely Presented Component Unit-School Board:
Capital assets, not being depreciated:Land $ 47,172 $ - $ - $ 47,172
Capital assets being depreciated:Buildings $ 7,922,195 $ - $ - $ 7,922,195 Equipment 2,525,376 23,088 - 2,548,464 Jointly owned assets 6,910,215 735,782 - 7,645,997
Total capital assets being depreciated $ 17,357,786 $ 758,870 $ - $ 18,116,656
Less accumulated depreciation for:Buildings $ 6,808,444 $ 282,255 $ - $ 7,090,699 Equipment 1,683,283 157,358 - 1,840,641 Jointly owned assets 1,404,788 222,353 - 1,627,141
Total accumulated depreciation $ 9,896,515 $ 661,966 $ - $ 10,558,481
Total capital assets being depreciated, net $ 7,461,271 $ 96,904 $ - $ 7,558,175
School Board capital assets, net $ 7,508,443 $ 96,904 $ - $ 7,605,347
70
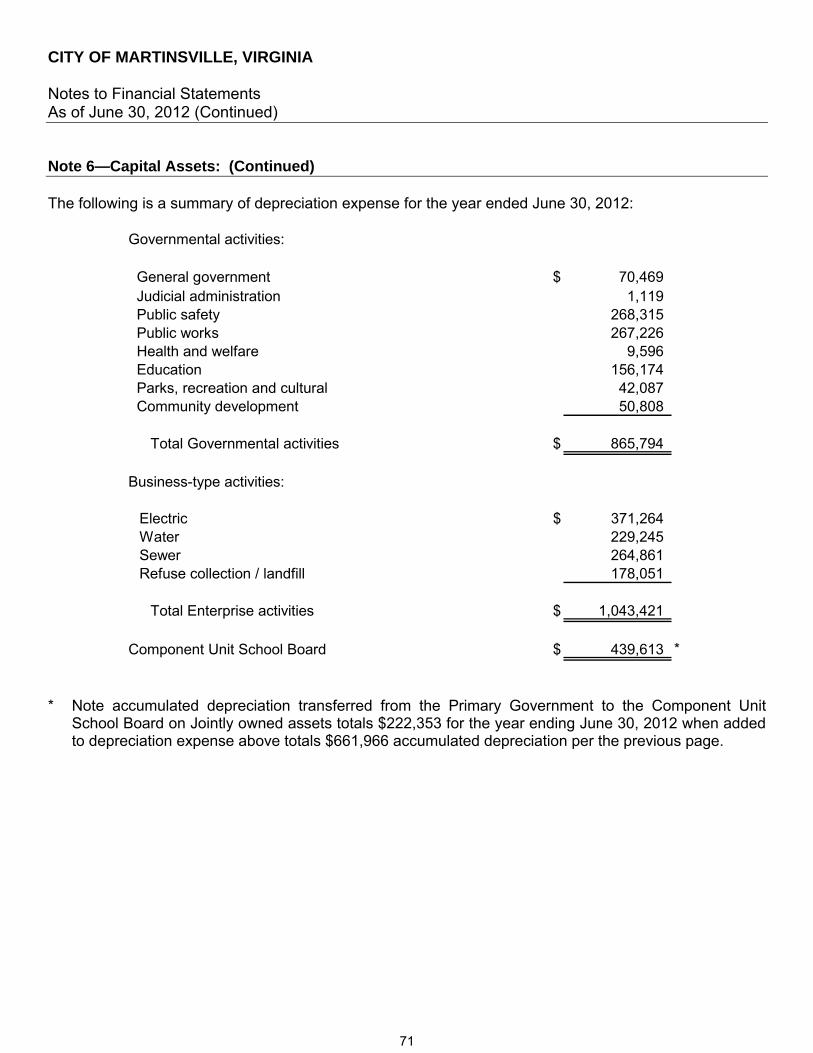
CITY OF MARTINSVILLE, VIRGINIA Notes to Financial Statements As of June 30, 2012 (Continued)
Note 6—Capital Assets: (Continued)
The following is a summary of depreciation expense for the year ended June 30, 2012:
Governmental activities:
General government $ 70,469 Judicial administration 1,119 Public safety 268,315 Public works 267,226 Health and welfare 9,596 Education 156,174 Parks, recreation and cultural 42,087 Community development 50,808
Total Governmental activities $ 865,794
Business-type activities:
Electric $ 371,264 Water 229,245 Sewer 264,861 Refuse collection / landfill 178,051
Total Enterprise activities $ 1,043,421
Component Unit School Board $ 439,613 *
* Note accumulated depreciation transferred from the Primary Government to the Component Unit
School Board on Jointly owned assets totals $222,353 for the year ending June 30, 2012 when added to depreciation expense above totals $661,966 accumulated depreciation per the previous page.
71
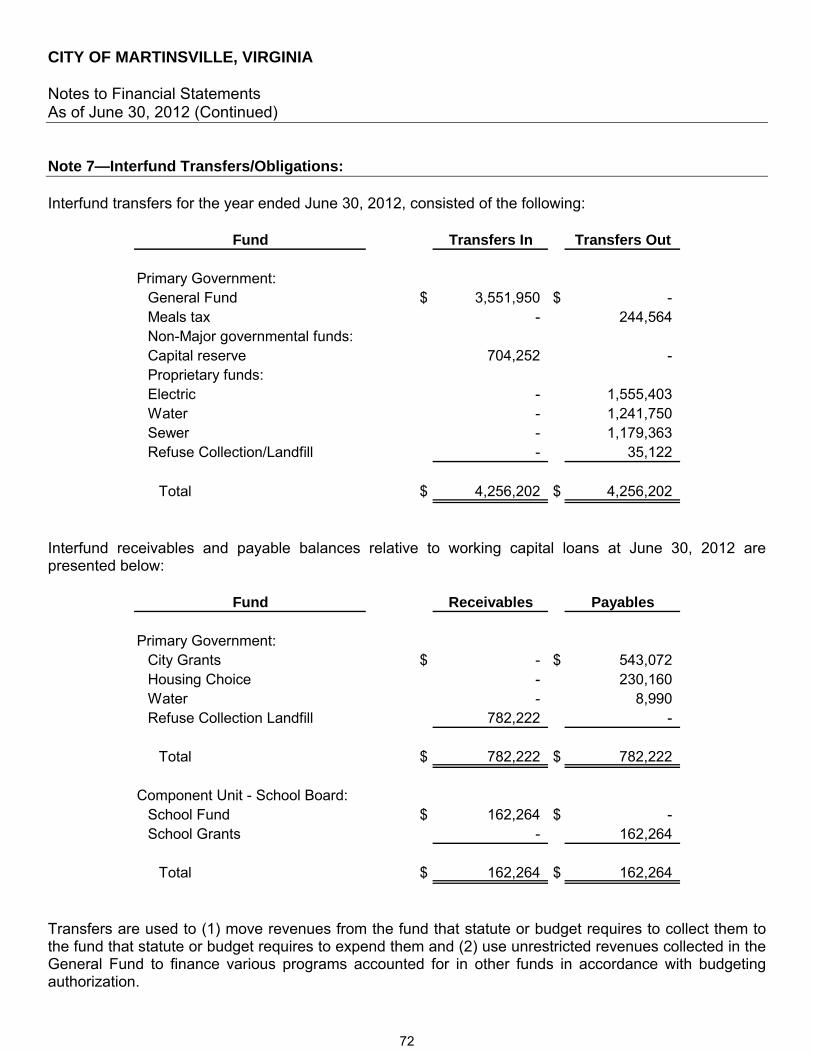
CITY OF MARTINSVILLE, VIRGINIA Notes to Financial Statements As of June 30, 2012 (Continued)
Note 7—Interfund Transfers/Obligations: Interfund transfers for the year ended June 30, 2012, consisted of the following:
Fund Transfers In Transfers Out
Primary Government:General Fund $ 3,551,950 $ - Meals tax - 244,564 Non-Major governmental funds:Capital reserve 704,252 - Proprietary funds:Electric - 1,555,403 Water - 1,241,750 Sewer - 1,179,363 Refuse Collection/Landfill - 35,122
Total $ 4,256,202 $ 4,256,202
Interfund receivables and payable balances relative to working capital loans at June 30, 2012 are presented below:
Fund Receivables Payables
Primary Government:City Grants $ - $ 543,072 Housing Choice - 230,160 Water - 8,990 Refuse Collection Landfill 782,222 -
Total $ 782,222 $ 782,222
Component Unit - School Board:School Fund $ 162,264 $ - School Grants - 162,264
Total $ 162,264 $ 162,264
Transfers are used to (1) move revenues from the fund that statute or budget requires to collect them to the fund that statute or budget requires to expend them and (2) use unrestricted revenues collected in the General Fund to finance various programs accounted for in other funds in accordance with budgeting authorization.
72

CITY OF MARTINSVILLE, VIRGINIA Notes to Financial Statements As of June 30, 2012 (Continued)
Note 8—Long-Term Obligations: Primary Government: The following is a summary of change in long-term obligations for the fiscal year ended June 30, 2012:
Amounts Amounts AmountsPayable Payable at Dueat July 1, June 30, Within
2011 Increases Decreases 2012 One Year
Governmental Obligations: Incurred by City
Compensated absences $ 498,937 $ 128,484 $ 141,264 $ 486,157 $ 48,616 G.O. Bonds 2,473,800 1,250,000 243,500 3,480,300 319,100 G.O. Notes 340,000 - - 340,000 - Other post employment benefits 106,000 45,000 - 151,000 - Capital lease obligations 173,630 - 114,948 58,682 58,682
Total incurred by City $ 3,592,367 $ 1,423,484 $ 499,712 $ 4,516,139 $ 426,398
Incurred by School Board:State Literary Fund Loans $ 5,250,000 $ - $ 625,000 $ 4,625,000 $ 625,000 G.O. Bonds 1,732,744 9,300,000 110,782 10,921,962 126,543 Capital lease 152,017 - 113,612 38,405 38,405
Total incurred by School Board $ 7,134,761 $ 9,300,000 $ 849,394 $ 15,585,367 $ 789,948
Total Governmental Obligations $ 10,727,128 $ 10,723,484 $ 1,349,106 $ 20,101,506 $ 1,216,346
Business-type Obligations:Compensated absences $ 178,959 $ 21,451 $ 37,444 $ 162,966 $ 16,297 General obligation bond 3,075,100 - 391,400 2,683,700 404,000 Capital lease obligations 193,719 - 128,245 65,474 65,474 Landfill closure and post-
closure costs 3,513,294 - 73,784 3,439,510 127,389
Total Business-type Obligations $ 6,961,072 $ 21,451 $ 630,873 $ 6,351,650 $ 613,160
Total Primary Government $ 17,688,200 $ 10,744,935 $ 1,979,979 $ 26,453,156 $ 1,829,506
The City’s General Fund and meals tax fund are responsible for repaying the City’s long-term obligation amounts.
73
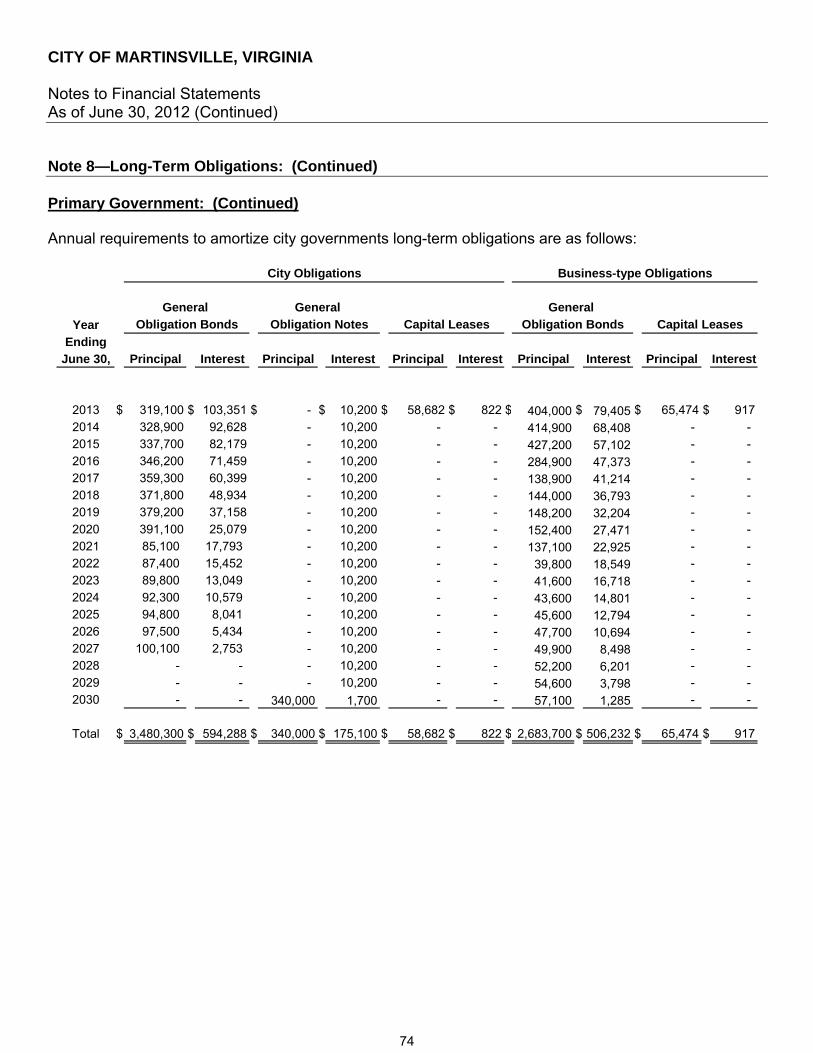
CITY OF MARTINSVILLE, VIRGINIA Notes to Financial Statements As of June 30, 2012 (Continued)
Note 8—Long-Term Obligations: (Continued) Primary Government: (Continued) Annual requirements to amortize city governments long-term obligations are as follows:
Year
EndingJune 30, Principal Interest Principal Interest Principal Interest Principal Interest Principal Interest
2013 $ 319,100 $ 103,351 $ - $ 10,200 $ 58,682 $ 822 $ 404,000 $ 79,405 $ 65,474 $ 917
2014 328,900 92,628 - 10,200 - - 414,900 68,408 - - 2015 337,700 82,179 - 10,200 - - 427,200 57,102 - -
2016 346,200 71,459 - 10,200 - - 284,900 47,373 - - 2017 359,300 60,399 - 10,200 - - 138,900 41,214 - -
2018 371,800 48,934 - 10,200 - - 144,000 36,793 - - 2019 379,200 37,158 - 10,200 - - 148,200 32,204 - -
2020 391,100 25,079 - 10,200 - - 152,400 27,471 - - 2021 85,100 17,793 - 10,200 - - 137,100 22,925 - -
2022 87,400 15,452 - 10,200 - - 39,800 18,549 - - 2023 89,800 13,049 - 10,200 - - 41,600 16,718 - -
2024 92,300 10,579 - 10,200 - - 43,600 14,801 - - 2025 94,800 8,041 - 10,200 - - 45,600 12,794 - -
2026 97,500 5,434 - 10,200 - - 47,700 10,694 - -
2027 100,100 2,753 - 10,200 - - 49,900 8,498 - - 2028 - - - 10,200 - - 52,200 6,201 - -
2029 - - - 10,200 - - 54,600 3,798 - - 2030 - - 340,000 1,700 - - 57,100 1,285 - -
Total $ 3,480,300 $ 594,288 $ 340,000 $ 175,100 $ 58,682 $ 822 $ 2,683,700 $ 506,232 $ 65,474 $ 917
Obligation Notes
General
Capital Leases
Business-type Obligations
Obligation Bonds Capital Leases
City Obligations
General
Obligation Bonds
General
74

CITY OF MARTINSVILLE, VIRGINIA Notes to Financial Statements As of June 30, 2012 (Continued)
Note 8—Long-Term Obligations: (Continued) Primary Government: (Continued)
YearEnding
June 30, Principal Interest Principal Interest Principal Interest
2013 $ 625,000 $ 138,750 $ 126,543 $ 475,028 $ 38,405 $ 3312014 625,000 120,000 150,114 470,698 - - 2015 625,000 101,250 174,096 466,273 - - 2016 625,000 82,500 198,486 461,748 - - 2017 625,000 63,750 220,827 457,116 - - 2018 375,000 45,000 493,803 452,373 - - 2019 375,000 33,750 512,124 447,512 - - 2020 375,000 22,500 528,439 442,528 - -
2021 375,000 11,250 701,458 437,414 - - 2022 - - 1,092,959 432,163 - - 2023 - - 777,465 427,179 - - 2024 - - 780,079 422,065 - - 2025 - - 783,241 416,403 - - 2026 - - 786,569 410,575 - - 2027 - - 790,070 404,574 - - 2028 - - 793,755 398,389 - - 2029 - - 670,644 395,250 - - 2030 - - 670,644 395,250 - - 2031 - - 670,644 197,625 - -
Total $ 4,625,000 $ 618,750 $ 10,921,960 $ 8,010,163 $ 38,405 $ 331
State LiteraryCity School Obligations
Fund Loans Obligation Bonds
School Board
Capital LeasesGeneral
75
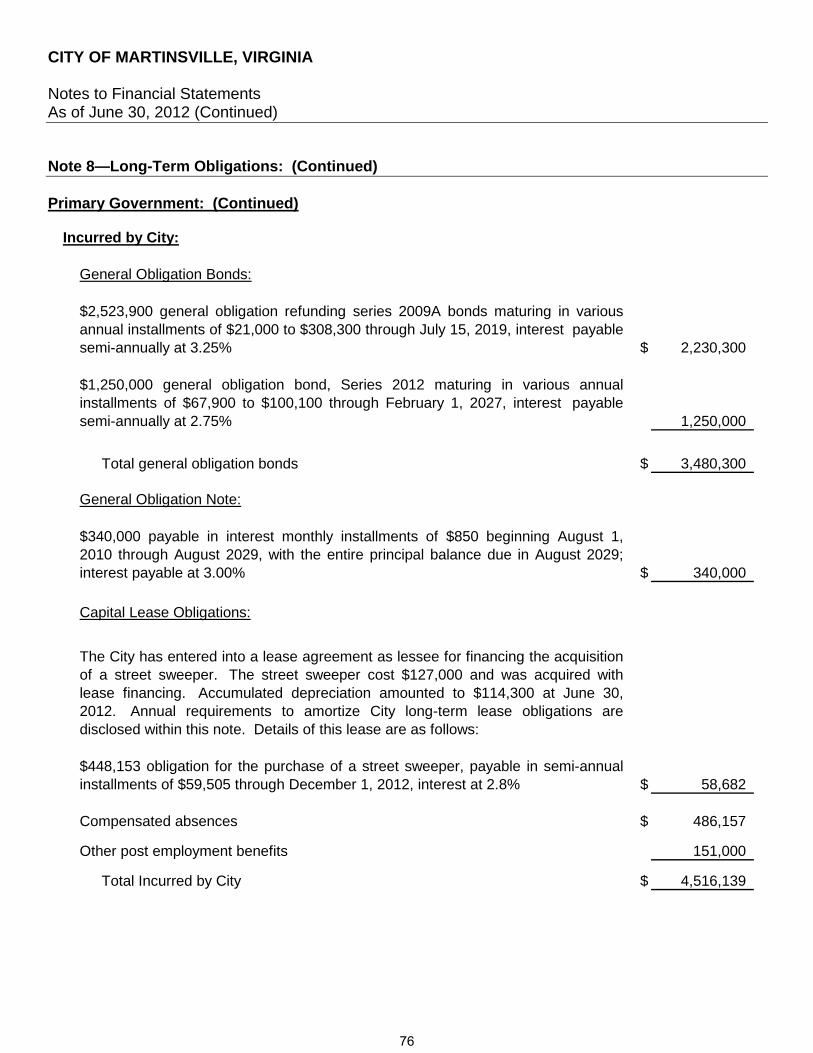
CITY OF MARTINSVILLE, VIRGINIA Notes to Financial Statements As of June 30, 2012 (Continued)
Note 8—Long-Term Obligations: (Continued) Primary Government: (Continued)
Incurred by City:
General Obligation Bonds:
$2,523,900 general obligation refunding series 2009A bonds maturing in variousannual installments of $21,000 to $308,300 through July 15, 2019, interest payablesemi-annually at 3.25% $ 2,230,300
$1,250,000 general obligation bond, Series 2012 maturing in various annualinstallments of $67,900 to $100,100 through February 1, 2027, interest payablesemi-annually at 2.75% 1,250,000
Total general obligation bonds $ 3,480,300
General Obligation Note:
$340,000 payable in interest monthly installments of $850 beginning August 1,2010 through August 2029, with the entire principal balance due in August 2029;interest payable at 3.00% $ 340,000
Capital Lease Obligations:
The City has entered into a lease agreement as lessee for financing the acquisitionof a street sweeper. The street sweeper cost $127,000 and was acquired withlease financing. Accumulated depreciation amounted to $114,300 at June 30,2012. Annual requirements to amortize City long-term lease obligations aredisclosed within this note. Details of this lease are as follows:
$448,153 obligation for the purchase of a street sweeper, payable in semi-annualinstallments of $59,505 through December 1, 2012, interest at 2.8% $ 58,682
Compensated absences $ 486,157
Other post employment benefits 151,000
Total Incurred by City $ 4,516,139
76
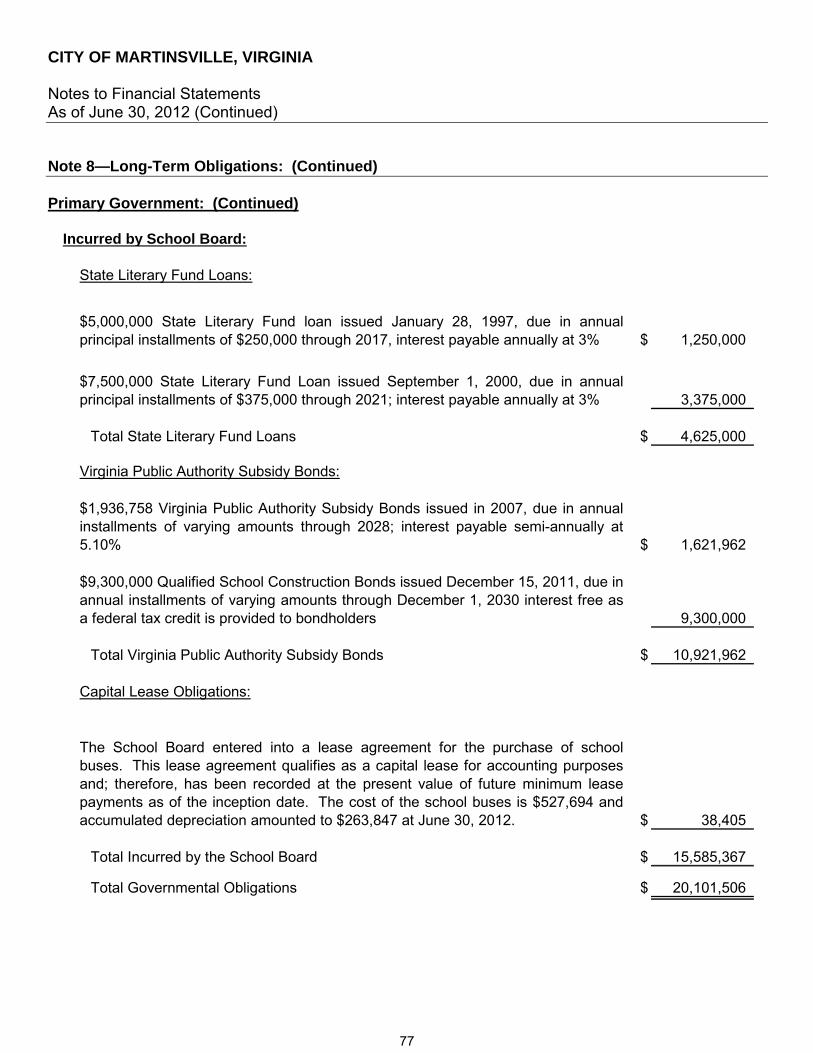
CITY OF MARTINSVILLE, VIRGINIA Notes to Financial Statements As of June 30, 2012 (Continued)
Note 8—Long-Term Obligations: (Continued) Primary Government: (Continued)
Incurred by School Board:
State Literary Fund Loans:
$5,000,000 State Literary Fund loan issued January 28, 1997, due in annualprincipal installments of $250,000 through 2017, interest payable annually at 3% $ 1,250,000
$7,500,000 State Literary Fund Loan issued September 1, 2000, due in annualprincipal installments of $375,000 through 2021; interest payable annually at 3% 3,375,000
Total State Literary Fund Loans $ 4,625,000
Virginia Public Authority Subsidy Bonds:
$1,936,758 Virginia Public Authority Subsidy Bonds issued in 2007, due in annualinstallments of varying amounts through 2028; interest payable semi-annually at5.10% $ 1,621,962
$9,300,000 Qualified School Construction Bonds issued December 15, 2011, due inannual installments of varying amounts through December 1, 2030 interest free asa federal tax credit is provided to bondholders 9,300,000
Total Virginia Public Authority Subsidy Bonds $ 10,921,962
Capital Lease Obligations:
The School Board entered into a lease agreement for the purchase of schoolbuses. This lease agreement qualifies as a capital lease for accounting purposesand; therefore, has been recorded at the present value of future minimum leasepayments as of the inception date. The cost of the school buses is $527,694 andaccumulated depreciation amounted to $263,847 at June 30, 2012. $ 38,405
Total Incurred by the School Board $ 15,585,367
Total Governmental Obligations $ 20,101,506
77

CITY OF MARTINSVILLE, VIRGINIA Notes to Financial Statements As of June 30, 2012 (Continued)
Note 8—Long-Term Obligations: (Continued) Primary Government: (Continued)
Business-type Obligations:
General Obligation Bonds:
$1,782,700 noncapital-related general obligation refunding series 2009B bondsmaturing in various annual installments of $149,900 to $296,100 through July 15,2015, interest payable semi-annually at 2.50% $ 1,016,100
$190,000 capital-related general obligation series 2009A bonds maturing in variousannual installments of $14,900 to $20,000 through July 15, 2019, interest payablesemi-annually at 3.25% 143,200
$770,100 capital-related general obligation series 2009B bonds maturing in variousannual installments of $24,300 to $57,100 through July 15, 2029, interest payablesemi-annually at 4.50% 720,400
$880,000 capital-related general obligation series 2010 bonds maturing in variousannual installments of $76,000 to $99,000 through February 1, 2021, interestpayable semi-annually at 2.65% 804,000
Total general obligation bonds $ 2,683,700
Capital Lease Obligations:
The City entered into a lease agreement for the purchase of a sludge press. Thislease agreement qualifies as a capital lease for accounting purposes and;therefore, has been recorded at the present value of future minimum leasepayments as of the inception date. The cost of the sludge press is $548,720 andaccumulated depreciation amounted to $460,925 at June 30, 2012. $ 65,474
Compensated absences $ 162,966
Landfill closure and postclosure costs 3,439,510
Total enterprise obligations $ 6,351,650
Discretely Presented Component Unit-School Board The following is a summary of changes in long-term obligations of the Discretely Presented Component Unit-School Board for the fiscal year ended June 30, 2012:
Amounts Amounts AmountsPayable Payable at Dueat July 1, June 30, Within
2011 Increases Decreases 2012 One Year
Other post employment benefits $ 115,000 $ 13,000 $ - $ 128,000 $ -
78
CITY OF MARTINSVILLE, VIRGINIA Notes to Financial Statements As of June 30, 2012 (Continued)
Note 9—Landfill Closure and Postclosure Costs: State and federal laws and regulations require the City to place a final cover on each phase of its landfill site when it stops accepting waste and to perform certain maintenance and monitoring functions at the site for thirty years after closure. Closure and postclosure care costs will be paid only near or after the date that the landfill stops accepting waste. In accordance with Statement 18 of the Governmental Accounting Standards Board entitled Accounting for Municipal Solid Waste Landfill Closure and Postclosure Care Costs, the City reported a liability for a portion of these closure and postclosure care costs based on landfill capacity used. The $3,439,510 reported as landfill closure and postclosure care liability at June 30, 2012 is based on 100% of the estimated capacity used to date. These amounts are based on what it would cost to perform all closure and postclosure care in 2012. Actual closure and postclosure care costs may be higher due to inflation, changes in technology, or changes in regulations. The City plans to meet all federal laws, regulations and test of financial assurance related to the financing of closure and postclosure care when they become effective. Note 10—Deferred Revenue: Deferred revenue represents amounts for which asset recognition criteria have been met, but for which revenue recognition criteria have not been met. Under the modified accrual basis of accounting, such amounts are measurable, but not available. Deferred revenue totaling $484,910 is comprised of the following: Deferred Property Tax Revenue - Deferred revenue representing uncollected tax billings not available for funding of current expenditures totaled $364,368 at June 30, 2012. Discretely Presented School Board – Deferred revenue represented unexpended NASA and Harvest Foundation grant funds totaling $120,542 at June 30, 2012. Note 11—Contingent Liabilities: Federal programs in which the City and all discretely presented component units participate were audited in accordance with the provisions of U.S. Office of Management and Budget Circular A-133, Audits of States, Local Governments, and Non-Profit Organizations. Pursuant to the provisions of this circular all major programs and certain other programs were tested for compliance with applicable grant requirements. While no matters of noncompliance were disclosed by audit, the Federal Government may subject grant programs to additional compliance tests which may result in disallowed expenditures. In the opinion of management, any future disallowance of current grant program expenditures, if any, would be immaterial. Note 12—Litigation: At June 30, 2012, there were no matters of litigation involving the City or which would materially affect the City's financial position should any court decisions on pending matters not be favorable to such entities.
79
CITY OF MARTINSVILLE, VIRGINIA Notes to Financial Statements As of June 30, 2012 (Continued)
Note 13—Risk Management: The City is exposed to various risks of loss related to torts; theft of, damage to and destruction of assets; errors and omissions; injuries to employees; and natural disasters for which the government carries insurance. The City is a member of the Virginia Municipal Group Self Insurance Association for workers’ compensation. This program is administered by a servicing contractor, which furnishes claims review and processing. Each Association member jointly and severally agrees to assume, pay and discharge any liability. The City pays Virginia Municipal Group contributions and assessments based upon classifications and rates into a designated cash reserve fund out of which expenses of the Association and claims and awards are to be paid. In the event of a loss deficit and depletion of all available excess insurance, the Association may assess all members in the proportion which the premium of each bears to the total premiums of all members in the year in which such deficit occurs. The City continues to carry commercial insurance for all other risks of losses. During the last three fiscal years, settled claims from these risks have not exceeded commercial coverage. Note 14—Defined Benefit Pension Plan: A. Plan Description Name of Plan: Virginia Retirement System (VRS) Identification of Plan: Agent and Cost-Sharing, Multiple-Employer Defined Benefit Pension Plan Administering Entity: Virginia Retirement System (System)
All full-time, salaried permanent (professional) employees of public school divisions and employees of participating employers are automatically covered by VRS upon employment. Benefits vest after five years of service credit. Members earn one month of service credit for each month they are employed and their employer is paying into the VRS. Members are eligible to purchase prior public service, active duty military service, certain periods of leave and previously refunded VRS service as credit in their plan.
VRS administers two defined benefit plans for local government employees – Plan 1 and Plan 2: Members hired before July 1, 2010 and who have service credits before July 1, 2010 are covered
under Plan 1. Non-hazardous duty members are eligible for an unreduced retirement benefit beginning at age 65 with at least five years of service credit or age 50 with at least 30 years of service credit. They may retire with a reduced benefit early at age 55 with at least five years of service credit or age 50 with at least ten years of service credit.
80
CITY OF MARTINSVILLE, VIRGINIA Notes to Financial Statements As of June 30, 2012 (Continued)
Note 14—Defined Benefit Pension Plan: A. Plan Description: (Continued)
Members hired or rehired on or after July 1, 2010 and who have no service credits before July 1,
2010 are covered under Plan 2. Non-hazardous duty members are eligible for an unreduced benefit beginning at their normal Social Security retirement age with at least five years of service credit or when the sum of their age and service equals 90. They may retire with a reduced benefit as early as age 60 with at least five years of service credit.
Eligible hazardous duty members in Plan 1 and Plan 2 are eligible for an unreduced benefit
beginning at age 60 with at least 5 years of service credit or age 50 with at least 25 years of service credit. These members include sheriffs, deputy sheriffs and hazardous duty employees of political subdivisions that have elected to provide enhanced coverage for hazardous duty service. They may retire with a reduced benefit as early as age 50 with at least five years of service credit. All other provisions of the member’s plan apply.
The VRS Basic Benefit is a lifetime monthly benefit based on a retirement multiplier as a percentage of the member’s average final compensation multiplied by the member’s total service credit. Under Plan 1, average final compensation is the average of the member’s 36 consecutive months of highest compensation. Under Plan 2, average final compensation is the average of the member’s 60 consecutive months of highest compensation. The retirement multiplier for non-hazardous duty members is 1.70 %. The retirement multiplier for sheriffs and regional jail superintendents is 1.85%. The retirement multiplier for eligible political subdivision hazardous duty employees other than sheriffs and jail superintendents is 1.70% or 1.85% as elected by the employer. At retirement, members can elect the Basic Benefit, the Survivor Option, a Partial Lump-Sum Option Payment (PLOP) or the Advance Pension Option. A retirement reduction factor is applied to the Basic Benefit amount for members electing the Survivor Option, PLOP or Advance Pension Option or those retiring with a reduced benefit.
Retirees are eligible for an annual cost-of-living adjustment (COLA) effective July 1 of the second calendar year of retirement. Under Plan 1, the COLA cannot exceed 5.00%; under Plan 2, the COLA cannot exceed 6.00%. During years of no inflation or deflation, the COLA is 0.00%. The VRS also provides death and disability benefits. Title 51.1 of the Code of Virginia (1950), as amended, assigns the authority to establish and amend benefit provisions to the General Assembly of Virginia.
The system issues a publicly available comprehensive annual financial report that includes financial statements and required supplementary information for VRS. A copy of the most recent report may be obtained from the VRS Web site at http://www.varetire.org/Pdf/Publications/2011-annual-report.pdf or by writing to the System’s Chief Financial Officer at P.O. Box 2500, Richmond, VA, 23218-2500.
81
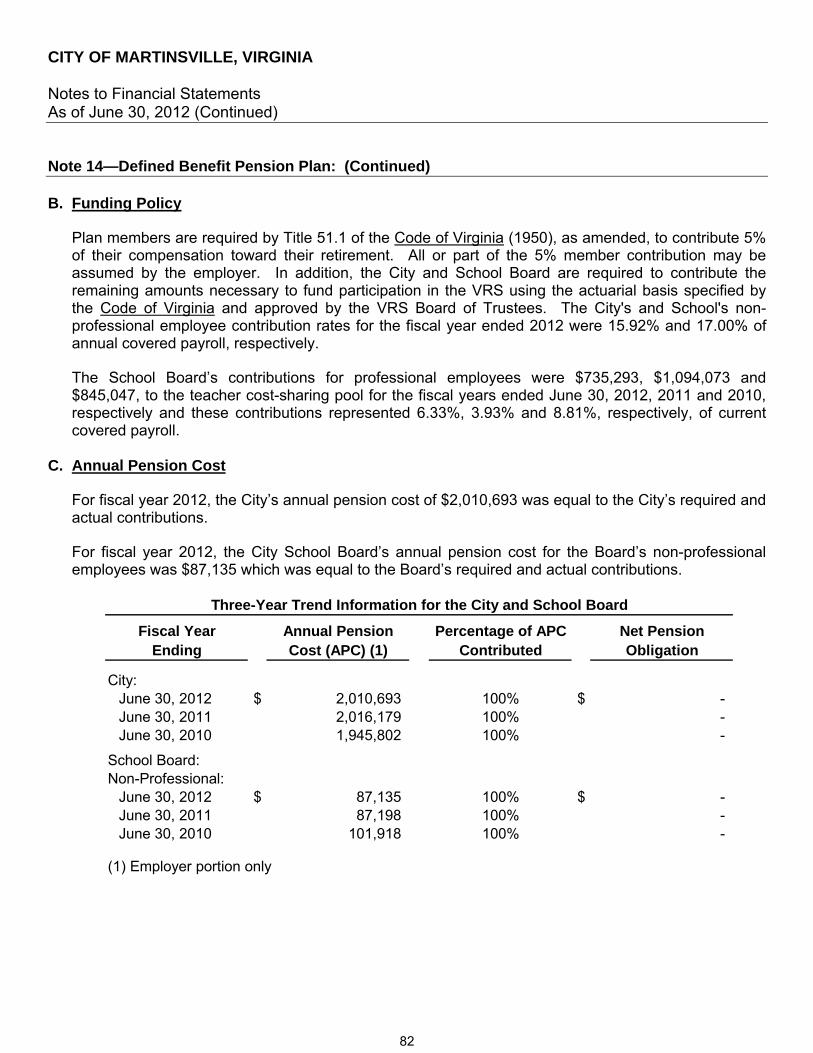
CITY OF MARTINSVILLE, VIRGINIA Notes to Financial Statements As of June 30, 2012 (Continued)
Note 14—Defined Benefit Pension Plan: (Continued)
B. Funding Policy
Plan members are required by Title 51.1 of the Code of Virginia (1950), as amended, to contribute 5% of their compensation toward their retirement. All or part of the 5% member contribution may be assumed by the employer. In addition, the City and School Board are required to contribute the remaining amounts necessary to fund participation in the VRS using the actuarial basis specified by the Code of Virginia and approved by the VRS Board of Trustees. The City's and School's non-professional employee contribution rates for the fiscal year ended 2012 were 15.92% and 17.00% of annual covered payroll, respectively. The School Board’s contributions for professional employees were $735,293, $1,094,073 and $845,047, to the teacher cost-sharing pool for the fiscal years ended June 30, 2012, 2011 and 2010, respectively and these contributions represented 6.33%, 3.93% and 8.81%, respectively, of current covered payroll.
C. Annual Pension Cost
For fiscal year 2012, the City’s annual pension cost of $2,010,693 was equal to the City’s required and actual contributions.
For fiscal year 2012, the City School Board’s annual pension cost for the Board’s non-professional employees was $87,135 which was equal to the Board’s required and actual contributions.
Fiscal Year Annual Pension Percentage of APC Net PensionEnding Cost (APC) (1) Contributed Obligation
City:June 30, 2012 $ 2,010,693 100% $ - June 30, 2011 2,016,179 100% - June 30, 2010 1,945,802 100% -
School Board: Non-Professional:
June 30, 2012 $ 87,135 100% $ - June 30, 2011 87,198 100% - June 30, 2010 101,918 100% -
(1) Employer portion only
Three-Year Trend Information for the City and School Board
82
CITY OF MARTINSVILLE, VIRGINIA Notes to Financial Statements As of June 30, 2012 (Continued)
Note 14—Defined Benefit Pension Plan: (Continued) C. Annual Pension Cost: (Continued)
The FY 2012 required contribution was determined as part of the June 30, 2009 actuarial valuation using the entry age actuarial cost method. The actuarial assumptions at June 30, 2009 included (a) an investment rate of return (net of administrative expenses) of 7.50%, (b) projected salary increases ranging from 3.75% to 5.60% per year for general government employees and 3.50% to 4.75% for employees eligible for enhanced benefits available to law enforcement officers, firefighters, and sheriffs, and (c) a cost-of-living adjustment of 2.50% per year. Both the investment rate of return and the projected salary increases include an inflation component of 2.50%. The actuarial value of the City’s and School Board’s assets is equal to the modified market value of assets. This method uses techniques that smooth the effects of short-term volatility in the market value of assets over a five-year period. City and School Board’s unfunded actuarial accrued liability is being amortized as a level percentage of projected payroll on an open basis. The remaining amortization period at June 30, 2009 for the Unfunded Actuarial Accrued Liability (UAAL) was 20 years.
D. Funded Status and Funding Progress
As of June 30, 2011, the most recent actuarial valuation date, the City’s plan was 69.11% funded. The actuarial accrued liability for benefits was $88,139,122, and the actuarial value of assets was $60,909,280, resulting in an unfunded actuarial accrued liability (UAAL) of $27,229,842. The covered payroll (annual payroll of active employees covered by the plan) was $12,705,075, and ratio of the UAAL to the covered payroll was 214.32%.
As of June 30, 2011, the most recent actuarial valuation date, the School Board’s plan was 64.88% funded. The actuarial accrued liability for benefits was $4,271,583, and the actuarial value of assets was $2,771,280, resulting in an unfunded actuarial accrued liability (UAAL) of $1,500,303. The covered payroll (annual payroll of active employees covered by the plan) was $508,005, and ratio of the UAAL to the covered payroll was 295.33%.
The schedule of funding progress, presented as Required Supplementary Information following the notes to the financial statements, presents multiyear trend information about whether the actuarial value of plan assets is increasing or decreasing over time relative to the actuarial accrued liability (AAL) for benefits.
83
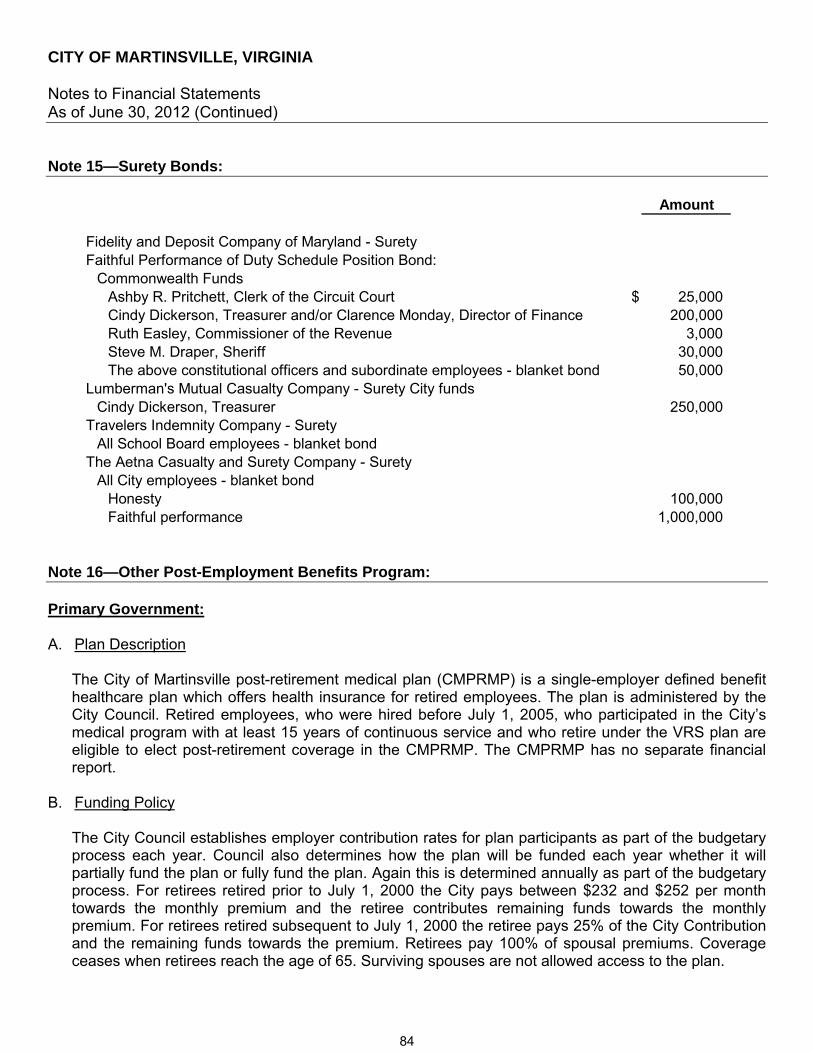
CITY OF MARTINSVILLE, VIRGINIA Notes to Financial Statements As of June 30, 2012 (Continued)
Note 15—Surety Bonds:
Amount
Fidelity and Deposit Company of Maryland - SuretyFaithful Performance of Duty Schedule Position Bond:
Commonwealth FundsAshby R. Pritchett, Clerk of the Circuit Court $ 25,000 Cindy Dickerson, Treasurer and/or Clarence Monday, Director of Finance 200,000 Ruth Easley, Commissioner of the Revenue 3,000 Steve M. Draper, Sheriff 30,000 The above constitutional officers and subordinate employees - blanket bond 50,000
Lumberman's Mutual Casualty Company - Surety City fundsCindy Dickerson, Treasurer 250,000
Travelers Indemnity Company - SuretyAll School Board employees - blanket bond
The Aetna Casualty and Surety Company - SuretyAll City employees - blanket bond
Honesty 100,000 Faithful performance 1,000,000
Note 16—Other Post-Employment Benefits Program: Primary Government: A. Plan Description
The City of Martinsville post-retirement medical plan (CMPRMP) is a single-employer defined benefit healthcare plan which offers health insurance for retired employees. The plan is administered by the City Council. Retired employees, who were hired before July 1, 2005, who participated in the City’s medical program with at least 15 years of continuous service and who retire under the VRS plan are eligible to elect post-retirement coverage in the CMPRMP. The CMPRMP has no separate financial report.
B. Funding Policy
The City Council establishes employer contribution rates for plan participants as part of the budgetary process each year. Council also determines how the plan will be funded each year whether it will partially fund the plan or fully fund the plan. Again this is determined annually as part of the budgetary process. For retirees retired prior to July 1, 2000 the City pays between $232 and $252 per month towards the monthly premium and the retiree contributes remaining funds towards the monthly premium. For retirees retired subsequent to July 1, 2000 the retiree pays 25% of the City Contribution and the remaining funds towards the premium. Retirees pay 100% of spousal premiums. Coverage ceases when retirees reach the age of 65. Surviving spouses are not allowed access to the plan.
84
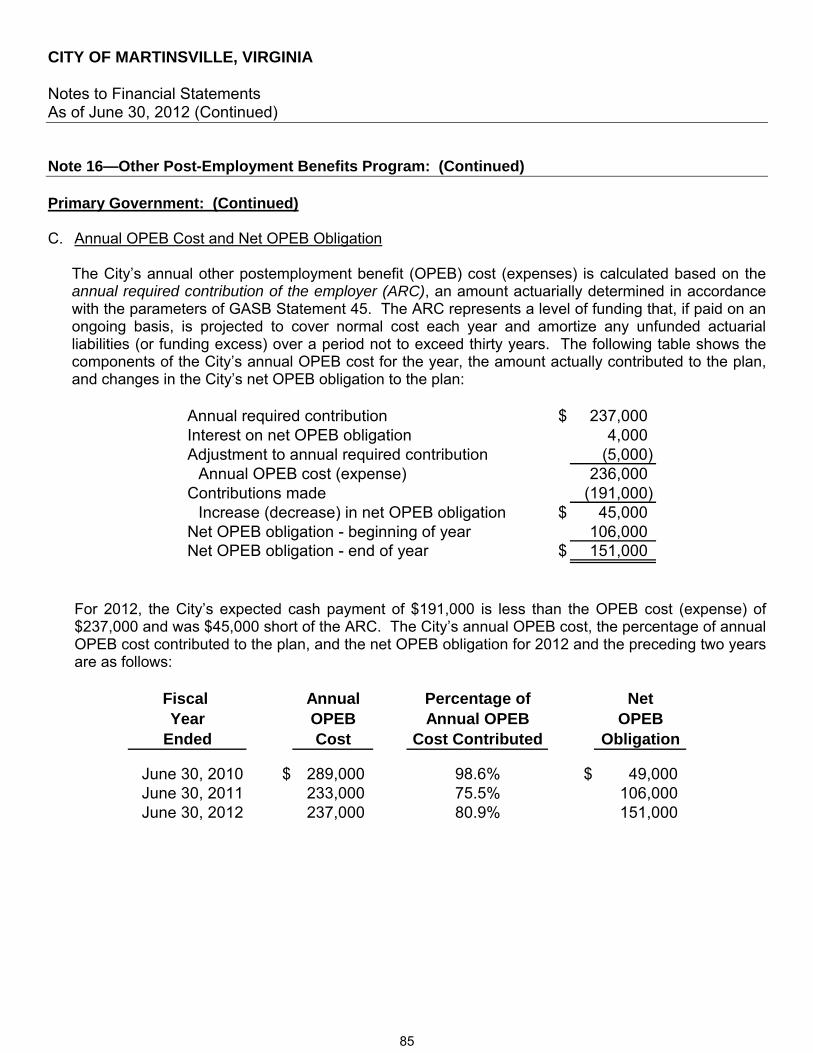
CITY OF MARTINSVILLE, VIRGINIA Notes to Financial Statements As of June 30, 2012 (Continued)
Note 16—Other Post-Employment Benefits Program: (Continued) Primary Government: (Continued) C. Annual OPEB Cost and Net OPEB Obligation
The City’s annual other postemployment benefit (OPEB) cost (expenses) is calculated based on the annual required contribution of the employer (ARC), an amount actuarially determined in accordance with the parameters of GASB Statement 45. The ARC represents a level of funding that, if paid on an ongoing basis, is projected to cover normal cost each year and amortize any unfunded actuarial liabilities (or funding excess) over a period not to exceed thirty years. The following table shows the components of the City’s annual OPEB cost for the year, the amount actually contributed to the plan, and changes in the City’s net OPEB obligation to the plan:
Annual required contribution $ 237,000 Interest on net OPEB obligation 4,000 Adjustment to annual required contribution (5,000)
Annual OPEB cost (expense) 236,000 Contributions made (191,000)
Increase (decrease) in net OPEB obligation $ 45,000 Net OPEB obligation - beginning of year 106,000 Net OPEB obligation - end of year $ 151,000
For 2012, the City’s expected cash payment of $191,000 is less than the OPEB cost (expense) of $237,000 and was $45,000 short of the ARC. The City’s annual OPEB cost, the percentage of annual OPEB cost contributed to the plan, and the net OPEB obligation for 2012 and the preceding two years are as follows:
Fiscal Annual Percentage of NetYear OPEB Annual OPEB OPEB
Ended Cost Cost Contributed Obligation
June 30, 2010 $ 289,000 98.6% $ 49,000 June 30, 2011 233,000 75.5% 106,000 June 30, 2012 237,000 80.9% 151,000
85
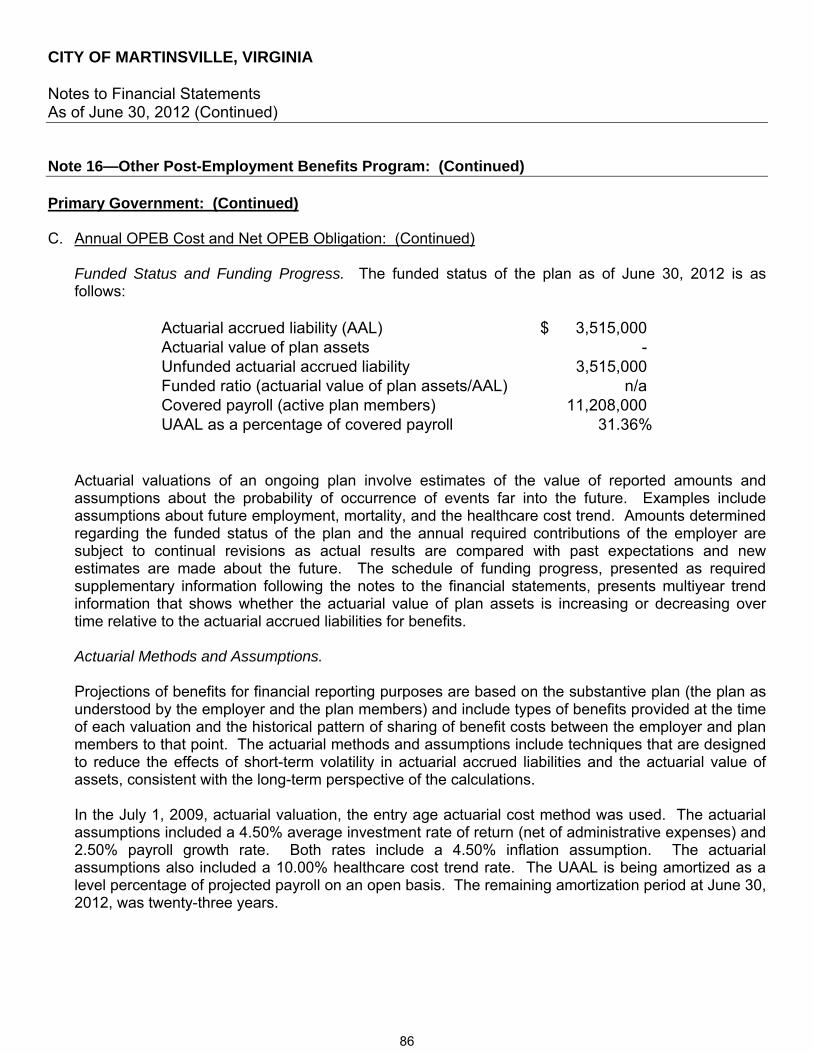
CITY OF MARTINSVILLE, VIRGINIA Notes to Financial Statements As of June 30, 2012 (Continued)
Note 16—Other Post-Employment Benefits Program: (Continued) Primary Government: (Continued) C. Annual OPEB Cost and Net OPEB Obligation: (Continued)
Funded Status and Funding Progress. The funded status of the plan as of June 30, 2012 is as follows:
Actuarial accrued liability (AAL) $ 3,515,000 Actuarial value of plan assets - Unfunded actuarial accrued liability 3,515,000 Funded ratio (actuarial value of plan assets/AAL) n/aCovered payroll (active plan members) 11,208,000 UAAL as a percentage of covered payroll 31.36%
Actuarial valuations of an ongoing plan involve estimates of the value of reported amounts and assumptions about the probability of occurrence of events far into the future. Examples include assumptions about future employment, mortality, and the healthcare cost trend. Amounts determined regarding the funded status of the plan and the annual required contributions of the employer are subject to continual revisions as actual results are compared with past expectations and new estimates are made about the future. The schedule of funding progress, presented as required supplementary information following the notes to the financial statements, presents multiyear trend information that shows whether the actuarial value of plan assets is increasing or decreasing over time relative to the actuarial accrued liabilities for benefits. Actuarial Methods and Assumptions.
Projections of benefits for financial reporting purposes are based on the substantive plan (the plan as understood by the employer and the plan members) and include types of benefits provided at the time of each valuation and the historical pattern of sharing of benefit costs between the employer and plan members to that point. The actuarial methods and assumptions include techniques that are designed to reduce the effects of short-term volatility in actuarial accrued liabilities and the actuarial value of assets, consistent with the long-term perspective of the calculations. In the July 1, 2009, actuarial valuation, the entry age actuarial cost method was used. The actuarial assumptions included a 4.50% average investment rate of return (net of administrative expenses) and 2.50% payroll growth rate. Both rates include a 4.50% inflation assumption. The actuarial assumptions also included a 10.00% healthcare cost trend rate. The UAAL is being amortized as a level percentage of projected payroll on an open basis. The remaining amortization period at June 30, 2012, was twenty-three years.
86
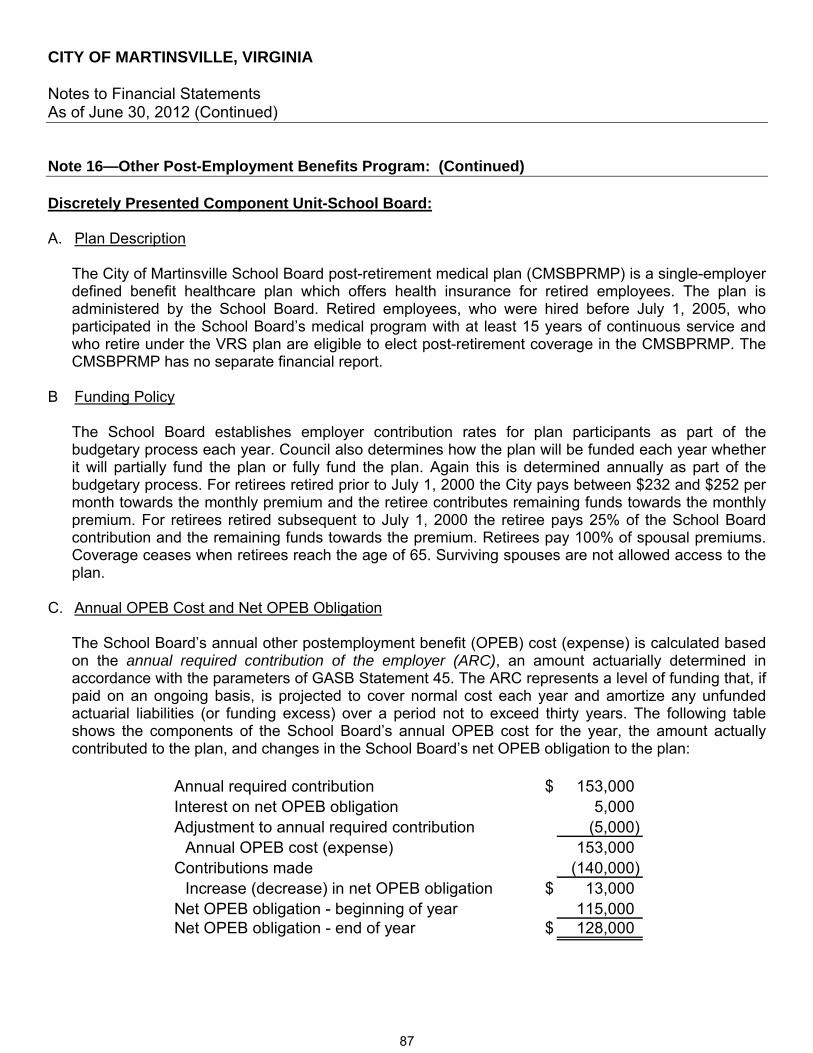
CITY OF MARTINSVILLE, VIRGINIA Notes to Financial Statements As of June 30, 2012 (Continued)
Note 16—Other Post-Employment Benefits Program: (Continued) Discretely Presented Component Unit-School Board: A. Plan Description
The City of Martinsville School Board post-retirement medical plan (CMSBPRMP) is a single-employer defined benefit healthcare plan which offers health insurance for retired employees. The plan is administered by the School Board. Retired employees, who were hired before July 1, 2005, who participated in the School Board’s medical program with at least 15 years of continuous service and who retire under the VRS plan are eligible to elect post-retirement coverage in the CMSBPRMP. The CMSBPRMP has no separate financial report.
B Funding Policy
The School Board establishes employer contribution rates for plan participants as part of the budgetary process each year. Council also determines how the plan will be funded each year whether it will partially fund the plan or fully fund the plan. Again this is determined annually as part of the budgetary process. For retirees retired prior to July 1, 2000 the City pays between $232 and $252 per month towards the monthly premium and the retiree contributes remaining funds towards the monthly premium. For retirees retired subsequent to July 1, 2000 the retiree pays 25% of the School Board contribution and the remaining funds towards the premium. Retirees pay 100% of spousal premiums. Coverage ceases when retirees reach the age of 65. Surviving spouses are not allowed access to the plan.
C. Annual OPEB Cost and Net OPEB Obligation
The School Board’s annual other postemployment benefit (OPEB) cost (expense) is calculated based on the annual required contribution of the employer (ARC), an amount actuarially determined in accordance with the parameters of GASB Statement 45. The ARC represents a level of funding that, if paid on an ongoing basis, is projected to cover normal cost each year and amortize any unfunded actuarial liabilities (or funding excess) over a period not to exceed thirty years. The following table shows the components of the School Board’s annual OPEB cost for the year, the amount actually contributed to the plan, and changes in the School Board’s net OPEB obligation to the plan:
Annual required contribution $ 153,000 Interest on net OPEB obligation 5,000 Adjustment to annual required contribution (5,000)
Annual OPEB cost (expense) 153,000 Contributions made (140,000)
Increase (decrease) in net OPEB obligation $ 13,000 Net OPEB obligation - beginning of year 115,000 Net OPEB obligation - end of year $ 128,000
87
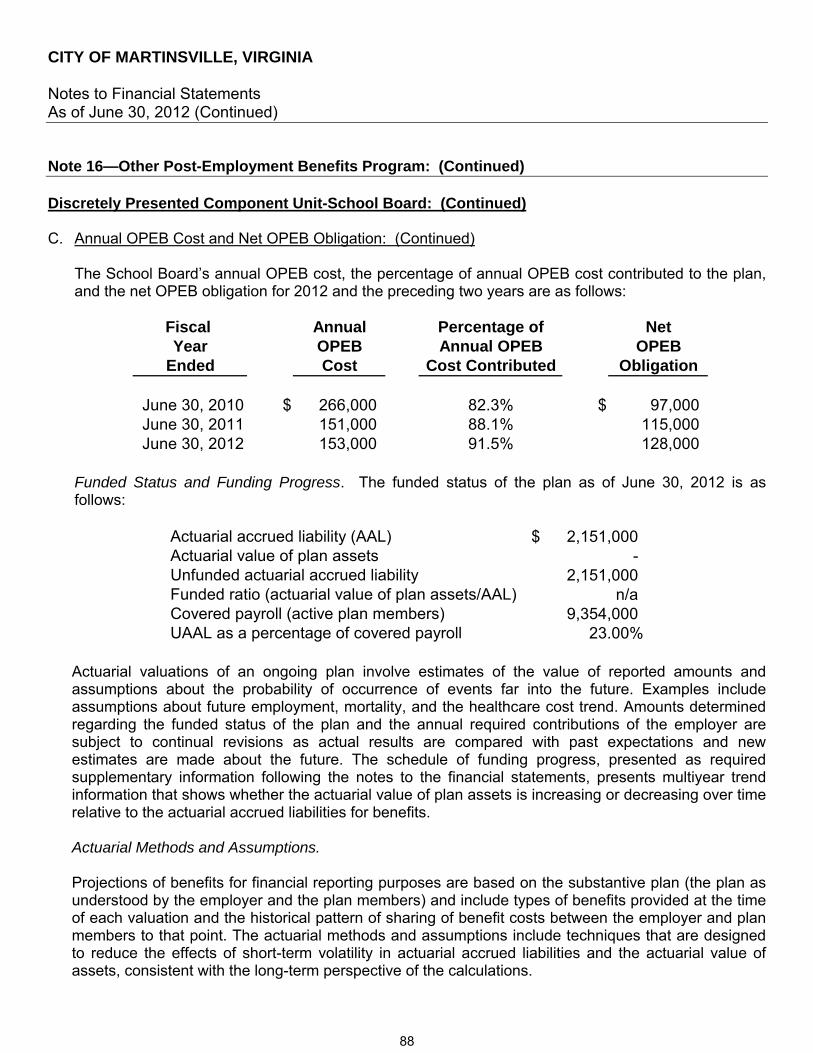
CITY OF MARTINSVILLE, VIRGINIA Notes to Financial Statements As of June 30, 2012 (Continued)
Note 16—Other Post-Employment Benefits Program: (Continued) Discretely Presented Component Unit-School Board: (Continued)
C. Annual OPEB Cost and Net OPEB Obligation: (Continued)
The School Board’s annual OPEB cost, the percentage of annual OPEB cost contributed to the plan, and the net OPEB obligation for 2012 and the preceding two years are as follows:
Fiscal Annual Percentage of NetYear OPEB Annual OPEB OPEB
Ended Cost Cost Contributed Obligation
June 30, 2010 $ 266,000 82.3% $ 97,000 June 30, 2011 151,000 88.1% 115,000 June 30, 2012 153,000 91.5% 128,000
Funded Status and Funding Progress. The funded status of the plan as of June 30, 2012 is as follows:
Actuarial accrued liability (AAL) $ 2,151,000 Actuarial value of plan assets - Unfunded actuarial accrued liability 2,151,000 Funded ratio (actuarial value of plan assets/AAL) n/aCovered payroll (active plan members) 9,354,000 UAAL as a percentage of covered payroll 23.00%
Actuarial valuations of an ongoing plan involve estimates of the value of reported amounts and assumptions about the probability of occurrence of events far into the future. Examples include assumptions about future employment, mortality, and the healthcare cost trend. Amounts determined regarding the funded status of the plan and the annual required contributions of the employer are subject to continual revisions as actual results are compared with past expectations and new estimates are made about the future. The schedule of funding progress, presented as required supplementary information following the notes to the financial statements, presents multiyear trend information that shows whether the actuarial value of plan assets is increasing or decreasing over time relative to the actuarial accrued liabilities for benefits.
Actuarial Methods and Assumptions.
Projections of benefits for financial reporting purposes are based on the substantive plan (the plan as understood by the employer and the plan members) and include types of benefits provided at the time of each valuation and the historical pattern of sharing of benefit costs between the employer and plan members to that point. The actuarial methods and assumptions include techniques that are designed to reduce the effects of short-term volatility in actuarial accrued liabilities and the actuarial value of assets, consistent with the long-term perspective of the calculations.
88
CITY OF MARTINSVILLE, VIRGINIA Notes to Financial Statements As of June 30, 2012 (Continued)
Note 16—Other Post-Employment Benefits Program: (Continued) Discretely Presented Component Unit-School Board: (Continued)
C. Annual OPEB Cost and Net OPEB Obligation: (Continued)
Actuarial Methods and Assumptions. (Continued)
In the July 1, 2009, actuarial valuation, the entry age actuarial cost method was used. The actuarial assumptions included a 4.25% average investment rate of return (net of administrative expenses) and a 2.50% payroll growth rate. Both rates include a 4.50% inflation assumption. The actuarial assumptions also included a 10.00% healthcare cost trend rate. The UAAL is being amortized as a level percentage of projected payroll on an open basis. The remaining amortization period at June 30, 2011, was thirty years.
Note 17—VRS Health Insurance Credit Other Post-Employment Benefits (OPEB): A. Plan Description
The School Board participates in the Health Insurance Credit Program, a plan designed to assist retirees with the cost of health insurance coverage. This program is a cost sharing, multiple-employer defined benefit plan administered by the Virginia Retirement System (VRS). The Virginia General Assembly establishes the dollar amount of the health insurance credit for each year of creditable service. The credit amount and eligibility differs for state, school division, political subdivision, local officer, local social services department and general registrar retirees.
A teacher, who retires under VRS with at least 15 years of total creditable service under the System and is enrolled in a health insurance plan, is eligible to receive a monthly health insurance credit of $4 per year of creditable service. However, such credit shall not exceed the health insurance premium for the retiree. Disabled retirees automatically receive a monthly health insurance credit of $4 multiplied by the smaller of (i) twice the amount of their creditable service or (ii) the amount of creditable service they would have completed at age 60 if they had remained in service to that age.
Benefit provisions and eligibility requirements are established by Title 51.1, Chapter 14 of the Code of Virginia. The VRS actuarially determines the amount necessary to fund all credits provided, reflects the cost of such credits in the applicable employer contribution rate pursuant to §51.1-145, and prescribes such terms and conditions as are necessary to carry out the provisions of the health insurance credit program. VRS issues separate financial statements as previously discussed in Note 14.
B. Funding Policy
The School Board is required to contribute, at an actuarially determined rate, the entire amount necessary to fund participation in the program. The current rate is 0.6% of annual covered payroll. The School Board’s contributions to VRS for the years ended June 30, 2012, 2011, and 2010 were $69,696, $73,331, and $99,756, respectively and equaled the required contributions for each year.
89

This page intentionally left blank
Required Supplementary Information
Note to Required Supplementary Information: Presented budgets were prepared in accordance with accounting principles generally accepted in the United States of America.
91

This page intentionally left blank
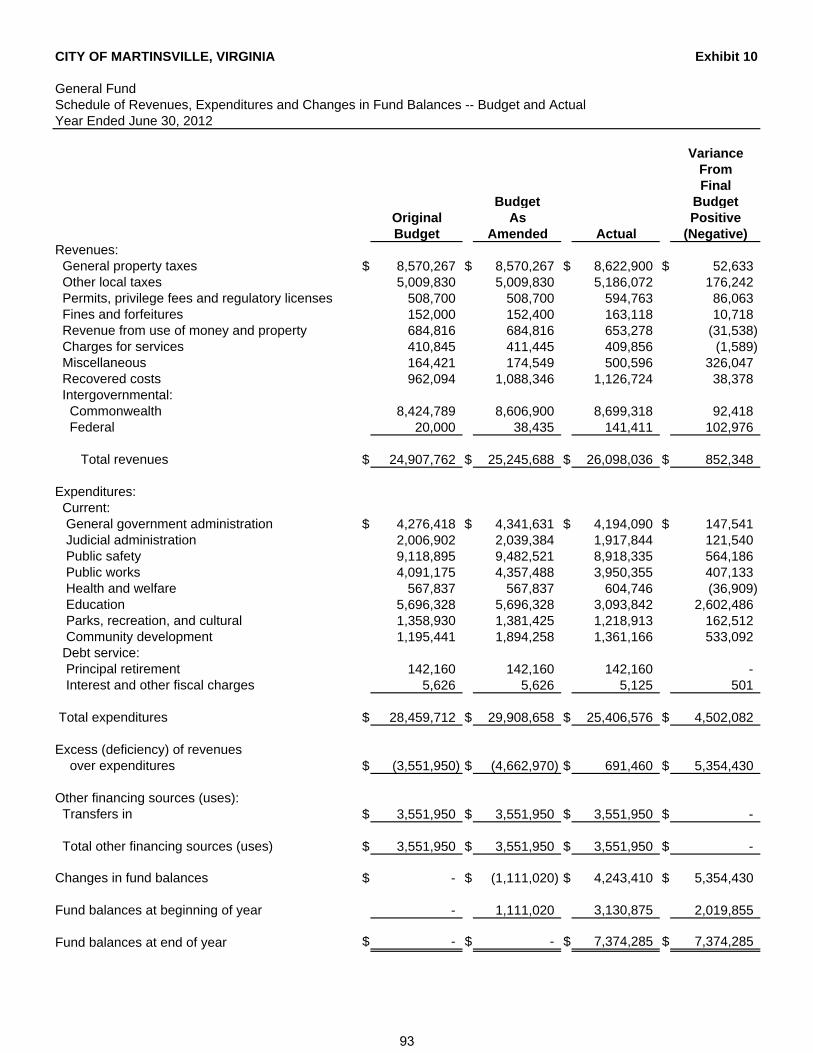
CITY OF MARTINSVILLE, VIRGINIA Exhibit 10
General FundSchedule of Revenues, Expenditures and Changes in Fund Balances -- Budget and ActualYear Ended June 30, 2012
VarianceFromFinal
Budget BudgetOriginal As PositiveBudget Amended Actual (Negative)
Revenues: General property taxes $ 8,570,267 $ 8,570,267 $ 8,622,900 $ 52,633 Other local taxes 5,009,830 5,009,830 5,186,072 176,242 Permits, privilege fees and regulatory licenses 508,700 508,700 594,763 86,063 Fines and forfeitures 152,000 152,400 163,118 10,718 Revenue from use of money and property 684,816 684,816 653,278 (31,538) Charges for services 410,845 411,445 409,856 (1,589) Miscellaneous 164,421 174,549 500,596 326,047 Recovered costs 962,094 1,088,346 1,126,724 38,378 Intergovernmental: Commonwealth 8,424,789 8,606,900 8,699,318 92,418 Federal 20,000 38,435 141,411 102,976
Total revenues $ 24,907,762 $ 25,245,688 $ 26,098,036 $ 852,348
Expenditures: Current: General government administration $ 4,276,418 $ 4,341,631 $ 4,194,090 $ 147,541 Judicial administration 2,006,902 2,039,384 1,917,844 121,540 Public safety 9,118,895 9,482,521 8,918,335 564,186 Public works 4,091,175 4,357,488 3,950,355 407,133 Health and welfare 567,837 567,837 604,746 (36,909) Education 5,696,328 5,696,328 3,093,842 2,602,486 Parks, recreation, and cultural 1,358,930 1,381,425 1,218,913 162,512 Community development 1,195,441 1,894,258 1,361,166 533,092 Debt service: Principal retirement 142,160 142,160 142,160 - Interest and other fiscal charges 5,626 5,626 5,125 501
Total expenditures $ 28,459,712 $ 29,908,658 $ 25,406,576 $ 4,502,082
Excess (deficiency) of revenues over expenditures $ (3,551,950) $ (4,662,970) $ 691,460 $ 5,354,430
Other financing sources (uses): Transfers in $ 3,551,950 $ 3,551,950 $ 3,551,950 $ -
Total other financing sources (uses) $ 3,551,950 $ 3,551,950 $ 3,551,950 $ -
Changes in fund balances $ - $ (1,111,020) $ 4,243,410 $ 5,354,430
Fund balances at beginning of year - 1,111,020 3,130,875 2,019,855
Fund balances at end of year $ - $ - $ 7,374,285 $ 7,374,285
93

CITY OF MARTINSVILLE, VIRGINIA Exhibit 11
Meals Tax FundSchedule of Revenues, Expenditures and Changes in Fund Balances -- Budget and ActualYear Ended June 30, 2012
VarianceFromFinal
Budget BudgetOriginal As PositiveBudget Amended Actual (Negative)
Revenues: Other local taxes $ 1,388,475 $ 1,388,475 $ 1,434,966 $ 46,491 Revenue from use of money and property - - 15,041 15,041 Intergovernmental: Federal - - 182,254 182,254
Total revenues $ 1,388,475 $ 1,388,475 $ 1,632,261 $ 243,786
Expenditures: Current: General government administration $ 35,190 $ 35,190 $ 35,190 $ - Education - 9,276,156 544,740 8,731,416 Debt service: Principal retirement 828,984 828,984 828,984 - Interest and other fiscal charges 279,737 303,581 485,837 (182,256)
Total expenditures $ 1,143,911 $ 10,443,911 $ 1,894,751 $ 8,549,160
Excess (deficiency) of revenues over expenditures $ 244,564 $ (9,055,436) $ (262,490) $ 8,792,946
Other financing sources (uses): Issuance of debt $ - $ 9,300,000 $ 9,300,000 $ - Transfers (out) (244,564) (244,564) (244,564) -
Total other financing sources (uses) $ (244,564) $ 9,055,436 $ 9,055,436 $ -
Changes in fund balances $ - $ - $ 8,792,946 $ 8,792,946
Fund balances at beginning of year - - 726,967 726,967
Fund balances at end of year $ - $ - $ 9,519,913 $ 9,519,913
94
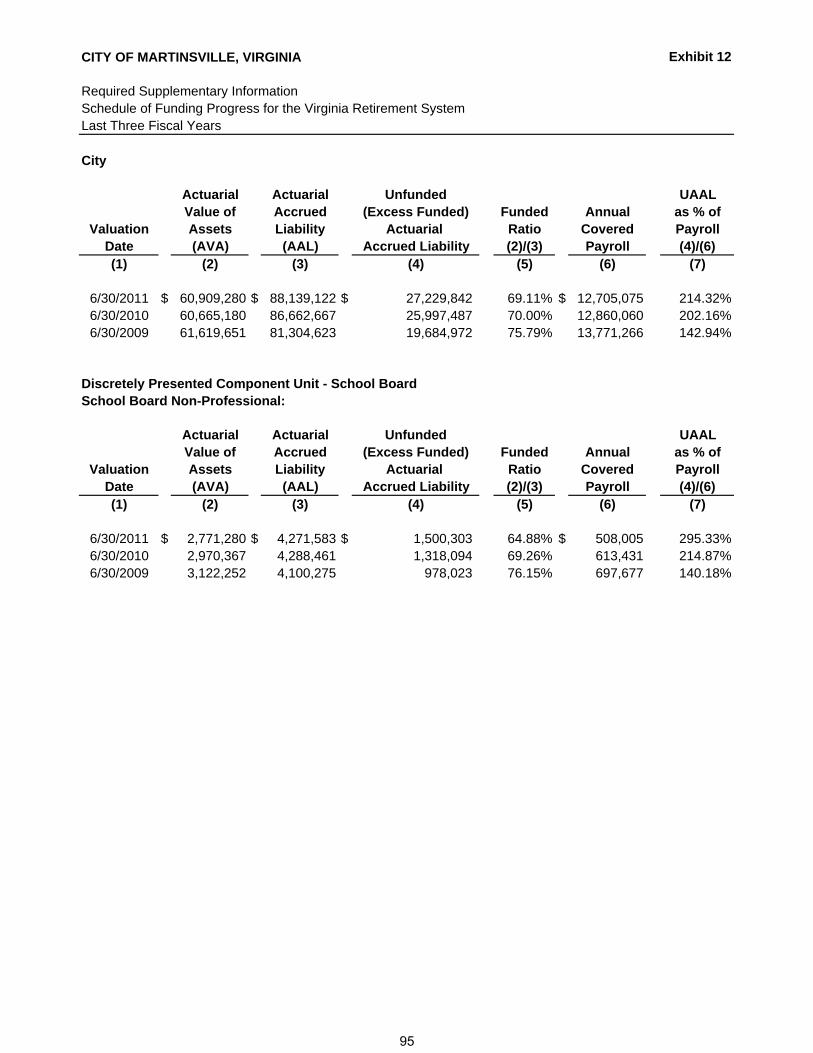
CITY OF MARTINSVILLE, VIRGINIA Exhibit 12
Required Supplementary InformationSchedule of Funding Progress for the Virginia Retirement SystemLast Three Fiscal Years
City
Actuarial Actuarial Unfunded UAALValue of Accrued (Excess Funded) Funded Annual as % of
Valuation Assets Liability Actuarial Ratio Covered PayrollDate (AVA) (AAL) Accrued Liability (2)/(3) Payroll (4)/(6)(1) (2) (3) (4) (5) (6) (7)
6/30/2011 $ 60,909,280 $ 88,139,122 $ 27,229,842 69.11% $ 12,705,075 214.32%6/30/2010 60,665,180 86,662,667 25,997,487 70.00% 12,860,060 202.16%6/30/2009 61,619,651 81,304,623 19,684,972 75.79% 13,771,266 142.94%
Discretely Presented Component Unit - School BoardSchool Board Non-Professional:
Actuarial Actuarial Unfunded UAALValue of Accrued (Excess Funded) Funded Annual as % of
Valuation Assets Liability Actuarial Ratio Covered PayrollDate (AVA) (AAL) Accrued Liability (2)/(3) Payroll (4)/(6)(1) (2) (3) (4) (5) (6) (7)
6/30/2011 $ 2,771,280 $ 4,271,583 $ 1,500,303 64.88% $ 508,005 295.33%6/30/2010 2,970,367 4,288,461 1,318,094 69.26% 613,431 214.87%6/30/2009 3,122,252 4,100,275 978,023 76.15% 697,677 140.18%
95
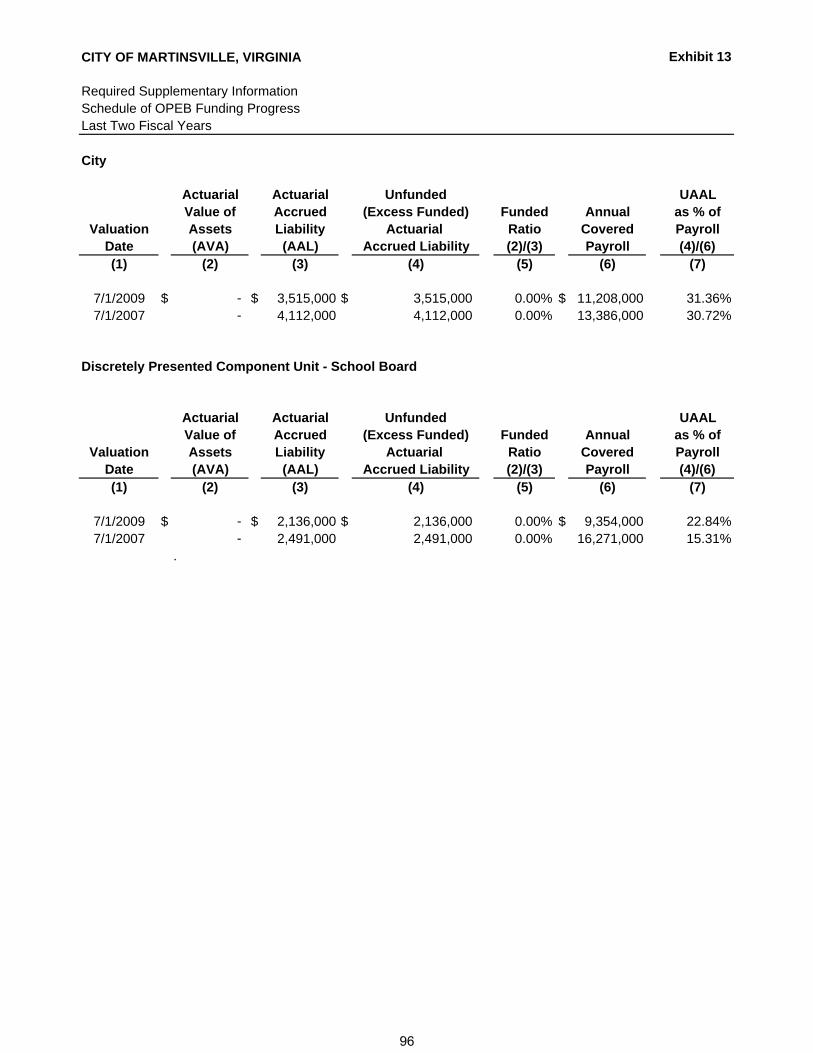
CITY OF MARTINSVILLE, VIRGINIA Exhibit 13
Required Supplementary InformationSchedule of OPEB Funding ProgressLast Two Fiscal Years
City
Actuarial Actuarial Unfunded UAALValue of Accrued (Excess Funded) Funded Annual as % of
Valuation Assets Liability Actuarial Ratio Covered PayrollDate (AVA) (AAL) Accrued Liability (2)/(3) Payroll (4)/(6)(1) (2) (3) (4) (5) (6) (7)
7/1/2009 $ - $ 3,515,000 $ 3,515,000 0.00% $ 11,208,000 31.36%7/1/2007 - 4,112,000 4,112,000 0.00% 13,386,000 30.72%
Discretely Presented Component Unit - School Board
Actuarial Actuarial Unfunded UAALValue of Accrued (Excess Funded) Funded Annual as % of
Valuation Assets Liability Actuarial Ratio Covered PayrollDate (AVA) (AAL) Accrued Liability (2)/(3) Payroll (4)/(6)(1) (2) (3) (4) (5) (6) (7)
7/1/2009 $ - $ 2,136,000 $ 2,136,000 0.00% $ 9,354,000 22.84%7/1/2007 - 2,491,000 2,491,000 0.00% 16,271,000 15.31%
.
96

Other Supplementary Information
97

This page intentionally left blank
Combining and Individual Fund Statements and Schedules
99

CITY OF MARTINSVILLE, VIRGINIA Exhibit 14
Nonmajor Governmental FundsCombining Balance SheetAt June 30, 2012
CapitalSpecial Projects
Revenue Funds Fund
City Housing CapitalGrants Choice ReserveFund Fund Fund Total
ASSETS
Cash and cash equivalents $ 38,226 $ 515,808 $ 416,888 $ 970,922 Cash and cash equivalents - restricted - - 1,206,199 1,206,199
Total assets $ 38,226 $ 515,808 $ 1,623,087 $ 2,177,121
LIABILITIES
Accounts payable and other current liabilities $ 78,259 $ 5,587 $ 383,449 $ 467,295 Due to other funds 543,072 230,160 - 773,232
Total liabilities $ 621,331 $ 235,747 $ 383,449 $ 1,240,527
FUND BALANCES
Fund balances:Resticted for: Capital projects $ - $ - $ 1,206,199 $ 1,206,199 Committed to: Housing Choice program - 280,061 - 280,061 Assigned to: Capital reserve fund - - 33,439 33,439 Unassigned (583,105) - - (583,105)
Total fund balances $ (583,105) $ 280,061 $ 1,239,638 $ 936,594
Total liabilities and fund balances $ 38,226 $ 515,808 $ 1,623,087 $ 2,177,121
100
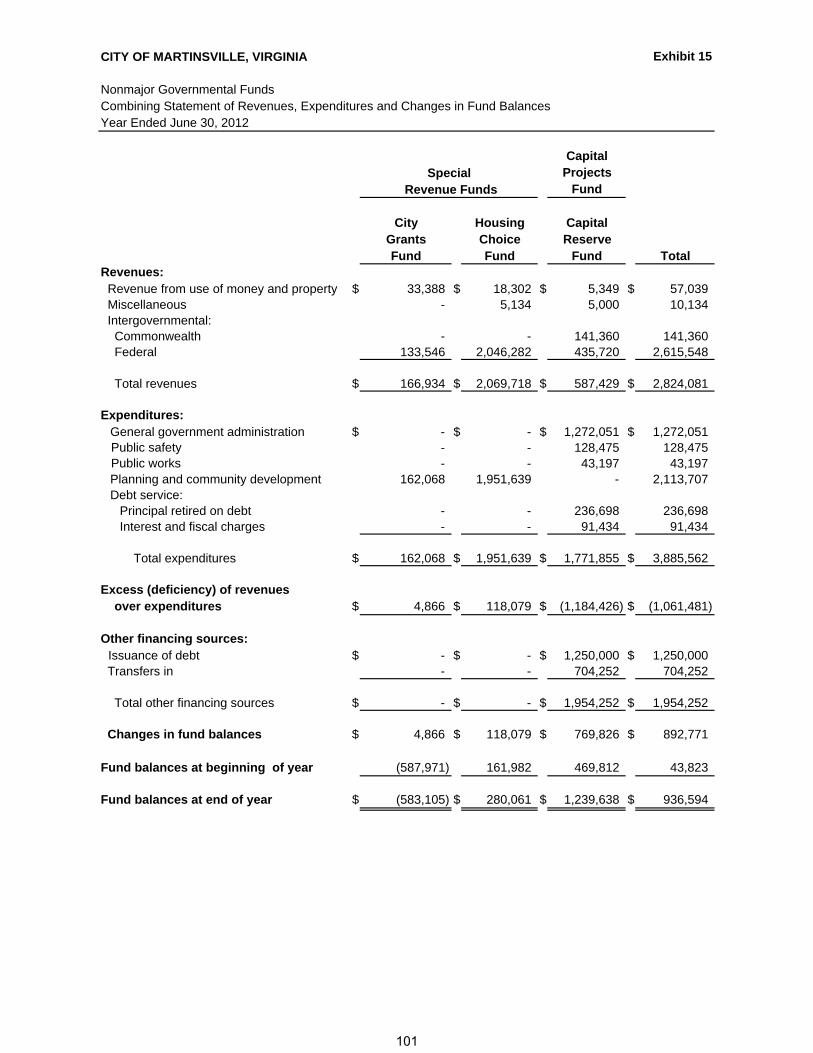
CITY OF MARTINSVILLE, VIRGINIA Exhibit 15
Nonmajor Governmental FundsCombining Statement of Revenues, Expenditures and Changes in Fund BalancesYear Ended June 30, 2012
CapitalSpecial Projects
Revenue Funds Fund
City Housing CapitalGrants Choice ReserveFund Fund Fund Total
Revenues: Revenue from use of money and property $ 33,388 $ 18,302 $ 5,349 $ 57,039 Miscellaneous - 5,134 5,000 10,134 Intergovernmental: Commonwealth - - 141,360 141,360 Federal 133,546 2,046,282 435,720 2,615,548
Total revenues $ 166,934 $ 2,069,718 $ 587,429 $ 2,824,081
Expenditures:General government administration $ - $ - $ 1,272,051 $ 1,272,051
Public safety - - 128,475 128,475 Public works - - 43,197 43,197
Planning and community development 162,068 1,951,639 - 2,113,707 Debt service:
Principal retired on debt - - 236,698 236,698 Interest and fiscal charges - - 91,434 91,434
Total expenditures $ 162,068 $ 1,951,639 $ 1,771,855 $ 3,885,562
Excess (deficiency) of revenues over expenditures $ 4,866 $ 118,079 $ (1,184,426) $ (1,061,481)
Other financing sources: Issuance of debt $ - $ - $ 1,250,000 $ 1,250,000
Transfers in - - 704,252 704,252
Total other financing sources $ - $ - $ 1,954,252 $ 1,954,252
Changes in fund balances $ 4,866 $ 118,079 $ 769,826 $ 892,771
Fund balances at beginning of year (587,971) 161,982 469,812 43,823
Fund balances at end of year $ (583,105) $ 280,061 $ 1,239,638 $ 936,594
101
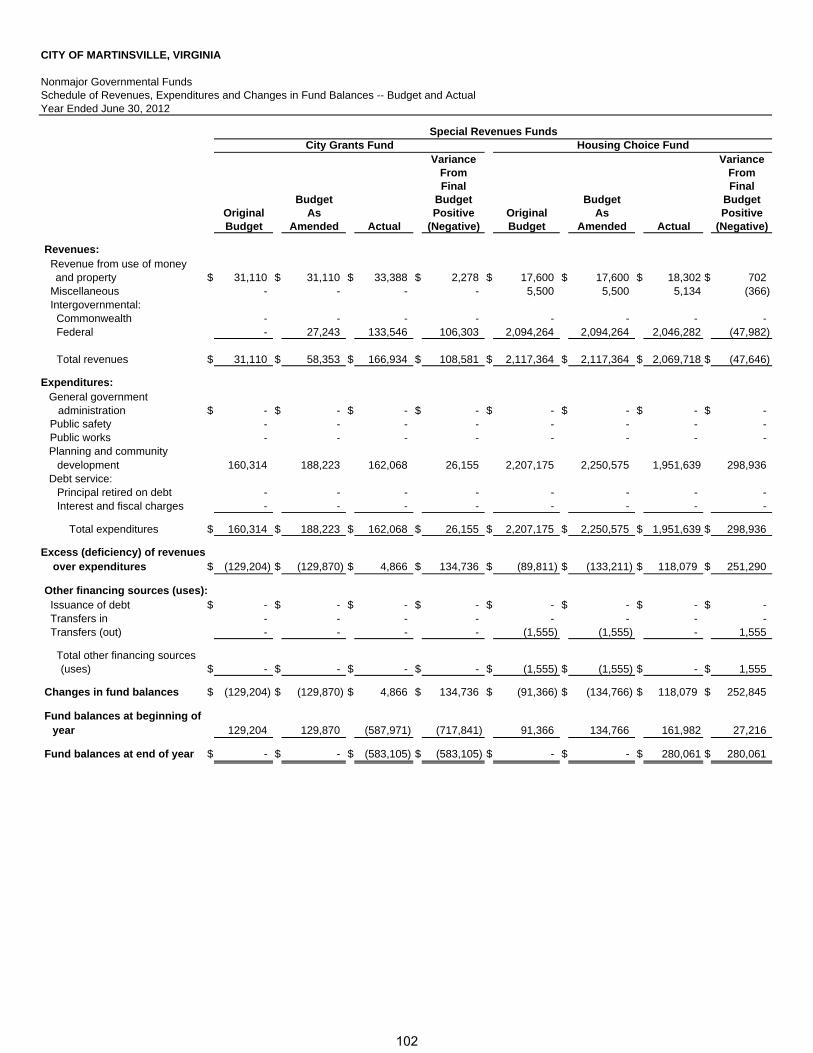
CITY OF MARTINSVILLE, VIRGINIA
Nonmajor Governmental FundsSchedule of Revenues, Expenditures and Changes in Fund Balances -- Budget and ActualYear Ended June 30, 2012
City Grants FundVariance Variance
From FromFinal Final
Budget Budget Budget BudgetOriginal As Positive Original As PositiveBudget Amended Actual (Negative) Budget Amended Actual (Negative)
Revenues: Revenue from use of money
and property $ 31,110 $ 31,110 $ 33,388 $ 2,278 $ 17,600 $ 17,600 $ 18,302 $ 702 Miscellaneous - - - - 5,500 5,500 5,134 (366) Intergovernmental: Commonwealth - - - - - - - - Federal - 27,243 133,546 106,303 2,094,264 2,094,264 2,046,282 (47,982)
Total revenues $ 31,110 $ 58,353 $ 166,934 $ 108,581 $ 2,117,364 $ 2,117,364 $ 2,069,718 $ (47,646)
Expenditures:General government administration $ - $ - $ - $ - $ - $ - $ - $ -
Public safety - - - - - - - - Public works - - - - - - - -
Planning and community development 160,314 188,223 162,068 26,155 2,207,175 2,250,575 1,951,639 298,936
Debt service:Principal retired on debt - - - - - - - - Interest and fiscal charges - - - - - - - -
Total expenditures $ 160,314 $ 188,223 $ 162,068 $ 26,155 $ 2,207,175 $ 2,250,575 $ 1,951,639 $ 298,936
Excess (deficiency) of revenues over expenditures $ (129,204) $ (129,870) $ 4,866 $ 134,736 $ (89,811) $ (133,211) $ 118,079 $ 251,290
Other financing sources (uses): Issuance of debt $ - $ - $ - $ - $ - $ - $ - $ - Transfers in - - - - - - - - Transfers (out) - - - - (1,555) (1,555) - 1,555
Total other financing sources (uses) $ - $ - $ - $ - $ (1,555) $ (1,555) $ - $ 1,555
Changes in fund balances $ (129,204) $ (129,870) $ 4,866 $ 134,736 $ (91,366) $ (134,766) $ 118,079 $ 252,845
Fund balances at beginning of year 129,204 129,870 (587,971) (717,841) 91,366 134,766 161,982 27,216
Fund balances at end of year $ - $ - $ (583,105) $ (583,105) $ - $ - $ 280,061 $ 280,061
Housing Choice FundSpecial Revenues Funds
102
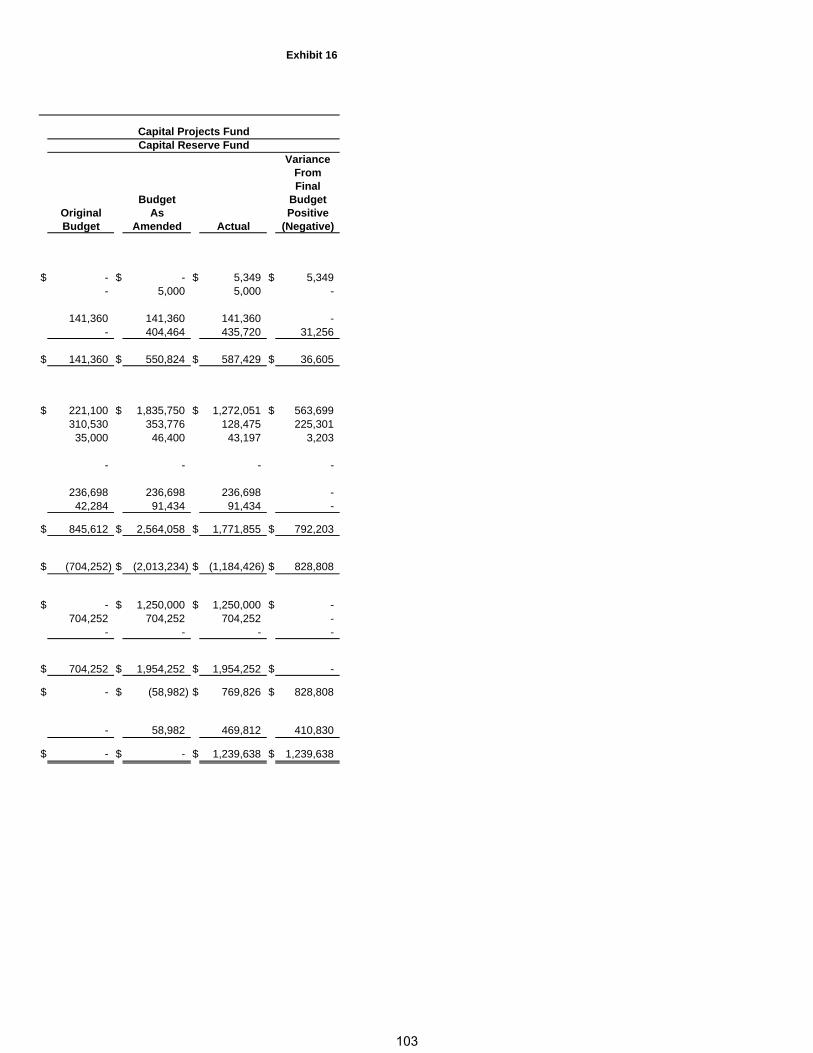
Exhibit 16
VarianceFromFinal
Budget BudgetOriginal As PositiveBudget Amended Actual (Negative)
$ - $ - $ 5,349 $ 5,349 - 5,000 5,000 -
141,360 141,360 141,360 - - 404,464 435,720 31,256
$ 141,360 $ 550,824 $ 587,429 $ 36,605
$ 221,100 $ 1,835,750 $ 1,272,051 $ 563,699 310,530 353,776 128,475 225,301
35,000 46,400 43,197 3,203
- - - -
236,698 236,698 236,698 - 42,284 91,434 91,434 -
$ 845,612 $ 2,564,058 $ 1,771,855 $ 792,203
$ (704,252) $ (2,013,234) $ (1,184,426) $ 828,808
$ - $ 1,250,000 $ 1,250,000 $ - 704,252 704,252 704,252 -
- - - -
$ 704,252 $ 1,954,252 $ 1,954,252 $ -
$ - $ (58,982) $ 769,826 $ 828,808
- 58,982 469,812 410,830
$ - $ - $ 1,239,638 $ 1,239,638
Capital Reserve FundCapital Projects Fund
103

CITY OF MARTINSVILLE VIRGINIA Exhibit 17
Combining Schedule of Fiduciary Net Assets -Agency FundsAt June 30, 2012
West SouthernPiedmont VirginiaBusiness Police Recreation
Insurance Sheriff's Development Academy FacilityFund Fund Center Fund Fund Authority Total
ASSETS
Cash and cash equivalents $ 467,908 $ 97,474 $ 88,738 $ 508,963 $ 95,617 $ 1,258,700
Total assets $ 467,908 $ 97,474 $ 88,738 $ 508,963 $ 95,617 $ 1,258,700
LIABILITIES
Accounts payable $ - $ 134 $ 7,689 $ 6,321 $ 14,592 $ 28,736Amounts held for others 467,908 97,340 81,049 502,642 81,025 1,229,964
Total liabilities $ 467,908 $ 97,474 $ 88,738 $ 508,963 $ 95,617 $ 1,258,700
104
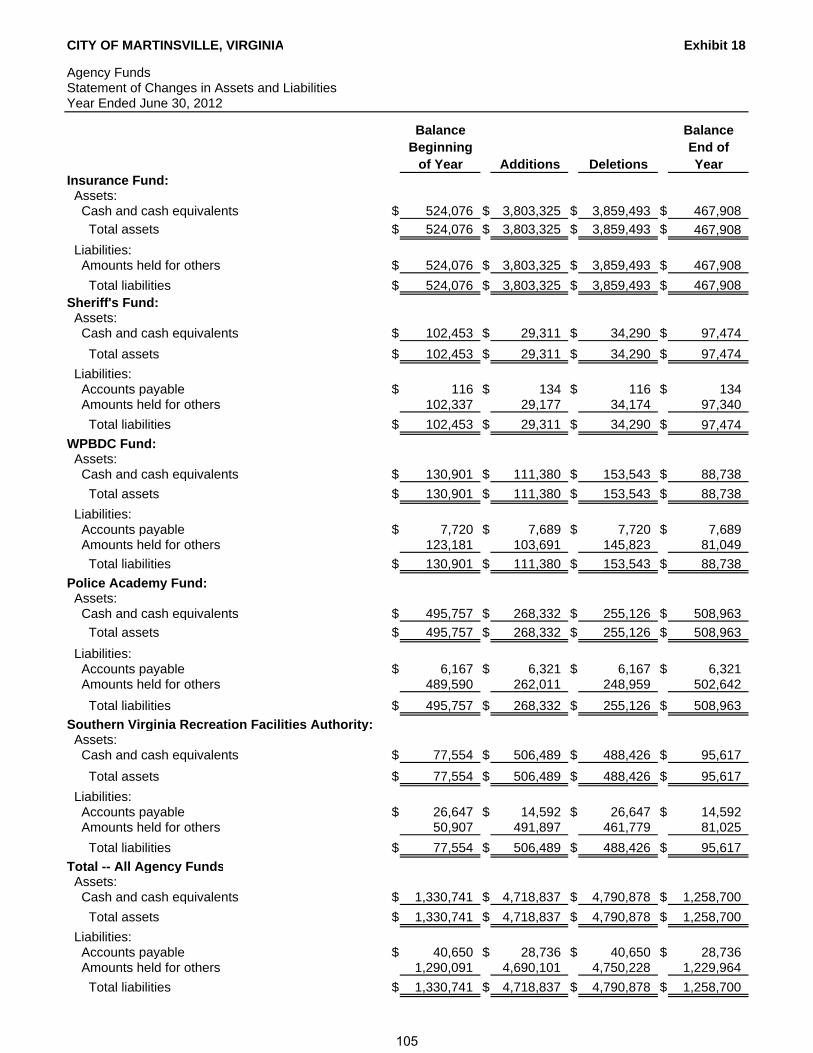
CITY OF MARTINSVILLE, VIRGINIA Exhibit 18
Agency FundsStatement of Changes in Assets and LiabilitiesYear Ended June 30, 2012
Balance BalanceBeginning End of
of Year Additions Deletions YearInsurance Fund: Assets: Cash and cash equivalents $ 524,076 $ 3,803,325 $ 3,859,493 $ 467,908
Total assets $ 524,076 $ 3,803,325 $ 3,859,493 $ 467,908
Liabilities: Amounts held for others $ 524,076 $ 3,803,325 $ 3,859,493 $ 467,908
Total liabilities $ 524,076 $ 3,803,325 $ 3,859,493 $ 467,908 Sheriff's Fund: Assets: Cash and cash equivalents $ 102,453 $ 29,311 $ 34,290 $ 97,474
Total assets $ 102,453 $ 29,311 $ 34,290 $ 97,474
Liabilities: Accounts payable $ 116 $ 134 $ 116 $ 134 Amounts held for others 102,337 29,177 34,174 97,340
Total liabilities $ 102,453 $ 29,311 $ 34,290 $ 97,474
WPBDC Fund: Assets: Cash and cash equivalents $ 130,901 $ 111,380 $ 153,543 $ 88,738
Total assets $ 130,901 $ 111,380 $ 153,543 $ 88,738
Liabilities: Accounts payable $ 7,720 $ 7,689 $ 7,720 $ 7,689 Amounts held for others 123,181 103,691 145,823 81,049
Total liabilities $ 130,901 $ 111,380 $ 153,543 $ 88,738
Police Academy Fund: Assets: Cash and cash equivalents $ 495,757 $ 268,332 $ 255,126 $ 508,963
Total assets $ 495,757 $ 268,332 $ 255,126 $ 508,963
Liabilities: Accounts payable $ 6,167 $ 6,321 $ 6,167 $ 6,321 Amounts held for others 489,590 262,011 248,959 502,642
Total liabilities $ 495,757 $ 268,332 $ 255,126 $ 508,963
Southern Virginia Recreation Facilities Authority: Assets: Cash and cash equivalents $ 77,554 $ 506,489 $ 488,426 $ 95,617
Total assets $ 77,554 $ 506,489 $ 488,426 $ 95,617
Liabilities: Accounts payable $ 26,647 $ 14,592 $ 26,647 $ 14,592 Amounts held for others 50,907 491,897 461,779 81,025
Total liabilities $ 77,554 $ 506,489 $ 488,426 $ 95,617
Total -- All Agency Funds Assets: Cash and cash equivalents $ 1,330,741 $ 4,718,837 $ 4,790,878 $ 1,258,700
Total assets $ 1,330,741 $ 4,718,837 $ 4,790,878 $ 1,258,700
Liabilities: Accounts payable $ 40,650 $ 28,736 $ 40,650 $ 28,736 Amounts held for others 1,290,091 4,690,101 4,750,228 1,229,964
Total liabilities $ 1,330,741 $ 4,718,837 $ 4,790,878 $ 1,258,700
105

This page intentionally left blank

Discretely Presented Component Unit—School Board
107

This page intentionally left blank
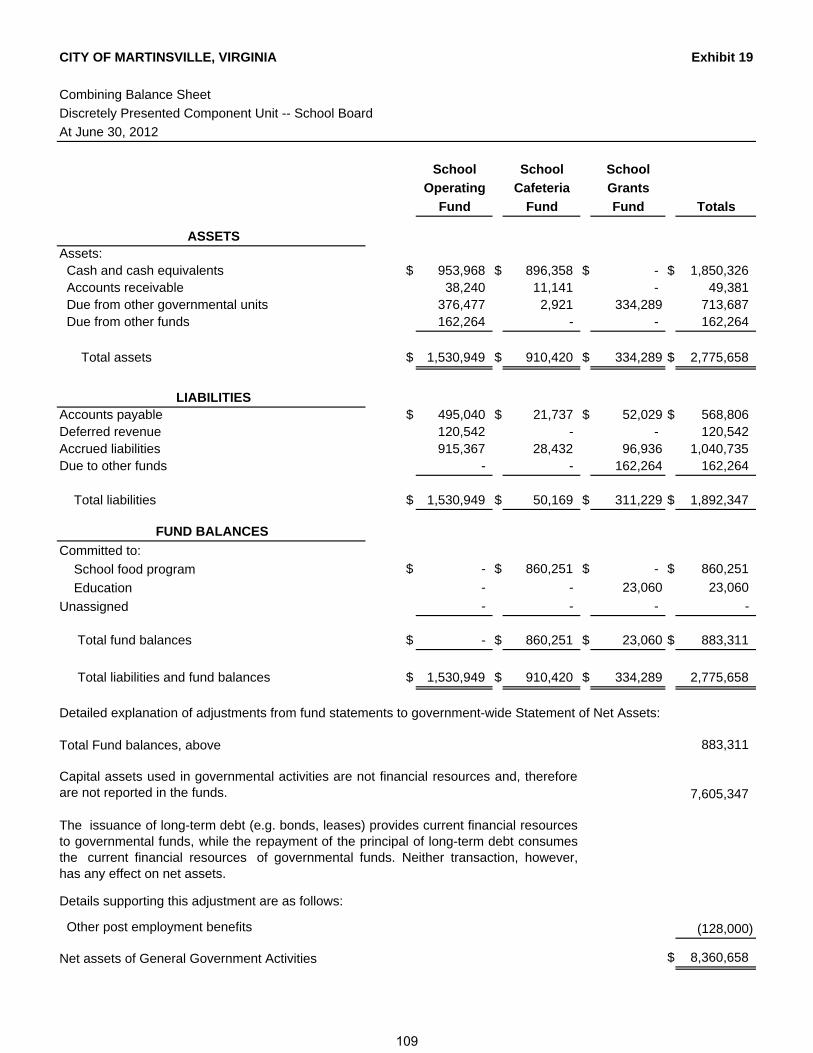
CITY OF MARTINSVILLE, VIRGINIA Exhibit 19
Combining Balance Sheet
Discretely Presented Component Unit -- School Board
At June 30, 2012
School School School
Operating Cafeteria Grants
Fund Fund Fund Totals
ASSETSAssets: Cash and cash equivalents $ 953,968 $ 896,358 $ - $ 1,850,326 Accounts receivable 38,240 11,141 - 49,381 Due from other governmental units 376,477 2,921 334,289 713,687 Due from other funds 162,264 - - 162,264
Total assets $ 1,530,949 $ 910,420 $ 334,289 $ 2,775,658
LIABILITIESAccounts payable $ 495,040 $ 21,737 $ 52,029 $ 568,806Deferred revenue 120,542 - - 120,542Accrued liabilities 915,367 28,432 96,936 1,040,735Due to other funds - - 162,264 162,264
Total liabilities $ 1,530,949 $ 50,169 $ 311,229 $ 1,892,347
FUND BALANCES
Committed to:
School food program $ - $ 860,251 $ - $ 860,251
Education - - 23,060 23,060
Unassigned - - - -
Total fund balances $ - $ 860,251 $ 23,060 $ 883,311
Total liabilities and fund balances $ 1,530,949 $ 910,420 $ 334,289 2,775,658
Detailed explanation of adjustments from fund statements to government-wide Statement of Net Assets:
Total Fund balances, above 883,311
7,605,347
Details supporting this adjustment are as follows:
Other post employment benefits (128,000)
Net assets of General Government Activities $ 8,360,658
The issuance of long-term debt (e.g. bonds, leases) provides current financial resourcesto governmental funds, while the repayment of the principal of long-term debt consumesthe current financial resources of governmental funds. Neither transaction, however,has any effect on net assets.
Capital assets used in governmental activities are not financial resources and, thereforeare not reported in the funds.
109
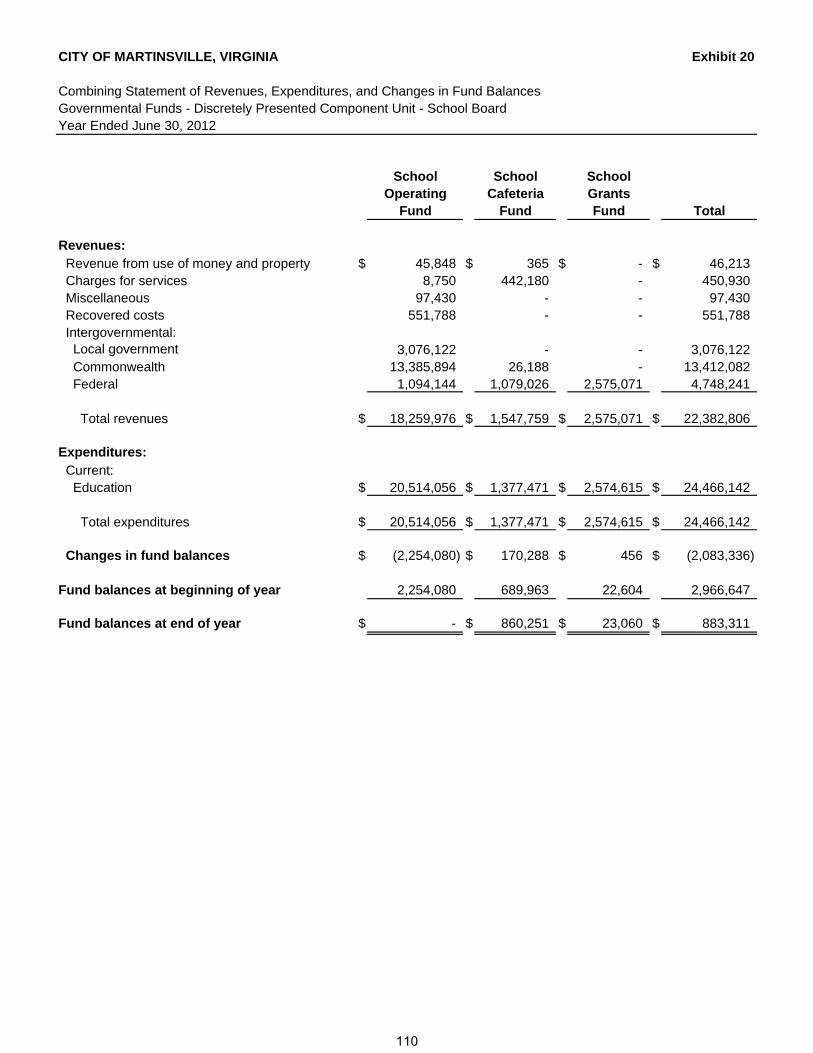
CITY OF MARTINSVILLE, VIRGINIA Exhibit 20
Combining Statement of Revenues, Expenditures, and Changes in Fund BalancesGovernmental Funds - Discretely Presented Component Unit - School BoardYear Ended June 30, 2012
School School SchoolOperating Cafeteria Grants
Fund Fund Fund Total
Revenues: Revenue from use of money and property $ 45,848 $ 365 $ - $ 46,213 Charges for services 8,750 442,180 - 450,930 Miscellaneous 97,430 - - 97,430 Recovered costs 551,788 - - 551,788 Intergovernmental: Local government 3,076,122 - - 3,076,122 Commonwealth 13,385,894 26,188 - 13,412,082 Federal 1,094,144 1,079,026 2,575,071 4,748,241
Total revenues $ 18,259,976 $ 1,547,759 $ 2,575,071 $ 22,382,806
Expenditures: Current: Education $ 20,514,056 $ 1,377,471 $ 2,574,615 $ 24,466,142
Total expenditures $ 20,514,056 $ 1,377,471 $ 2,574,615 $ 24,466,142
Changes in fund balances $ (2,254,080) $ 170,288 $ 456 $ (2,083,336)
Fund balances at beginning of year 2,254,080 689,963 22,604 2,966,647
Fund balances at end of year $ - $ 860,251 $ 23,060 $ 883,311
110
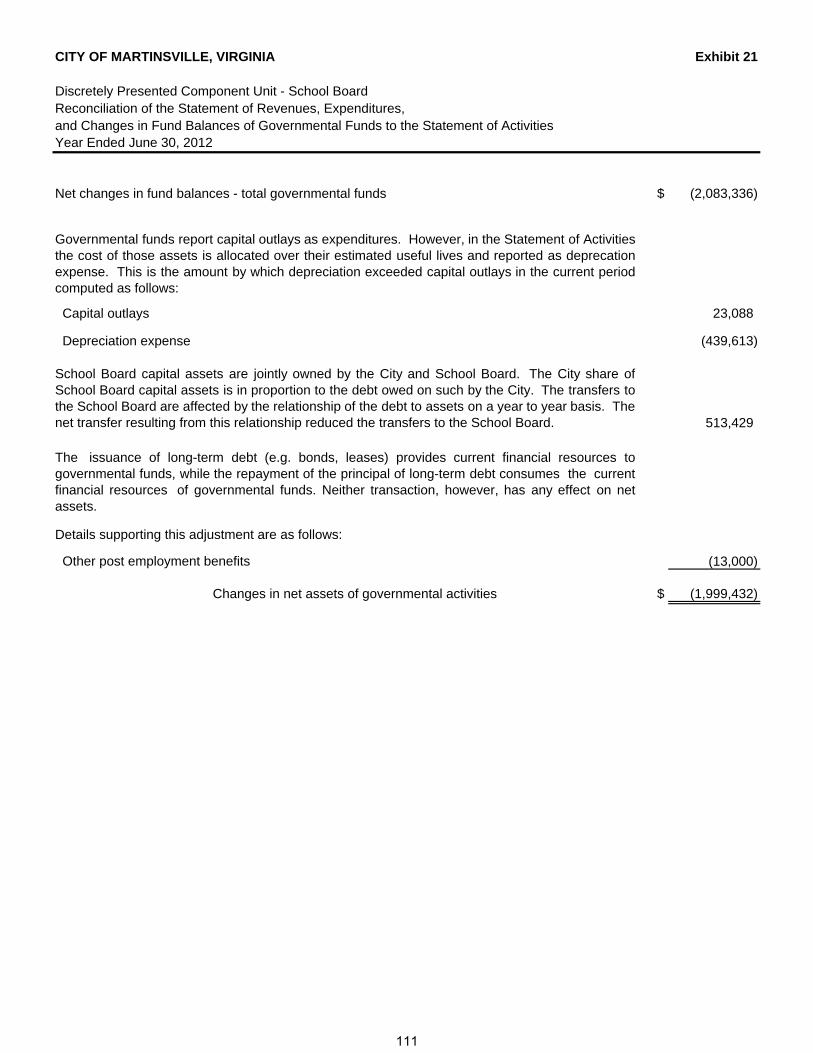
CITY OF MARTINSVILLE, VIRGINIA Exhibit 21
Discretely Presented Component Unit - School BoardReconciliation of the Statement of Revenues, Expenditures, and Changes in Fund Balances of Governmental Funds to the Statement of ActivitiesYear Ended June 30, 2012
Net changes in fund balances - total governmental funds $ (2,083,336)
Capital outlays 23,088
Depreciation expense (439,613)
513,429
(13,000)
Changes in net assets of governmental activities $ (1,999,432)
Other post employment benefits
Governmental funds report capital outlays as expenditures. However, in the Statement of Activitiesthe cost of those assets is allocated over their estimated useful lives and reported as deprecationexpense. This is the amount by which depreciation exceeded capital outlays in the current periodcomputed as follows:
School Board capital assets are jointly owned by the City and School Board. The City share ofSchool Board capital assets is in proportion to the debt owed on such by the City. The transfers tothe School Board are affected by the relationship of the debt to assets on a year to year basis. Thenet transfer resulting from this relationship reduced the transfers to the School Board.
The issuance of long-term debt (e.g. bonds, leases) provides current financial resources togovernmental funds, while the repayment of the principal of long-term debt consumes the currentfinancial resources of governmental funds. Neither transaction, however, has any effect on netassets.
Details supporting this adjustment are as follows:
111

CITY OF MARTINSVILLE, VIRGINIA
Schedule of Revenues, Expenditures and Changes in Fund Balances --Budget and Actual -- Discretely Presented Component Unit - School BoardYear Ended June 30, 2012
School Operating FundVariance
FromFinal
Budget BudgetOriginal As PositiveBudget Amended Actual (Negative)
Revenues: Revenue from use of money and property $ 35,000 $ 35,000 $ 45,848 $ 10,848 Charges for services 5,000 5,000 8,750 3,750 Miscellaneous - 140,000 97,430 (42,570) Recovered costs 307,451 307,451 551,788 244,337 Intergovernmental: Local government 5,678,608 5,678,608 3,076,122 (2,602,486) Commonwealth 13,718,680 13,718,680 13,385,894 (332,786) Federal 982,966 982,966 1,094,144 111,178
Total revenues $ 20,727,705 $ 20,867,705 $ 18,259,976 $ (2,607,729)
Expenditures: Current: Education $ 20,727,705 $ 21,006,234 $ 20,514,056 $ 492,178
Total expenditures $ 20,727,705 $ 21,006,234 $ 20,514,056 $ 492,178
Changes in fund balances $ - $ (138,529) $ (2,254,080) $ (2,115,551)
Fund balances at beginning of year - 138,529 2,254,080 2,115,551
Fund balances at end of year $ - $ - $ - $ -
112

Exhibit 22
School Cafeteria FundVariance Variance
From FromFinal Amended
Budget Budget Budget BudgetOriginal As Positive Original As PositiveBudget Amended Actual (Negative) Budget Amended Actual (Negative)
$ 2,300 $ 2,300 $ 365 $ (1,935) $ - $ - $ - $ - 548,400 548,400 442,180 (106,220) - - - -
- - - - - - - - - - - - - - - -
- - - - 34,984 34,984 26,188 (8,796) - - - -
733,977 733,977 1,079,026 345,049 - - 2,575,071 2,575,071
$ 1,319,661 $ 1,319,661 $ 1,547,759 $ 228,098 $ - $ - $ 2,575,071 $ 2,575,071
$ 1,319,661 $ 1,319,661 $ 1,377,471 $ (57,810) $ - $ - $ 2,574,615 $ (2,574,615)
$ 1,319,661 $ 1,319,661 $ 1,377,471 $ (57,810) $ - $ - $ 2,574,615 $ (2,574,615)
$ - $ - $ 170,288 $ 170,288 $ - $ - $ 456 $ 456
- - 689,963 689,963 - - 22,604 22,604
$ - $ - $ 860,251 $ 860,251 $ - $ - $ 23,060 $ 23,060
School Grants Fund
113

This page intentionally left blank

Supporting Schedules
115

This page intentionally left blank
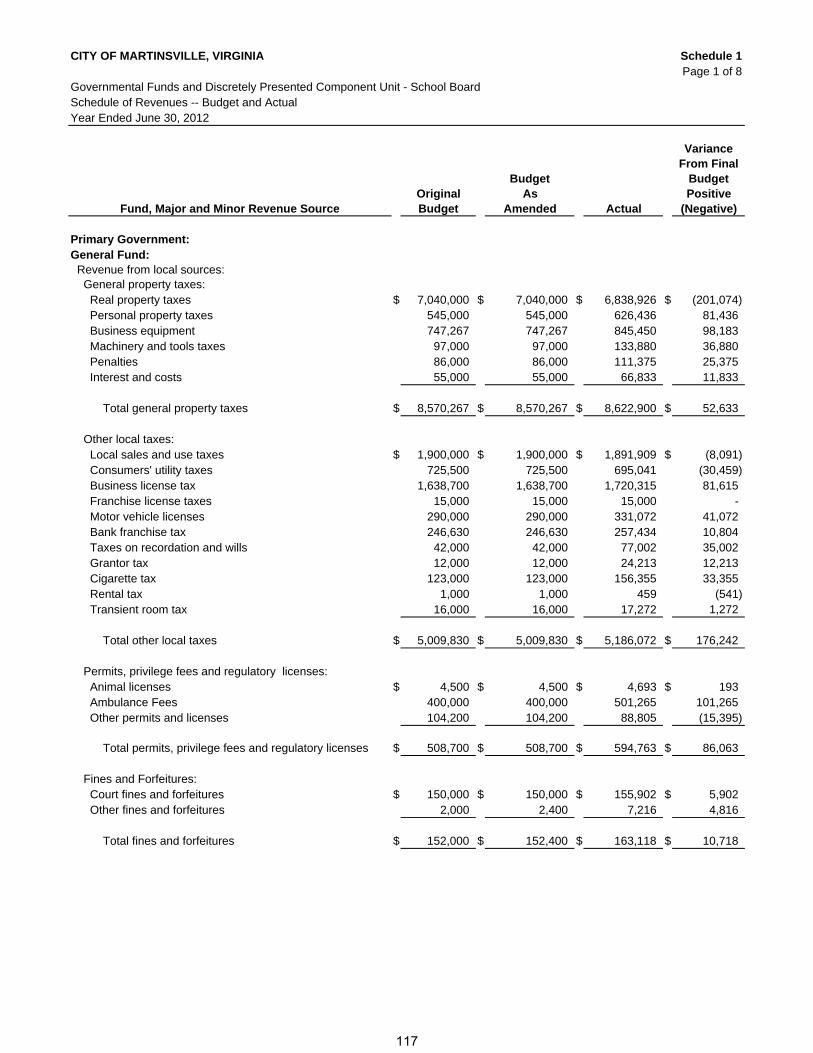
CITY OF MARTINSVILLE, VIRGINIA Schedule 1Page 1 of 8
Governmental Funds and Discretely Presented Component Unit - School BoardSchedule of Revenues -- Budget and ActualYear Ended June 30, 2012
VarianceFrom Final
Budget BudgetOriginal As Positive
Fund, Major and Minor Revenue Source Budget Amended Actual (Negative)
Primary Government: General Fund: Revenue from local sources: General property taxes: Real property taxes $ 7,040,000 $ 7,040,000 $ 6,838,926 $ (201,074) Personal property taxes 545,000 545,000 626,436 81,436 Business equipment 747,267 747,267 845,450 98,183 Machinery and tools taxes 97,000 97,000 133,880 36,880 Penalties 86,000 86,000 111,375 25,375 Interest and costs 55,000 55,000 66,833 11,833
Total general property taxes $ 8,570,267 $ 8,570,267 $ 8,622,900 $ 52,633
Other local taxes: Local sales and use taxes $ 1,900,000 $ 1,900,000 $ 1,891,909 $ (8,091) Consumers' utility taxes 725,500 725,500 695,041 (30,459) Business license tax 1,638,700 1,638,700 1,720,315 81,615 Franchise license taxes 15,000 15,000 15,000 - Motor vehicle licenses 290,000 290,000 331,072 41,072 Bank franchise tax 246,630 246,630 257,434 10,804 Taxes on recordation and wills 42,000 42,000 77,002 35,002 Grantor tax 12,000 12,000 24,213 12,213 Cigarette tax 123,000 123,000 156,355 33,355 Rental tax 1,000 1,000 459 (541) Transient room tax 16,000 16,000 17,272 1,272
Total other local taxes $ 5,009,830 $ 5,009,830 $ 5,186,072 $ 176,242
Permits, privilege fees and regulatory licenses: Animal licenses $ 4,500 $ 4,500 $ 4,693 $ 193 Ambulance Fees 400,000 400,000 501,265 101,265 Other permits and licenses 104,200 104,200 88,805 (15,395) Total permits, privilege fees and regulatory licenses $ 508,700 $ 508,700 $ 594,763 $ 86,063 Fines and Forfeitures: Court fines and forfeitures $ 150,000 $ 150,000 $ 155,902 $ 5,902 Other fines and forfeitures 2,000 2,400 7,216 4,816
Total fines and forfeitures $ 152,000 $ 152,400 $ 163,118 $ 10,718
117
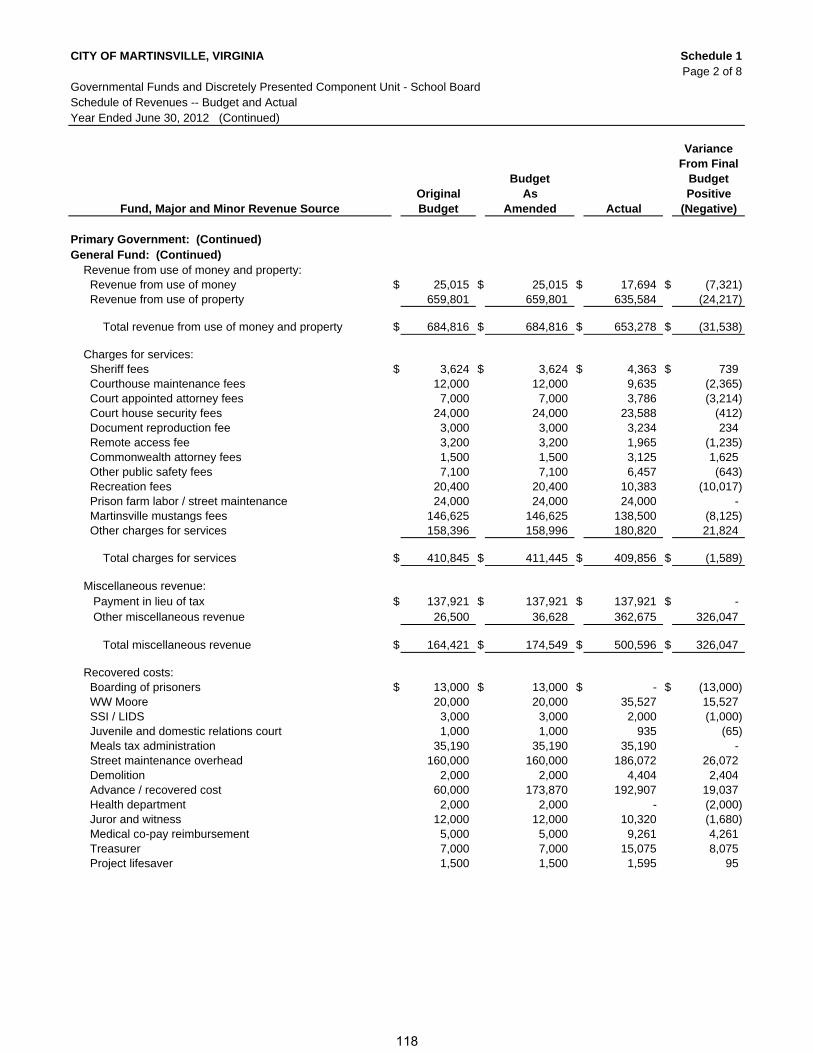
CITY OF MARTINSVILLE, VIRGINIA Schedule 1Page 2 of 8
Governmental Funds and Discretely Presented Component Unit - School BoardSchedule of Revenues -- Budget and ActualYear Ended June 30, 2012 (Continued)
VarianceFrom Final
Budget BudgetOriginal As Positive
Fund, Major and Minor Revenue Source Budget Amended Actual (Negative)
Primary Government: (Continued)General Fund: (Continued) Revenue from use of money and property: Revenue from use of money $ 25,015 $ 25,015 $ 17,694 $ (7,321) Revenue from use of property 659,801 659,801 635,584 (24,217)
Total revenue from use of money and property $ 684,816 $ 684,816 $ 653,278 $ (31,538)
Charges for services: Sheriff fees $ 3,624 $ 3,624 $ 4,363 $ 739 Courthouse maintenance fees 12,000 12,000 9,635 (2,365) Court appointed attorney fees 7,000 7,000 3,786 (3,214) Court house security fees 24,000 24,000 23,588 (412) Document reproduction fee 3,000 3,000 3,234 234 Remote access fee 3,200 3,200 1,965 (1,235) Commonwealth attorney fees 1,500 1,500 3,125 1,625 Other public safety fees 7,100 7,100 6,457 (643) Recreation fees 20,400 20,400 10,383 (10,017) Prison farm labor / street maintenance 24,000 24,000 24,000 - Martinsville mustangs fees 146,625 146,625 138,500 (8,125) Other charges for services 158,396 158,996 180,820 21,824 Total charges for services $ 410,845 $ 411,445 $ 409,856 $ (1,589)
Miscellaneous revenue: Payment in lieu of tax $ 137,921 $ 137,921 $ 137,921 $ - Other miscellaneous revenue 26,500 36,628 362,675 326,047 Total miscellaneous revenue $ 164,421 $ 174,549 $ 500,596 $ 326,047
Recovered costs: Boarding of prisoners $ 13,000 $ 13,000 $ - $ (13,000) WW Moore 20,000 20,000 35,527 15,527 SSI / LIDS 3,000 3,000 2,000 (1,000) Juvenile and domestic relations court 1,000 1,000 935 (65) Meals tax administration 35,190 35,190 35,190 - Street maintenance overhead 160,000 160,000 186,072 26,072 Demolition 2,000 2,000 4,404 2,404 Advance / recovered cost 60,000 173,870 192,907 19,037 Health department 2,000 2,000 - (2,000) Juror and witness 12,000 12,000 10,320 (1,680) Medical co-pay reimbursement 5,000 5,000 9,261 4,261 Treasurer 7,000 7,000 15,075 8,075 Project lifesaver 1,500 1,500 1,595 95
118
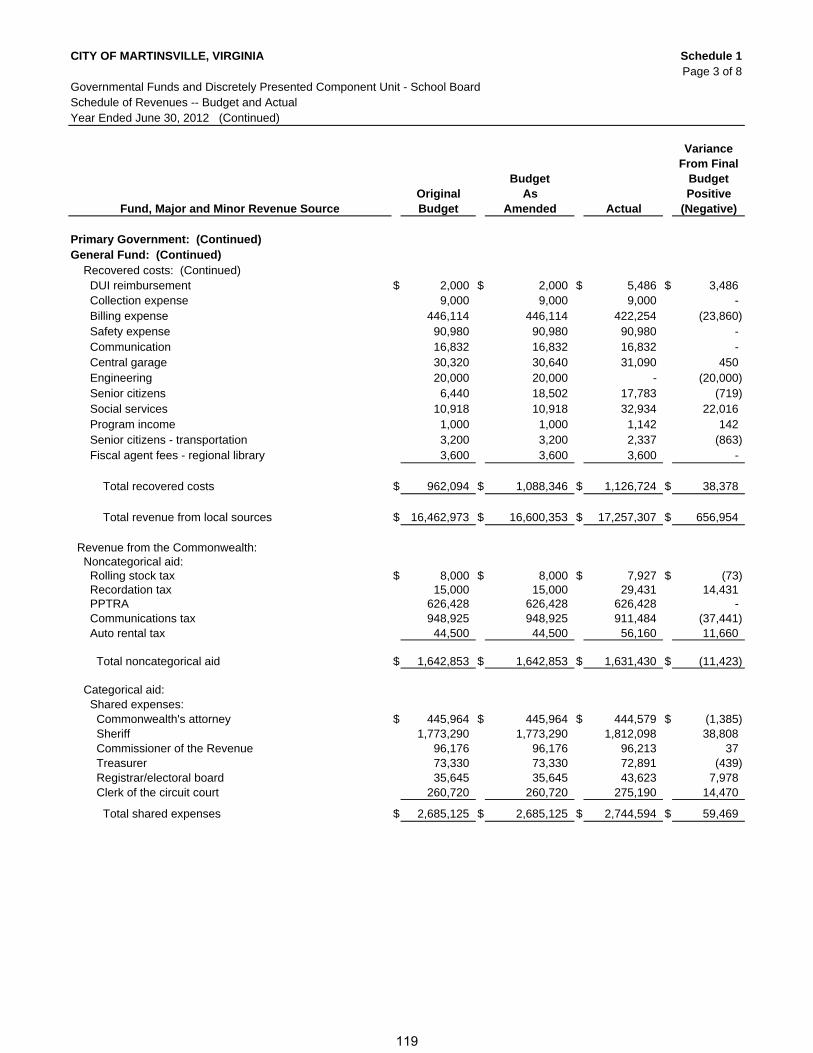
CITY OF MARTINSVILLE, VIRGINIA Schedule 1Page 3 of 8
Governmental Funds and Discretely Presented Component Unit - School BoardSchedule of Revenues -- Budget and ActualYear Ended June 30, 2012 (Continued)
VarianceFrom Final
Budget BudgetOriginal As Positive
Fund, Major and Minor Revenue Source Budget Amended Actual (Negative)
Primary Government: (Continued)General Fund: (Continued) Recovered costs: (Continued) DUI reimbursement $ 2,000 $ 2,000 $ 5,486 $ 3,486 Collection expense 9,000 9,000 9,000 - Billing expense 446,114 446,114 422,254 (23,860) Safety expense 90,980 90,980 90,980 - Communication 16,832 16,832 16,832 - Central garage 30,320 30,640 31,090 450 Engineering 20,000 20,000 - (20,000) Senior citizens 6,440 18,502 17,783 (719) Social services 10,918 10,918 32,934 22,016 Program income 1,000 1,000 1,142 142 Senior citizens - transportation 3,200 3,200 2,337 (863) Fiscal agent fees - regional library 3,600 3,600 3,600 -
Total recovered costs $ 962,094 $ 1,088,346 $ 1,126,724 $ 38,378
Total revenue from local sources $ 16,462,973 $ 16,600,353 $ 17,257,307 $ 656,954
Revenue from the Commonwealth: Noncategorical aid: Rolling stock tax $ 8,000 $ 8,000 $ 7,927 $ (73) Recordation tax 15,000 15,000 29,431 14,431 PPTRA 626,428 626,428 626,428 - Communications tax 948,925 948,925 911,484 (37,441) Auto rental tax 44,500 44,500 56,160 11,660
Total noncategorical aid $ 1,642,853 $ 1,642,853 $ 1,631,430 $ (11,423)
Categorical aid: Shared expenses: Commonwealth's attorney $ 445,964 $ 445,964 $ 444,579 $ (1,385) Sheriff 1,773,290 1,773,290 1,812,098 38,808 Commissioner of the Revenue 96,176 96,176 96,213 37 Treasurer 73,330 73,330 72,891 (439) Registrar/electoral board 35,645 35,645 43,623 7,978 Clerk of the circuit court 260,720 260,720 275,190 14,470
Total shared expenses $ 2,685,125 $ 2,685,125 $ 2,744,594 $ 59,469
119
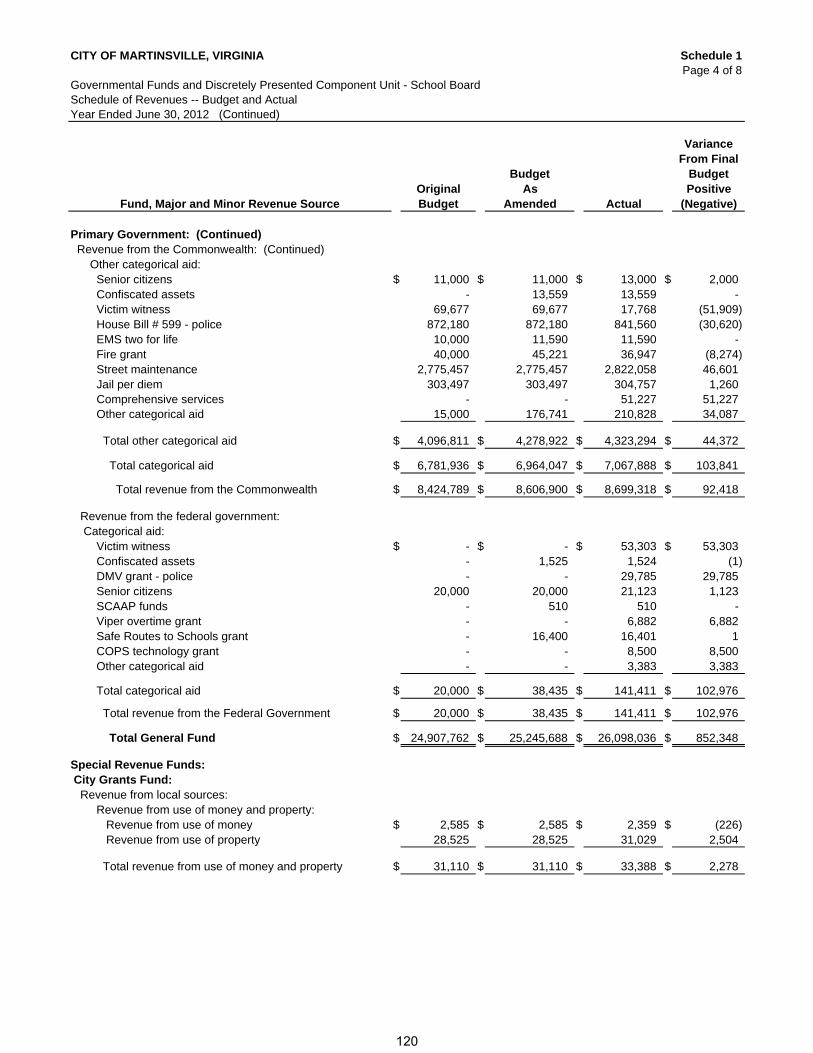
CITY OF MARTINSVILLE, VIRGINIA Schedule 1Page 4 of 8
Governmental Funds and Discretely Presented Component Unit - School BoardSchedule of Revenues -- Budget and ActualYear Ended June 30, 2012 (Continued)
VarianceFrom Final
Budget BudgetOriginal As Positive
Fund, Major and Minor Revenue Source Budget Amended Actual (Negative)
Primary Government: (Continued) Revenue from the Commonwealth: (Continued) Other categorical aid: Senior citizens $ 11,000 $ 11,000 $ 13,000 $ 2,000 Confiscated assets - 13,559 13,559 - Victim witness 69,677 69,677 17,768 (51,909) House Bill # 599 - police 872,180 872,180 841,560 (30,620) EMS two for life 10,000 11,590 11,590 - Fire grant 40,000 45,221 36,947 (8,274) Street maintenance 2,775,457 2,775,457 2,822,058 46,601 Jail per diem 303,497 303,497 304,757 1,260 Comprehensive services - - 51,227 51,227 Other categorical aid 15,000 176,741 210,828 34,087
Total other categorical aid $ 4,096,811 $ 4,278,922 $ 4,323,294 $ 44,372
Total categorical aid $ 6,781,936 $ 6,964,047 $ 7,067,888 $ 103,841
Total revenue from the Commonwealth $ 8,424,789 $ 8,606,900 $ 8,699,318 $ 92,418
Revenue from the federal government: Categorical aid: Victim witness $ - $ - $ 53,303 $ 53,303 Confiscated assets - 1,525 1,524 (1) DMV grant - police - - 29,785 29,785 Senior citizens 20,000 20,000 21,123 1,123 SCAAP funds - 510 510 - Viper overtime grant - - 6,882 6,882 Safe Routes to Schools grant - 16,400 16,401 1 COPS technology grant - - 8,500 8,500 Other categorical aid - - 3,383 3,383
Total categorical aid $ 20,000 $ 38,435 $ 141,411 $ 102,976
Total revenue from the Federal Government $ 20,000 $ 38,435 $ 141,411 $ 102,976
Total General Fund $ 24,907,762 $ 25,245,688 $ 26,098,036 $ 852,348
Special Revenue Funds: City Grants Fund: Revenue from local sources: Revenue from use of money and property: Revenue from use of money $ 2,585 $ 2,585 $ 2,359 $ (226) Revenue from use of property 28,525 28,525 31,029 2,504
Total revenue from use of money and property $ 31,110 $ 31,110 $ 33,388 $ 2,278
120
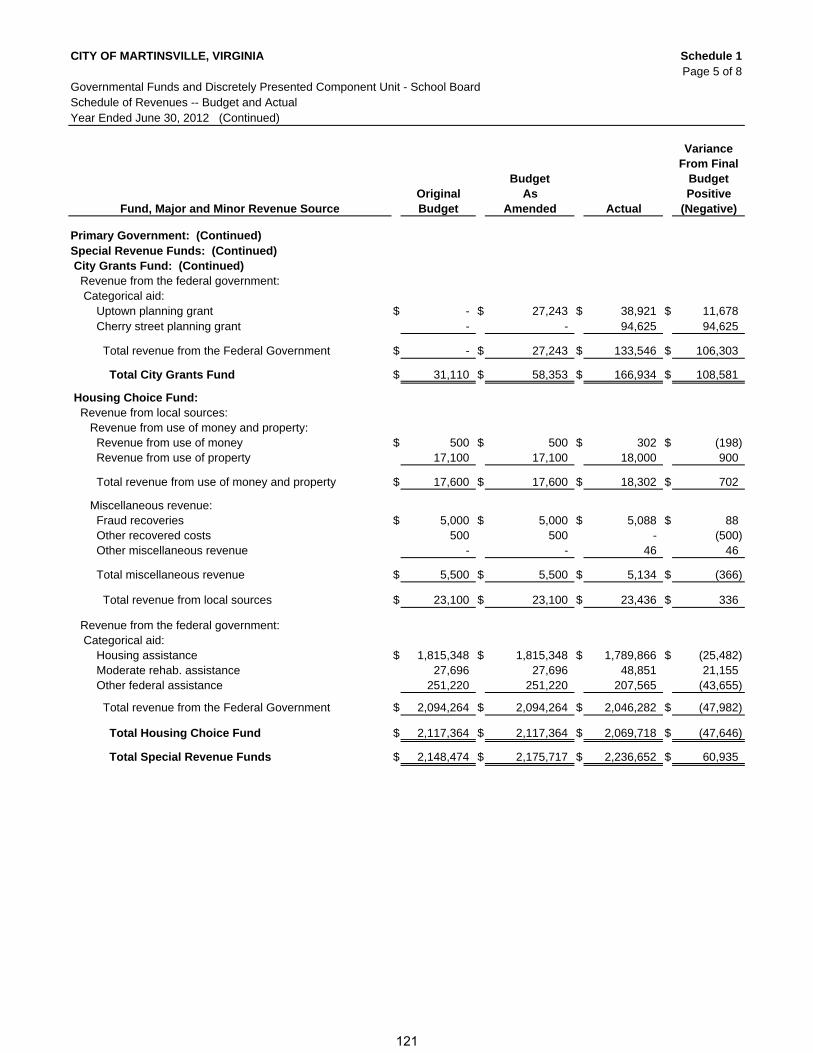
CITY OF MARTINSVILLE, VIRGINIA Schedule 1Page 5 of 8
Governmental Funds and Discretely Presented Component Unit - School BoardSchedule of Revenues -- Budget and ActualYear Ended June 30, 2012 (Continued)
VarianceFrom Final
Budget BudgetOriginal As Positive
Fund, Major and Minor Revenue Source Budget Amended Actual (Negative)
Primary Government: (Continued)Special Revenue Funds: (Continued) City Grants Fund: (Continued) Revenue from the federal government: Categorical aid: Uptown planning grant $ - $ 27,243 $ 38,921 $ 11,678 Cherry street planning grant - - 94,625 94,625
Total revenue from the Federal Government $ - $ 27,243 $ 133,546 $ 106,303
Total City Grants Fund $ 31,110 $ 58,353 $ 166,934 $ 108,581
Housing Choice Fund: Revenue from local sources: Revenue from use of money and property: Revenue from use of money $ 500 $ 500 $ 302 $ (198) Revenue from use of property 17,100 17,100 18,000 900
Total revenue from use of money and property $ 17,600 $ 17,600 $ 18,302 $ 702
Miscellaneous revenue: Fraud recoveries $ 5,000 $ 5,000 $ 5,088 $ 88 Other recovered costs 500 500 - (500) Other miscellaneous revenue - - 46 46
Total miscellaneous revenue $ 5,500 $ 5,500 $ 5,134 $ (366) Total revenue from local sources $ 23,100 $ 23,100 $ 23,436 $ 336
Revenue from the federal government: Categorical aid: Housing assistance $ 1,815,348 $ 1,815,348 $ 1,789,866 $ (25,482) Moderate rehab. assistance 27,696 27,696 48,851 21,155 Other federal assistance 251,220 251,220 207,565 (43,655)
Total revenue from the Federal Government $ 2,094,264 $ 2,094,264 $ 2,046,282 $ (47,982)
Total Housing Choice Fund $ 2,117,364 $ 2,117,364 $ 2,069,718 $ (47,646)
Total Special Revenue Funds $ 2,148,474 $ 2,175,717 $ 2,236,652 $ 60,935
121
CITY OF MARTINSVILLE, VIRGINIA Schedule 1Page 6 of 8
Governmental Funds and Discretely Presented Component Unit - School BoardSchedule of Revenues -- Budget and ActualYear Ended June 30, 2012 (Continued)
VarianceFrom Final
Budget BudgetOriginal As Positive
Fund, Major and Minor Revenue Source Budget Amended Actual (Negative)
Primary Government: (Continued)Capital Projects Funds: Capital Reserve Fund: Revenue from local sources: Revenue from use of money and property: Revenue from use of money $ - $ - $ 5,349 $ 5,349
Miscellaneous revenue: Miscellaneous $ - $ 5,000 $ 5,000 $ -
Total revenue from local sources $ - $ 5,000 $ 10,349 $ 5,349
Revenue from the Commonwealth: Categorical aid: Rescue squad assistance fund $ 141,360 $ 141,360 $ 141,360 $ -
Revenue from the federal government: Categorical aid: VDEM homeland security program $ - $ 4,464 $ 35,720 $ 31,256 USDA Grant - 400,000 400,000 -
Total revenue from the Federal Government $ - $ 404,464 $ 435,720 $ 31,256
Total Capital Reserve Fund $ 141,360 $ 550,824 $ 587,429 $ 36,605
Meals Tax Fund: Revenue from local sources: Other local taxes: Meals taxes $ 1,388,475 $ 1,388,475 $ 1,434,966 $ 46,491
Revenue from use of money and property: Revenue from use of money $ - $ - $ 15,041 $ 15,041
Total revenue from local sources $ 1,388,475 $ 1,388,475 $ 1,450,007 $ 61,532
Revenue from the Federal Government Categorical aid: QSCB tax credit $ - $ - $ 182,254 $ 182,254
Total Meals Tax Fund $ 1,388,475 $ 1,388,475 $ 1,632,261 $ 243,786
Total Capital Projects Funds $ 1,529,835 $ 1,939,299 $ 2,219,690 $ 280,391
Grand Total Revenues -- Primary Government $ 28,586,071 $ 29,360,704 $ 30,554,378 $ 1,193,674
Component Unit-School Board: Governmental Funds: School Operating Fund: Revenue from local sources: Revenue from use of money and property: Revenue from use of property $ 35,000 $ 35,000 $ 45,848 $ 10,848 Charges for services: Tuition and other charges for services $ 5,000 $ 5,000 $ 8,750 $ 3,750 Miscellaneous revenue: Miscellaneous revenue $ - $ 140,000 $ 97,430 $ (42,570) Recovered costs: Recovered costs $ 307,451 $ 307,451 $ 551,788 $ 244,337
Total revenue from local sources $ 347,451 $ 487,451 $ 703,816 $ 216,365
122
CITY OF MARTINSVILLE, VIRGINIA Schedule 1Page 7 of 8
Governmental Funds and Discretely Presented Component Unit - School BoardSchedule of Revenues -- Budget and ActualYear Ended June 30, 2012 (Continued)
VarianceFrom Final
Budget BudgetOriginal As Positive
Fund, Major and Minor Revenue Source Budget Amended Actual (Negative)
Component Unit-School Board: (Continued) Governmental Funds: (Continued) School Operating Fund: (Continued)
Intergovernmental revenue: Revenues from local governments: Contribution from City of Martinsville, Virginia $ 5,678,608 $ 5,678,608 $ 3,076,122 $ (2,602,486)
Revenue from the Commonwealth: Categorical aid: Share of state sales tax $ 2,690,042 $ 2,690,042 $ 2,637,655 $ (52,387) Basic school aid 6,300,999 6,300,999 6,102,241 (198,758) Share of fringe benefits - Fica 457,777 457,777 447,382 (10,395) Share of fringe benefits - VRS 414,914 414,914 405,492 (9,422) English as a second language 63,047 63,047 70,865 7,818 Group life insurance benefits 17,145 17,145 16,756 (389) Regional tuition special education 75,141 75,141 61,924 (13,217) Early reading intervention 44,665 44,665 47,016 2,351 Vocational SOQ payments 248,605 248,605 242,960 (5,645) Special education - basic 890,184 890,184 872,793 (17,391) At risk students 524,703 524,703 512,889 (11,814) Homebound education 23,630 23,630 23,248 (382) Remedial education 142,805 142,805 117,646 (25,159) Remediation SOQ payments 382,338 382,338 373,656 (8,682) Reduced K-3 529,937 529,937 550,385 20,448 Preschool initiative 246,037 246,037 246,037 - Textbooks 69,541 69,541 67,962 (1,579) Technology 165,563 165,563 164,043 (1,520) Other state funds 431,607 431,607 424,944 (6,663)
Total revenue from the Commonwealth $ 13,718,680 $ 13,718,680 $ 13,385,894 $ (332,786)
Revenue from the federal government: Categorical aid: Vocational education - Carl Perkins $ 64,255 $ 64,255 $ 69,141 $ 4,886 State fiscal stabilization funds 661,170 661,170 592,713 (68,457) NASA program 125,000 125,000 274,139 149,139 Workforce investment act 36,414 36,414 47,846 11,432 Other federal categorical aid 96,127 96,127 110,305 14,178
Total categorical aid $ 982,966 $ 982,966 $ 1,094,144 $ 111,178
Total revenue from the federal government $ 982,966 $ 982,966 $ 1,094,144 $ 111,178
Total School Operating Fund $ 20,727,705 $ 20,867,705 $ 18,259,976 $ (2,607,729)
123
CITY OF MARTINSVILLE, VIRGINIA Schedule 1Page 8 of 8
Governmental Funds and Discretely Presented Component Unit - School BoardSchedule of Revenues -- Budget and ActualYear Ended June 30, 2012 (Continued)
VarianceFrom Final
Budget BudgetOriginal As Positive
Fund, Major and Minor Revenue Source Budget Amended Actual (Negative)
Component Unit-School Board: (Continued) Governmental Funds: (Continued) School Cafeteria Fund: Revenue from local sources: Revenue from use of money and property: Revenue from use of money $ 2,300 $ 2,300 $ 365 $ (1,935)
Charges for services: Cafeteria sales $ 548,400 $ 548,400 $ 442,180 $ (106,220)
Revenue from the Commonwealth: Categorical aid: School food $ 34,984 $ 34,984 $ 26,188 $ (8,796)
Revenue from the federal government: Categorical aid: School food $ 733,977 $ 733,977 $ 1,079,026 $ 345,049
Total School Cafeteria Fund $ 1,319,661 $ 1,319,661 $ 1,547,759 $ 228,098
School Grants Fund: Revenue from the federal government: Categorical aid: Title I $ - $ - $ 1,123,011 $ 1,123,011 Title II - teacher quality - - 185,360 185,360 Title VI - rural education - - 288,142 288,142 Drug free schools - - 20,788 20,788 Special education - flow through - - 537,970 537,970 21st Century Title IV-B - - 419,800 419,800
Total revenue from the federal government $ - $ - $ 2,575,071 $ 2,575,071
Total School Grants Fund $ - $ - $ 2,575,071 $ 2,575,071
Grand Total Revenues--Component Unit - School Board $ 22,047,366 $ 22,187,366 $ 22,382,806 $ 195,440
124
CITY OF MARTINSVILLE, VIRGINIA Schedule 2Page 1 of 7
Governmental Funds and Discretely Presented Component Unit - School BoardSchedule of Expenditures - Budget and ActualYear Ended June 30, 2012
VarianceFrom Final
Budget BudgetOriginal As Positive
Fund, Function, Activity and Elements Budget Amended Actual (Negative)
Primary Government:General Fund:
General Government Administration: Legislative: City council $ 40,030 $ 40,030 $ 39,485 $ 545
General and Financial Administration: Clerk of council $ 1,844 $ 1,909 $ 1,413 $ 496 City attorney 93,837 93,837 90,258 3,579 City manager's office 237,373 237,373 178,782 58,591 Assistant city manager 64,493 64,493 63,062 1,431 Legal services 15,500 15,500 - 15,500 Human resources 142,474 143,550 155,807 (12,257) Employment services 344,365 347,237 250,610 96,627 Communications 16,831 16,831 6,948 9,883 Commissioner of the Revenue 390,828 393,850 389,945 3,905 Assessor 215 215 151 64 Treasurer 254,762 254,956 252,781 2,175 Finance director 53,358 53,358 74,156 (20,798) Accounting 226,878 226,878 163,226 63,652 Utility billing 444,990 444,990 425,653 19,337 Information services 341,068 341,068 338,767 2,301 Central garage 478,405 481,592 477,959 3,633 Purchasing 237,664 306,465 329,223 (22,758) Risk management 252,000 252,000 237,322 14,678 General expenses 498,992 469,640 581,376 (111,736)
Total general and financial administration $ 4,095,877 $ 4,145,742 $ 4,017,439 $ 128,303
Board of Elections: Electoral board and officials $ 19,937 $ 19,937 $ 22,145 $ (2,208) Registrar 120,574 135,922 115,021 20,901
Total board of elections $ 140,511 $ 155,859 $ 137,166 $ 18,693 Total general government administration $ 4,276,418 $ 4,341,631 $ 4,194,090 $ 147,541
Judicial Administration: Courts: Circuit court $ 88,891 $ 91,897 $ 83,655 $ 8,242 General district court 31,875 31,875 24,700 7,175 Juvenile and domestic relations court 7,580 7,580 7,345 235 Clerk of the circuit court 365,349 368,270 361,928 6,342 Sheriff - courts 849,993 863,326 787,549 75,777
Total Courts $ 1,343,688 $ 1,362,948 $ 1,265,177 $ 97,771
125

CITY OF MARTINSVILLE, VIRGINIA Schedule 2Page 2 of 7
Governmental Funds and Discretely Presented Component Unit - School BoardSchedule of Expenditures - Budget and ActualYear Ended June 30, 2012 (Continued)
VarianceFrom Final
Budget BudgetOriginal As Positive
Fund, Function, Activity and Elements Budget Amended Actual (Negative)
Primary Government: (Continued)General Fund: (Continued) Commonwealth Attorney: Commonwealth attorney $ 593,537 $ 606,145 $ 580,800 $ 25,345 Victim witness program 69,677 70,291 71,867 (1,576)
Total Commonwealth attorney $ 663,214 $ 676,436 $ 652,667 $ 23,769
Total judicial administration $ 2,006,902 $ 2,039,384 $ 1,917,844 $ 121,540
Public Safety: Law Enforcement and Traffic Control: Police department $ 3,776,911 $ 3,934,977 $ 3,685,626 $ 249,351 Transportation safety commission 1,500 1,500 1,293 207
Total law enforcement and traffic control $ 3,778,411 $ 3,936,477 $ 3,686,919 $ 249,558
Fire and Rescue Services: Fire services $ 1,916,675 $ 2,027,747 $ 1,942,467 $ 85,280 Emergency medical services 180,120 183,653 164,968 18,685
Total fire and rescue services $ 2,096,795 $ 2,211,400 $ 2,107,435 $ 103,965
Correction and Detention: Sheriff -corrections $ 2,415,157 $ 2,503,130 $ 2,367,306 $ 135,824 Sheriff -jail annex 169,655 170,944 158,739 12,205 Probation office 312,222 312,222 308,202 4,020
Total correction and detention $ 2,897,034 $ 2,986,296 $ 2,834,247 $ 152,049
Inspections: Building and other $ 256,127 $ 257,431 $ 204,937 $ 52,494
Other Protection: Safety $ 90,528 $ 90,917 $ 84,797 $ 6,120
Total public safety $ 9,118,895 $ 9,482,521 $ 8,918,335 $ 564,186
Public Works: Maintenance of highways, streets, bridges and sidewalks: Director of public works $ 97,726 $ 97,726 $ 90,788 $ 6,938
126
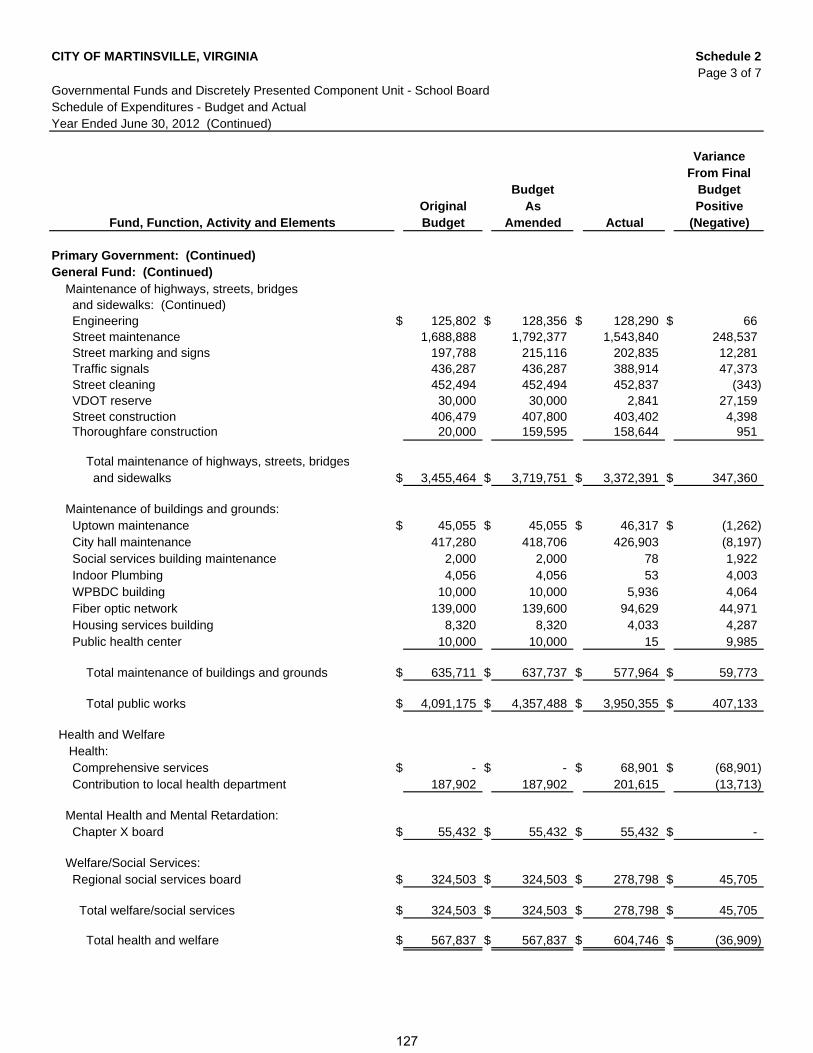
CITY OF MARTINSVILLE, VIRGINIA Schedule 2Page 3 of 7
Governmental Funds and Discretely Presented Component Unit - School BoardSchedule of Expenditures - Budget and ActualYear Ended June 30, 2012 (Continued)
VarianceFrom Final
Budget BudgetOriginal As Positive
Fund, Function, Activity and Elements Budget Amended Actual (Negative)
Primary Government: (Continued)General Fund: (Continued) Maintenance of highways, streets, bridges and sidewalks: (Continued) Engineering $ 125,802 $ 128,356 $ 128,290 $ 66 Street maintenance 1,688,888 1,792,377 1,543,840 248,537 Street marking and signs 197,788 215,116 202,835 12,281 Traffic signals 436,287 436,287 388,914 47,373 Street cleaning 452,494 452,494 452,837 (343) VDOT reserve 30,000 30,000 2,841 27,159 Street construction 406,479 407,800 403,402 4,398 Thoroughfare construction 20,000 159,595 158,644 951
Total maintenance of highways, streets, bridges and sidewalks $ 3,455,464 $ 3,719,751 $ 3,372,391 $ 347,360
Maintenance of buildings and grounds: Uptown maintenance $ 45,055 $ 45,055 $ 46,317 $ (1,262) City hall maintenance 417,280 418,706 426,903 (8,197) Social services building maintenance 2,000 2,000 78 1,922 Indoor Plumbing 4,056 4,056 53 4,003 WPBDC building 10,000 10,000 5,936 4,064 Fiber optic network 139,000 139,600 94,629 44,971 Housing services building 8,320 8,320 4,033 4,287 Public health center 10,000 10,000 15 9,985
Total maintenance of buildings and grounds $ 635,711 $ 637,737 $ 577,964 $ 59,773
Total public works $ 4,091,175 $ 4,357,488 $ 3,950,355 $ 407,133
Health and Welfare Health: Comprehensive services $ - $ - $ 68,901 $ (68,901) Contribution to local health department 187,902 187,902 201,615 (13,713)
Mental Health and Mental Retardation: Chapter X board $ 55,432 $ 55,432 $ 55,432 $ -
Welfare/Social Services: Regional social services board $ 324,503 $ 324,503 $ 278,798 $ 45,705
Total welfare/social services $ 324,503 $ 324,503 $ 278,798 $ 45,705
Total health and welfare $ 567,837 $ 567,837 $ 604,746 $ (36,909)
127
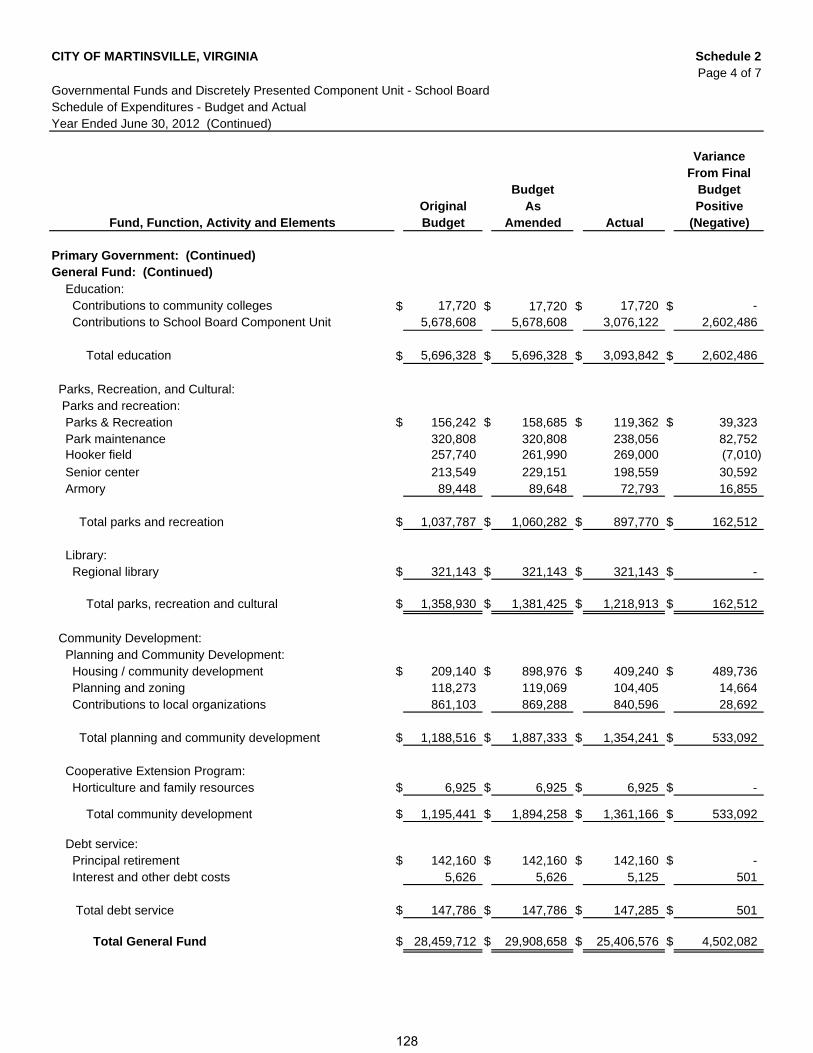
CITY OF MARTINSVILLE, VIRGINIA Schedule 2Page 4 of 7
Governmental Funds and Discretely Presented Component Unit - School BoardSchedule of Expenditures - Budget and ActualYear Ended June 30, 2012 (Continued)
VarianceFrom Final
Budget BudgetOriginal As Positive
Fund, Function, Activity and Elements Budget Amended Actual (Negative)
Primary Government: (Continued)General Fund: (Continued) Education: Contributions to community colleges $ 17,720 $ 17,720 $ 17,720 $ - Contributions to School Board Component Unit 5,678,608 5,678,608 3,076,122 2,602,486
Total education $ 5,696,328 $ 5,696,328 $ 3,093,842 $ 2,602,486
Parks, Recreation, and Cultural: Parks and recreation: Parks & Recreation $ 156,242 $ 158,685 $ 119,362 $ 39,323 Park maintenance 320,808 320,808 238,056 82,752 Hooker field 257,740 261,990 269,000 (7,010)
Senior center 213,549 229,151 198,559 30,592 Armory 89,448 89,648 72,793 16,855
Total parks and recreation $ 1,037,787 $ 1,060,282 $ 897,770 $ 162,512
Library: Regional library $ 321,143 $ 321,143 $ 321,143 $ -
Total parks, recreation and cultural $ 1,358,930 $ 1,381,425 $ 1,218,913 $ 162,512
Community Development: Planning and Community Development: Housing / community development $ 209,140 $ 898,976 $ 409,240 $ 489,736 Planning and zoning 118,273 119,069 104,405 14,664 Contributions to local organizations 861,103 869,288 840,596 28,692
Total planning and community development $ 1,188,516 $ 1,887,333 $ 1,354,241 $ 533,092
Cooperative Extension Program: Horticulture and family resources $ 6,925 $ 6,925 $ 6,925 $ -
Total community development $ 1,195,441 $ 1,894,258 $ 1,361,166 $ 533,092
Debt service: Principal retirement $ 142,160 $ 142,160 $ 142,160 $ - Interest and other debt costs 5,626 5,626 5,125 501
Total debt service $ 147,786 $ 147,786 $ 147,285 $ 501
Total General Fund $ 28,459,712 $ 29,908,658 $ 25,406,576 $ 4,502,082
128
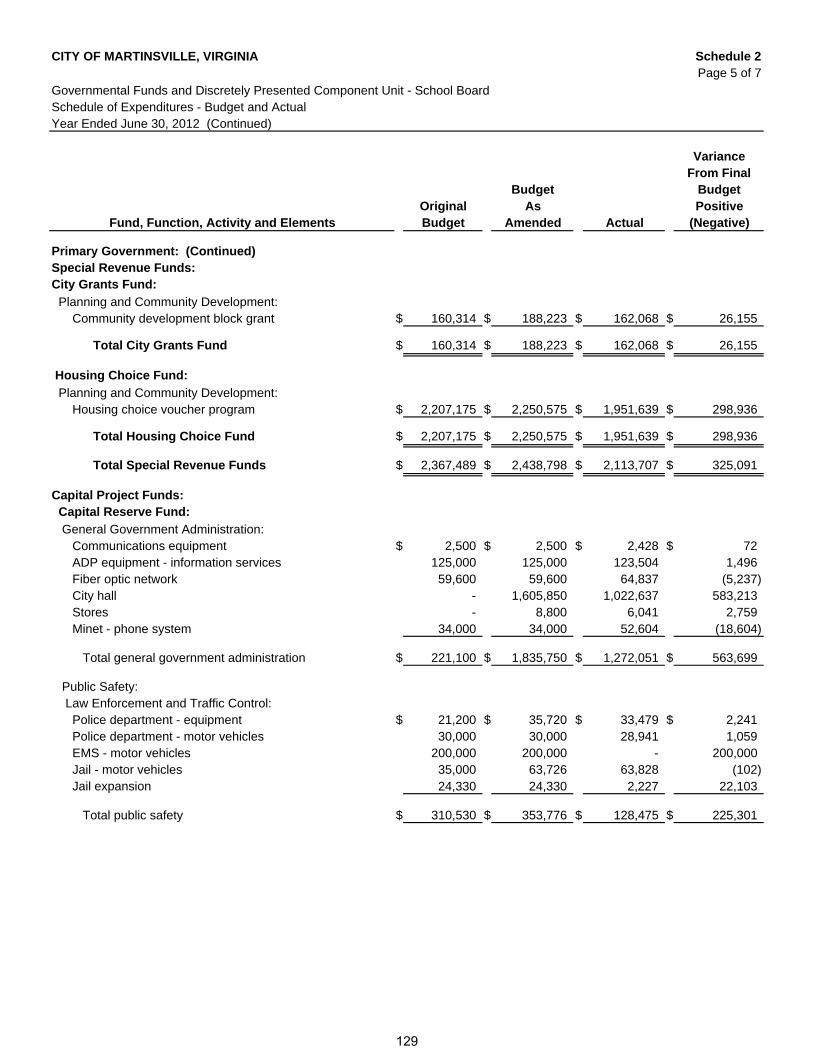
CITY OF MARTINSVILLE, VIRGINIA Schedule 2Page 5 of 7
Governmental Funds and Discretely Presented Component Unit - School BoardSchedule of Expenditures - Budget and ActualYear Ended June 30, 2012 (Continued)
VarianceFrom Final
Budget BudgetOriginal As Positive
Fund, Function, Activity and Elements Budget Amended Actual (Negative)
Primary Government: (Continued)Special Revenue Funds:City Grants Fund:
Planning and Community Development: Community development block grant $ 160,314 $ 188,223 $ 162,068 $ 26,155
Total City Grants Fund $ 160,314 $ 188,223 $ 162,068 $ 26,155
Housing Choice Fund:
Planning and Community Development: Housing choice voucher program $ 2,207,175 $ 2,250,575 $ 1,951,639 $ 298,936
Total Housing Choice Fund $ 2,207,175 $ 2,250,575 $ 1,951,639 $ 298,936
Total Special Revenue Funds $ 2,367,489 $ 2,438,798 $ 2,113,707 $ 325,091
Capital Project Funds: Capital Reserve Fund:
General Government Administration: Communications equipment $ 2,500 $ 2,500 $ 2,428 $ 72 ADP equipment - information services 125,000 125,000 123,504 1,496 Fiber optic network 59,600 59,600 64,837 (5,237) City hall - 1,605,850 1,022,637 583,213 Stores - 8,800 6,041 2,759 Minet - phone system 34,000 34,000 52,604 (18,604)
Total general government administration $ 221,100 $ 1,835,750 $ 1,272,051 $ 563,699
Public Safety: Law Enforcement and Traffic Control: Police department - equipment $ 21,200 $ 35,720 $ 33,479 $ 2,241 Police department - motor vehicles 30,000 30,000 28,941 1,059 EMS - motor vehicles 200,000 200,000 - 200,000 Jail - motor vehicles 35,000 63,726 63,828 (102) Jail expansion 24,330 24,330 2,227 22,103
Total public safety $ 310,530 $ 353,776 $ 128,475 $ 225,301
129
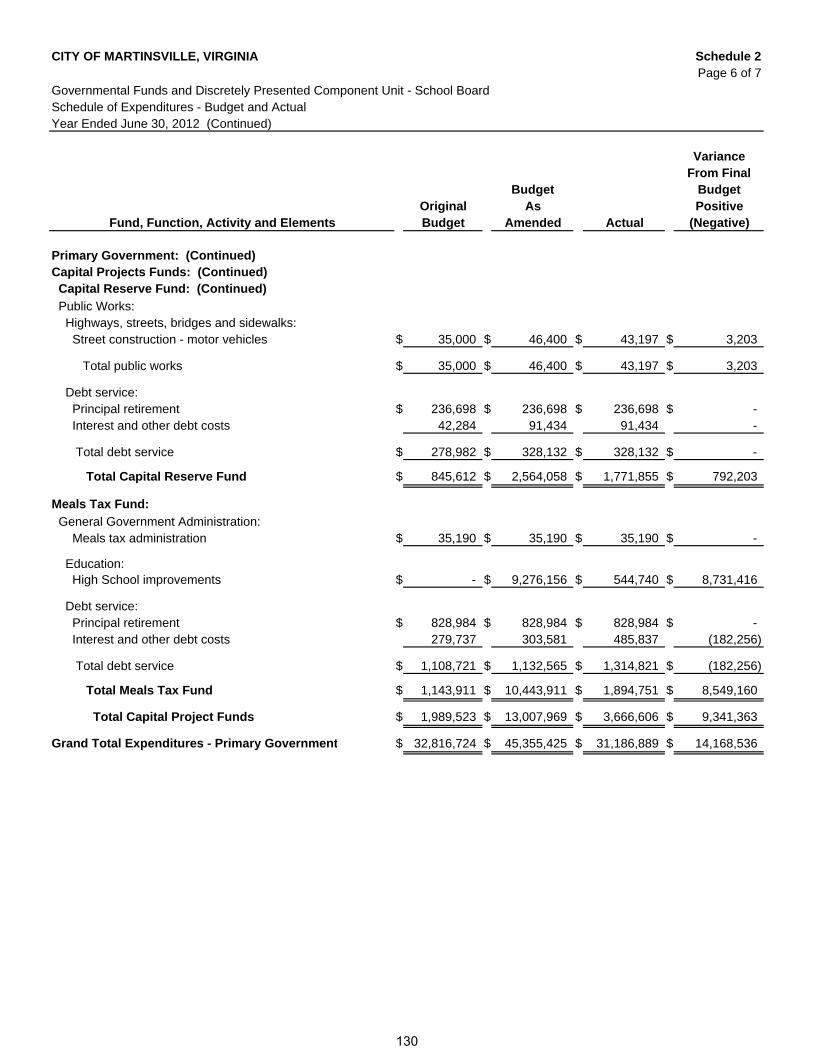
CITY OF MARTINSVILLE, VIRGINIA Schedule 2Page 6 of 7
Governmental Funds and Discretely Presented Component Unit - School BoardSchedule of Expenditures - Budget and ActualYear Ended June 30, 2012 (Continued)
VarianceFrom Final
Budget BudgetOriginal As Positive
Fund, Function, Activity and Elements Budget Amended Actual (Negative)
Primary Government: (Continued)Capital Projects Funds: (Continued) Capital Reserve Fund: (Continued)
Public Works: Highways, streets, bridges and sidewalks: Street construction - motor vehicles $ 35,000 $ 46,400 $ 43,197 $ 3,203
Total public works $ 35,000 $ 46,400 $ 43,197 $ 3,203
Debt service: Principal retirement $ 236,698 $ 236,698 $ 236,698 $ - Interest and other debt costs 42,284 91,434 91,434 -
Total debt service $ 278,982 $ 328,132 $ 328,132 $ -
Total Capital Reserve Fund $ 845,612 $ 2,564,058 $ 1,771,855 $ 792,203
Meals Tax Fund:
General Government Administration: Meals tax administration $ 35,190 $ 35,190 $ 35,190 $ -
Education: High School improvements $ - $ 9,276,156 $ 544,740 $ 8,731,416
Debt service: Principal retirement $ 828,984 $ 828,984 $ 828,984 $ - Interest and other debt costs 279,737 303,581 485,837 (182,256)
Total debt service $ 1,108,721 $ 1,132,565 $ 1,314,821 $ (182,256)
Total Meals Tax Fund $ 1,143,911 $ 10,443,911 $ 1,894,751 $ 8,549,160
Total Capital Project Funds $ 1,989,523 $ 13,007,969 $ 3,666,606 $ 9,341,363
Grand Total Expenditures - Primary Government $ 32,816,724 $ 45,355,425 $ 31,186,889 $ 14,168,536
130
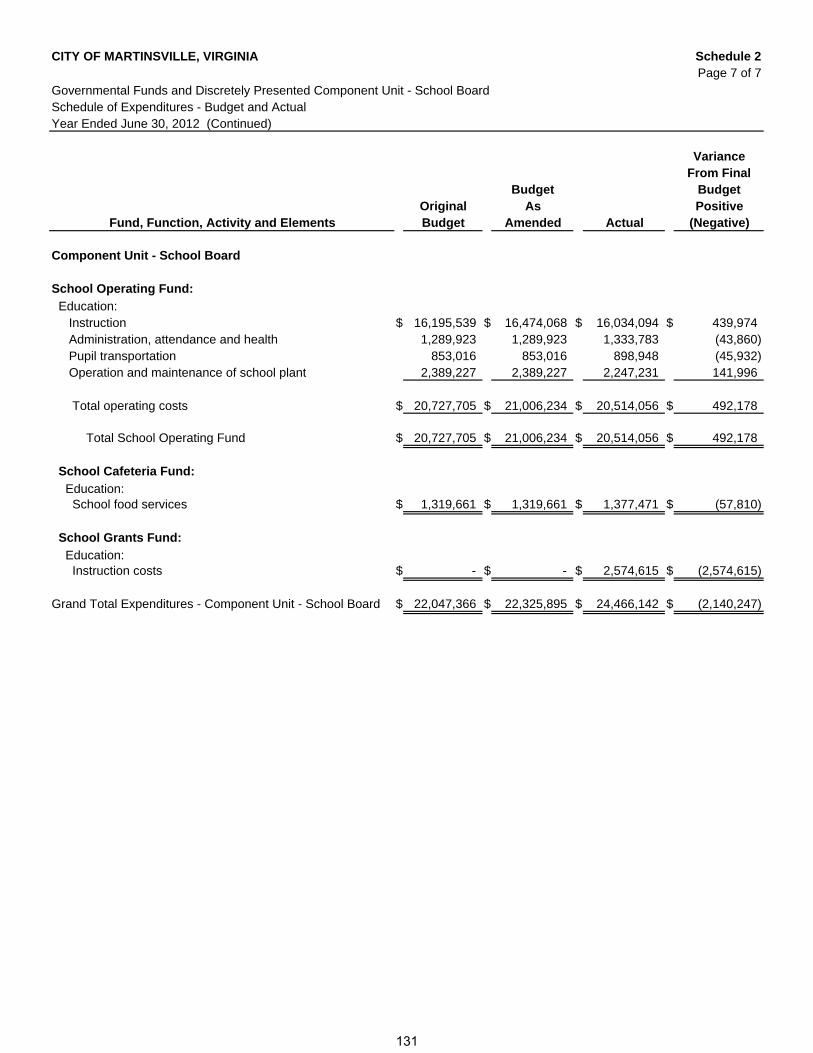
CITY OF MARTINSVILLE, VIRGINIA Schedule 2Page 7 of 7
Governmental Funds and Discretely Presented Component Unit - School BoardSchedule of Expenditures - Budget and ActualYear Ended June 30, 2012 (Continued)
VarianceFrom Final
Budget BudgetOriginal As Positive
Fund, Function, Activity and Elements Budget Amended Actual (Negative)
Component Unit - School Board
School Operating Fund:
Education: Instruction $ 16,195,539 $ 16,474,068 $ 16,034,094 $ 439,974 Administration, attendance and health 1,289,923 1,289,923 1,333,783 (43,860) Pupil transportation 853,016 853,016 898,948 (45,932) Operation and maintenance of school plant 2,389,227 2,389,227 2,247,231 141,996
Total operating costs $ 20,727,705 $ 21,006,234 $ 20,514,056 $ 492,178
Total School Operating Fund $ 20,727,705 $ 21,006,234 $ 20,514,056 $ 492,178
School Cafeteria Fund:
Education: School food services $ 1,319,661 $ 1,319,661 $ 1,377,471 $ (57,810)
School Grants Fund:
Education: Instruction costs $ - $ - $ 2,574,615 $ (2,574,615)
Grand Total Expenditures - Component Unit - School Board $ 22,047,366 $ 22,325,895 $ 24,466,142 $ (2,140,247)
131

This page intentionally left blank
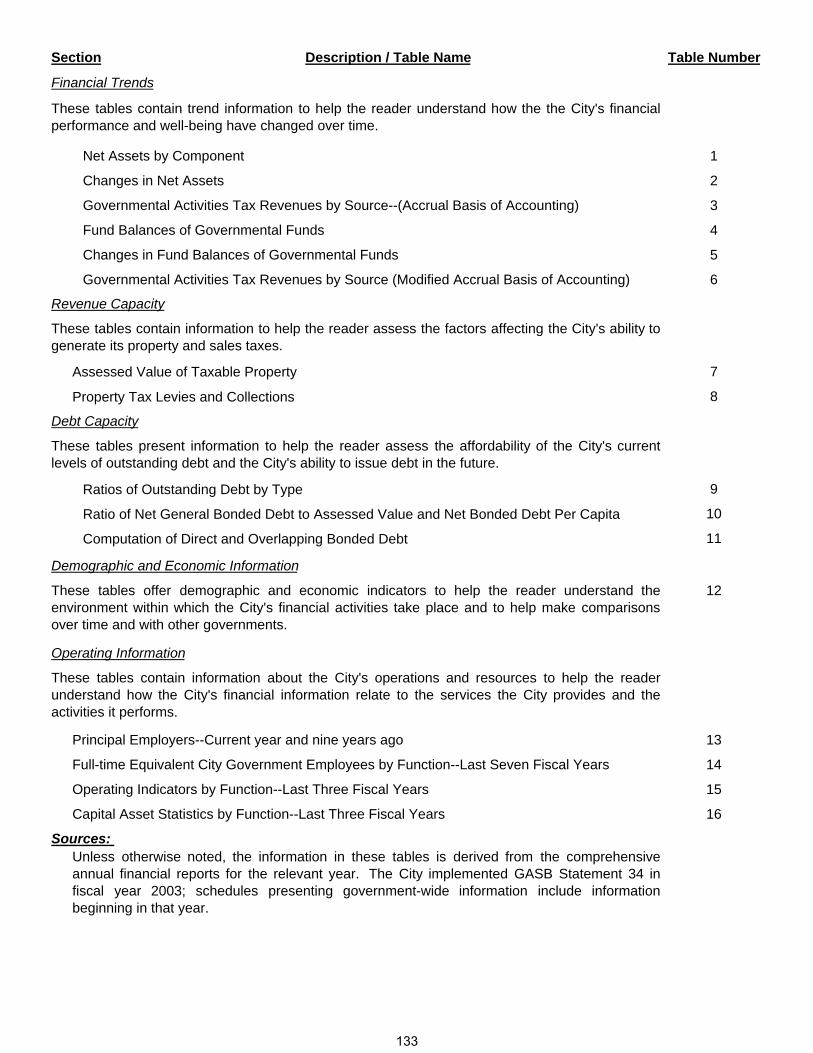
Description / Table Name Table Number
Financial Trends
Net Assets by Component 1
Changes in Net Assets 2
Governmental Activities Tax Revenues by Source--(Accrual Basis of Accounting) 3
Fund Balances of Governmental Funds 4
Changes in Fund Balances of Governmental Funds 5
Governmental Activities Tax Revenues by Source (Modified Accrual Basis of Accounting) 6
Revenue Capacity
Assessed Value of Taxable Property 7
Property Tax Levies and Collections 8
Debt Capacity
Ratios of Outstanding Debt by Type 9
Ratio of Net General Bonded Debt to Assessed Value and Net Bonded Debt Per Capita 10
Computation of Direct and Overlapping Bonded Debt 11
Demographic and Economic Information
12
Operating Information
Principal Employers--Current year and nine years ago 13 Full-time Equivalent City Government Employees by Function--Last Seven Fiscal Years 14
Operating Indicators by Function--Last Three Fiscal Years 15
Capital Asset Statistics by Function--Last Three Fiscal Years 16
Sources:
Section
These tables contain information to help the reader assess the factors affecting the City's ability togenerate its property and sales taxes.
These tables contain trend information to help the reader understand how the the City's financialperformance and well-being have changed over time.
Unless otherwise noted, the information in these tables is derived from the comprehensiveannual financial reports for the relevant year. The City implemented GASB Statement 34 infiscal year 2003; schedules presenting government-wide information include informationbeginning in that year.
These tables present information to help the reader assess the affordability of the City's currentlevels of outstanding debt and the City's ability to issue debt in the future.
These tables offer demographic and economic indicators to help the reader understand theenvironment within which the City's financial activities take place and to help make comparisonsover time and with other governments.
These tables contain information about the City's operations and resources to help the readerunderstand how the City's financial information relate to the services the City provides and theactivities it performs.
133

This page intentionally left blank
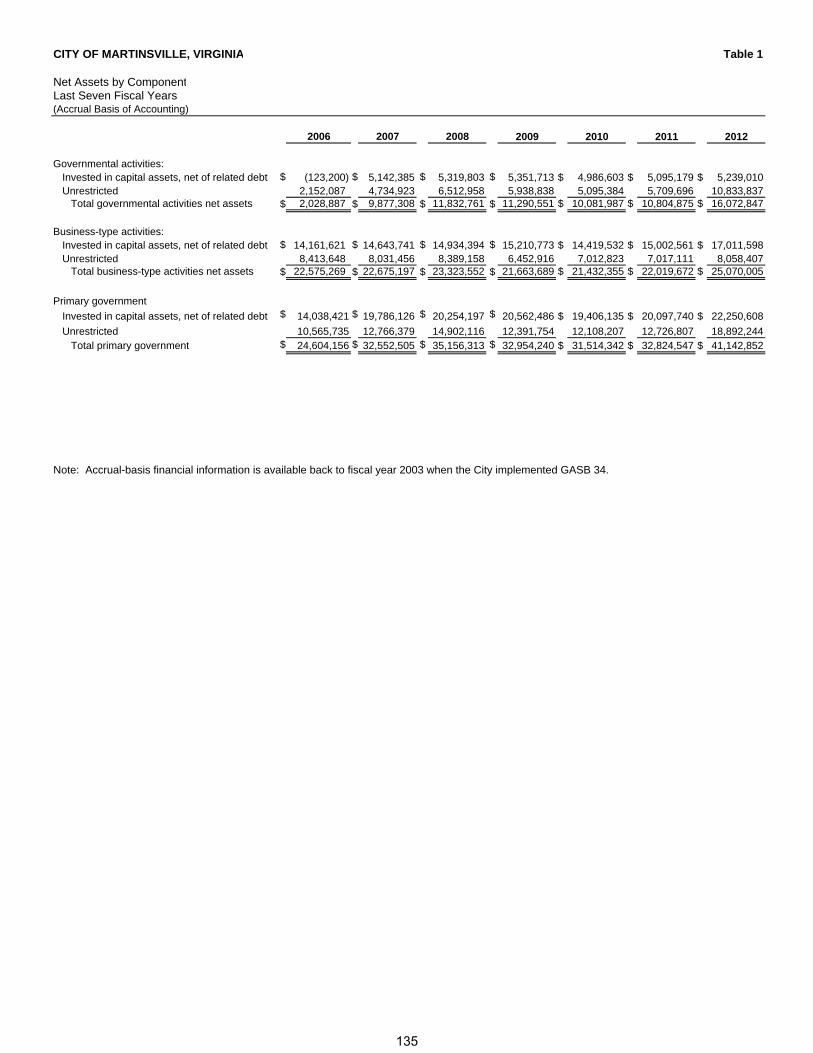
CITY OF MARTINSVILLE, VIRGINIA Table 1
Net Assets by ComponentLast Seven Fiscal Years
2006 2007 2008 2009 2010 2011 2012
Governmental activities:Invested in capital assets, net of related debt $ (123,200) $ 5,142,385 $ 5,319,803 $ 5,351,713 $ 4,986,603 $ 5,095,179 $ 5,239,010Unrestricted 2,152,087 4,734,923 6,512,958 5,938,838 5,095,384 5,709,696 10,833,837
Total governmental activities net assets $ 2,028,887 $ 9,877,308 $ 11,832,761 $ 11,290,551 $ 10,081,987 $ 10,804,875 $ 16,072,847
Business-type activities:Invested in capital assets, net of related debt $ 14,161,621 $ 14,643,741 $ 14,934,394 $ 15,210,773 $ 14,419,532 $ 15,002,561 $ 17,011,598Unrestricted 8,413,648 8,031,456 8,389,158 6,452,916 7,012,823 7,017,111 8,058,407
Total business-type activities net assets $ 22,575,269 $ 22,675,197 $ 23,323,552 $ 21,663,689 $ 21,432,355 $ 22,019,672 $ 25,070,005
Primary government
Invested in capital assets, net of related debt $ 14,038,421 $ 19,786,126 $ 20,254,197 $ 20,562,486 $ 19,406,135 $ 20,097,740 $ 22,250,608
Unrestricted 10,565,735 12,766,379 14,902,116 12,391,754 12,108,207 12,726,807 18,892,244 Total primary government $ 24,604,156 $ 32,552,505 $ 35,156,313 $ 32,954,240 $ 31,514,342 $ 32,824,547 $ 41,142,852
Note: Accrual-basis financial information is available back to fiscal year 2003 when the City implemented GASB 34.
(Accrual Basis of Accounting)
135
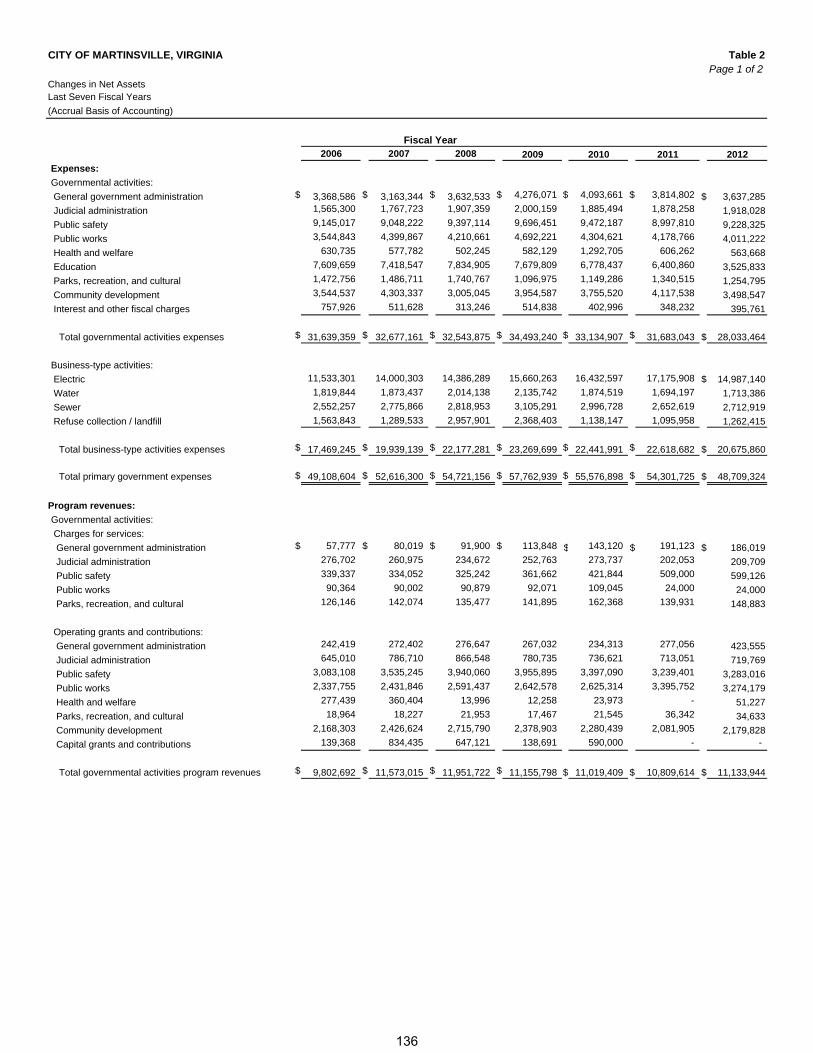
CITY OF MARTINSVILLE, VIRGINIA Table 2Page 1 of 2
Changes in Net Assets
2006 2007 2008 2009 2010 2011 2012
Expenses:
Governmental activities:
General government administration $ 3,368,586 $ 3,163,344 $ 3,632,533 $ 4,276,071 $ 4,093,661 $ 3,814,802 $ 3,637,285
Judicial administration 1,565,300 1,767,723 1,907,359 2,000,159 1,885,494 1,878,258 1,918,028
Public safety 9,145,017 9,048,222 9,397,114 9,696,451 9,472,187 8,997,810 9,228,325
Public works 3,544,843 4,399,867 4,210,661 4,692,221 4,304,621 4,178,766 4,011,222
Health and welfare 630,735 577,782 502,245 582,129 1,292,705 606,262 563,668
Education 7,609,659 7,418,547 7,834,905 7,679,809 6,778,437 6,400,860 3,525,833
Parks, recreation, and cultural 1,472,756 1,486,711 1,740,767 1,096,975 1,149,286 1,340,515 1,254,795
Community development 3,544,537 4,303,337 3,005,045 3,954,587 3,755,520 4,117,538 3,498,547
Interest and other fiscal charges 757,926 511,628 313,246 514,838 402,996 348,232 395,761
Total governmental activities expenses $ 31,639,359 $ 32,677,161 $ 32,543,875 $ 34,493,240 $ 33,134,907 $ 31,683,043 $ 28,033,464
Business-type activities:
Electric 11,533,301 14,000,303 14,386,289 15,660,263 16,432,597 17,175,908 $ 14,987,140
Water 1,819,844 1,873,437 2,014,138 2,135,742 1,874,519 1,694,197 1,713,386
Sewer 2,552,257 2,775,866 2,818,953 3,105,291 2,996,728 2,652,619 2,712,919
Refuse collection / landfill 1,563,843 1,289,533 2,957,901 2,368,403 1,138,147 1,095,958 1,262,415
Total business-type activities expenses $ 17,469,245 $ 19,939,139 $ 22,177,281 $ 23,269,699 $ 22,441,991 $ 22,618,682 $ 20,675,860
Total primary government expenses $ 49,108,604 $ 52,616,300 $ 54,721,156 $ 57,762,939 $ 55,576,898 $ 54,301,725 $ 48,709,324
Program revenues:
Governmental activities:
Charges for services:
General government administration $ 57,777 $ 80,019 $ 91,900 $ 113,848 $ 143,120 $ 191,123 $ 186,019
Judicial administration 276,702 260,975 234,672 252,763 273,737 202,053 209,709
Public safety 339,337 334,052 325,242 361,662 421,844 509,000 599,126
Public works 90,364 90,002 90,879 92,071 109,045 24,000 24,000
Parks, recreation, and cultural 126,146 142,074 135,477 141,895 162,368 139,931 148,883
Operating grants and contributions:
General government administration 242,419 272,402 276,647 267,032 234,313 277,056 423,555
Judicial administration 645,010 786,710 866,548 780,735 736,621 713,051 719,769
Public safety 3,083,108 3,535,245 3,940,060 3,955,895 3,397,090 3,239,401 3,283,016
Public works 2,337,755 2,431,846 2,591,437 2,642,578 2,625,314 3,395,752 3,274,179
Health and welfare 277,439 360,404 13,996 12,258 23,973 - 51,227
Parks, recreation, and cultural 18,964 18,227 21,953 17,467 21,545 36,342 34,633
Community development 2,168,303 2,426,624 2,715,790 2,378,903 2,280,439 2,081,905 2,179,828
Capital grants and contributions 139,368 834,435 647,121 138,691 590,000 - -
Total governmental activities program revenues $ 9,802,692 $ 11,573,015 $ 11,951,722 $ 11,155,798 $ 11,019,409 $ 10,809,614 $ 11,133,944
Fiscal Year
Last Seven Fiscal Years
(Accrual Basis of Accounting)
136
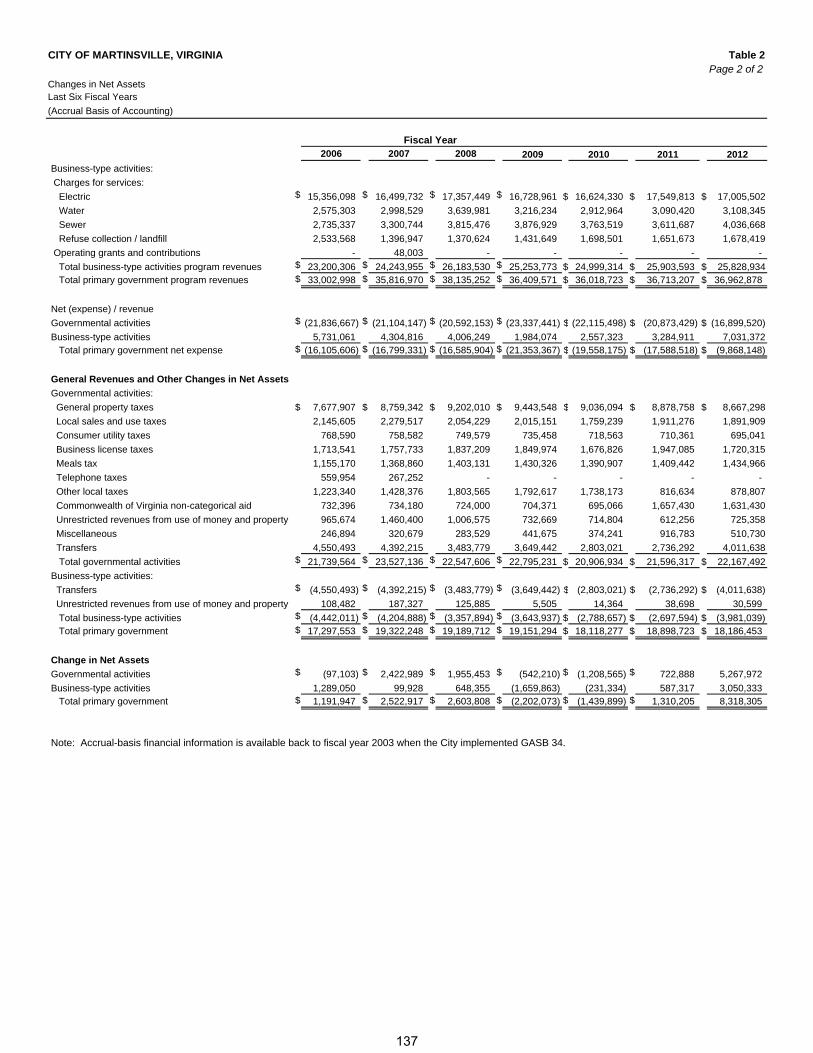
CITY OF MARTINSVILLE, VIRGINIA Table 2Page 2 of 2
Changes in Net Assets
2006 2007 2008 2009 2010 2011 2012
Business-type activities:
Charges for services:
Electric $ 15,356,098 $ 16,499,732 $ 17,357,449 $ 16,728,961 $ 16,624,330 $ 17,549,813 $ 17,005,502
Water 2,575,303 2,998,529 3,639,981 3,216,234 2,912,964 3,090,420 3,108,345
Sewer 2,735,337 3,300,744 3,815,476 3,876,929 3,763,519 3,611,687 4,036,668
Refuse collection / landfill 2,533,568 1,396,947 1,370,624 1,431,649 1,698,501 1,651,673 1,678,419
Operating grants and contributions - 48,003 - - - - -
Total business-type activities program revenues $ 23,200,306 $ 24,243,955 $ 26,183,530 $ 25,253,773 $ 24,999,314 $ 25,903,593 $ 25,828,934 Total primary government program revenues $ 33,002,998 $ 35,816,970 $ 38,135,252 $ 36,409,571 $ 36,018,723 $ 36,713,207 $ 36,962,878
Net (expense) / revenue
Governmental activities $ (21,836,667) $ (21,104,147) $ (20,592,153) $ (23,337,441) $ (22,115,498) $ (20,873,429) $ (16,899,520)
Business-type activities 5,731,061 4,304,816 4,006,249 1,984,074 2,557,323 3,284,911 7,031,372 Total primary government net expense $ (16,105,606) $ (16,799,331) $ (16,585,904) $ (21,353,367) $ (19,558,175) $ (17,588,518) $ (9,868,148)
General Revenues and Other Changes in Net Assets
Governmental activities:
General property taxes $ 7,677,907 $ 8,759,342 $ 9,202,010 $ 9,443,548 $ 9,036,094 $ 8,878,758 $ 8,667,298
Local sales and use taxes 2,145,605 2,279,517 2,054,229 2,015,151 1,759,239 1,911,276 1,891,909
Consumer utility taxes 768,590 758,582 749,579 735,458 718,563 710,361 695,041
Business license taxes 1,713,541 1,757,733 1,837,209 1,849,974 1,676,826 1,947,085 1,720,315
Meals tax 1,155,170 1,368,860 1,403,131 1,430,326 1,390,907 1,409,442 1,434,966
Telephone taxes 559,954 267,252 - - - - -
Other local taxes 1,223,340 1,428,376 1,803,565 1,792,617 1,738,173 816,634 878,807
Commonwealth of Virginia non-categorical aid 732,396 734,180 724,000 704,371 695,066 1,657,430 1,631,430
Unrestricted revenues from use of money and property 965,674 1,460,400 1,006,575 732,669 714,804 612,256 725,358
Miscellaneous 246,894 320,679 283,529 441,675 374,241 916,783 510,730
Transfers 4,550,493 4,392,215 3,483,779 3,649,442 2,803,021 2,736,292 4,011,638
Total governmental activities $ 21,739,564 $ 23,527,136 $ 22,547,606 $ 22,795,231 $ 20,906,934 $ 21,596,317 $ 22,167,492
Business-type activities:
Transfers $ (4,550,493) $ (4,392,215) $ (3,483,779) $ (3,649,442) $ (2,803,021) $ (2,736,292) $ (4,011,638)
Unrestricted revenues from use of money and property 108,482 187,327 125,885 5,505 14,364 38,698 30,599
Total business-type activities $ (4,442,011) $ (4,204,888) $ (3,357,894) $ (3,643,937) $ (2,788,657) $ (2,697,594) $ (3,981,039) Total primary government $ 17,297,553 $ 19,322,248 $ 19,189,712 $ 19,151,294 $ 18,118,277 $ 18,898,723 $ 18,186,453
Change in Net Assets
Governmental activities $ (97,103) $ 2,422,989 $ 1,955,453 $ (542,210) $ (1,208,565) $ 722,888 5,267,972
Business-type activities 1,289,050 99,928 648,355 (1,659,863) (231,334) 587,317 3,050,333 Total primary government $ 1,191,947 $ 2,522,917 $ 2,603,808 $ (2,202,073) $ (1,439,899) $ 1,310,205 8,318,305
Note: Accrual-basis financial information is available back to fiscal year 2003 when the City implemented GASB 34.
Fiscal Year
Last Six Fiscal Years
(Accrual Basis of Accounting)
137
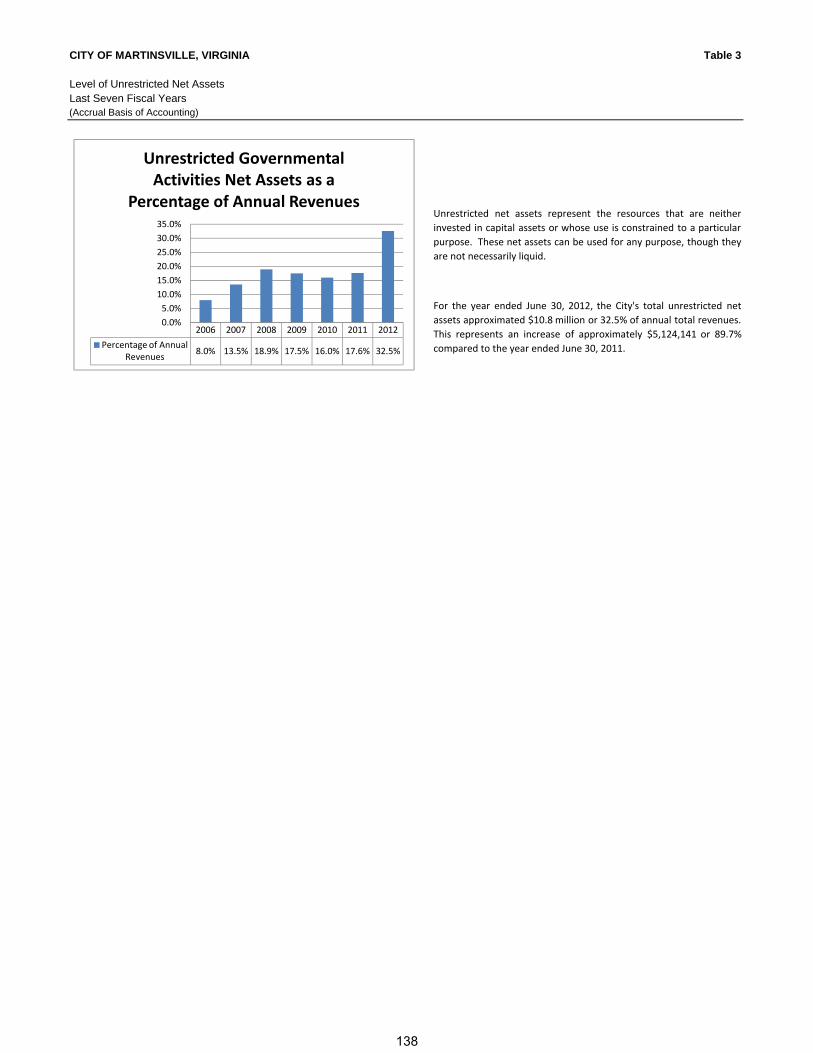
CITY OF MARTINSVILLE, VIRGINIA Table 3
Level of Unrestricted Net AssetsLast Seven Fiscal Years
Unrestricted net assets represent the resources that are neither
invested in capital assets or whose use is constrained to a particular
purpose. These net assets can be used for any purpose, though they
are not necessarily liquid.
For the year ended June 30, 2012, the City's total unrestricted net
assets approximated $10.8 million or 32.5% of annual total revenues.
This represents an increase of approximately $5,124,141 or 89.7%
compared to the year ended June 30, 2011.
(Accrual Basis of Accounting)
2006 2007 2008 2009 2010 2011 2012
Percentage of Annual Revenues
8.0% 13.5% 18.9% 17.5% 16.0% 17.6% 32.5%
0.0%
5.0%
10.0%
15.0%
20.0%
25.0%
30.0%
35.0%
Unrestricted Governmental Activities Net Assets as a
Percentage of Annual Revenues
138
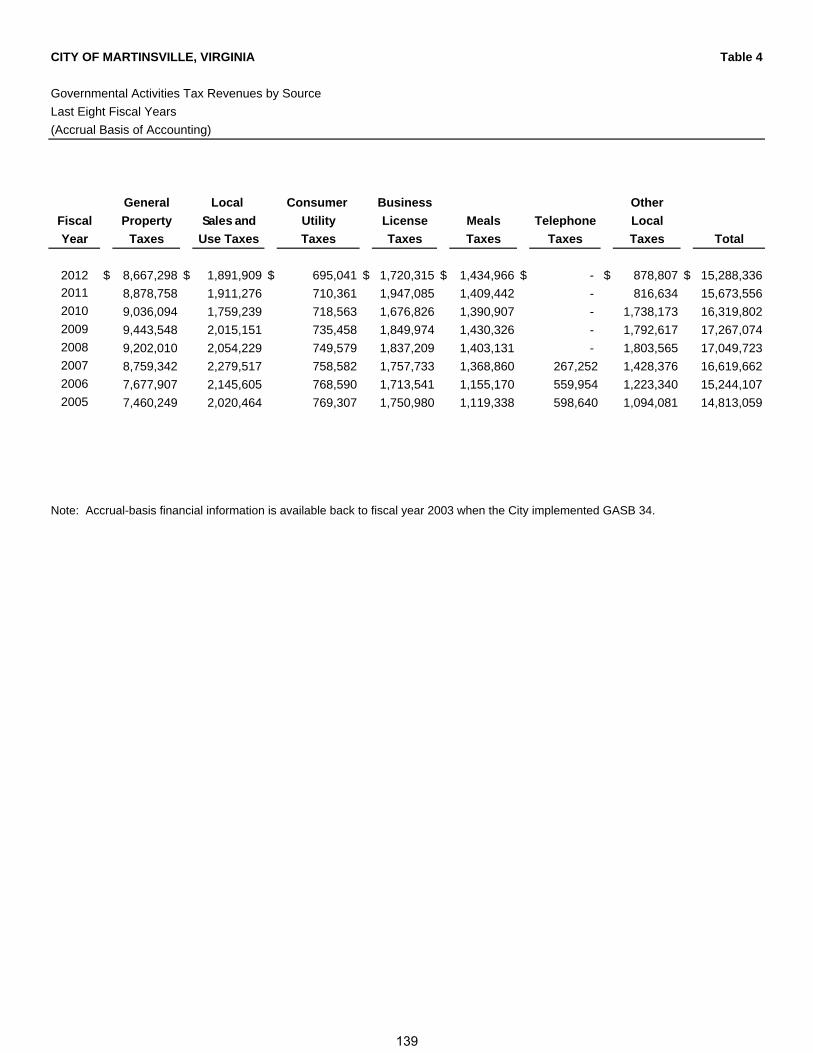
CITY OF MARTINSVILLE, VIRGINIA Table 4
Governmental Activities Tax Revenues by Source
Last Eight Fiscal Years
General Local Consumer Business Other
Fiscal Property Sales and Utility License Meals Telephone Local
Year Taxes Use Taxes Taxes Taxes Taxes Taxes Taxes Total
2012 $ 8,667,298 $ 1,891,909 $ 695,041 $ 1,720,315 $ 1,434,966 $ - $ 878,807 $ 15,288,336
2011 8,878,758 1,911,276 710,361 1,947,085 1,409,442 - 816,634 15,673,556
2010 9,036,094 1,759,239 718,563 1,676,826 1,390,907 - 1,738,173 16,319,802
2009 9,443,548 2,015,151 735,458 1,849,974 1,430,326 - 1,792,617 17,267,074
2008 9,202,010 2,054,229 749,579 1,837,209 1,403,131 - 1,803,565 17,049,723
2007 8,759,342 2,279,517 758,582 1,757,733 1,368,860 267,252 1,428,376 16,619,662
2006 7,677,907 2,145,605 768,590 1,713,541 1,155,170 559,954 1,223,340 15,244,107
2005 7,460,249 2,020,464 769,307 1,750,980 1,119,338 598,640 1,094,081 14,813,059
Note: Accrual-basis financial information is available back to fiscal year 2003 when the City implemented GASB 34.
(Accrual Basis of Accounting)
139

CITY OF MARTINSVILLE, VIRGINIA
Fund Balances of Governmental FundsLast Ten Fiscal Years(Modified accrual basis of accounting)
2003 2004 2005 2006 2007
General fund Unreserved, designated $ 156,694 $ 154,099 154,099 $ 154,099 $ 154,099 Unreserved, undesignated 635,008 659,306 354,406 954,031 2,081,470 Nonspendable - - - - - Committed - - - - - Assigned - - - - - Unassigned - - - - -
Total general fund $ 791,702 $ 813,405 508,505 $ 1,108,130 $ 2,235,569
All other governmental funds Unreserved, reported in: Special revenue funds (deficit) $ 175,600 $ 420,396 1,127,266 $ (459,576) $ 54,241 Capital projects funds (225,378) (170,780) (347,663) 169,943 1,070,070 Restricted for: Capital projects - - - - - Committed, reported in: Special revenue funds - - - - - Assigned, reported in: Capital projects funds - - - - - Unassigned, reported in: Special revenue funds (deficit) - - - - -
Total all other governmental funds $ (49,778) $ 249,616 779,603 $ (289,633) $ 1,124,311
Note: Fund balance classifications changed starting in fiscal year 2011 when the Town implemented GASB 54.
140
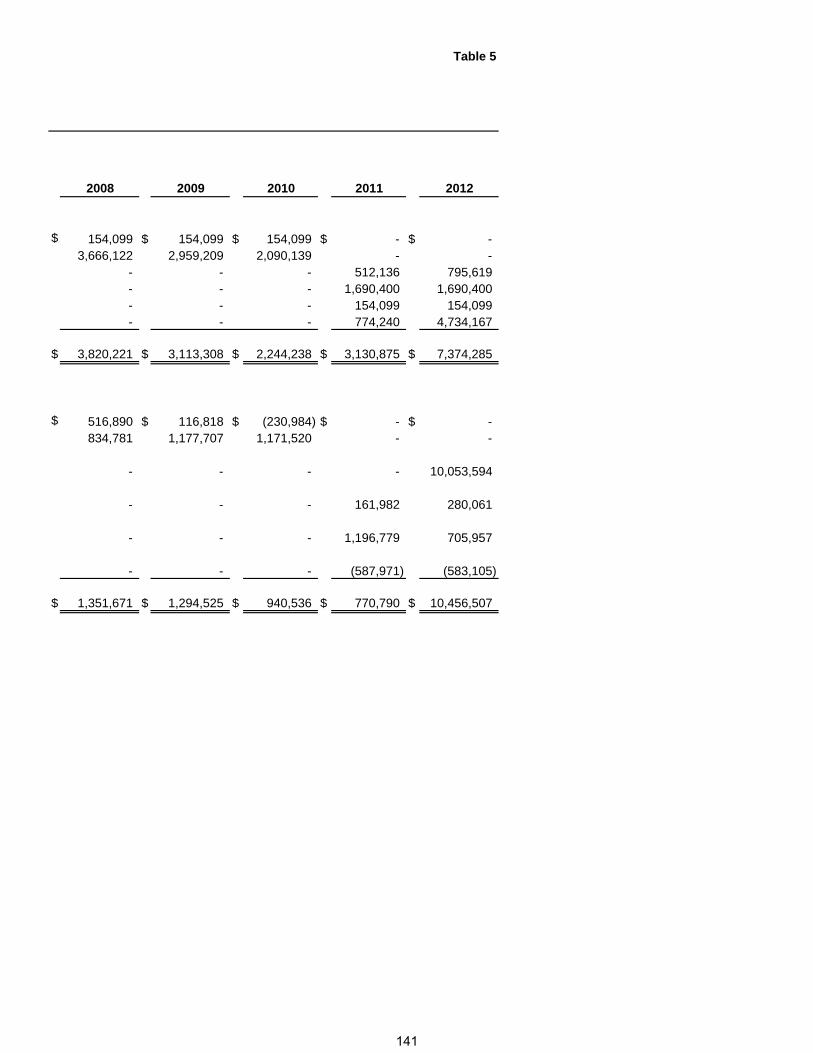
Table 5
2008 2009 2010 2011 2012
$ 154,099 $ 154,099 $ 154,099 $ - $ - 3,666,122 2,959,209 2,090,139 - -
- - - 512,136 795,619- - - 1,690,400 1,690,400- - - 154,099 154,099- - - 774,240 4,734,167
$ 3,820,221 $ 3,113,308 $ 2,244,238 $ 3,130,875 $ 7,374,285
$ 516,890 $ 116,818 $ (230,984) $ - $ - 834,781 1,177,707 1,171,520 - -
- - - - 10,053,594
- - - 161,982 280,061
- - - 1,196,779 705,957
- - - (587,971) (583,105)
$ 1,351,671 $ 1,294,525 $ 940,536 $ 770,790 $ 10,456,507
141

This page intentionally left blank

CITY OF MARTINSVILLE, VIRGINIA Table 6
Fund Balance SummaryYear Ended June 30, 2012(Modified accrual basis of accounting)
-
-
-
-
-
City Housing Capital MealsGeneral Grants Choice Reserve Tax
Fund Fund Fund Fund Fund Total
Nonspendable:Inventory $ 792,569 $ - $ - $ - $ - $ 792,569 Prepaid items 3,050 - - - - 3,050
Restricted for:Capital projects - - - 1,206,199 8,847,395 10,053,594
Committed to:Centre Infrastructure project 1,666,700 - - - - 1,666,700 Piedmont Area Regional Transit 23,700 - - - - 23,700 Housing Choice program - - 280,061 - - 280,061
Assigned to:Thoroughfare construction 154,099 - - - - 154,099 Capital reserve fund - - - 33,439 - 33,439 Meals tax fund - - - - 672,518 672,518
Unassigned 4,734,167 (583,105) - - - 4,151,062
Total fund balance $ 7,374,285 $ (583,105) $ 280,061 $ 1,239,638 $ 9,519,913 $ 17,830,792
Beginning with the fiscal year 2011, the City implemented GASB Statement 54, Fund Balance Reporting and GovernmentalFund Type Definitions . This statement provides more clearly defined fund balance categories to make the nature andextent of the constraints placed on a government's fund balance more transparent. The following classifications describethe relative strength of the spending constraints placed on the purposes for which resources can be used:
Nonspendable fund balance - amounts that are not in spendable form (such as inventory and prepaids) or are required tobe maintained intact (corpus of a permanent fund);
Restricted fund balance - amounts constrained to specific purposes by their providers (such as grantors, bondholders,and higher levels of government), through constitutional provisions, or by enabling legislation;
Committed fund balance - amounts constrained to specific purposes by a government itself, using its highest level ofdecision-making authority; to be reported as committed, amounts cannot be used for any other purposes unless thegovernment takes the same highest level action to remove or change the constraints;
Assigned fund balance - amounts a government intends to use for a specific purpose; intent can be expressed by thegoverning body or by an official or body to which the governing body delegates the authority;
Unassigned fund balance - amounts that are available for any purpose; positive amounts are only reported in the generalfund.
143
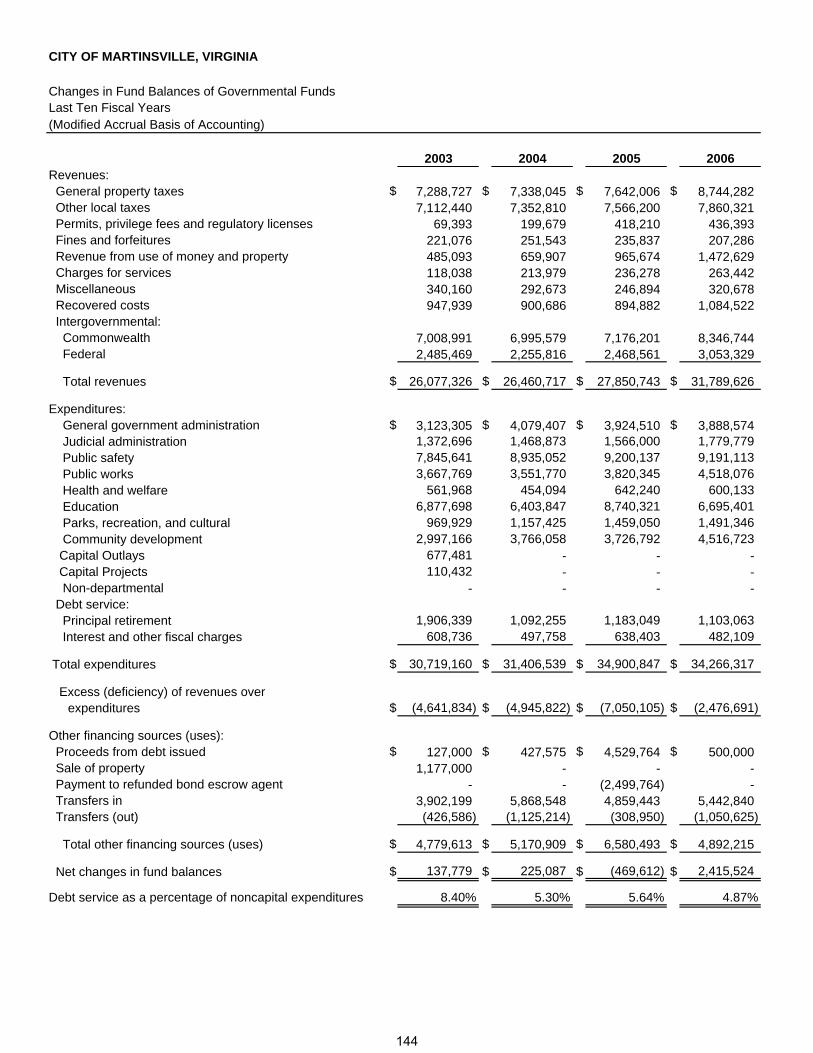
CITY OF MARTINSVILLE, VIRGINIA
Changes in Fund Balances of Governmental FundsLast Ten Fiscal Years(Modified Accrual Basis of Accounting)
2003 2004 2005 2006Revenues: General property taxes $ 7,288,727 $ 7,338,045 $ 7,642,006 $ 8,744,282 Other local taxes 7,112,440 7,352,810 7,566,200 7,860,321 Permits, privilege fees and regulatory licenses 69,393 199,679 418,210 436,393 Fines and forfeitures 221,076 251,543 235,837 207,286 Revenue from use of money and property 485,093 659,907 965,674 1,472,629 Charges for services 118,038 213,979 236,278 263,442 Miscellaneous 340,160 292,673 246,894 320,678 Recovered costs 947,939 900,686 894,882 1,084,522 Intergovernmental: Commonwealth 7,008,991 6,995,579 7,176,201 8,346,744 Federal 2,485,469 2,255,816 2,468,561 3,053,329
Total revenues $ 26,077,326 $ 26,460,717 $ 27,850,743 $ 31,789,626
Expenditures: General government administration $ 3,123,305 $ 4,079,407 $ 3,924,510 $ 3,888,574 Judicial administration 1,372,696 1,468,873 1,566,000 1,779,779 Public safety 7,845,641 8,935,052 9,200,137 9,191,113 Public works 3,667,769 3,551,770 3,820,345 4,518,076 Health and welfare 561,968 454,094 642,240 600,133 Education 6,877,698 6,403,847 8,740,321 6,695,401 Parks, recreation, and cultural 969,929 1,157,425 1,459,050 1,491,346 Community development 2,997,166 3,766,058 3,726,792 4,516,723 Capital Outlays 677,481 - - - Capital Projects 110,432 - - - Non-departmental - - - - Debt service: Principal retirement 1,906,339 1,092,255 1,183,049 1,103,063 Interest and other fiscal charges 608,736 497,758 638,403 482,109
Total expenditures $ 30,719,160 $ 31,406,539 $ 34,900,847 $ 34,266,317
Excess (deficiency) of revenues over expenditures $ (4,641,834) $ (4,945,822) $ (7,050,105) $ (2,476,691)
Other financing sources (uses): Proceeds from debt issued $ 127,000 $ 427,575 $ 4,529,764 $ 500,000 Sale of property 1,177,000 - - - Payment to refunded bond escrow agent - - (2,499,764) - Transfers in 3,902,199 5,868,548 4,859,443 5,442,840 Transfers (out) (426,586) (1,125,214) (308,950) (1,050,625)
Total other financing sources (uses) $ 4,779,613 $ 5,170,909 $ 6,580,493 $ 4,892,215
Net changes in fund balances $ 137,779 $ 225,087 $ (469,612) $ 2,415,524
Debt service as a percentage of noncapital expenditures 8.40% 5.30% 5.64% 4.87%
144
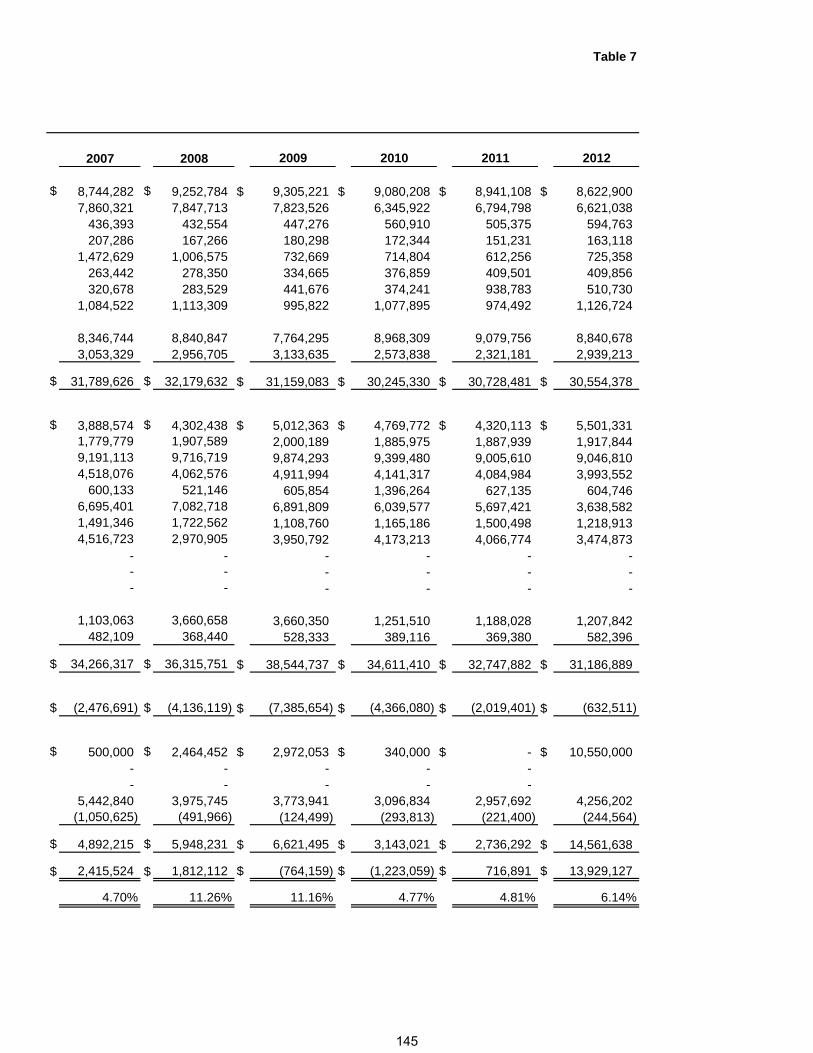
Table 7
2007 2008 2009 2010 2011 2012
$ 8,744,282 $ 9,252,784 $ 9,305,221 $ 9,080,208 $ 8,941,108 $ 8,622,9007,860,321 7,847,713 7,823,526 6,345,922 6,794,798 6,621,038
436,393 432,554 447,276 560,910 505,375 594,763207,286 167,266 180,298 172,344 151,231 163,118
1,472,629 1,006,575 732,669 714,804 612,256 725,358263,442 278,350 334,665 376,859 409,501 409,856320,678 283,529 441,676 374,241 938,783 510,730
1,084,522 1,113,309 995,822 1,077,895 974,492 1,126,724
8,346,744 8,840,847 7,764,295 8,968,309 9,079,756 8,840,6783,053,329 2,956,705 3,133,635 2,573,838 2,321,181 2,939,213
$ 31,789,626 $ 32,179,632 $ 31,159,083 $ 30,245,330 $ 30,728,481 $ 30,554,378
$ 3,888,574 $ 4,302,438 $ 5,012,363 $ 4,769,772 $ 4,320,113 $ 5,501,3311,779,779 1,907,589 2,000,189 1,885,975 1,887,939 1,917,8449,191,113 9,716,719 9,874,293 9,399,480 9,005,610 9,046,8104,518,076 4,062,576 4,911,994 4,141,317 4,084,984 3,993,552
600,133 521,146 605,854 1,396,264 627,135 604,7466,695,401 7,082,718 6,891,809 6,039,577 5,697,421 3,638,5821,491,346 1,722,562 1,108,760 1,165,186 1,500,498 1,218,9134,516,723 2,970,905 3,950,792 4,173,213 4,066,774 3,474,873
- - - - - - - - - - - - - - - - - -
1,103,063 3,660,658 3,660,350 1,251,510 1,188,028 1,207,842482,109 368,440 528,333 389,116 369,380 582,396
$ 34,266,317 $ 36,315,751 $ 38,544,737 $ 34,611,410 $ 32,747,882 $ 31,186,889
$ (2,476,691) $ (4,136,119) $ (7,385,654) $ (4,366,080) $ (2,019,401) $ (632,511)
$ 500,000 $ 2,464,452 $ 2,972,053 $ 340,000 $ - $ 10,550,000- - - - - - - - - -
5,442,840 3,975,745 3,773,941 3,096,834 2,957,692 4,256,202(1,050,625) (491,966) (124,499) (293,813) (221,400) (244,564)
$ 4,892,215 $ 5,948,231 $ 6,621,495 $ 3,143,021 $ 2,736,292 $ 14,561,638
$ 2,415,524 $ 1,812,112 $ (764,159) $ (1,223,059) $ 716,891 $ 13,929,127
4.70% 11.26% 11.16% 4.77% 4.81% 6.14%
145

This page intentionally left blank
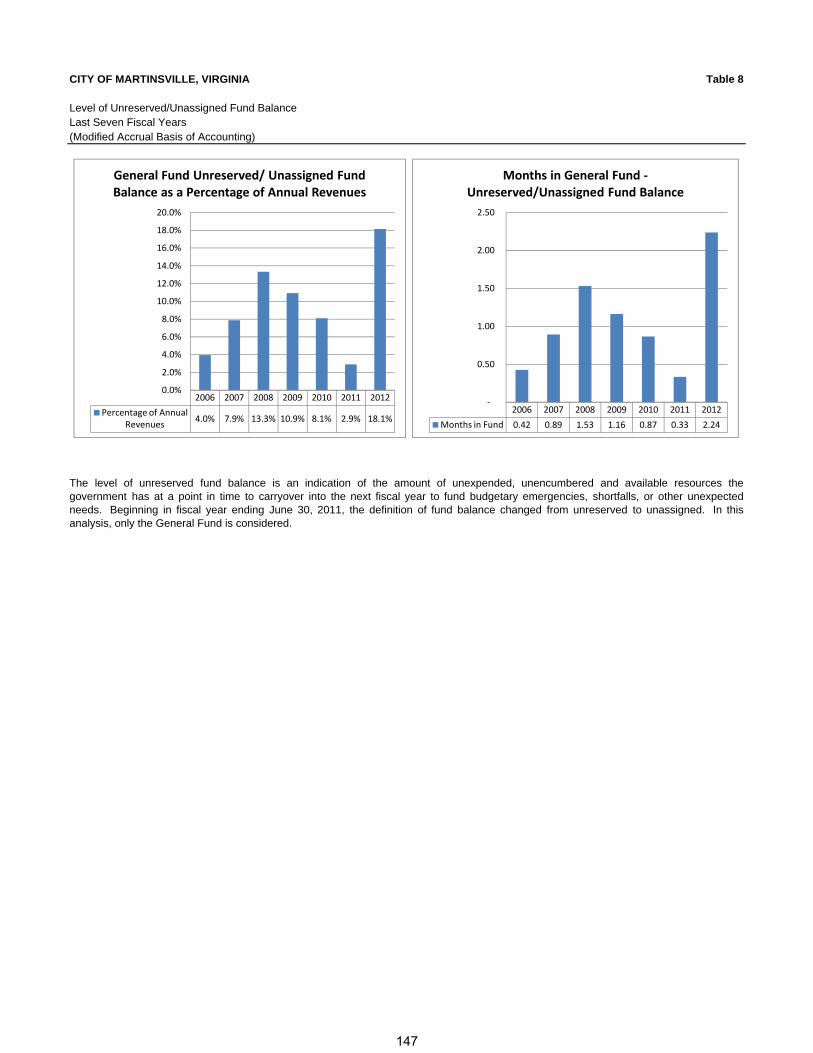
CITY OF MARTINSVILLE, VIRGINIA Table 8
Level of Unreserved/Unassigned Fund BalanceLast Seven Fiscal Years(Modified Accrual Basis of Accounting)
The level of unreserved fund balance is an indication of the amount of unexpended, unencumbered and available resources thegovernment has at a point in time to carryover into the next fiscal year to fund budgetary emergencies, shortfalls, or other unexpectedneeds. Beginning in fiscal year ending June 30, 2011, the definition of fund balance changed from unreserved to unassigned. In thisanalysis, only the General Fund is considered.
2006 2007 2008 2009 2010 2011 2012
Percentage of Annual Revenues
4.0% 7.9% 13.3% 10.9% 8.1% 2.9% 18.1%
0.0%
2.0%
4.0%
6.0%
8.0%
10.0%
12.0%
14.0%
16.0%
18.0%
20.0%
General Fund Unreserved/ Unassigned Fund Balance as a Percentage of Annual Revenues
2006 2007 2008 2009 2010 2011 2012
Months in Fund 0.42 0.89 1.53 1.16 0.87 0.33 2.24
‐
0.50
1.00
1.50
2.00
2.50
Months in General Fund ‐Unreserved/Unassigned Fund Balance
147

CITY OF MARTINSVILLE, VIRGINIA Table 9
Governmental Activities Tax Revenues by Source
Last Ten Fiscal Years
Local
General Sales Consumer Business (Telephone) Other
Fiscal Property and Use Utility License Meals E-911 Local
Year Taxes Taxes Taxes Taxes Taxes Taxes Taxes Total
2012 $ 8,622,900 $ 1,891,909 $ 695,041 $ 1,720,315 $ 1,632,261 $ - $ 878,807 $ 15,441,2332011 8,941,108 1,911,276 710,361 1,947,085 1,409,442 - 816,634 15,735,9062010 9,080,208 1,759,239 718,563 1,676,826 1,390,907 - 1,738,173 16,363,9162009 9,305,221 2,015,151 735,458 1,849,974 1,430,326 - 1,792,617 17,128,7472008 9,252,784 2,054,229 749,579 1,837,209 1,403,131 - 1,803,565 17,100,4972007 8,744,282 2,279,517 758,582 1,757,733 1,368,860 267,252 1,428,376 16,604,6022006 7,642,006 2,145,605 768,590 1,713,541 1,155,170 559,954 1,223,340 15,208,2062005 7,338,045 2,020,464 769,307 1,750,980 1,119,338 598,640 1,094,081 14,690,8552004 7,288,727 2,048,135 764,038 1,488,635 1,039,988 587,291 1,184,353 14,401,1672003 6,754,405 2,108,305 779,646 1,615,629 860,452 565,586 958,319 13,642,342
(Modified Accrual Basis of Accounting)
148
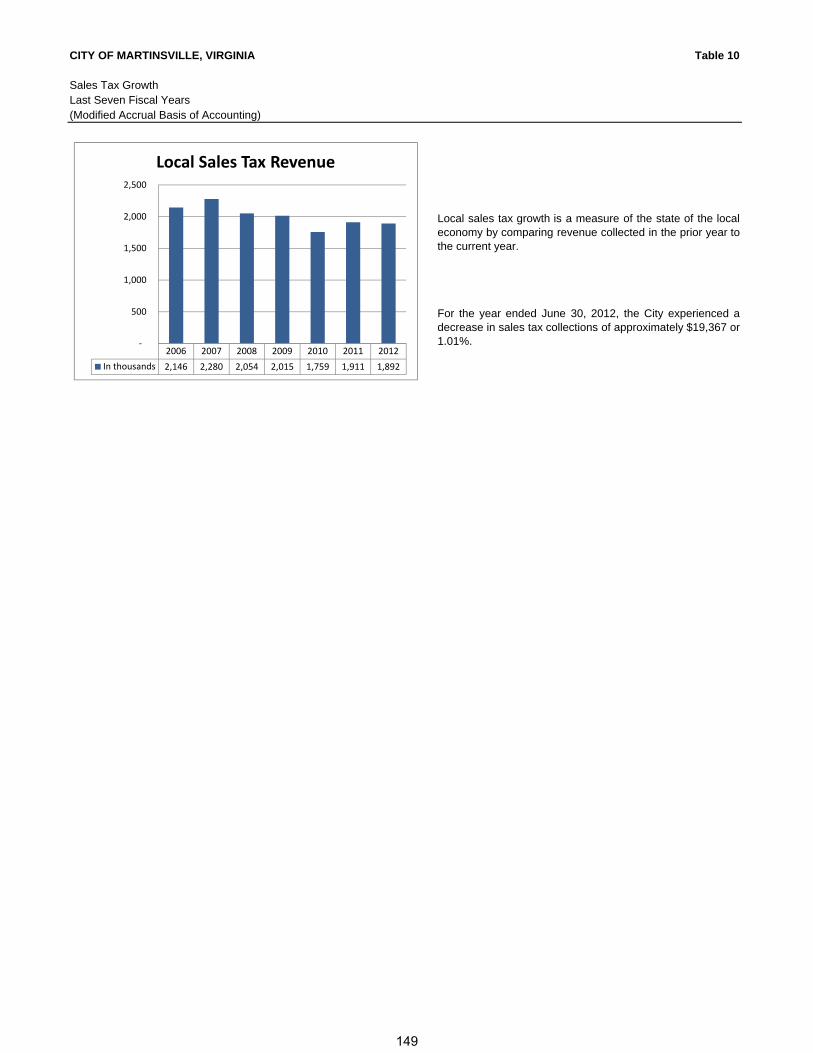
CITY OF MARTINSVILLE, VIRGINIA Table 10
Sales Tax GrowthLast Seven Fiscal Years(Modified Accrual Basis of Accounting)
Local sales tax growth is a measure of the state of the localeconomy by comparing revenue collected in the prior year tothe current year.
For the year ended June 30, 2012, the City experienced adecrease in sales tax collections of approximately $19,367 or1.01%.
2006 2007 2008 2009 2010 2011 2012
In thousands 2,146 2,280 2,054 2,015 1,759 1,911 1,892
‐
500
1,000
1,500
2,000
2,500
Local Sales Tax Revenue
149
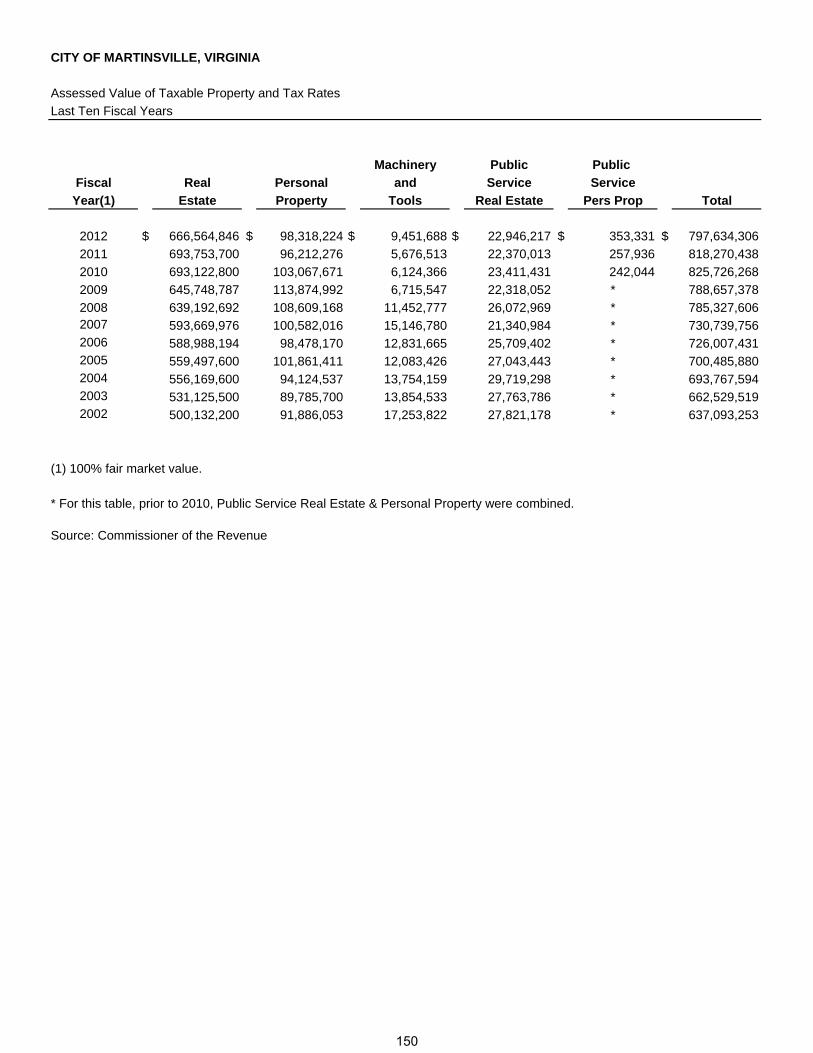
CITY OF MARTINSVILLE, VIRGINIA
Assessed Value of Taxable Property and Tax Rates
Last Ten Fiscal Years
Machinery Public Public
Fiscal Real Personal and Service Service
Year(1) Estate Property Tools Real Estate Pers Prop Total
2012 $ 666,564,846 $ 98,318,224 $ 9,451,688 $ 22,946,217 $ 353,331 $ 797,634,306
2011 693,753,700 96,212,276 5,676,513 22,370,013 257,936 818,270,438
2010 693,122,800 103,067,671 6,124,366 23,411,431 242,044 825,726,268
2009 645,748,787 113,874,992 6,715,547 22,318,052 * 788,657,378
2008 639,192,692 108,609,168 11,452,777 26,072,969 * 785,327,6062007 593,669,976 100,582,016 15,146,780 21,340,984 * 730,739,7562006 588,988,194 98,478,170 12,831,665 25,709,402 * 726,007,4312005 559,497,600 101,861,411 12,083,426 27,043,443 * 700,485,8802004 556,169,600 94,124,537 13,754,159 29,719,298 * 693,767,5942003 531,125,500 89,785,700 13,854,533 27,763,786 * 662,529,5192002 500,132,200 91,886,053 17,253,822 27,821,178 * 637,093,253
(1) 100% fair market value.
* For this table, prior to 2010, Public Service Real Estate & Personal Property were combined.
Source: Commissioner of the Revenue
150
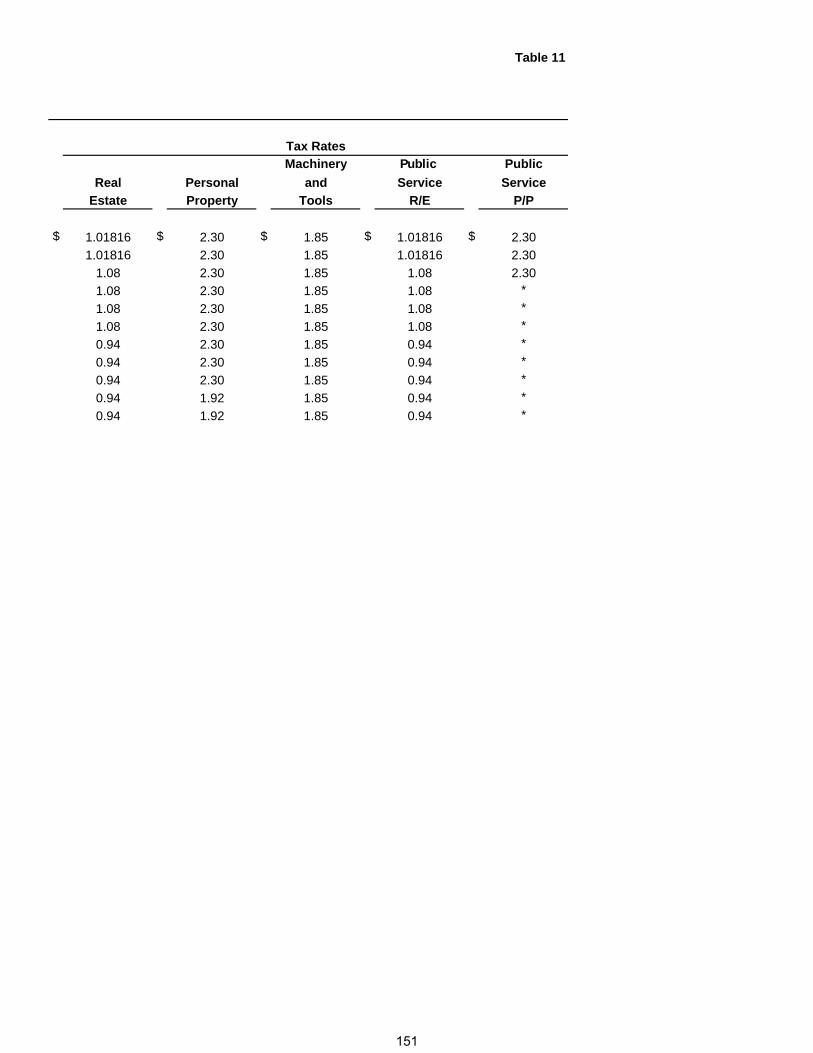
Table 11
Machinery Public Public
Real Personal and Service Service
Estate Property Tools R/E P/P
$ 1.01816 $ 2.30 $ 1.85 $ 1.01816 $ 2.30
1.01816 2.30 1.85 1.01816 2.30
1.08 2.30 1.85 1.08 2.30
1.08 2.30 1.85 1.08 *
1.08 2.30 1.85 1.08 *
1.08 2.30 1.85 1.08 *
0.94 2.30 1.85 0.94 *
0.94 2.30 1.85 0.94 *
0.94 2.30 1.85 0.94 *
0.94 1.92 1.85 0.94 *
0.94 1.92 1.85 0.94 *
Tax Rates
151
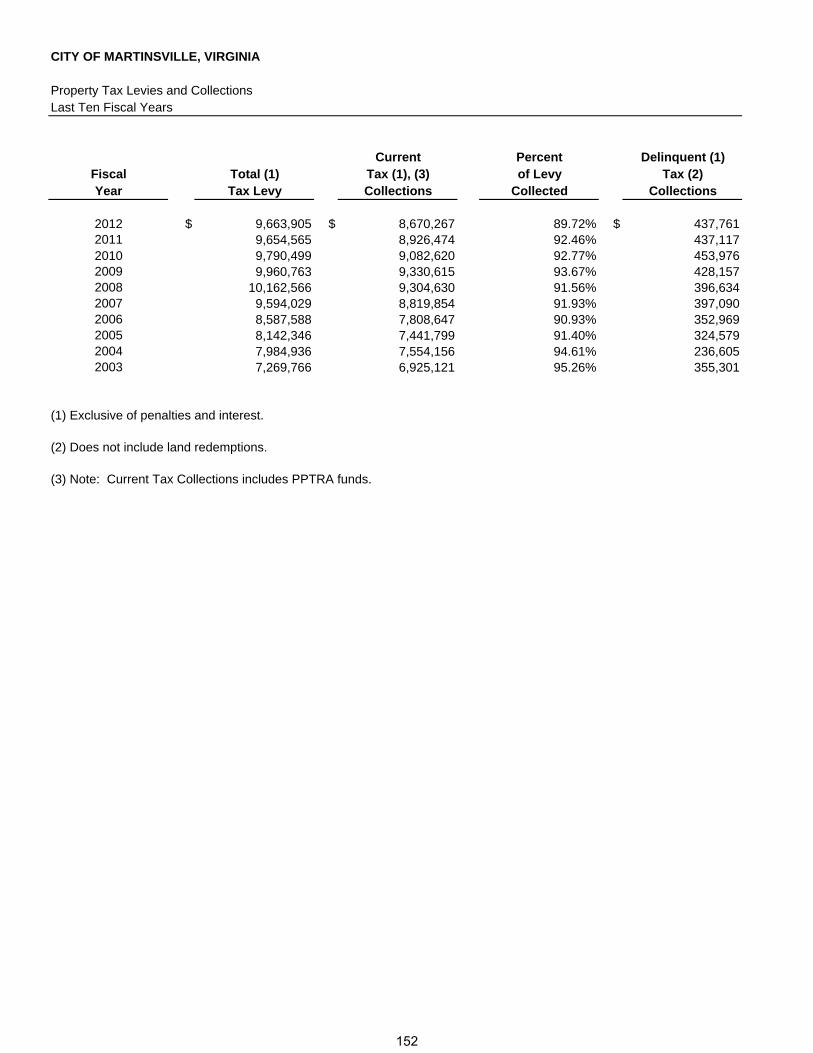
CITY OF MARTINSVILLE, VIRGINIA
Property Tax Levies and CollectionsLast Ten Fiscal Years
Current Percent Delinquent (1)Fiscal Total (1) Tax (1), (3) of Levy Tax (2)Year Tax Levy Collections Collected Collections
2012 $ 9,663,905 $ 8,670,267 89.72% $ 437,7612011 9,654,565 8,926,474 92.46% 437,1172010 9,790,499 9,082,620 92.77% 453,9762009 9,960,763 9,330,615 93.67% 428,1572008 10,162,566 9,304,630 91.56% 396,6342007 9,594,029 8,819,854 91.93% 397,0902006 8,587,588 7,808,647 90.93% 352,9692005 8,142,346 7,441,799 91.40% 324,5792004 7,984,936 7,554,156 94.61% 236,6052003 7,269,766 6,925,121 95.26% 355,301
(1) Exclusive of penalties and interest.
(2) Does not include land redemptions.
(3) Note: Current Tax Collections includes PPTRA funds.
152
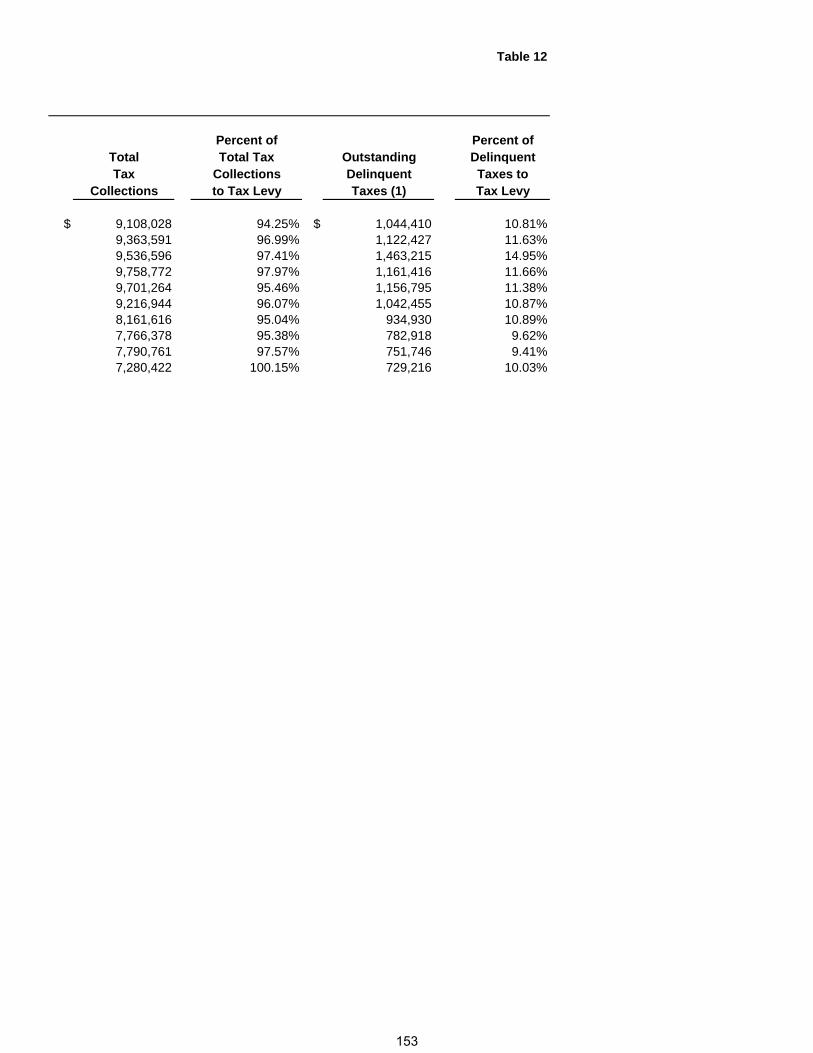
Table 12
Percent of Percent ofTotal Total Tax Outstanding DelinquentTax Collections Delinquent Taxes to
Collections to Tax Levy Taxes (1) Tax Levy
$ 9,108,028 94.25% $ 1,044,410 10.81%9,363,591 96.99% 1,122,427 11.63%9,536,596 97.41% 1,463,215 14.95%9,758,772 97.97% 1,161,416 11.66%9,701,264 95.46% 1,156,795 11.38%9,216,944 96.07% 1,042,455 10.87%8,161,616 95.04% 934,930 10.89%7,766,378 95.38% 782,918 9.62%7,790,761 97.57% 751,746 9.41%7,280,422 100.15% 729,216 10.03%
153
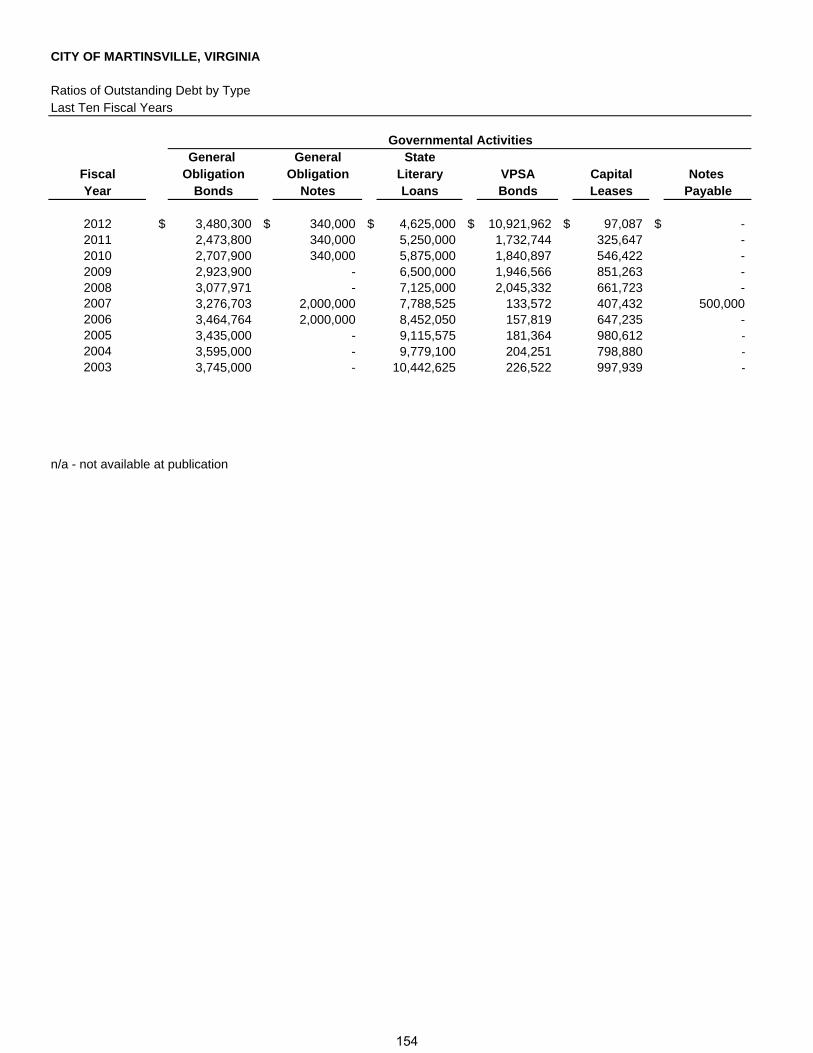
CITY OF MARTINSVILLE, VIRGINIA
Ratios of Outstanding Debt by TypeLast Ten Fiscal Years
General General StateFiscal Obligation Obligation Literary VPSA Capital Notes Year Bonds Notes Loans Bonds Leases Payable
2012 $ 3,480,300 $ 340,000 $ 4,625,000 $ 10,921,962 $ 97,087 $ - 2011 2,473,800 340,000 5,250,000 1,732,744 325,647 - 2010 2,707,900 340,000 5,875,000 1,840,897 546,422 - 2009 2,923,900 - 6,500,000 1,946,566 851,263 - 2008 3,077,971 - 7,125,000 2,045,332 661,723 - 2007 3,276,703 2,000,000 7,788,525 133,572 407,432 500,000 2006 3,464,764 2,000,000 8,452,050 157,819 647,235 - 2005 3,435,000 - 9,115,575 181,364 980,612 - 2004 3,595,000 - 9,779,100 204,251 798,880 - 2003 3,745,000 - 10,442,625 226,522 997,939 -
n/a - not available at publication
Governmental Activities
154
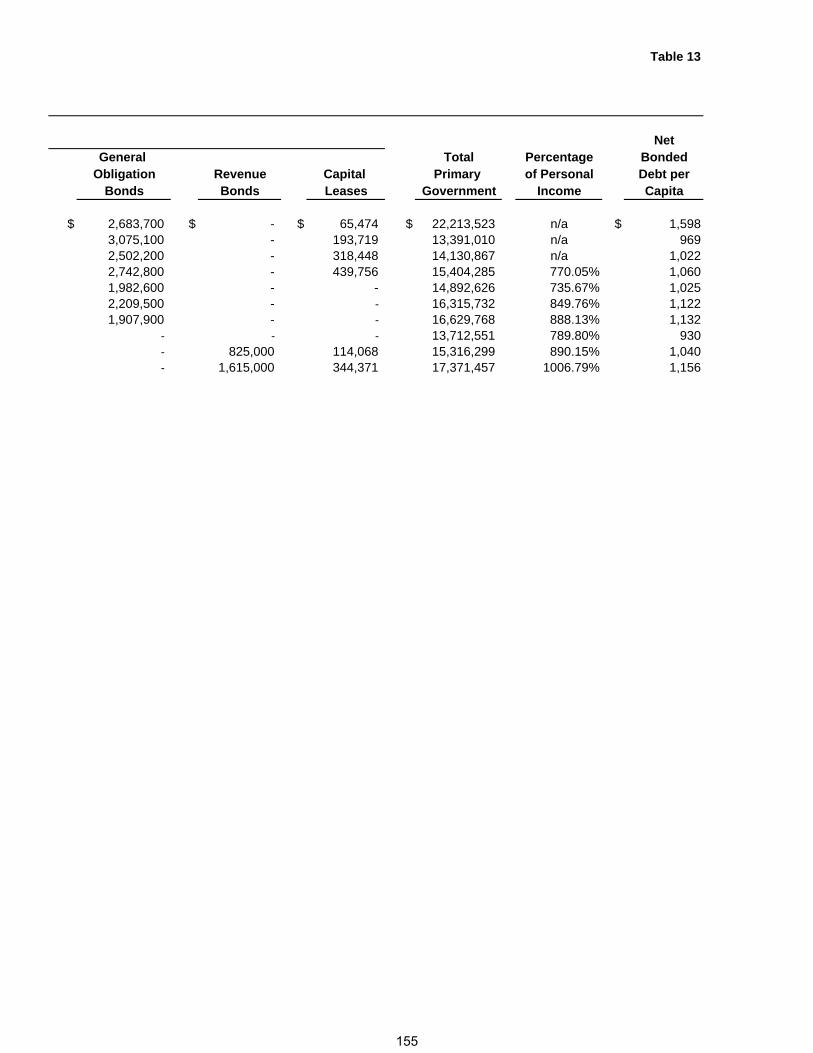
Table 13
NetGeneral Total Percentage Bonded
Obligation Revenue Capital Primary of Personal Debt perBonds Bonds Leases Government Income Capita
$ 2,683,700 $ - $ 65,474 $ 22,213,523 n/a $ 1,5983,075,100 - 193,719 13,391,010 n/a 9692,502,200 - 318,448 14,130,867 n/a 1,0222,742,800 - 439,756 15,404,285 770.05% 1,0601,982,600 - - 14,892,626 735.67% 1,0252,209,500 - - 16,315,732 849.76% 1,1221,907,900 - - 16,629,768 888.13% 1,132
- - - 13,712,551 789.80% 930- 825,000 114,068 15,316,299 890.15% 1,040- 1,615,000 344,371 17,371,457 1006.79% 1,156
155
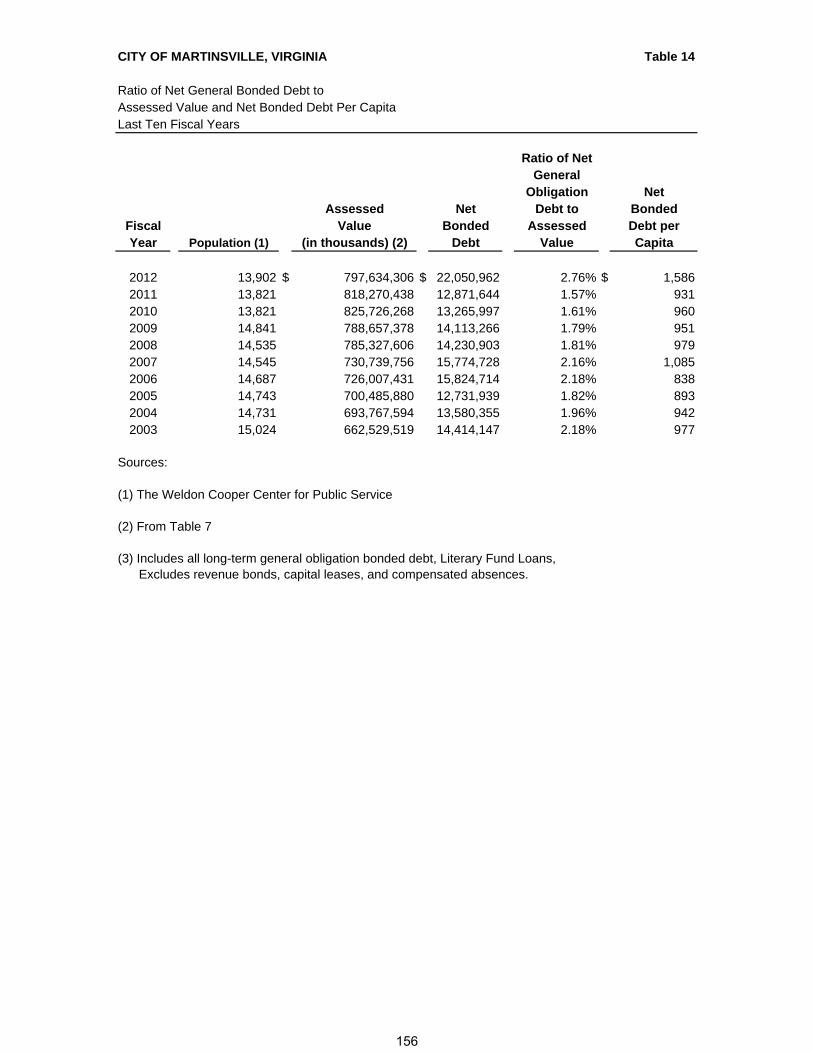
CITY OF MARTINSVILLE, VIRGINIA Table 14
Ratio of Net General Bonded Debt toAssessed Value and Net Bonded Debt Per CapitaLast Ten Fiscal Years
Ratio of NetGeneral
Obligation NetAssessed Net Debt to Bonded
Fiscal Value Bonded Assessed Debt perYear Population (1) (in thousands) (2) Debt Value Capita
2012 13,902 $ 797,634,306 $ 22,050,962 2.76% $ 1,5862011 13,821 818,270,438 12,871,644 1.57% 9312010 13,821 825,726,268 13,265,997 1.61% 9602009 14,841 788,657,378 14,113,266 1.79% 9512008 14,535 785,327,606 14,230,903 1.81% 9792007 14,545 730,739,756 15,774,728 2.16% 1,0852006 14,687 726,007,431 15,824,714 2.18% 8382005 14,743 700,485,880 12,731,939 1.82% 8932004 14,731 693,767,594 13,580,355 1.96% 9422003 15,024 662,529,519 14,414,147 2.18% 977
Sources:
(1) The Weldon Cooper Center for Public Service
(2) From Table 7
(3) Includes all long-term general obligation bonded debt, Literary Fund Loans, Excludes revenue bonds, capital leases, and compensated absences.
156
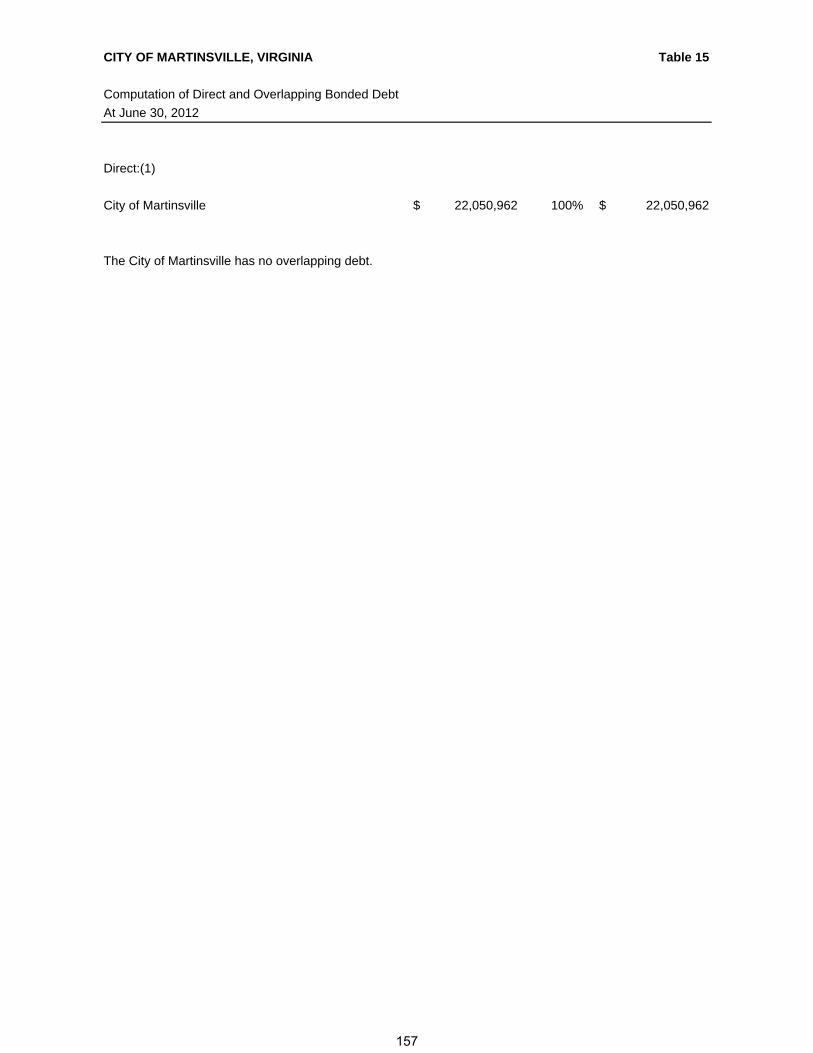
CITY OF MARTINSVILLE, VIRGINIA Table 15
Computation of Direct and Overlapping Bonded Debt
At June 30, 2012
Direct:(1)
City of Martinsville $ 22,050,962 100% $ 22,050,962
The City of Martinsville has no overlapping debt.
157
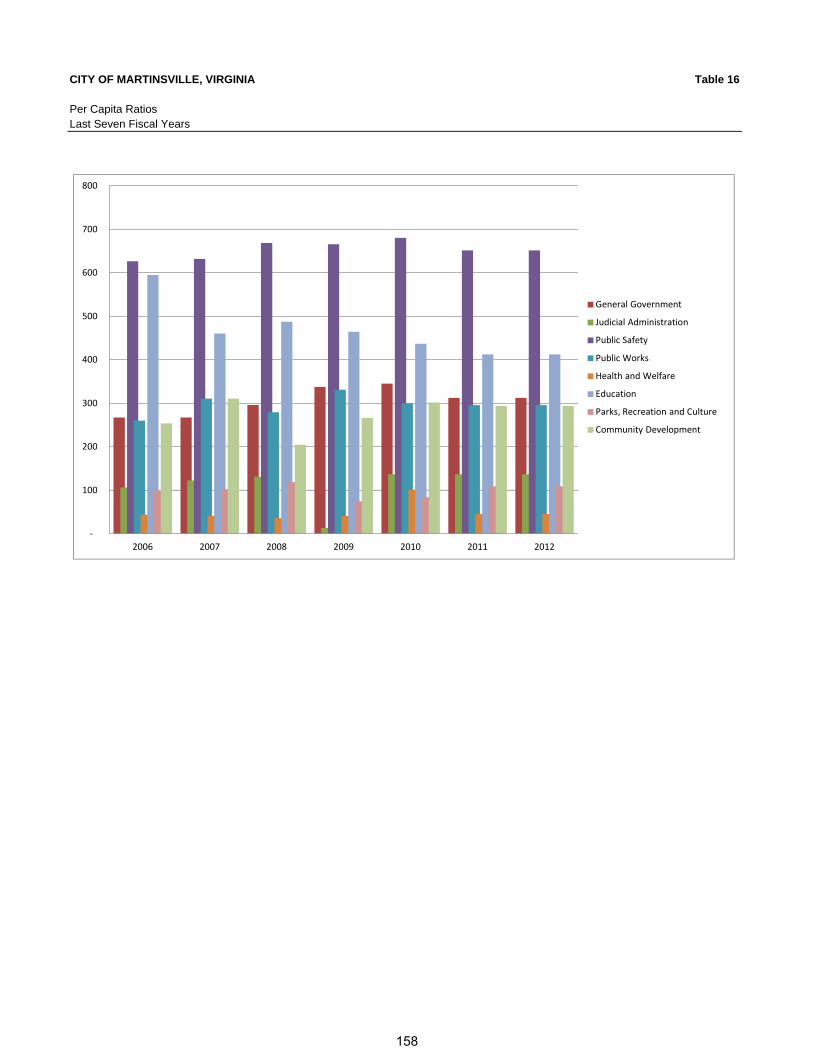
CITY OF MARTINSVILLE, VIRGINIA Table 16
Per Capita RatiosLast Seven Fiscal Years
‐
100
200
300
400
500
600
700
800
2006 2007 2008 2009 2010 2011 2012
General Government
Judicial Administration
Public Safety
Public Works
Health and Welfare
Education
Parks, Recreation and Culture
Community Development
158

CITY OF MARTINSVILLE, VIRGINIA Table 17
Demographic and Economic StatisticsLast Ten Fiscal Years
City Personal Fiscal Per Capita School Unemploy- Income
Year Population (1) Income (2) Enrollment (3) ment Rate (4) In Thousands (5)
2012 13,902 $ n/a 2,163 14.30% $ n/a2011 13,821 30,097 2,359 17.00% 2,025,5482010 13,821 29,220 2,324 20.20% 1,981,9452009 14,841 28,773 2,453 21.60% 2,000,4172008 14,535 28,906 2,436 11.40% 2,024,3492007 14,545 27,427 2,408 8.40% 1,920,0402006 14,687 26,646 2,526 7.20% 1,872,4492005 14,743 24,641 2,575 10.10% 1,736,2012004 14,731 17,251 2,593 12.00% 1,720,6352003 15,024 17,251 2,673 10.50% 1,725,430
n/a - not available at publication
Sources:
(1) The Weldon Cooper Center for Public Service(2) Bureau of Economic Analysis - data for "Martinsville, VA Micropolitan SA"(3) School Board Office(4) Virginia Employment Commission(5) Bureau of Economic Analysis - data for "Martinsville, VA Micropolitan SA"
159
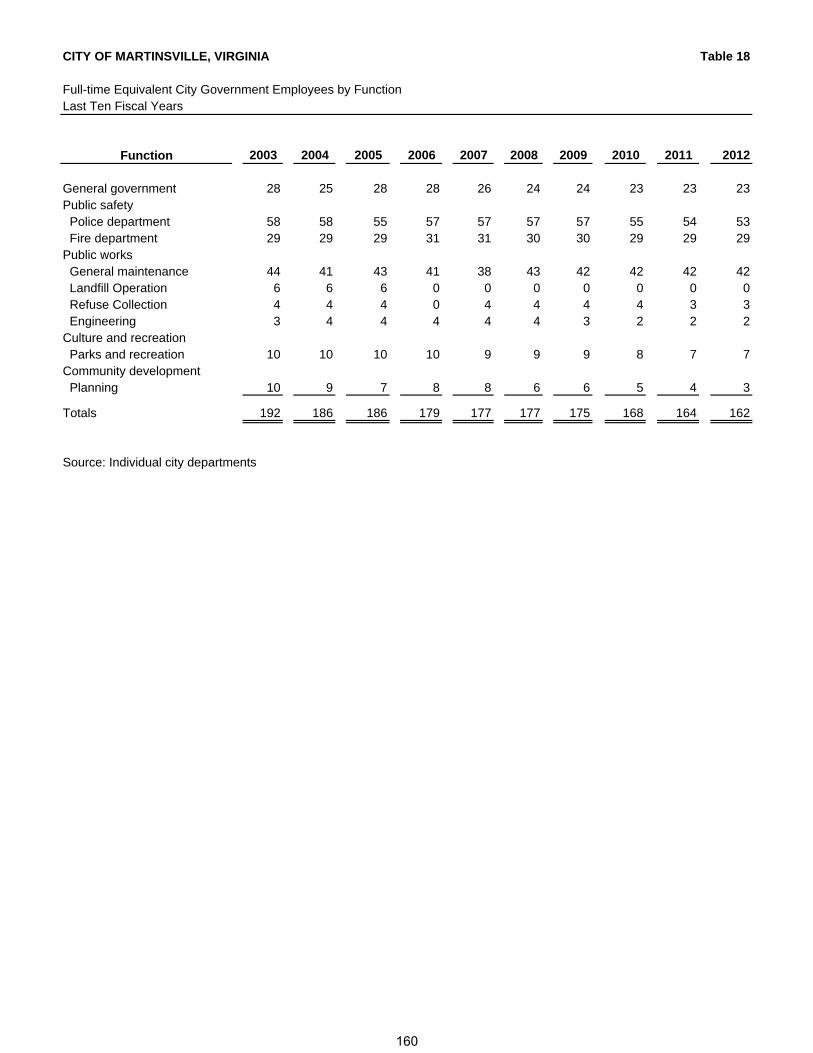
CITY OF MARTINSVILLE, VIRGINIA Table 18
Full-time Equivalent City Government Employees by FunctionLast Ten Fiscal Years
Function 2003 2004 2005 2006 2007 2008 2009 2010 2011 2012
General government 28 25 28 28 26 24 24 23 23 23Public safety Police department 58 58 55 57 57 57 57 55 54 53 Fire department 29 29 29 31 31 30 30 29 29 29Public works General maintenance 44 41 43 41 38 43 42 42 42 42 Landfill Operation 6 6 6 0 0 0 0 0 0 0 Refuse Collection 4 4 4 0 4 4 4 4 3 3 Engineering 3 4 4 4 4 4 3 2 2 2Culture and recreation Parks and recreation 10 10 10 10 9 9 9 8 7 7Community development Planning 10 9 7 8 8 6 6 5 4 3
Totals 192 186 186 179 177 177 175 168 164 162
Source: Individual city departments
160
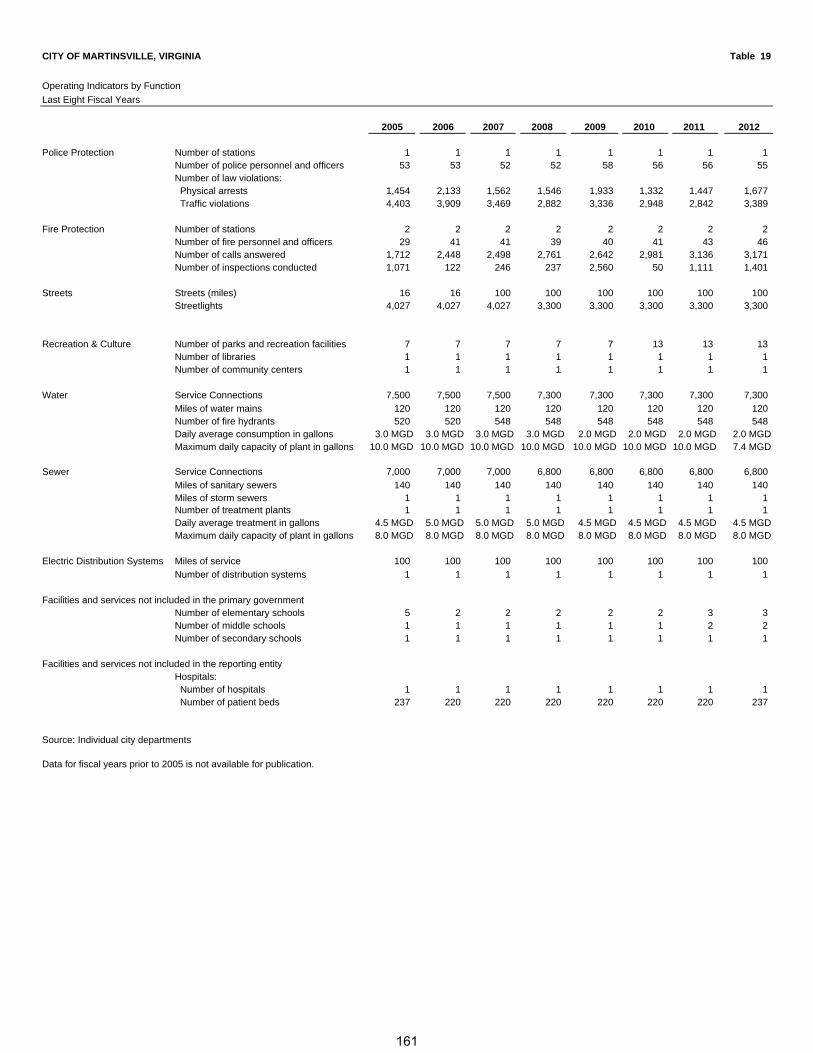
CITY OF MARTINSVILLE, VIRGINIA Table 19
Operating Indicators by Function
Last Eight Fiscal Years
2005 2006 2007 2008 2009 2010 2011 2012
Police Protection Number of stations 1 1 1 1 1 1 1 1Number of police personnel and officers 53 53 52 52 58 56 56 55Number of law violations: Physical arrests 1,454 2,133 1,562 1,546 1,933 1,332 1,447 1,677 Traffic violations 4,403 3,909 3,469 2,882 3,336 2,948 2,842 3,389
Fire Protection Number of stations 2 2 2 2 2 2 2 2Number of fire personnel and officers 29 41 41 39 40 41 43 46Number of calls answered 1,712 2,448 2,498 2,761 2,642 2,981 3,136 3,171Number of inspections conducted 1,071 122 246 237 2,560 50 1,111 1,401
Streets Streets (miles) 16 16 100 100 100 100 100 100Streetlights 4,027 4,027 4,027 3,300 3,300 3,300 3,300 3,300
Recreation & Culture Number of parks and recreation facilities 7 7 7 7 7 13 13 13Number of libraries 1 1 1 1 1 1 1 1Number of community centers 1 1 1 1 1 1 1 1
Water Service Connections 7,500 7,500 7,500 7,300 7,300 7,300 7,300 7,300
Miles of water mains 120 120 120 120 120 120 120 120Number of fire hydrants 520 520 548 548 548 548 548 548Daily average consumption in gallons 3.0 MGD 3.0 MGD 3.0 MGD 3.0 MGD 2.0 MGD 2.0 MGD 2.0 MGD 2.0 MGDMaximum daily capacity of plant in gallons 10.0 MGD 10.0 MGD 10.0 MGD 10.0 MGD 10.0 MGD 10.0 MGD 10.0 MGD 7.4 MGD
Sewer Service Connections 7,000 7,000 7,000 6,800 6,800 6,800 6,800 6,800
Miles of sanitary sewers 140 140 140 140 140 140 140 140Miles of storm sewers 1 1 1 1 1 1 1 1Number of treatment plants 1 1 1 1 1 1 1 1Daily average treatment in gallons 4.5 MGD 5.0 MGD 5.0 MGD 5.0 MGD 4.5 MGD 4.5 MGD 4.5 MGD 4.5 MGDMaximum daily capacity of plant in gallons 8.0 MGD 8.0 MGD 8.0 MGD 8.0 MGD 8.0 MGD 8.0 MGD 8.0 MGD 8.0 MGD
Electric Distribution Systems Miles of service 100 100 100 100 100 100 100 100
Number of distribution systems 1 1 1 1 1 1 1 1
Facilities and services not included in the primary governmentNumber of elementary schools 5 2 2 2 2 2 3 3Number of middle schools 1 1 1 1 1 1 2 2Number of secondary schools 1 1 1 1 1 1 1 1
Facilities and services not included in the reporting entityHospitals: Number of hospitals 1 1 1 1 1 1 1 1 Number of patient beds 237 220 220 220 220 220 220 237
Source: Individual city departments
Data for fiscal years prior to 2005 is not available for publication.
161
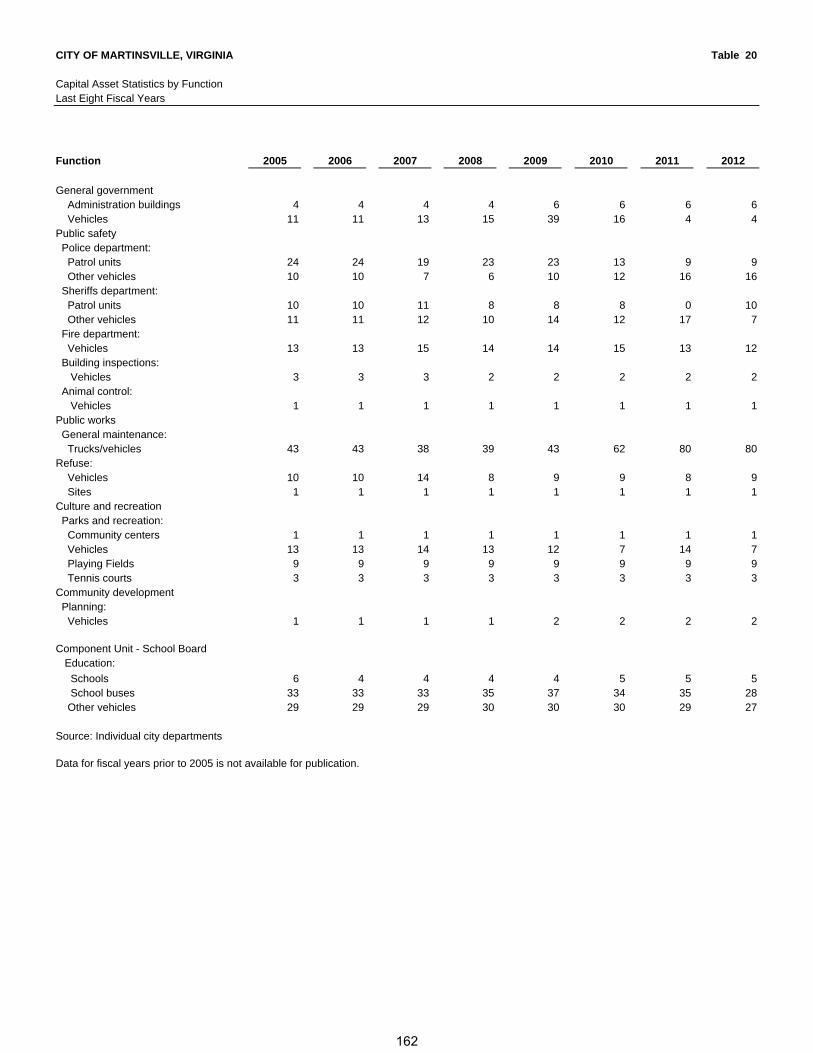
CITY OF MARTINSVILLE, VIRGINIA Table 20
Capital Asset Statistics by FunctionLast Eight Fiscal Years
Function 2005 2006 2007 2008 2009 2010 2011 2012
General government Administration buildings 4 4 4 4 6 6 6 6 Vehicles 11 11 13 15 39 16 4 4Public safety Police department: Patrol units 24 24 19 23 23 13 9 9 Other vehicles 10 10 7 6 10 12 16 16 Sheriffs department: Patrol units 10 10 11 8 8 8 0 10 Other vehicles 11 11 12 10 14 12 17 7 Fire department: Vehicles 13 13 15 14 14 15 13 12 Building inspections: Vehicles 3 3 3 2 2 2 2 2 Animal control: Vehicles 1 1 1 1 1 1 1 1Public works General maintenance: Trucks/vehicles 43 43 38 39 43 62 80 80Refuse: Vehicles 10 10 14 8 9 9 8 9 Sites 1 1 1 1 1 1 1 1Culture and recreation Parks and recreation: Community centers 1 1 1 1 1 1 1 1 Vehicles 13 13 14 13 12 7 14 7 Playing Fields 9 9 9 9 9 9 9 9 Tennis courts 3 3 3 3 3 3 3 3Community development Planning: Vehicles 1 1 1 1 2 2 2 2
Component Unit - School Board Education:
Schools 6 4 4 4 4 5 5 5 School buses 33 33 33 35 37 34 35 28 Other vehicles 29 29 29 30 30 30 29 27
Source: Individual city departments
Data for fiscal years prior to 2005 is not available for publication.
162
ROBINSON, FARMER, COX ASSOCIATES
A PROFESSIONAL LIMITED LIABILITY COMPANY CERTIFIED PUBLIC ACCOUNTANTS
Report on Internal Control Over Financial Reporting and on Compliance and Other Matters Based on an Audit of Financial Statements
Performed in Accordance with Government Auditing Standards To The Honorable Members of City Council City of Martinsville Martinsville, Virginia We have audited the financial statements of the governmental activities, the business-type activities, the discretely presented component unit, each major fund, and the aggregate remaining fund information of the City of Martinsville, Virginia, as of and for the year ended June 30, 2012, which collectively comprise the City of Martinsville, Virginia’s basic financial statements and have issued our report thereon dated December 12, 2012. We conducted our audit in accordance with auditing standards generally accepted in the United States of America; the standards applicable to financial audits contained in Government Auditing Standards, issued by the Comptroller General of the United States; and the Specifications for Audits of Counties, Cities, and Towns, issued by the Auditor of Public Accounts of the Commonwealth of Virginia. Internal Control Over Financial Reporting Management of the City of Martinsville, Virginia is responsible for establishing and maintaining effective internal control over financial reporting. In planning and performing our audit, we considered the City of Martinsville, Virginia's internal control over financial reporting as a basis for designing our auditing procedures for the purpose of expressing our opinions on the financial statements, but not for the purpose of expressing an opinion on the effectiveness of the City’s internal control over financial reporting. Accordingly, we do not express an opinion on the effectiveness of the City of Martinsville, Virginia's internal control over financial reporting. A deficiency in internal control exists when the design or operation of a control does not allow management or employees, in the normal course of performing their assigned functions, to prevent, or detect and correct misstatements on a timely basis. A material weakness is a deficiency, or a combination of deficiencies, in internal control such that there is a reasonable possibility that a material misstatement of the City’s financial statements will not be prevented, or detected and corrected on a timely basis. Our consideration of internal control over financial reporting was for the limited purpose described in the first paragraph of this section and would not necessarily identify all deficiencies in internal control that might be significant deficiencies or material weaknesses. We did not identify any deficiencies in internal control over financial reporting that we consider to be material weaknesses, as defined above.
163
Compliance and Other Matters
As part of obtaining reasonable assurance about whether the City of Martinsville, Virginia's financial statements are free of material misstatement, we performed tests of its compliance with certain provisions of laws, regulations, contracts, and grant agreements, noncompliance with which could have a direct and material effect on the determination of financial statement amounts. However, providing an opinion on compliance with those provisions was not an objective of our audit, and accordingly, we do not express such an opinion. The results of our tests disclosed no instances of noncompliance or other matters that are required to be reported under GovernmentAuditing Standards. We noted certain other matters that we reported to management of City of Martinsville, Virginia in a separate letter dated December 12, 2012. This report is intended solely for the information and use of management, the City Council, and federal awarding agencies and pass-through entities and is not intended to be and should not be used by anyone other than these specified parties.
Charlottesville, Virginia December 12, 2012
164
ROBINSON, FARMER, COX ASSOCIATES
CERTIFIED PUBLIC ACCOUNTANTS A PROFESSIONAL LIMITED LIABILITY COMPANY
Independent Auditors’ Report on Compliance with Requirements That Could Have a Direct and Material Effect on Each Major Program and on Internal
Control Over Compliance in Accordance with OMB Circular A-133 To The Honorable Members of City Council City of Martinsville Martinsville, Virginia Compliance We have audited the City of Martinsville, Virginia’s compliance with the types of compliance requirements described in the OMB Circular A-133 Compliance Supplement that could have a direct and material effect on each of its major federal programs for the year ended June 30, 2012. The City of Martinsville, Virginia's major federal programs are identified in the summary of auditor's results section of the accompanying schedule of findings and questioned costs. Compliance with the requirements of laws, regulations, contracts and grants applicable to each of its major federal programs is the responsibility of the City of Martinsville, Virginia's management. Our responsibility is to express an opinion on the City of Martinsville, Virginia's compliance based on our audit. We conducted our audit of compliance in accordance with auditing standards generally accepted in the United States of America; the standards applicable to financial audits contained in Government Auditing Standards, issued by the Comptroller General of the United States; and OMB Circular A-133, Audits of States, Local Governments and Non-Profit Organizations. Those standards and OMB Circular A-133 require that we plan and perform the audit to obtain reasonable assurance about whether noncompliance with the types of compliance requirements referred to above that could have a direct and material effect on a major federal program occurred. An audit includes examining, on a test basis, evidence about the City of Martinsville, Virginia's compliance with those requirements and performing such other procedures as we considered necessary in the circumstances. We believe that our audit provides a reasonable basis for our opinion. Our audit does not provide a legal determination of City of Martinsville, Virginia's compliance with those requirements. In our opinion, the City of Martinsville, Virginia complied, in all material respects, with the requirements referred to above that that could have a direct and material effect on each of its major federal programs for the year ended June 30, 2012.
165
Internal Control Over Compliance
The management of the City of Martinsville, Virginia is responsible for establishing and maintaining effective internal control over compliance with the requirements of laws, regulations, contracts and grants applicable to federal programs. In planning and performing our audit, we considered the City of Martinsville, Virginia's internal control over compliance with the requirements that could have a direct and material effect on a major federal program in order to determine our auditing procedures for the purpose of expressing our opinion on compliance and to test and report on internal control over compliance in accordance with OMB Circular A-133, but not for the purpose of expressing an opinion on the effectiveness of internal control over compliance. Accordingly, we do not express an opinion on the effectiveness of the City’s internal control over compliance. A deficiency in internal control over compliance exists when the design or operation of a control over compliance does not allow management or employees, in the normal course of performing their assigned functions, to prevent, or detect and correct, noncompliance with a type of compliance requirement of a federal program on a timely basis. A material weakness in internal control over compliance is a deficiency, or combination of deficiencies, in internal control over compliance, such that there is a reasonable possibility that material noncompliance with a type of compliance requirement of a federal program will not be prevented, or detected and corrected, on a timely basis. Our consideration of internal control over compliance was for the limited purpose described in the first paragraph of this section and was not designed to identify deficiencies in internal control over compliance that might be deficiencies, significant deficiencies or material weaknesses. We did not identify any deficiencies in internal control over compliance that we consider to be material weaknesses, as defined above. This report is intended solely for the information and use of management, the City Council, and federal awarding agencies and pass-through entities and is not intended to be and should not be used by anyone other than these specified parties. Charlottesville, Virginia December 12, 2012
166

CITY OF MARTINSVILLE, VIRGINIA Page 1 of 2
Schedule of Expenditures of Federal Awards - Primary Government and Discretely Presented Component UnitYear Ended June 30, 2012
Pass-ThroughFederal AgencyCFDA Identifying Federal
Federal Grantor/State Pass - Through Grantor/Program or Cluster Title Number Number Expenditures
PRIMARY GOVERNMENT:
DEPARTMENT OF TRANSPORTATION: Pass through payments: Department of Motor Vehicles: ARRA - Highway planning and construction 20.205 UPC 97198 $ 16,401 Alcohol Open Container Requirements 20.607 60507-50320 29,785 Total Department of Housing and Community Development $ 46,186
DEPARTMENT OF ENERGY: Direct payments: State Energy Program 81.041 N/A $ 1,000,000 Energy Efficiency and Conservation Block Grant Program 81.128 N/A 906,681
$ 1,906,681
FEDERAL EMERGENCY MANAGEMENT AGENCY: Pass through payments:
Department of Emergency Services: State Homeland Security Program (SHSP) 97.073 Unknown 35,720
DEPARTMENT OF HOUSING AND URBAN DEVELOPMENT: Direct payments: Section 8 Housing choice vouchers 14.871 N/A $ 1,997,431 Lower Income Housing Assistance Program-Section 8 Moderate Rehabilitation 14.856 N/A 48,851
Pass through payments: Department of Housing and Community Development: Community development block grants / State's Program and Non-Entitlement Grants in Hawaii 14.228 53305-50797 133,546 Total Department of Housing and Community Development $ 2,179,828
DEPARTMENT OF LABOR: Pass through payments: Governor's Employment and Training Department: Senior community service employment program 17.235 N/A $ 21,123
DEPARTMENT OF JUSTICE: Direct payments: Viper grant 16.000 N/A $ 6,882 Asset forfeiture 16.000 N/A 1,524
Total viper grant and asset forfeiture - 16.000 $ 8,406
ARRA - Public Safety Partnership and Community Policing Grants 16.710 N/A 8,500 Edward Byrne Memorial State and Local Law Enforcement Discretionary Grants Program 16.580 N/A 3,383 State Criminal Alien Assistance Program 16.606 N/A 510 Pass through payments: Department of Criminal Justice Services: Crime victim assistance 16.575 39001-86000 53,303
Total Department of Justice $ 74,102
Total Primary Government $ 4,263,640
COMPONENT UNIT-SCHOOL BOARD:
DEPARTMENT OF AGRICULTURE: Pass through payments: Child Nutrition Cluster: Department of Agriculture: Food distribution 10.555 10.555/2001 $ 65,254 Department of Education: National school lunch program 10.555 10.555/2011 713,173
10.555/2012
Total national school lunch program - 10.555 $ 778,427
167

CITY OF MARTINSVILLE, VIRGINIA Page 2 of 2
Schedule of Expenditures of Federal Awards - Primary Government and Discretely Presented Component UnitYear Ended June 30, 2012 (Continued)
Pass-ThroughFederal AgencyCFDA Identifying Federal
Federal Grantor/State Pass - Through Grantor/Program or Cluster Title Number Number Expenditures
COMPONENT UNIT-SCHOOL BOARD: (Continued)
DEPARTMENT OF AGRICULTURE: (Continued) Department of Education: School breakfast program 10.553 10.553/2011 $ 258,600
10.553/2012 Fresh fruit and vegetable program 10.582 10.582/2011 41,999
10.582/2012
Total Department of Agriculture $ 1,079,026
DEPARTMENT OF LABOR: Direct payments: Workforce investment act - youth activities 17.259 N/A $ 47,846
DEPARTMENT OF EDUCATION: Direct payments: Department of Education: Adult Education - National Leadership Activities 84.191 N/A $ 42,073 Pass through payments: Department of Education: Gaining Early Awareness and Readiness for Undergraduate Programs 84.334 17117-00000 $ 21,088 Title I, Part A Cluster: Title I Grants to Local Educational Agencies 84.010 S010A090046 971,525
S010A100046S010A110046
ARRA - Title I Grants to Local Educational Agencies 84.389 S389A090046 151,486 Special Education Cluster (IDEA): Special Education - Grants to States 84.027 H027A090107 537,970
H027A100107H027A110107
Special Education - Preschool Grants 84.173 H173A090112 7,489H173A100112H173A110112
ARRA - Special Education - Grants to States 84.391 H391A090107 214,193 ARRA - Special Education - Preschool Grants 84.392 H392A090112 6,162 Career and Technical Education - Basic Grants to States 84.048 V048A100046 69,141
V048A110046 Safe and Drug-free schools and communities - State Grants 84.186 Q189A090048 20,788 English Language acquisition grants 84.365 S365A090046 13,900
S365A100046 Improving teacher quality state grants 84.367 S367A090044 171,460
S367A100044S367A110044
Rural Education 84.358 S358B090046 60,297S358B100046S358B110046
Twenty-First Century Community Learning Centers 84.287 S287C090047 419,800S287C100047S287C110047
Education Technology State Grants 84.318 S318X100046 15,822
ARRA - Education Jobs Fund 84.410 S410A10047 592,713
Total Department of Education $ 3,315,907
NATIONAL AERONAUTICS AND SPACE ADMINISTRATION: Direct payments: Aerospace Education Services Program 43.001 N/A $ 274,139
CORPORATION FOR NATIONAL AND COMMUNITY SERVICE: Pass through payments: Department of Education: Learn and Serve America - School and Community Based Programs 94.004 KSSVA09001 $ 31,323
KSSVA09002
Total Component Unit School Board $ 4,748,241
Total Expenditures of Federal Awards $ 9,011,881
See accompanying notes to schedule of expenditures of federal awards
168
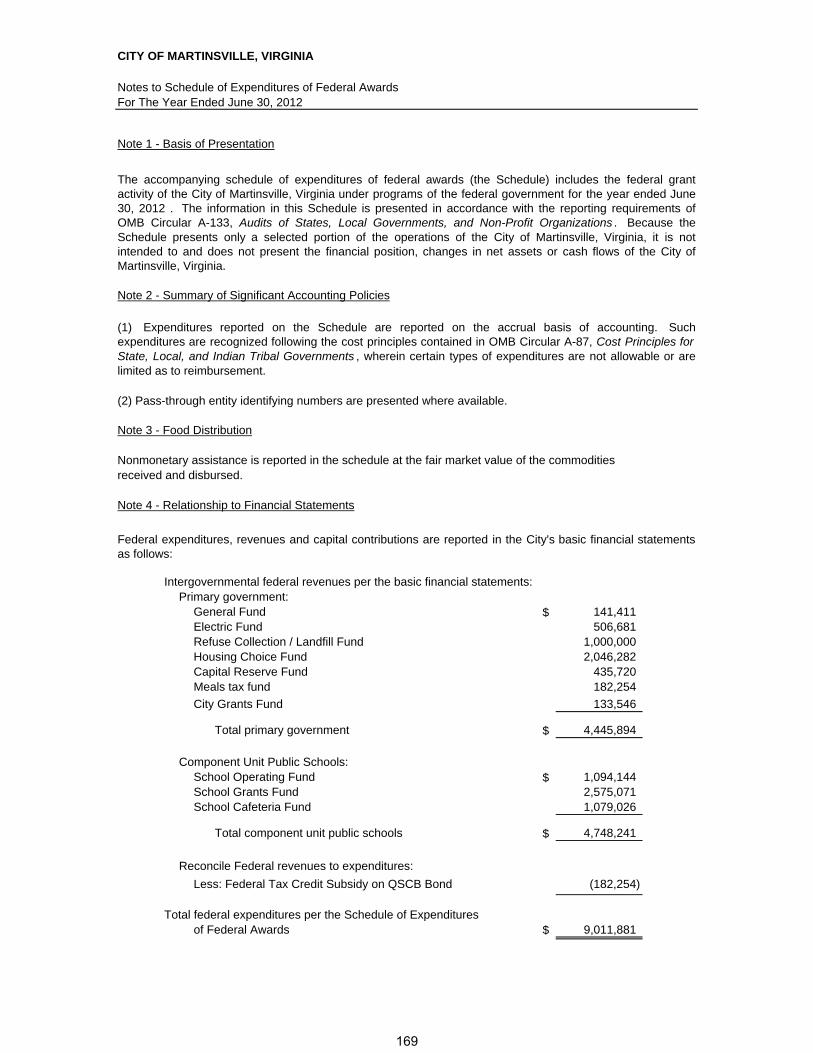
CITY OF MARTINSVILLE, VIRGINIA
Notes to Schedule of Expenditures of Federal AwardsFor The Year Ended June 30, 2012
Note 1 - Basis of Presentation
Note 2 - Summary of Significant Accounting Policies
Note 3 - Food Distribution
Nonmonetary assistance is reported in the schedule at the fair market value of the commoditiesreceived and disbursed.
Note 4 - Relationship to Financial Statements
Intergovernmental federal revenues per the basic financial statements:Primary government:
General Fund $ 141,411 Electric Fund 506,681 Refuse Collection / Landfill Fund 1,000,000 Housing Choice Fund 2,046,282 Capital Reserve Fund 435,720
Meals tax fund 182,254
City Grants Fund 133,546
Total primary government $ 4,445,894
Component Unit Public Schools:School Operating Fund $ 1,094,144 School Grants Fund 2,575,071 School Cafeteria Fund 1,079,026
Total component unit public schools $ 4,748,241
Reconcile Federal revenues to expenditures:
Less: Federal Tax Credit Subsidy on QSCB Bond (182,254)
Total federal expenditures per the Schedule of Expendituresof Federal Awards $ 9,011,881
The accompanying schedule of expenditures of federal awards (the Schedule) includes the federal grantactivity of the City of Martinsville, Virginia under programs of the federal government for the year ended June30, 2012 . The information in this Schedule is presented in accordance with the reporting requirements ofOMB Circular A-133, Audits of States, Local Governments, and Non-Profit Organizations . Because theSchedule presents only a selected portion of the operations of the City of Martinsville, Virginia, it is notintended to and does not present the financial position, changes in net assets or cash flows of the City ofMartinsville, Virginia.
(1) Expenditures reported on the Schedule are reported on the accrual basis of accounting. Suchexpenditures are recognized following the cost principles contained in OMB Circular A-87, Cost Principles forState, Local, and Indian Tribal Governments , wherein certain types of expenditures are not allowable or arelimited as to reimbursement.
Federal expenditures, revenues and capital contributions are reported in the City's basic financial statementsas follows:
(2) Pass-through entity identifying numbers are presented where available.
169

This page intentionally left blank
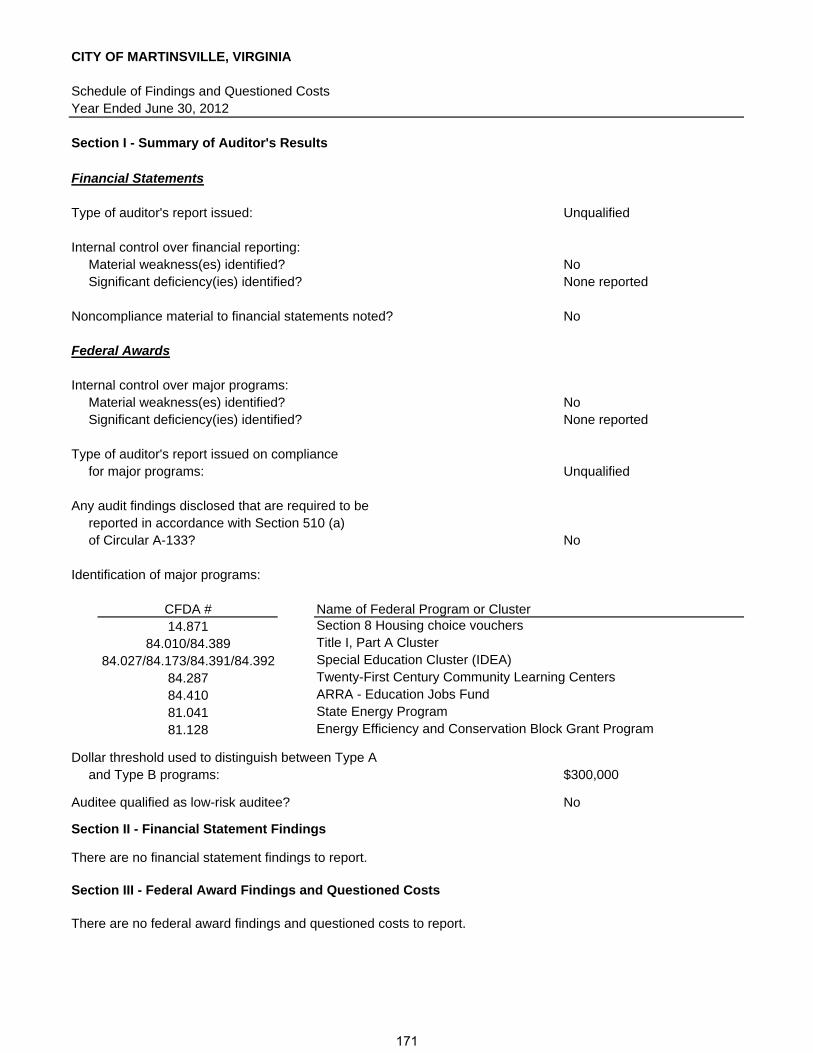
CITY OF MARTINSVILLE, VIRGINIA
Schedule of Findings and Questioned CostsYear Ended June 30, 2012
Section I - Summary of Auditor's Results
Financial Statements
Type of auditor's report issued: Unqualified
Internal control over financial reporting:Material weakness(es) identified? NoSignificant deficiency(ies) identified? None reported
Noncompliance material to financial statements noted? No
Federal Awards
Internal control over major programs:Material weakness(es) identified? NoSignificant deficiency(ies) identified? None reported
Type of auditor's report issued on compliance for major programs: Unqualified
Any audit findings disclosed that are required to bereported in accordance with Section 510 (a)of Circular A-133? No
Identification of major programs:
CFDA # Name of Federal Program or Cluster14.871 Section 8 Housing choice vouchers
84.010/84.389 Title I, Part A Cluster84.027/84.173/84.391/84.392 Special Education Cluster (IDEA)
84.287 Twenty-First Century Community Learning Centers84.410 ARRA - Education Jobs Fund81.041 State Energy Program81.128 Energy Efficiency and Conservation Block Grant Program
Dollar threshold used to distinguish between Type A and Type B programs: $300,000
Auditee qualified as low-risk auditee? No
Section II - Financial Statement Findings
There are no financial statement findings to report.
Section III - Federal Award Findings and Questioned Costs
There are no federal award findings and questioned costs to report.
171
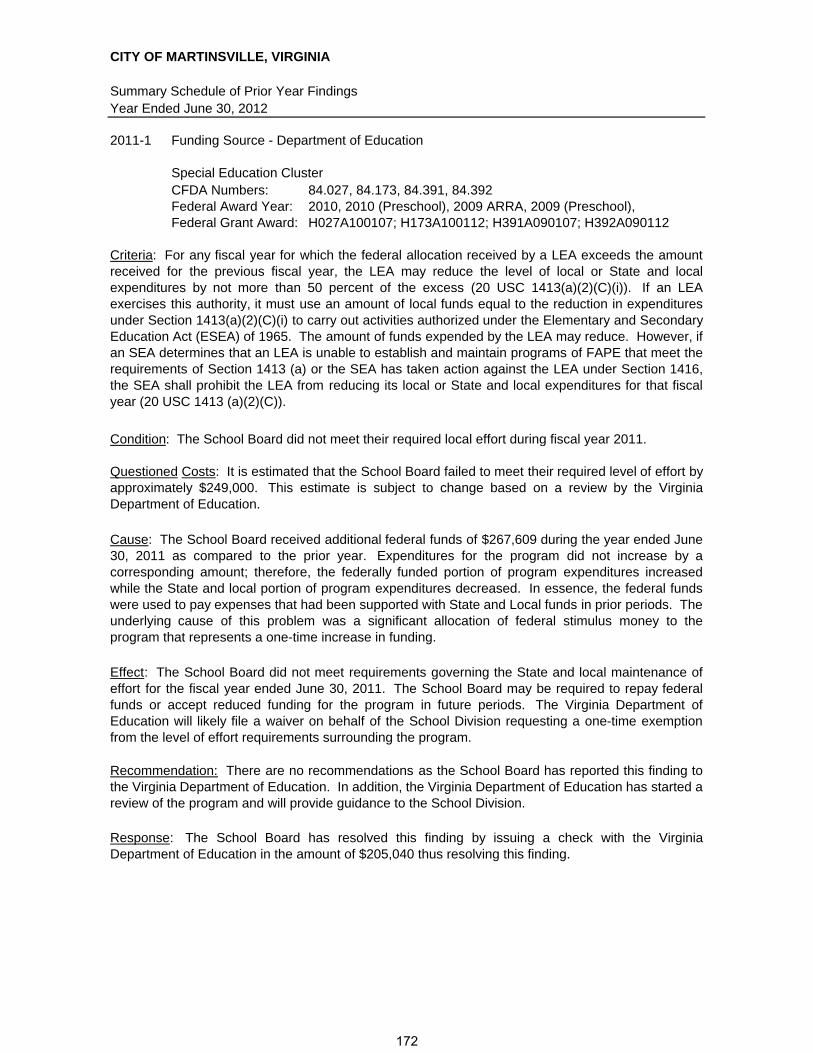
CITY OF MARTINSVILLE, VIRGINIA
Summary Schedule of Prior Year FindingsYear Ended June 30, 2012
2011-1 Funding Source - Department of Education
Special Education ClusterCFDA Numbers: 84.027, 84.173, 84.391, 84.392Federal Award Year: 2010, 2010 (Preschool), 2009 ARRA, 2009 (Preschool), Federal Grant Award: H027A100107; H173A100112; H391A090107; H392A090112
Condition: The School Board did not meet their required local effort during fiscal year 2011.
Response: The School Board has resolved this finding by issuing a check with the VirginiaDepartment of Education in the amount of $205,040 thus resolving this finding.
Criteria: For any fiscal year for which the federal allocation received by a LEA exceeds the amountreceived for the previous fiscal year, the LEA may reduce the level of local or State and localexpenditures by not more than 50 percent of the excess (20 USC 1413(a)(2)(C)(i)). If an LEAexercises this authority, it must use an amount of local funds equal to the reduction in expendituresunder Section 1413(a)(2)(C)(i) to carry out activities authorized under the Elementary and SecondaryEducation Act (ESEA) of 1965. The amount of funds expended by the LEA may reduce. However, ifan SEA determines that an LEA is unable to establish and maintain programs of FAPE that meet therequirements of Section 1413 (a) or the SEA has taken action against the LEA under Section 1416,the SEA shall prohibit the LEA from reducing its local or State and local expenditures for that fiscalyear (20 USC 1413 (a)(2)(C)).
Questioned Costs: It is estimated that the School Board failed to meet their required level of effort byapproximately $249,000. This estimate is subject to change based on a review by the VirginiaDepartment of Education.
Cause: The School Board received additional federal funds of $267,609 during the year ended June30, 2011 as compared to the prior year. Expenditures for the program did not increase by acorresponding amount; therefore, the federally funded portion of program expenditures increasedwhile the State and local portion of program expenditures decreased. In essence, the federal fundswere used to pay expenses that had been supported with State and Local funds in prior periods. Theunderlying cause of this problem was a significant allocation of federal stimulus money to theprogram that represents a one-time increase in funding.
Effect: The School Board did not meet requirements governing the State and local maintenance ofeffort for the fiscal year ended June 30, 2011. The School Board may be required to repay federalfunds or accept reduced funding for the program in future periods. The Virginia Department ofEducation will likely file a waiver on behalf of the School Division requesting a one-time exemptionfrom the level of effort requirements surrounding the program.
Recommendation: There are no recommendations as the School Board has reported this finding tothe Virginia Department of Education. In addition, the Virginia Department of Education has started areview of the program and will provide guidance to the School Division.
172