74881i
DESCRIPTION
ÂTRANSCRIPT
Measurement Sampling Frequency Impact on Determining Magnitude of Pattern Placement Errors on Photomasks
J. Whitteya, F. Laskea, K.-D. Roetha, J. McCormacka, D. Adama, J. Bendera
C. N. Berglundb, M. Takacb, Seurien Chouc aKLA Tencor MIE GmbH, Kubacher Weg 4, 35781 Weilburg, Germany
bNorthwest Technology Group Consulting, Inc., 16505 A SE 1st Street, Vancouver, WA 98684, USA cSynopsis, Inc., 700E Middlefield Road, Mountain View, CA 94043, USA
ABSTRACT
Current methodologies for determining pattern placement errors on production masks are based primarily on limited sample sizes and Gaussian statistics. These methodologies and accepted practices may not be indicative of the true nature of pattern placement errors actually occurring on the photomasks. Pattern placement errors can originate from a variety of sources on e-beam generated photomasks. Random shot placement errors, localized charging and heating, proximity effects, global charging, and writing strategies may all have an impact on overall pattern placement errors. It is suspected therefore that pattern placement errors on photomasks are not all well approximated as Gaussian, but include a number of significant errors with unique spatial signatures that need to be addressed differently. This paper investigates different measurement sampling strategies on a single leading edge poly layer to determine what level or amount of measurements might be necessary to more accurately determine the probabilities of the true placement errors on the photomask, and what spatially dependent components may or may not be accurately represented in the measurements.
Keywords: Mask metrology, registration, sampling, overlay, yield
Introduction In collaboration with a leading edge captive mask manufacturer pattern placement performance of a poly layer reticle was measured using different sampling strategies to ascertain whether current methodologies for measuring pattern placement errors are truly indicative of the real placement errors that can occur on a mask. An adaptive metrology technique was employed based on arrays with different pitches that captures successively small and smaller areas depending on the errors detected in larger area sampling plans. Measurements were performed using KLA-Tencor’s LMS IPRO4 on actual in-die features at thousands of locations across the reticle. Typically photomasks today are dispositioned using a 3 sigma value for X and Y placement errors based on an approximate range of thirty to three hundred measurement points. Often times these measurement points are registration targets located in the scribe of the exposure field on the reticle. Depending on writing strategies, local charging, pattern densities, stripe field boundaries, plate flatness, noise, chucking and other effects, the measured features in the scribe are often times not indicative of the errors within the exposure field itself 1 . The simplified error budget model shown in figure 1 illustrates some of the issues involved, where we have divided the error sources into three categories – random errors, spatially systematic errors that are slowly varying across the reticle (low spatial), and spatially systematic errors that are short range in nature (high spatial). Starting at the 32nm node more detailed registration evaluations should be performed to ensure minimum impact from the reticle to wafer overlay yield. This discrepancy in reported errors or the probability of additional errors may lead to yield loss in manufacturing depending on the particular layer combinations6. Detected errors on the photomask measured for this paper were a combination of random and systematic errors. Given the magnitude of the systematic errors the question arises as to whether today’s sampling strategies and the employment of Gaussian statistics are the correct way to disposition product reticles. The goal of pattern placement metrology is to accurately estimate the probability of the true nature and
Photomask Technology 2009, edited by Larry S. Zurbrick, M. Warren Montgomery, Proc. of SPIE Vol. 7488, 74881I · © 2009 SPIE · CCC code: 0277-786X/09/$18 · doi: 10.1117/12.833495
Proc. of SPIE Vol. 7488 74881I-1
Downloaded from SPIE Digital Library on 18 Nov 2009 to 192.146.1.254. Terms of Use: http://spiedl.org/terms

magnitude of placement errors based on a limited but adequate sampling strategy by applying the correct statistical models to the resulting population of data.
Figure 1 – Simplified pattern placement error budget model5
METHODOLOGY
All measurements were performed on an LMS IPRO4 pattern placement metrology system2. Performance specifications are shown in table 1. The LMS IPRO4 is capable of measuring in-die features such as contacts as small as 300 nm in size3. The particular layer chosen for measurements was a 45 nm node production poly layer due to its critical effect on device yields and performance.
Measurement Specification
Nominal Accuracy 2.2 nm
Long Term Positional Repeatability 1.9 nm
Short Term Positional Repeatability 1.3 nm
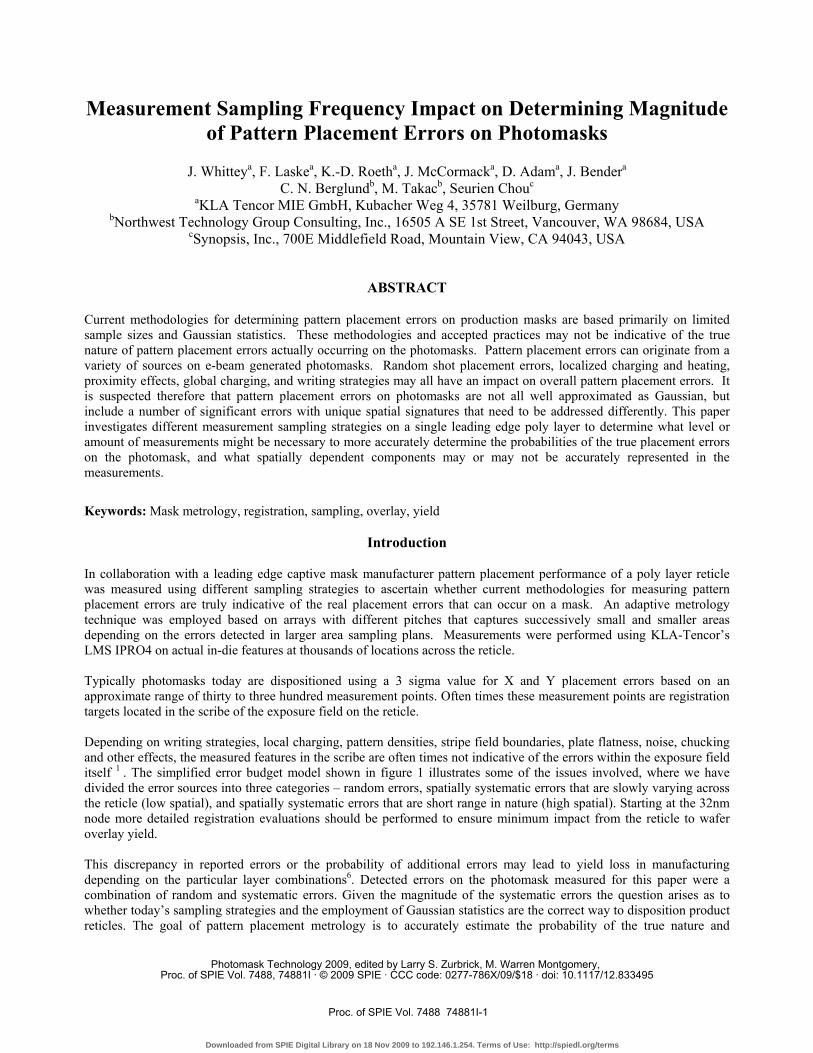
Table 1: Measurement performance specification of the LMS IPRO4 metrology system The measurement features were selected using Synopsys’s CATS marking program. The data was then output in a proprietary “MF3” format for input into the LMS IPRO4 measurement system. The use of adaptive metrology principles was implemented4 by first creating a large number of registration measurements on a square grid (0.25 centimeter grid spacing) covering the entire reticle area on any measureable feature found at or near the grid sites. In this way measurements are made on a random selection of device features within the pattern, not just on test structures designed specifically for registration measurements (see figure 2).
Proc. of SPIE Vol. 7488 74881I-2
Downloaded from SPIE Digital Library on 18 Nov 2009 to 192.146.1.254. Terms of Use: http://spiedl.org/terms
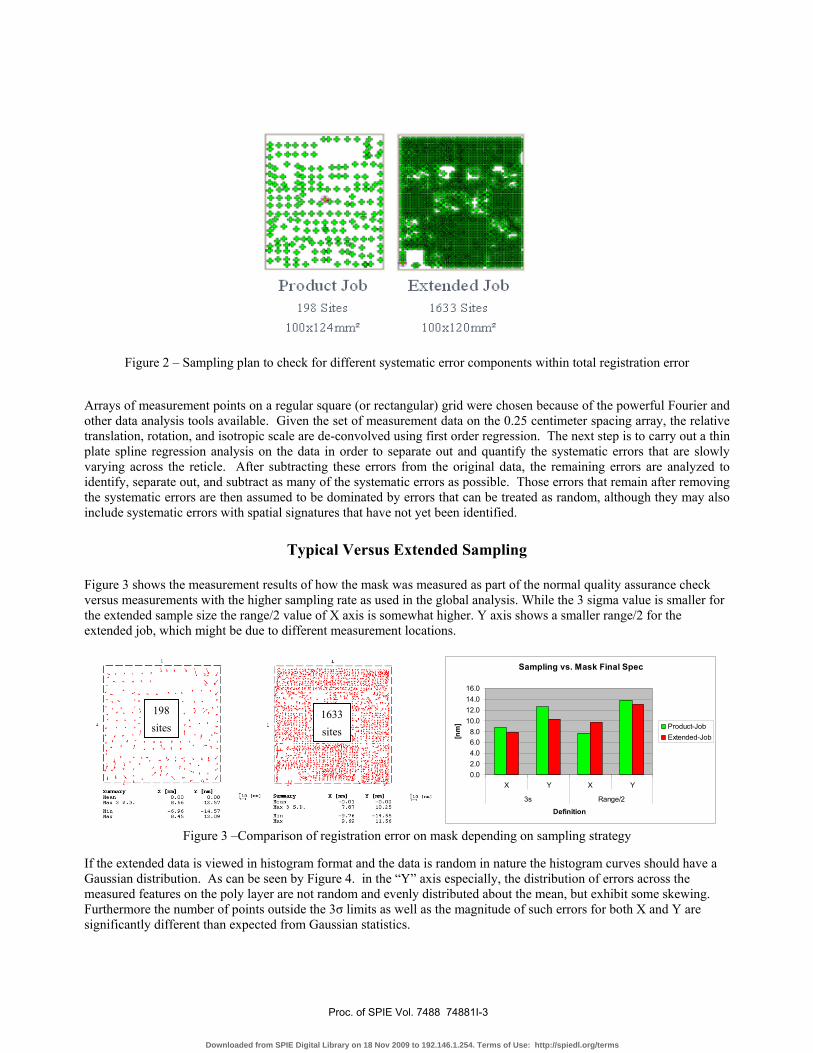
Figure 2 – Sampling plan to check for different systematic error components within total registration error
Arrays of measurement points on a regular square (or rectangular) grid were chosen because of the powerful Fourier and other data analysis tools available. Given the set of measurement data on the 0.25 centimeter spacing array, the relative translation, rotation, and isotropic scale are de-convolved using first order regression. The next step is to carry out a thin plate spline regression analysis on the data in order to separate out and quantify the systematic errors that are slowly varying across the reticle. After subtracting these errors from the original data, the remaining errors are analyzed to identify, separate out, and subtract as many of the systematic errors as possible. Those errors that remain after removing the systematic errors are then assumed to be dominated by errors that can be treated as random, although they may also include systematic errors with spatial signatures that have not yet been identified.
Typical Versus Extended Sampling
Figure 3 shows the measurement results of how the mask was measured as part of the normal quality assurance check versus measurements with the higher sampling rate as used in the global analysis. While the 3 sigma value is smaller for the extended sample size the range/2 value of X axis is somewhat higher. Y axis shows a smaller range/2 for the extended job, which might be due to different measurement locations.
198sites
1633sites
Sampling vs. Mask Final Spec
0.02.04.06.08.010.012.014.016.0
X Y X Y
3s Range/2
Definition
[nm
] Product-JobExtended-Job
Figure 3 –Comparison of registration error on mask depending on sampling strategy
If the extended data is viewed in histogram format and the data is random in nature the histogram curves should have a Gaussian distribution. As can be seen by Figure 4. in the “Y” axis especially, the distribution of errors across the measured features on the poly layer are not random and evenly distributed about the mean, but exhibit some skewing. Furthermore the number of points outside the 3σ limits as well as the magnitude of such errors for both X and Y are significantly different than expected from Gaussian statistics.
Proc. of SPIE Vol. 7488 74881I-3
Downloaded from SPIE Digital Library on 18 Nov 2009 to 192.146.1.254. Terms of Use: http://spiedl.org/terms
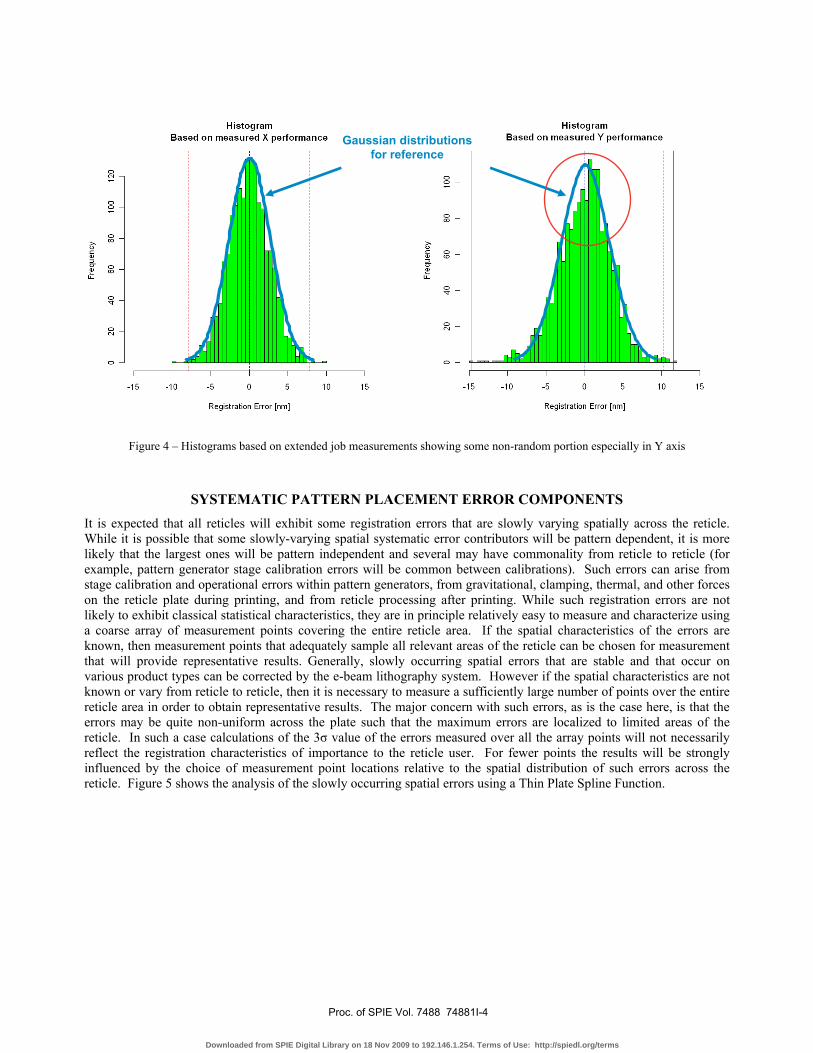
Figure 4 – Histograms based on extended job measurements showing some non-random portion especially in Y axis
SYSTEMATIC PATTERN PLACEMENT ERROR COMPONENTS It is expected that all reticles will exhibit some registration errors that are slowly varying spatially across the reticle. While it is possible that some slowly-varying spatial systematic error contributors will be pattern dependent, it is more likely that the largest ones will be pattern independent and several may have commonality from reticle to reticle (for example, pattern generator stage calibration errors will be common between calibrations). Such errors can arise from stage calibration and operational errors within pattern generators, from gravitational, clamping, thermal, and other forces on the reticle plate during printing, and from reticle processing after printing. While such registration errors are not likely to exhibit classical statistical characteristics, they are in principle relatively easy to measure and characterize using a coarse array of measurement points covering the entire reticle area. If the spatial characteristics of the errors are known, then measurement points that adequately sample all relevant areas of the reticle can be chosen for measurement that will provide representative results. Generally, slowly occurring spatial errors that are stable and that occur on various product types can be corrected by the e-beam lithography system. However if the spatial characteristics are not known or vary from reticle to reticle, then it is necessary to measure a sufficiently large number of points over the entire reticle area in order to obtain representative results. The major concern with such errors, as is the case here, is that the errors may be quite non-uniform across the plate such that the maximum errors are localized to limited areas of the reticle. In such a case calculations of the 3σ value of the errors measured over all the array points will not necessarily reflect the registration characteristics of importance to the reticle user. For fewer points the results will be strongly influenced by the choice of measurement point locations relative to the spatial distribution of such errors across the reticle. Figure 5 shows the analysis of the slowly occurring spatial errors using a Thin Plate Spline Function.
Gaussian distributions for reference
Proc. of SPIE Vol. 7488 74881I-4
Downloaded from SPIE Digital Library on 18 Nov 2009 to 192.146.1.254. Terms of Use: http://spiedl.org/terms

Figure 5 – Raw registration map (left) and derived slowly spatial error contributions (mid) using a Thin Plate Spline
function and the residuals (complete 1st order removed) (right)
Fig. 6 shows the error plot after the slowly varying systematic errors in Fig. 5 have been subtracted from the total error at each point. One might conclude from this figure that only random errors remain. However spatially-dependent error sources are present and some of these are exposed when the error data in Fig. 6 is put through a spatial Fourier filter. In this powerful analysis technique the error distribution in Fig. 6 is first transformed to the spatial frequency domain using a fast Fourier transform, then two parts of the spectrum are reverse transformed separately. One reverse transformation includes only the spatial frequency components along the u- and v-axis, and the other includes all other components. In this way any spatial dependencies that have either u- or v-orientation or periodicities are included in the former, and the remainder is included in the latter. Since many potential systematic error sources such as some pattern dependencies and pattern generator errors have x-and/or y-periodicities, this scheme allows these to be separated from random and other systematic errors. The error distribution determined from this Fourier cross filter along the center row and column (u,v-axis) will be referred to as axis-oriented error distributions. The results of this data filtering are shown in Fig. 7 with Fig. 7a showing the axis-oriented error distribution and Fig. 7b showing the remaining error distribution. This remaining error distribution has a 3σ value of approximately 5 nm in both x and y and no apparent spatial signatures or variation from region to region on the reticle, but more detailed study of errors on this reticle showed that it does contain some additional smaller systematic and/or pattern-dependent errors in addition to random errors. Fig. 7a clearly shows strong spatial signatures in the error distribution that, at least in part, are correlated to the data-file cell layout of the reticle. Fig. 8 provides an overlay of this cell layout on the error distribution of Fig. 7a to illustrate this correlation. There is an obvious trend illustrated in this figure toward larger errors in the vicinity of the data-file boundaries, although some boundaries do not exhibit this behavior. Furthermore there are other horizontal- and vertical-oriented regions in the data where the errors are larger than elsewhere on the reticle. For example there is a larger x-directed set of data points about 1/3 of the way from the bottom of the error distribution. While the axis-oriented error components shown in Fig. 7a have an x- and y-range of only -2.5 to 4.5 nm and -3.6 to 3.8 nm respectively, there are two conclusions that can be drawn from the data. First, this provides the first clear evidence of data-file-boundary-correlated error components and thus the first strong evidence of pattern-sensitive registration errors on the reticle. Second, there are some non-random registration error mechanisms on the reticle, possibly but not necessarily pattern dependent, that result in spatially-correlated error distributions with x- and y-orientation and with locations on the reticle that are not correlated to the data-file boundaries.
Proc. of SPIE Vol. 7488 74881I-5
Downloaded from SPIE Digital Library on 18 Nov 2009 to 192.146.1.254. Terms of Use: http://spiedl.org/terms

Figure 6 – Residual errors after removal of slowly occurring spatial errors
(a) Axis-oriented (b) Other
Fig. 7. Fourier Filtering of the Residual Errors from fig.6 (for details refer to text)
Measurement of a data set on a fixed grid will not be sensitive to systematic errors with periodicities that are a sub-multiple of the grid spacing. To make sure that the 0.25 cm spacing array is not blind to some significant errors with such periodicities we also measured a 51 by 51 array of points with grid spacing of 0.14 cm. Using adaptive metrology guidelines the array was located near the center of the reticle. After correction for translation, rotation and isotropic scale the total 3σ registration error values for this array were 10.3 nm and 10.4 nm in the x- and y-directions respectively. The smaller 3σ values determined from this array means that a large fraction of the slowly varying registration errors found in the larger array must be disproportionately located near the edges of the reticle in the regions not measured in the 0.14 cm grid pitch array. The axis-oriented error distribution from this array after seventh order regression analysis and subtraction of the slowly varying errors at each point (as was done with the 0.25 cm grid pitch array) followed by Fourier filtering is shown in Fig. 9b. A comparison of the two arrays (Fig. 7a and Fig. 9b) side-by-side is in Fig. 9. This figure shows the actual location of the 0.14 cm array relative to the 0.25 cm array and shows that the axis-oriented error distributions in the region where they overlap are generally consistent, both clearly showing the previously described spatial error correlations.
Proc. of SPIE Vol. 7488 74881I-6
Downloaded from SPIE Digital Library on 18 Nov 2009 to 192.146.1.254. Terms of Use: http://spiedl.org/terms
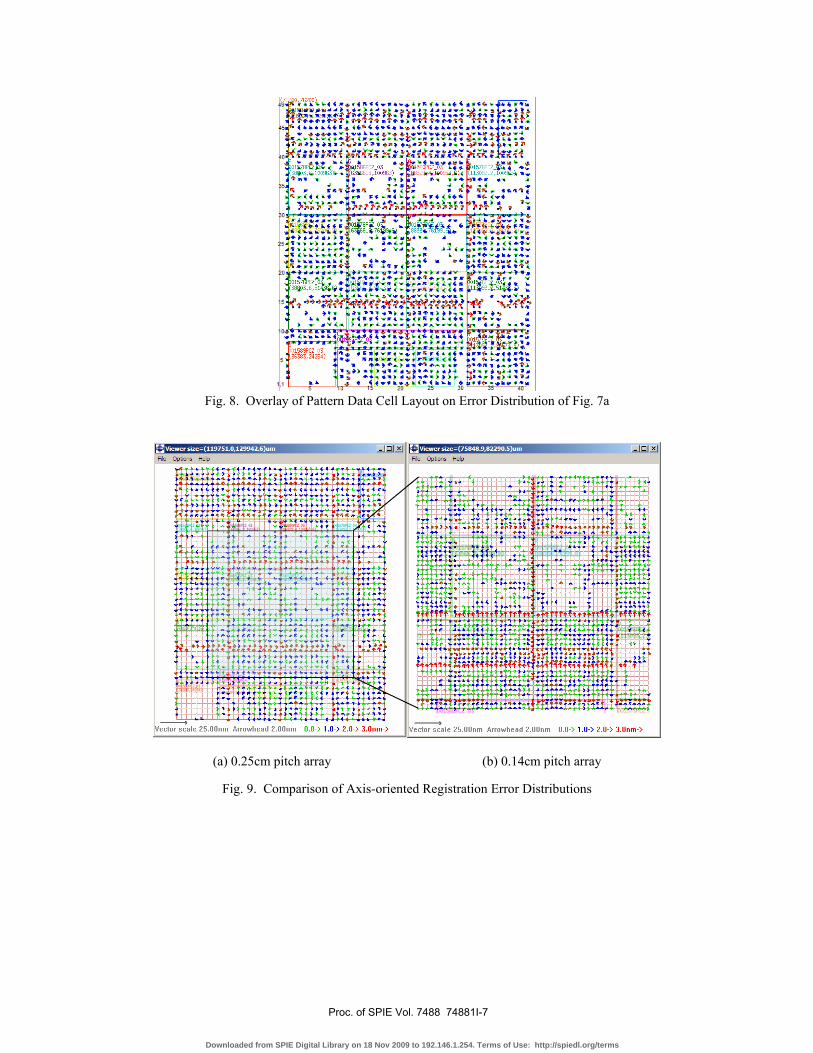
Fig. 8. Overlay of Pattern Data Cell Layout on Error Distribution of Fig. 7a
(a) 0.25cm pitch array (b) 0.14cm pitch array
Fig. 9. Comparison of Axis-oriented Registration Error Distributions
Proc. of SPIE Vol. 7488 74881I-7
Downloaded from SPIE Digital Library on 18 Nov 2009 to 192.146.1.254. Terms of Use: http://spiedl.org/terms

SAMPLING IMPACT to final quality check
There are two risks of misqualification errors that can occur as part of a quality control check. These two types of errors are called Alpha and Beta errors. An Alpha error (or Type 1 error) is the probability that an “in-control” mask will be rejected and a Beta error (type II error) is the probability that an “out-of-control” reticle will be shipped to the wafer manufacturer.
Figure 10 represents the relationship between 3 sigma results and sample size. In an effort to illustrate the relationship between 3 sigma measurement values and sample size the extended measurement job was used to simulate various sampling sizes. Sub-samples of measurement sites with a given number of measurement targets were selected randomly from the extended measurement job by statistic software. Then the mask performance was calculated based on the reduced sampling size and the results shown in fig.10. The boxes in the plot represent 50% of the sample population values, the bar extension represent the 3 sigma value and the dots can be interpreted as outliers. The line in the middle of each box is the median value of the sample population. The chart demonstrates the stability of 3 sigma values in relationship to the sample population size. By increasing the sampling size the risk of alpha or beta errors is reduced due to the 3 sigma value of the population becoming smaller. Let us assume first that the reticle was manufactured to meet a 9.5nm registration spec (green dotted line in Fig.10). There is a fairly high chance that this reticle would be accepted and shipped to the wafer fab if the metrology sampling is below 400. Depending on the selected measurement points the chance to achieve a measurement result at or below 9.5nm is relative high and increasing with decreasing sample size. If, on the other hand, the reticle would be manufactured to meet 11nm registration spec (red dotted line in Fig.10), then, using a small sampling size below 400, there is a risk that the mask would be rejected just because the sampling of the registration metrology targets would lead to a metrology result exceeding the reticle spec.
Increased measurement effort
Smaller alpha & beta yield risk
Product measurement example
Figure 10. Yield risk dependent on registration sampling size, the dotted lines show assumed product specifications of
9.5nm (green) and 11nm (red), respectively.
SUMMARY The evaluation of the registration performance of one poly layer reticle shows that the reticle quality is dependent on the metrology sampling strategy. Measuring only few points, the results will be strongly influenced by the choice of measurement point locations relative to the spatial distribution of any systematic errors across the reticle. It was
Assumed product specification: 11nm
Assumed product specification: 9.5nm
Proc. of SPIE Vol. 7488 74881I-8
Downloaded from SPIE Digital Library on 18 Nov 2009 to 192.146.1.254. Terms of Use: http://spiedl.org/terms

demonstrated that Alpha and Beta risk of final mask quality control are increasing significantly with lower sampling sizes below 500 measurement targets. The magnitude of registration errors on a reticle resulting from the combination of different error mechanisms impacting it during fabrication is likely to vary not only from mask shop to mask shop, but also from reticle to reticle within a given mask shop. For example the error contributors from pattern generators are expected to vary from machine to machine, and they will also vary with time and with the way in which the tools are set up and used for mask making. Furthermore any pattern-specific errors sources will affect different reticle patterns in different ways. Error mechanisms associated with mask making are at this point an open issue. The scope of mechanisms and their magnitude range is difficult to generalize with one mask sample. A redeeming value of this study clearly demonstrates the uncovering of new error mechanisms through the application of adaptive metrology. Since the fundamental error mechanisms associated with mask making are expected to have a great deal of commonality from mask shop to mask shop and from reticle to reticle even though their magnitudes will vary, the data from the single reticle measured in this study is valuable in exposing fundamental registration error mechanisms and their characteristics even though the magnitudes of the errors are not expected to be representative. Since the contribution of these different registration error mechanisms will vary from mask to mask, it is important that any sampling plan intended to quantify registration errors take into account the characteristics of the different error mechanisms that might exist. It is assumed that a major objective of reticle acceptance testing for registration is to obtain a reliable and indicative measurement of the registration error that is likely to exist on any feature within a given reticle. Then the degree of accuracy (or confidence level in the results) is dependent first on the total number of points measured on the plate according to the chosen sampling plan, second on the strategy used in the choice of measurement points in the sampling plan and the effectiveness of the matching of these measurement points to the actual registration error sources on the reticle, and third on the effectiveness of the data analysis scheme used to interpret the data. There is a qualitative tradeoff that can be made by the mask user between the number and location of points measured to determine registration error characteristics on a reticle and the confidence level or degree of uncertainty acceptable for the results. Such a tradeoff is best made given a full understanding of the characteristics of all potential registration error contributors. However many users depend on registration error measurement strategies and data analysis/interpretation schemes that are not closely tied to the real registration error sources or their spatial characteristics. The measurements made on the reticle studied here show first evidence of systematic e-beam related placement errors at stripe boundaries and indicate pattern-sensitive error contributors. It also indicates that the use of Gaussian statistics and 3 sigma values may not be an adequate means of predicting the true magnitude of errors on the mask. In future work this reticle will be investigated more thoroughly following adaptive metrology rules and including data file boundaries. The target of the future evaluation should be to detect potential additional registration error sources which cannot be derived from the actual data sets but would need more complex data analysis. Fourier analysis on dense subarrays might help to discover higher spatial frequency registration errors. However, the first results presented here point out that representative registration measurements must be made on features within the pattern, not just on isolated features designed for registration measurement acceptance tests.
References
[1] Weidung Wang: “Adaptive Metrology and Mask Inspection,” Stanford Solid State Electronics Laboratory, Semiconductor Research Corporation Contract No. MC-515, December 1997.
[2] Roeth, K.-D., Antesberger, G., Enkrich, C., Laske, F., Adam, D., “Registration Metrology for 45nm Node Reticles”, SEMI Technology Seminar 2007, Makuhari, Japan.
[3] Enkrich, C., Antesberger, G., Loeffler, O., Roeth, K.-D., Laske, F., Adam, D., “Registration Measurement Capability of VISTEC LMS IPRO4 with Focus on Small Features”, Photomask Japan 2008, Yokohama, Japan.
[4] Schultz, B., Seltmann R., Busch, J., Hempel, F., Cotte, E., Alles, B., “Meeting Overlay Requirements for Future Technology Nodes With in-die Overlay Measurements”, Advanced Lithgraphy 2007, Santa Clara, CA
[5] Cotte, E., Alles B., Wandel T., Antesberger, G., Teuber, S., Vorwerk, M., Frangen, A., Katzwinkel, F., “193-nm Immersion Photomask Image Placement in Exposure Tools”, Optical Microlithography XIX 2006, Vol. 6154
[6] G.Hughes: Mask Metrology – Current and Future Challenges, http://www.eeel.nist.gov/812/conference/2009_presentations/Hughes.pdf, 2009
Proc. of SPIE Vol. 7488 74881I-9
Downloaded from SPIE Digital Library on 18 Nov 2009 to 192.146.1.254. Terms of Use: http://spiedl.org/terms