76381g
DESCRIPTION
ÂTRANSCRIPT

Use of multiple azimuthal angles to enable advanced scatterometry applications
Matthew Sendelbach †a, Alok Vaid b, Pedro Herrera c, Ted Dziura c, Michelle Zhang c,
Arun Srivatsa c a IBM Corporation, 2070 Route 52, Hopewell Junction, NY 12533, USA
b GLOBALFOUNDRIES, Inc., 2070 Route 52, Hopewell Junction, NY 12533, USA c KLA-Tencor, 160 Rio Robles, San Jose, CA 95134, USA
The ability to extract critical parameters using scatterometry depends on the parameter sensitivity and correlation at different wavelengths. These, in turn, determine the key metrics: accuracy, precision, and tool-to-tool matching. Parameter sensitivity and correlation can vary drastically, depending on whether the oblique incident light beam is parallel (azimuth angle = 90 degrees), perpendicular (azimuth angle = 0 degrees), or at an intermediate angle to the measured structures. In this paper, we explore the use of both variable- and multiple-azimuth (AZ) (or multi-AZ) angle spectroscopic ellipsometry (SE) to optimize the measurement performance for different applications. The first example compares the sensitivity and results using SE at 0 and 90 degree AZ angles for a BEOL post-litho metal trench application. We observe up to a sixfold improvement in key metrics for critical parameters using 90 degree over 0 degree AZ angle spectra. The second example illustrates the benefits of a multiple-AZ angle approach to extract critical parameters for a two-dimensional logic High-K Metal Gate (HKMG) structure. Typically, this approach simultaneously fits two sets of SE spectra collected from the same location on the wafer at different AZ angles with the same physical model. This helps both validate and decorrelate critical parameters, enabling robust measurements. Results show that, for this application, the measurement performance metrics for each critical parameter are improved in almost every case. Keywords: scatterometry, TMU, metal trench, HKMG, variable, multiple, azimuth, angle
1. INTRODUCTION As modern semiconductor structures become increasingly complex in order to maintain Moore’s Law, they become increasingly more challenging to measure. Not only are entirely new types of metrology needed to meet these challenges, but existing metrologies must improve to keep pace. Now considered an established metrology, scatterometry is one such metrology that has consistently improved since its introduction. An inherent weakness of scatterometry is that it is susceptible to correlation between critical measurement parameters and reduced sensitivity to their measurement.1 Either of these traits can make it difficult or impossible to measure such critical parameters for complex applications. Fortunately, however, scatterometry suppliers and their customers have developed and refined additional capabilities that have allowed scatterometry to meet the challenges of additional structural complexity while keeping the problems of reduced parameter sensitivity and increased parameter correlation at bay. Common methods that scatterometers have used for many years to extract more useful information from the structure of interest—thereby breaking these correlations and increasing sensitivity to critical parameters—include the use of broadband light (often down to wavelengths in the extreme UV portion of the spectrum2) and polarization. Other, less commonly used methods include the use of non-zeroth order reflected light and variable angles of incidence (AOI). This paper, however, describes the use of yet two more methods for breaking correlations and increasing sensitivity: variable- and multi-azimuth (AZ) angle incident light. In variable-AZ angle scatterometry, the incident light (which †[email protected]
Metrology, Inspection, and Process Control for Microlithography XXIV, edited by Christopher J. Raymond, Proc. of SPIE Vol. 7638, 76381G · © 2010 SPIE · CCC code: 0277-786X/10/$18 · doi: 10.1117/12.846692
Proc. of SPIE Vol. 7638 76381G-1
Downloaded from SPIE Digital Library on 01 Apr 2010 to 192.146.1.254. Terms of Use: http://spiedl.org/terms

strikes the structure at an oblique angle of incidence) is no longer restricted to a single azimuth angle relative to the structure. Instead, the azimuth angle of the incident light can vary, and the one that provides the best overall measurement is chosen over the other angles. For many structures, this flexibility significantly increases parameter sensitivity and reduces parameter correlation. Figure 1 illustrates the use of variable-AZ angle scatterometry. The plots in this figure demonstrate how different AZ angles can be associated with strong sensitivities in different spectral regimes. In multiple-AZ angle scatterometry, spectra from two or more different AZ angles are collected sequentially from the same structure and analyzed simultaneously. The same physical model of the structure is used to analyze both spectra; a single set of results is the output. This approach can be very powerful, as it significantly increases the amount of information collected from the sample. For some structures, this is enough to make significant gains in sensitivity and correlation, thereby producing a better measurement. In this work, a state-of-the-art spectroscopic ellipsometer (SE) with deep-UV capability down to 150nm was used to measure the wafers.
2. STRUCTURES 2.1 BEOL M2 post-litho Two structures were used to demonstrate the advantages of off-azimuth angle scatterometry. The first structure—a 32nm node Back End of Line Metal 2 (BEOL M2) grating of nested lines measured after lithography—was measured at two different AZ angles in order to show the advantage, at least for this application, of a non-standard AZ angle measurement. The first AZ angle is 0 degrees (the standard angle, and perpendicular to the grating lines), while the second AZ angle is 90 degrees (the non-standard angle, and parallel to the grating lines). Because the different AZ angle spectra were not combined for this analysis, this method is called the variable-AZ angle approach. A schematic of the structure and model is shown in figure 2. Here, SiNCH, ULK, HM and OPL stand for nitrogen doped SiC, ultra low k, hard mask, and optical planarization layer, respectively.3 The critical parameters for this application are the bottom critical dimension (BCD) of the resist, middle CD (MCD) of the resist, sidewall angle (SWA) of the resist, and height of the resist. For this work two wafers were measured, one exposed with a focus-exposure matrix (FEM), the other exposed with constant and standard (POR) lithography conditions. 2.2 High-K Metal Gate post-etch The second structure—a 32nm node High-K Metal Gate (HKMG) grating of nested lines—was measured after the etching and cleaning processes.
AZ angle = 90° (parallel to grating)
AZ angle = 0° (perpendicular to grating)
0°sensitivity
90°sensitivity
AZ angle = 90° (parallel to grating)
AZ angle = 0° (perpendicular to grating)
0°sensitivity
90°sensitivity
Figure 1: Schematic showing the difference between azimuth (AZ) angles of 0 and 90 degrees. The spectral plots are not from wafers in this study; however, they demonstrate how spectral sensitivity as a function of wavelength can vary from one AZ angle to another.
Figure 2: The BEOL Metal 2 post-litho structure used to test the variable-AZ technique. SiNCH, ULK, HM and OPL stand for nitrogen doped SiC, ultra low k, hard mask, and optical planarization layer, respectively. The critical parameters are the BCD, MCD, SWA, and height of the photoresist.
PR
OPL
HM
ULK
M1 Cu substrate
BARCOxide
SiNCH
PR
OPL
HM
ULK
M1 Cu substrate
BARCOxide
SiNCH
PR
OPL
HM
ULK
M1 Cu substrate
BARCOxide
SiNCH
Proc. of SPIE Vol. 7638 76381G-2
Downloaded from SPIE Digital Library on 01 Apr 2010 to 192.146.1.254. Terms of Use: http://spiedl.org/terms

Again, spectra were collected at both 0 degrees and 90 degrees. In this case, however, both spectra were combined during analysis in order to demonstrate that the multiple-AZ angle approach is better, at least for this application, than the standard 0 degree AZ angle approach. Figure 3 illustrates a schematic of the structure and model. For this application the critical parameters are the metal layer footing (or undercut), the metal layer BCD, the silicon SWA, and the silicon BCD. Note that for the metal foot/undercut parameter, at most only one of these can be observed at any given site, since the foot occurs when the metal protrudes slightly from the silicon, while the undercut occurs when the metal is recessed relative to the silicon. In this experiment, several wafers subjected to a range of lithography and etch conditions were measured. These varied process conditions pushed the critical parameter values substantially beyond their normal limits in order to demonstrate measurement success across a wide range of conditions.
3. RESULTS Metrics that can be used to assess the success of variable- and multiple-AZ angle scatterometry are identified and evaluated here. They can be grouped into two categories: modeling software metrics and standard metrology metrics. 3.1 Modeling software metrics Scatterometry modeling software typically utilizes various metrics that assist the user in optimizing the model. Such metrics are internally generated in the software and therefore are not transferable from one supplier’s software to another’s. This is because, even for a metric with the same name and meaning between two suppliers’ software, the details of how the metric is calculated vary between the suppliers. Thus, although these metrics have limited ability to properly compare models between suppliers, they are still useful in comparing different models of the same structure for a given supplier. One exception to this is the Normalized Goodness-of-Fit
(NGOF), which is only used to make sure that a given model generates spectra that fit reasonably well to measured spectra. The first three modeling metrics do not depend on measurement spectra from the structure of interest. Instead, they depend on only the geometry of the model, the material optical constants that have been input into the model, and the algorithms specific to that software. The first of these, modeling precision, is an estimate of the measured precision that could be expected from this structure. Figure 4 shows the modeling precision for the critical parameters of the M2 application as a function of AZ angle, relative to an AZ angle of 0
Figure 3: The High-K Metal Gate (HKMG) post-etch structure used to test the multi-AZ angle technique. The critical parameters are the BCD and SWA of the silicon, the BCD of the metal, and the metal foot/ undercut. Note that the unphysical scenario of a foot on one side of the gate and an undercut on the other is for demonstration purposes only. The SOI, BOX, and Si substrate layers are unpatterned.
Si substrate
BOX
SOIhigh-Kdielectric
metalsilicon
dielectricstack
metalundercut
metalfoot
Si substrate
BOX
SOIhigh-Kdielectric
metalsilicon
dielectricstack
metalundercut
metalfoot
Figure 4: Relative modeling precision for the M2 application as a function of AZ angle. All critical parameters show improved precision at 90 degrees relative to the standard 0 degrees.
M2 Post-Litho -- Relative Modeling Precision
0%
20%
40%
60%
80%
100%
120%
0 10 20 30 40 50 60 70 80 90
AZ angle
prec
isio
n re
lativ
e to
0
deg
AZ
BCDMCDSWAHT
Proc. of SPIE Vol. 7638 76381G-3
Downloaded from SPIE Digital Library on 01 Apr 2010 to 192.146.1.254. Terms of Use: http://spiedl.org/terms

degrees. Note the lower precision for each parameter at 90 degrees compared to 0 degrees. Figure 5 shows the modeling precisions for the HKMG critical parameters for the 0 degree AZ angle approach and the multi-AZ angle approach, the latter being a combination of both 0 and 90 degrees AZ angle. The multi-AZ angle approach has significantly better precisions than the 0 AZ angle approach—as much as a 5x improvement. The next metric, modeling sensitivity1,2, reveals how sensitive calculated spectra are to theoretical changes in the critical parameters. A given incremental change in one parameter that produces significant spectral
changes means that the sensitivity for this parameter is good compared to another parameter that produces subtle spectral changes for the same incremental change. The higher the sensitivity value, the easier it is to detect changes in that parameter, making that parameter easier to measure. Another software metric is modeling correlation.1 A high correlation between two parameters means that a given spectral change could be almost equally attributable to a change in either parameter. Thus, it is difficult to distinguish between the two parameters, thereby making it difficult to measure both simultaneously. A unity correlation means that the two parameters cannot be decoupled using that model. Since each floating parameter has a correlation value to every other floating parameter, only the highest correlation for a given parameter is generally the most relevant—and only this type of correlation is provided in this paper. Figure 6 displays the modeling sensitivity as a function of AZ angle for the M2 application. Here, only the critical parameters that are also basis parameters (parameters that are not derived from other parameters in the model) are shown, since the sensitivity of non-basis parameters are essentially derived from those of basis parameters. The modeling correlation as a function of AZ
HKMG Post-Etch -- Modeling Precision
0.00
0.05
0.10
0.15
0.20
0.25
Si BCD Si SWA metal BCD metalfoot/undercut
parameter
prec
isio
n (3
sigm
a, n
m o
r deg
)
0 deg AZmulti-AZ
Figure 5: Absolute modeling precision for the HKMG application for each critical parameter. All critical parameters show improved precision using multi-AZ relative to the standard 0 degrees.
Figure 6: Relative modeling sensitivity for the M2 application as a function of AZ angle. Only the critical parameters which are also basis parameters are shown. The BCD and SWA show slightly improved sensitivities with the 90 degree AZ angle, while the height sensitivity degrades with increasing AZ angle.
M2 Post-Litho -- Relative Modeling Sensitivity
0%
20%
40%
60%
80%
100%
120%
0 10 20 30 40 50 60 70 80 90
AZ angle
sens
itivi
ty re
lativ
e to
0
deg
AZ
BCDSWAHT
Proc. of SPIE Vol. 7638 76381G-4
Downloaded from SPIE Digital Library on 01 Apr 2010 to 192.146.1.254. Terms of Use: http://spiedl.org/terms

angle for the M2 application is pictured in figure 7. Again, only critical parameters that are also basis parameters are shown. As seen in these figures, the BCD and SWA of the resist have better sensitivities and correlations at 90 degrees, while the height of the resist trends in the opposite direction for sensitivity, but noticeably improves for correla-tion. The fact that there is a trade-off (worse sensitivity for height) with using the 90 degree AZ angle should not come as a surprise. It is expected that some results will improve and some will degrade when changing the AZ angle. The key is to find the AZ angle that provides the most advantages and the fewest disadvantages. A close inspect-tion of the M2 modeling results (figures 4, 6, and 7) reveals that an AZ angle of about 70 degrees would provide slightly better results than 90 degrees. This alternate angle was not pursued because spectra were collected only at 0 and 90 degrees while the wafers were available. For the HKMG application, only one of the critical parameters, the metal foot/undercut, is also a basis parameter, so the sensitivity and correlation for this parameter are shown together in figure 8. From this figure, it can be seen that both of these metrics improve noticeably for this parameter. Finally, the NGOF values for both models of each application are comparable, so reasonable spectral fitting is occurring. This “sanity check” is displayed in figure 9. 3.2 Standard metrology metrics The other metrics that are used to determine the success of a model are categorized as “standard metrology metrics.” These metrics cover the ubiquitous metrology concepts of precision, tool matching, and accuracy.
Figure 7: Relative modeling correlation for the M2 application as a function of AZ angle. Only the critical parameters which are also basis parameters are shown. The BCD and SWA show slightly improved correlations with the 90 degree AZ angle, while the height shows a more significant improvement in correlation.
M2 Post-Litho -- Relative Modeling Correlation
92%
93%
94%
95%
96%
97%
98%
99%
100%
101%
0 10 20 30 40 50 60 70 80 90
AZ angle
corr
elat
ion
rela
tive
to
0 de
g A
Z
BCDSWAHT
Figure 8: Absolute modeling sensitivity and correlation for the HKMG application. Only the critical parameters which are also basis parameters are shown; for this application, only the metal foot/undercut meets this criterion. Sensitivity and correlation are both improved for this parameter with the use of the multi-AZ angle method.
HKMG Post-Etch -- Modeling Sensitivity and Correlation for Metal Foot/Undercut
0.0
0.1
0.2
0.3
0.4
0.5
0.6
0.7
0.8
0.9
sensitivity correlation
metric
sens
itivi
ty o
r cor
rela
tion
0 deg AZmulti-AZ
Proc. of SPIE Vol. 7638 76381G-5
Downloaded from SPIE Digital Library on 01 Apr 2010 to 192.146.1.254. Terms of Use: http://spiedl.org/terms

3.2.1 Precision The three most common precision metrics—the names often vary, but the concepts remain the same—are static precision, short term dynamic repeatability (STDR), and long term dynamic repeatability (LTDR). A static precision test consists of repeated measurements of the same structure without changing the relative positions of the wafer and optical beam. In this paper, a representative sample of several chips across the wafer set for each application was chosen. Two different tools were evaluated, and 15 repeats per chip were collected. The results are displayed in figures 10 and 11. Although for the M2 application, the MCD static precision worsened slightly with the use of the non-standard 90 degree AZ angle, the other parameters greatly improved. Static precision is uniformly improved for the HKMG application—improvements range from about a 2x improvement for the metal BCD to an almost 16x improvement for the silicon BCD. STDR measurements consist of repeated data collections of the same samples over a relatively short period of time, with a wafer unload step between each measurement for a given chip. Ten repeats for each chip were completed, and the measurements spanned two different tools for each of the applications. Figure 12 contains the STDR data for both M2 models, while figure 13 contains the HKMG data. Both applications see across-the-board improvements. LTDR measurements are similar to STDR measurements except they are collected over a longer period of time—in this case five days for each application. The number of repeats per chip is 15 for M2 (three per day for five days) and five for HKMG (one per day). Data were collected across two different tools for each application. Figures 14 and 15
Figure 9: Normalized Goodness-of-Fit (NGOF) for M2 (left) and HKMG (right) for each model. The means and standard deviations are all acceptable, indicating that all models pass basic quality checks.
M2 Post-Litho -- NGOF
0.988
0.989
0.990
0.991
0.992
0.993
0 deg AZ 90 deg AZ
NG
OF mean + 3sigma
meanmean - 3sigma
HKMG Post-Etch -- NGOF
0.9750.9780.9810.9840.9870.9900.9930.9960.9991.002
0 deg AZ multi-AZ
NG
OF mean + 3sigma
meanmean - 3sigma
M2 Post-Litho -- NGOF
0.988
0.989
0.990
0.991
0.992
0.993
0 deg AZ 90 deg AZ
NG
OF mean + 3sigma
meanmean - 3sigma
HKMG Post-Etch -- NGOF
0.9750.9780.9810.9840.9870.9900.9930.9960.9991.002
0 deg AZ multi-AZ
NG
OF mean + 3sigma
meanmean - 3sigma
Figure 10: M2 relative static precision for the critical parameters. The 90 degree AZ angle model provides a lower static precision for three out of four parameters.
M2 Post-Litho -- Relative Static Precision
0%
20%
40%
60%
80%
100%
120%
BCD MCD SWA height
parameter
stat
ic p
reci
sion
rela
tive
to
0 de
g A
Z
0 deg AZ90 deg AZ
Figure 11: HKMG relative static precision for the critical parameters. The multi-AZ angle model provides a significantly better static precision.
HKMG Post-Etch -- Relative Static Precision
0%
20%
40%
60%
80%
100%
120%
Si BCD Si SWA metal BCD metalfoot/undercut
parameter
stat
ic p
reci
sion
rela
tive
to
0 de
g A
Z
0 deg AZmulti-AZ
Proc. of SPIE Vol. 7638 76381G-6
Downloaded from SPIE Digital Library on 01 Apr 2010 to 192.146.1.254. Terms of Use: http://spiedl.org/terms

Figure 12: M2 relative STDR for the critical parameters. The 90 degree AZ angle model provides a significantly better STDR.
M2 Post-Litho -- Relative STDR (Short Term Dynamic Repeatability)
0%
20%
40%
60%
80%
100%
120%
BCD MCD SWA height
parameter
STD
R re
lativ
e to
0
deg
AZ
0 deg AZ90 deg AZ
Figure 13: HKMG relative STDR for the critical parameters. The multi-AZ angle model provides a significantly better STDR.
HKMG Post-Etch -- Relative STDR (Short Term Dynamic Repeatability)
0%
20%
40%
60%
80%
100%
120%
Si BCD Si SWA metal BCD metalfoot/undercut
parameter
STD
R re
lativ
e to
0
deg
AZ
0 deg AZmulti-AZ
Figure 14: M2 relative LTDR for the critical parameters. The 90 degree AZ angle model provides a better LTDR for the BCD and height parameters.
M2 Post-Litho -- Relative LTDR (Long Term Dynamic Repeatability)
0%
20%
40%
60%
80%
100%
120%
140%
160%
180%
200%
BCD MCD SWA height
parameter
LTD
R re
lativ
e to
0
deg
AZ
0 deg AZ90 deg AZ
Figure 15: HKMG relative LTDR for the critical parameters. The multi-AZ angle model provides a better LTDR for the metal BCD and metal foot/undercut parameters.
HKMG Post-Etch -- Relative LTDR (Long Term Dynamic Repeatability)
0%
20%
40%
60%
80%
100%
120%
Si BCD Si SWA metal BCD metalfoot/undercut
parameter
LTD
R re
lativ
e to
0
deg
AZ
0 deg AZmulti-AZ
Figure 16: M2 relative FMP for the critical parameters. The 90 degree AZ angle model provides a better FMP for three out of the four critical parameters.
M2 Post-Litho -- Relative FMP (Tool Matching)
0%
20%
40%
60%
80%
100%
120%
BCD MCD SWA height
parameter
FMP
rela
tive
to 0
deg
AZ
0 deg AZ90 deg AZ
Figure 17: HKMG relative FMP for the critical parameters. The multi-AZ angle model provides a significantly better FMP.
HKMG Post-Etch -- Relative FMP (Tool Matching)
0%
20%
40%
60%
80%
100%
120%
Si BCD Si SWA metal BCD metalfoot/undercut
parameter
FMP
rela
tive
to 0
deg
AZ
0 deg AZmulti-AZ
Proc. of SPIE Vol. 7638 76381G-7
Downloaded from SPIE Digital Library on 01 Apr 2010 to 192.146.1.254. Terms of Use: http://spiedl.org/terms

summarize the LTDR data. The 90 degree AZ angle method for the M2 application certainly does not offer an advantage over the 0 degree AZ angle method when it comes to LTDR; however, as previously mentioned, one may have to accept degraded performance in some areas when changing the AZ angle. The situation for HKMG is somewhat better, with two parameters essentially unchanged and two parameters noticeably improved with the use of the multi-AZ angle method. 3.2.2 Tool matching For a tool matching metric the authors choose the Fleet Measurement Precision (FMP) methodology described by Solecky et. al.4. Data collected for the FMP study are significant because this metric contains components of not only tool-to-tool matching, but also short- and long-term precision (STDR and LTDR). The LTDR data in figures 14 and 15 were derived from the FMP data set, so the FMP sampling is the same as that of the LTDR sampling described above. FMP values for the M2 application are displayed in figure 16. Although the FMP for MCD is essentially unchanged, the FMP for BCD and SWA are about 2x better with the 90 degree AZ angle, and almost 5x better for the height parameter. The HKMG FMP results are provided in figure 17. All critical parameters show improvement, with reductions in FMP from about 25% to about 50%. 3.2.3 Accuracy The last standard metrology metric is accuracy. Although an absolute accuracy determination is important in some evaluations, a relative accuracy determination is sufficient here. For this, the authors choose Total Measurement Uncertainty (TMU) analysis. The main metric of this analysis is TMU, which is a quantitative estimate of the measurement error associated with a Tool under Test (TuT) when compared to a Reference Measurement System (RMS). Here, the TuT is the scatterometer (using either model) and the RMS is either the critical dimension scanning electron microscope (CDSEM) or the transmission electron microscope (TEM). For more information on TMU analysis, the authors recommend several papers.1,5,6,7 In this paper, TMU values are compared to those obtained using the 0 degree AZ angle method.
Figure 18: M2 CD correlation vs. CDSEM. The AZ models provide equivalent CD accuracy.
M2 Post-Litho -- CD Correlationvs CDSEM with 90 deg AZ
24
34
44
54
40 50 60 70 80
Scatterometry CD (10 nm increments)
CD
SEM
(10
nm
incr
emen
ts)
TMU relative to 0 deg AZ: 102%slope R^2 data pairs1.04 0.9927 26
M2 Post-Litho -- CD Correlationvs CDSEM with 90 deg AZ
24
34
44
54
40 50 60 70 80
Scatterometry CD (10 nm increments)
CD
SEM
(10
nm
incr
emen
ts)
TMU relative to 0 deg AZ: 102%slope R^2 data pairs1.04 0.9927 26
M2 Post-Litho -- CD Correlationvs CDSEM with 0 deg AZ
24
34
44
54
40 50 60 70 80
Scatterometry CD (10 nm increments)C
DSE
M (1
0 nm
in
crem
ents
)TMU relative to 0 deg AZ: 100%
slope R^2 data pairs1.05 0.9930 26
M2 Post-Litho -- CD Correlationvs CDSEM with 0 deg AZ
24
34
44
54
40 50 60 70 80
Scatterometry CD (10 nm increments)C
DSE
M (1
0 nm
in
crem
ents
)TMU relative to 0 deg AZ: 100%
slope R^2 data pairs1.05 0.9930 26
M2 Post-Litho -- CD Correlationvs CDSEM with 90 deg AZ
24
34
44
54
40 50 60 70 80
Scatterometry CD (10 nm increments)
CD
SEM
(10
nm
incr
emen
ts)
TMU relative to 0 deg AZ: 102%slope R^2 data pairs1.04 0.9927 26
M2 Post-Litho -- CD Correlationvs CDSEM with 90 deg AZ
24
34
44
54
40 50 60 70 80
Scatterometry CD (10 nm increments)
CD
SEM
(10
nm
incr
emen
ts)
TMU relative to 0 deg AZ: 102%slope R^2 data pairs1.04 0.9927 26
M2 Post-Litho -- CD Correlationvs CDSEM with 0 deg AZ
24
34
44
54
40 50 60 70 80
Scatterometry CD (10 nm increments)C
DSE
M (1
0 nm
in
crem
ents
)TMU relative to 0 deg AZ: 100%
slope R^2 data pairs1.05 0.9930 26
M2 Post-Litho -- CD Correlationvs CDSEM with 0 deg AZ
24
34
44
54
40 50 60 70 80
Scatterometry CD (10 nm increments)C
DSE
M (1
0 nm
in
crem
ents
)TMU relative to 0 deg AZ: 100%
slope R^2 data pairs1.05 0.9930 26
Figure 19: HKMG CD correlation vs. CDSEM. The multi-AZ model performs 35% better in TMU than the 0 degree AZ model.
HKMG Post-Etch -- CD Correlation vs CDSEM with
Multi-AZ
32
37
42
47
52
57
20 25 30 35 40 45 50Scatterometry (5 nm increments)
CD
SEM
(5 n
m
incr
emen
ts)
TMU relative to 0 deg AZ: 65%slope R^2 data pairs0.91 0.984 351
HKMG Post-Etch -- CD Correlation vs CDSEM with
Multi-AZ
32
37
42
47
52
57
20 25 30 35 40 45 50Scatterometry (5 nm increments)
CD
SEM
(5 n
m
incr
emen
ts)
TMU relative to 0 deg AZ: 65%slope R^2 data pairs0.91 0.984 351
HKMG Post-Etch -- CD Correlation vs CDSEM with
0 deg AZ
32
37
42
47
52
57
20 25 30 35 40 45 50Scatterometry (5 nm increments)
CD
SEM
(5 n
m
incr
emen
ts)
TMU relative to 0 deg AZ: 100%slope R^2 data pairs0.88 0.966 351
HKMG Post-Etch -- CD Correlation vs CDSEM with
0 deg AZ
32
37
42
47
52
57
20 25 30 35 40 45 50Scatterometry (5 nm increments)
CD
SEM
(5 n
m
incr
emen
ts)
TMU relative to 0 deg AZ: 100%slope R^2 data pairs0.88 0.966 351
HKMG Post-Etch -- CD Correlation vs CDSEM with
Multi-AZ
32
37
42
47
52
57
20 25 30 35 40 45 50Scatterometry (5 nm increments)
CD
SEM
(5 n
m
incr
emen
ts)
TMU relative to 0 deg AZ: 65%slope R^2 data pairs0.91 0.984 351
HKMG Post-Etch -- CD Correlation vs CDSEM with
Multi-AZ
32
37
42
47
52
57
20 25 30 35 40 45 50Scatterometry (5 nm increments)
CD
SEM
(5 n
m
incr
emen
ts)
TMU relative to 0 deg AZ: 65%slope R^2 data pairs0.91 0.984 351
HKMG Post-Etch -- CD Correlation vs CDSEM with
0 deg AZ
32
37
42
47
52
57
20 25 30 35 40 45 50Scatterometry (5 nm increments)
CD
SEM
(5 n
m
incr
emen
ts)
TMU relative to 0 deg AZ: 100%slope R^2 data pairs0.88 0.966 351
HKMG Post-Etch -- CD Correlation vs CDSEM with
0 deg AZ
32
37
42
47
52
57
20 25 30 35 40 45 50Scatterometry (5 nm increments)
CD
SEM
(5 n
m
incr
emen
ts)
TMU relative to 0 deg AZ: 100%slope R^2 data pairs0.88 0.966 351
Proc. of SPIE Vol. 7638 76381G-8
Downloaded from SPIE Digital Library on 01 Apr 2010 to 192.146.1.254. Terms of Use: http://spiedl.org/terms

Due to the nature of the CDSEM measurement, for advanced applications such as the M2 post-litho and the HKMG post-etch applications it is unknown exactly at what height of the structure the tool is measuring. Because of this, it is common practice to compare scattero-meter values from multiple heights and use the height that provides the best correlation to CDSEM. This technique was used for both applications in this paper. For the M2 application, the scatterometry values were only compared to the CDSEM. Results for both the 0 degree AZ angle and the 90 degree AZ angle models are shown in figure 18. For these correlations, each site was measured 81 times (each in a different location) by the CDSEM in order to minimize uncertainties due to across-grating variation. Note that the TMU at 90 degrees is only 2% higher than at 0 degrees, with an almost identical slope. Thus, both models provide the same level of CD accuracy. Correlation to CDSEM for the HKMG application is displayed
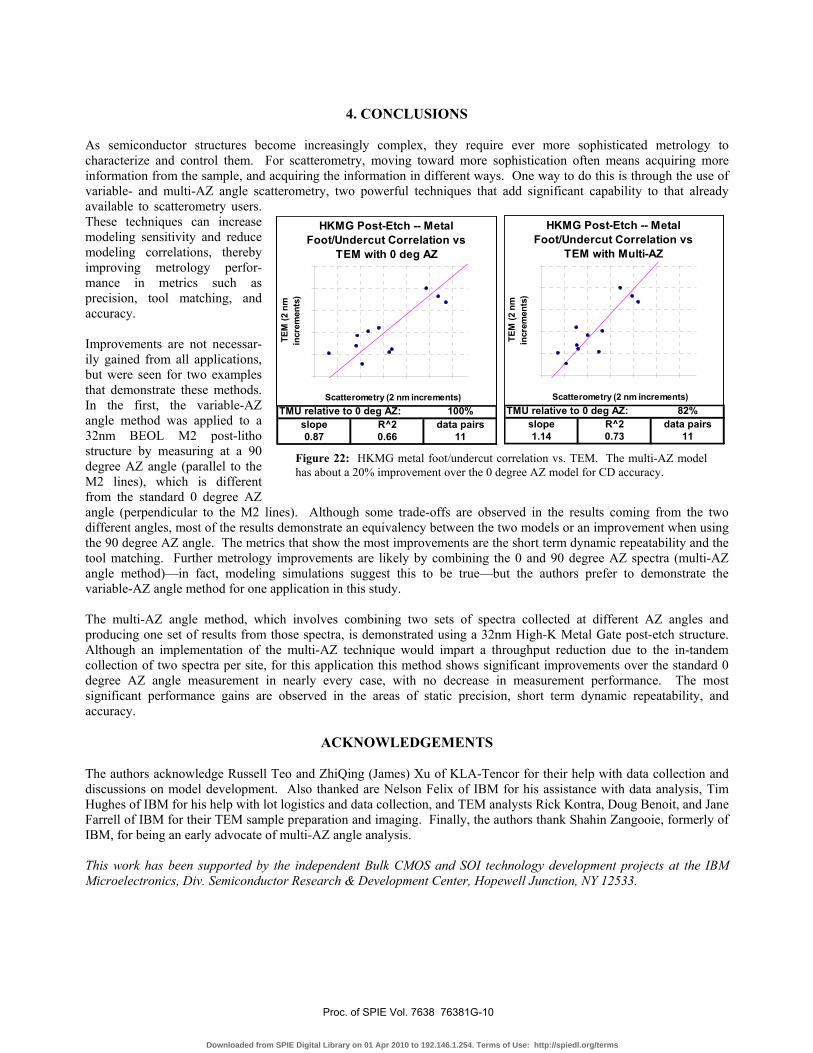
in figure 19. In this case, the CDSEM measured each site 81 times (again, each in a different location). The multi-AZ angle approach provides a 35% improvement in TMU for CD, which represents a significant gain in accuracy. Since the height of a CD measurement from the TEM images of the HKMG wafers is clear, direct comparisons of CD as a function of height can be made. Thus, scatterometry measurements of the three critical parameters Si BCD, metal BCD, and metal foot/undercut are compared to TEM measurements. In each case, TEM images from ten different gates from each site were measured; the average values from each site are compared to each model’s measurements of these critical parameters. Correlation to TEM for Si BCD is provided in figure 20. The multi-AZ model produces an enormous 3x improvement in TMU. For metal BCD, a noticeable improvement of about 30% is gained by using the multi-AZ model (figure 21). Finally, figure 22 shows that the multi-AZ model measurement of metal foot/undercut is almost 20% better than that of the 0 degree AZ model.
Figure 20: HKMG Si BCD correlation vs. TEM. The multi-AZ model has a 3X improvement over the 0 degree AZ model for CD accuracy.
HKMG Post-Etch -- Si BCD Correlation vs TEM with
Multi-AZ
25
30
35
40
45
50
20 25 30 35 40 45 50Scatterometry (5 nm increments)
TEM
(5 n
m
incr
emen
ts)
TMU relative to 0 deg AZ: 30%slope R^2 data pairs1.24 0.97 11
HKMG Post-Etch -- Si BCD Correlation vs TEM with
Multi-AZ
25
30
35
40
45
50
20 25 30 35 40 45 50Scatterometry (5 nm increments)
TEM
(5 n
m
incr
emen
ts)
TMU relative to 0 deg AZ: 30%slope R^2 data pairs1.24 0.97 11
HKMG Post-Etch -- Si BCD Correlation vs TEM with
0 deg AZ
25
30
35
40
45
50
20 25 30 35 40 45 50Scatterometry (5 nm increments)
TEM
(5 n
m
incr
emen
ts)
TMU relative to 0 deg AZ: 100%slope R^2 data pairs1.24 0.88 11
HKMG Post-Etch -- Si BCD Correlation vs TEM with
0 deg AZ
25
30
35
40
45
50
20 25 30 35 40 45 50Scatterometry (5 nm increments)
TEM
(5 n
m
incr
emen
ts)
TMU relative to 0 deg AZ: 100%slope R^2 data pairs1.24 0.88 11
HKMG Post-Etch -- Si BCD Correlation vs TEM with
Multi-AZ
25
30
35
40
45
50
20 25 30 35 40 45 50Scatterometry (5 nm increments)
TEM
(5 n
m
incr
emen
ts)
TMU relative to 0 deg AZ: 30%slope R^2 data pairs1.24 0.97 11
HKMG Post-Etch -- Si BCD Correlation vs TEM with
Multi-AZ
25
30
35
40
45
50
20 25 30 35 40 45 50Scatterometry (5 nm increments)
TEM
(5 n
m
incr
emen
ts)
TMU relative to 0 deg AZ: 30%slope R^2 data pairs1.24 0.97 11
HKMG Post-Etch -- Si BCD Correlation vs TEM with
0 deg AZ
25
30
35
40
45
50
20 25 30 35 40 45 50Scatterometry (5 nm increments)
TEM
(5 n
m
incr
emen
ts)
TMU relative to 0 deg AZ: 100%slope R^2 data pairs1.24 0.88 11
HKMG Post-Etch -- Si BCD Correlation vs TEM with
0 deg AZ
25
30
35
40
45
50
20 25 30 35 40 45 50Scatterometry (5 nm increments)
TEM
(5 n
m
incr
emen
ts)
TMU relative to 0 deg AZ: 100%slope R^2 data pairs1.24 0.88 11
Figure 21: HKMG metal BCD correlation vs. TEM. The multi-AZ model has about a 30% improvement over the 0 degree AZ model for CD accuracy.
HKMG Post-Etch -- Metal BCD Correlation vs TEM with
Multi-AZ
25
30
35
40
45
50
25 30 35 40 45 50 55Scatterometry (5 nm increments)
TEM
(5 n
m
incr
emen
ts)
TMU relative to 0 deg AZ: 71%slope R^2 data pairs1.33 0.96 11
HKMG Post-Etch -- Metal BCD Correlation vs TEM with
Multi-AZ
25
30
35
40
45
50
25 30 35 40 45 50 55Scatterometry (5 nm increments)
TEM
(5 n
m
incr
emen
ts)
TMU relative to 0 deg AZ: 71%slope R^2 data pairs1.33 0.96 11
HKMG Post-Etch -- Metal BCD Correlation vs TEM with
0 deg AZ
25
30
35
40
45
50
25 30 35 40 45 50 55Scatterometry (5 nm increments)
TEM
(5 n
m
incr
emen
ts)
TMU relative to 0 deg AZ: 100%slope R^2 data pairs1.39 0.94 11
HKMG Post-Etch -- Metal BCD Correlation vs TEM with
0 deg AZ
25
30
35
40
45
50
25 30 35 40 45 50 55Scatterometry (5 nm increments)
TEM
(5 n
m
incr
emen
ts)
TMU relative to 0 deg AZ: 100%slope R^2 data pairs1.39 0.94 11
HKMG Post-Etch -- Metal BCD Correlation vs TEM with
Multi-AZ
25
30
35
40
45
50
25 30 35 40 45 50 55Scatterometry (5 nm increments)
TEM
(5 n
m
incr
emen
ts)
TMU relative to 0 deg AZ: 71%slope R^2 data pairs1.33 0.96 11
HKMG Post-Etch -- Metal BCD Correlation vs TEM with
Multi-AZ
25
30
35
40
45
50
25 30 35 40 45 50 55Scatterometry (5 nm increments)
TEM
(5 n
m
incr
emen
ts)
TMU relative to 0 deg AZ: 71%slope R^2 data pairs1.33 0.96 11
HKMG Post-Etch -- Metal BCD Correlation vs TEM with
0 deg AZ
25
30
35
40
45
50
25 30 35 40 45 50 55Scatterometry (5 nm increments)
TEM
(5 n
m
incr
emen
ts)
TMU relative to 0 deg AZ: 100%slope R^2 data pairs1.39 0.94 11
HKMG Post-Etch -- Metal BCD Correlation vs TEM with
0 deg AZ
25
30
35
40
45
50
25 30 35 40 45 50 55Scatterometry (5 nm increments)
TEM
(5 n
m
incr
emen
ts)
TMU relative to 0 deg AZ: 100%slope R^2 data pairs1.39 0.94 11
Proc. of SPIE Vol. 7638 76381G-9
Downloaded from SPIE Digital Library on 01 Apr 2010 to 192.146.1.254. Terms of Use: http://spiedl.org/terms
4. CONCLUSIONS As semiconductor structures become increasingly complex, they require ever more sophisticated metrology to characterize and control them. For scatterometry, moving toward more sophistication often means acquiring more information from the sample, and acquiring the information in different ways. One way to do this is through the use of variable- and multi-AZ angle scatterometry, two powerful techniques that add significant capability to that already available to scatterometry users. These techniques can increase modeling sensitivity and reduce modeling correlations, thereby improving metrology perfor-mance in metrics such as precision, tool matching, and accuracy. Improvements are not necessar-ily gained from all applications, but were seen for two examples that demonstrate these methods. In the first, the variable-AZ angle method was applied to a 32nm BEOL M2 post-litho structure by measuring at a 90 degree AZ angle (parallel to the M2 lines), which is different from the standard 0 degree AZ angle (perpendicular to the M2 lines). Although some trade-offs are observed in the results coming from the two different angles, most of the results demonstrate an equivalency between the two models or an improvement when using the 90 degree AZ angle. The metrics that show the most improvements are the short term dynamic repeatability and the tool matching. Further metrology improvements are likely by combining the 0 and 90 degree AZ spectra (multi-AZ angle method)—in fact, modeling simulations suggest this to be true—but the authors prefer to demonstrate the variable-AZ angle method for one application in this study. The multi-AZ angle method, which involves combining two sets of spectra collected at different AZ angles and producing one set of results from those spectra, is demonstrated using a 32nm High-K Metal Gate post-etch structure. Although an implementation of the multi-AZ technique would impart a throughput reduction due to the in-tandem collection of two spectra per site, for this application this method shows significant improvements over the standard 0 degree AZ angle measurement in nearly every case, with no decrease in measurement performance. The most significant performance gains are observed in the areas of static precision, short term dynamic repeatability, and accuracy.
ACKNOWLEDGEMENTS The authors acknowledge Russell Teo and ZhiQing (James) Xu of KLA-Tencor for their help with data collection and discussions on model development. Also thanked are Nelson Felix of IBM for his assistance with data analysis, Tim Hughes of IBM for his help with lot logistics and data collection, and TEM analysts Rick Kontra, Doug Benoit, and Jane Farrell of IBM for their TEM sample preparation and imaging. Finally, the authors thank Shahin Zangooie, formerly of IBM, for being an early advocate of multi-AZ angle analysis. This work has been supported by the independent Bulk CMOS and SOI technology development projects at the IBM Microelectronics, Div. Semiconductor Research & Development Center, Hopewell Junction, NY 12533.
Figure 22: HKMG metal foot/undercut correlation vs. TEM. The multi-AZ model has about a 20% improvement over the 0 degree AZ model for CD accuracy.
HKMG Post-Etch -- Metal Foot/Undercut Correlation vs
TEM with Multi-AZ
-5
-3
-1
1
3
5
-4 -2 0 2 4 6 8Scatterometry (2 nm increments)
TEM
(2 n
m
incr
emen
ts)
TMU relative to 0 deg AZ: 82%slope R^2 data pairs1.14 0.73 11
HKMG Post-Etch -- Metal Foot/Undercut Correlation vs
TEM with Multi-AZ
-5
-3
-1
1
3
5
-4 -2 0 2 4 6 8Scatterometry (2 nm increments)
TEM
(2 n
m
incr
emen
ts)
TMU relative to 0 deg AZ: 82%slope R^2 data pairs1.14 0.73 11
HKMG Post-Etch -- Metal Foot/Undercut Correlation vs
TEM with 0 deg AZ
-5
-3
-1
1
3
5
-4 -2 0 2 4 6 8Scatterometry (2 nm increments)
TEM
(2 n
m
incr
emen
ts)
TMU relative to 0 deg AZ: 100%slope R^2 data pairs0.87 0.66 11
HKMG Post-Etch -- Metal Foot/Undercut Correlation vs
TEM with 0 deg AZ
-5
-3
-1
1
3
5
-4 -2 0 2 4 6 8Scatterometry (2 nm increments)
TEM
(2 n
m
incr
emen
ts)
TMU relative to 0 deg AZ: 100%slope R^2 data pairs0.87 0.66 11
HKMG Post-Etch -- Metal Foot/Undercut Correlation vs
TEM with Multi-AZ
-5
-3
-1
1
3
5
-4 -2 0 2 4 6 8Scatterometry (2 nm increments)
TEM
(2 n
m
incr
emen
ts)
TMU relative to 0 deg AZ: 82%slope R^2 data pairs1.14 0.73 11
HKMG Post-Etch -- Metal Foot/Undercut Correlation vs
TEM with Multi-AZ
-5
-3
-1
1
3
5
-4 -2 0 2 4 6 8Scatterometry (2 nm increments)
TEM
(2 n
m
incr
emen
ts)
TMU relative to 0 deg AZ: 82%slope R^2 data pairs1.14 0.73 11
HKMG Post-Etch -- Metal Foot/Undercut Correlation vs
TEM with 0 deg AZ
-5
-3
-1
1
3
5
-4 -2 0 2 4 6 8Scatterometry (2 nm increments)
TEM
(2 n
m
incr
emen
ts)
TMU relative to 0 deg AZ: 100%slope R^2 data pairs0.87 0.66 11
HKMG Post-Etch -- Metal Foot/Undercut Correlation vs
TEM with 0 deg AZ
-5
-3
-1
1
3
5
-4 -2 0 2 4 6 8Scatterometry (2 nm increments)
TEM
(2 n
m
incr
emen
ts)
TMU relative to 0 deg AZ: 100%slope R^2 data pairs0.87 0.66 11
Proc. of SPIE Vol. 7638 76381G-10
Downloaded from SPIE Digital Library on 01 Apr 2010 to 192.146.1.254. Terms of Use: http://spiedl.org/terms

REFERENCES
1. Sendelbach, M., Archie, C. N., Banke, B., Mayer, J., Nii, H., Herrera, P., Hankinson, M., "Correlating scatterometry to CD-SEM and electrical gate measurements at the 90-nm node using TMU analysis" in Metrology, Inspection, and Process Control for Microlithography XVIII, edited by Richard M. Silver, Proceedings of SPIE Vol. 5375 (SPIE, Bellingham, WA 2004) pp. 550-563.
2. Sendelbach, M., Zangooie, S., Vaid, A., Herrera, P., Leng, J., Kim, I., "Assessing scatterometry for measuring advanced spacer structures with embedded SiGe" in Metrology, Inspection, and Process Control for Microlithography XXII, edited by John A. Allgair, Christopher J. Raymond, Proceedings of SPIE Vol. 6922 (SPIE, Bellingham, WA 2008) 69220R.
3. Zangooie, S., Sendelbach, M., Angyal, M., Archie, C., Vaid, A., Matthew, I., Herrera, P., "Characterization of 32nm node BEOL grating structures using scatterometry" in Metrology, Inspection, and Process Control for Microlithography XXII, edited by John A. Allgair, Christopher J. Raymond, Proceedings of SPIE Vol. 6922 (SPIE, Bellingham, WA 2008) 69220S.
4. Solecky, E., Archie, C., Banke, B., "New comprehensive metrics and methodology for metrology tool fleet matching" in Metrology, Inspection, and Process Control for Microlithography XIX, edited by Richard M. Silver, Proceedings of SPIE Vol. 5752 (SPIE, Bellingham, WA 2005) pp. 248-258.
5. Sendelbach, M., Archie, C. N., "Scatterometry measurement precision and accuracy below 70 nm" in Metrology, Inspection, and Process Control for Microlithography XVII, edited by Daniel J. Herr, Proceedings of SPIE Vol. 5038 (SPIE, Bellingham, WA 2003) pp. 224-238.
6. Sendelbach, M., Munoz, A., Bandy, K. A., Prager, D., Funk, M., "Integrated scatterometry in high-volume manufacturing for polysilicon gate etch control" in Metrology, Inspection, and Process Control for Microlithography XX, edited by Chas N. Archie, Proceedings of SPIE Vol. 6152 (SPIE, Bellingham, WA 2006) 61520F.
7. Sendelbach, M., Natzle, W., Archie, C. N., Banke, B., Prager, D., Engelhard, D., Ferns, J., Yamashita, A., Funk, M., Higuchi, F., Tomoyasu, M., "Feedforward of mask open measurements on an integrated scatterometer to improve gate linewidth control" in Metrology, Inspection, and Process Control for Microlithography XVIII, edited by Richard M. Silver, Proceedings of SPIE Vol. 5375 (SPIE, Bellingham, WA 2004) pp. 686-702.
Proc. of SPIE Vol. 7638 76381G-11
Downloaded from SPIE Digital Library on 01 Apr 2010 to 192.146.1.254. Terms of Use: http://spiedl.org/terms