76443041 pmbok chapter 5 time
TRANSCRIPT

1
Chapter 5:
Project Time Management
adopted from PMI’s PMBOK 2000 and
Textbook : Information Technology Project Management
(author : Dr. Kathy Schwalbe)

2
Contents of time management
• definition: charter and scope statement
• sequence: mandatory dependencies, discretionary dependencies, external dependencies
• schedule: ADM, PDM
• estimation: actual time + elapsed time. An art require experience.
• schedule development: Gantt chart, CPM and PERT
• schedule control and change control: perform checks, allow contingencies, communicate with stakeholders regularly Chapter 5

3
Project Time Management
• Developing the schedule involves
– define the scope of the work
– define the activities
– estimate how long the activities will take
– define sequence the activities based on its
relationships
– estimate associate costs with the activities.

4
Project Time Management
Processes
• Project time management involves the processes
required to ensure timely completion of a
project.
• 5 Processes include:
– Activity definition
– Activity sequencing planning
– Activity duration estimating
– Schedule development
– Schedule control control
Chapter 5

5
Activity Definition process
• 4th planning phase process
• It involves identifying and documenting
the specific activities that must be
performed in order to produce the
deliverables and sub-deliverables identified
in the WBS.

6
Inputs to Activity Definition
process • WBS
– The primary input to Activity Definition. It is scope definition tool that organizes the work and provides a basis for project estimates.
• Scope statement
– must be considered explicitly during Activity Definition. Project justification and objectives are especially important.
• Historical information
– activities required on similar projects should be considered in defining project activities.
• Constraints
– Factors that limit the team’s options
• Assumptions
– factors that, for planning purposes, will be considered to be true, real, or certain.
• Expert judgment
– guided by historical information should be used whenever possible. subject-matter experts can help.

7
Tools & techniques for Activity
Definition process • Project schedules grow out of the basic
document that initiate a project
– Project charter includes start and end dates and budget information
– Scope statement and WBS help define what will be done
• Activity definition involves developing a more detailed WBS and supporting explanations to understand all the work to be done
Chapter 5

8
Tools & techniques for Activity
Definition process (2)
• Decomposition
– dividing project elements into smaller, more
manageable components. Decomposition in Activity
Definition and in Scope Definition differ; the final
outputs in Activity Definition are activities (action
steps) and deliverables (tangible items)
• Templates
– previous project templates help project team to jump-
start the process.
9
Outputs from Activity Definition
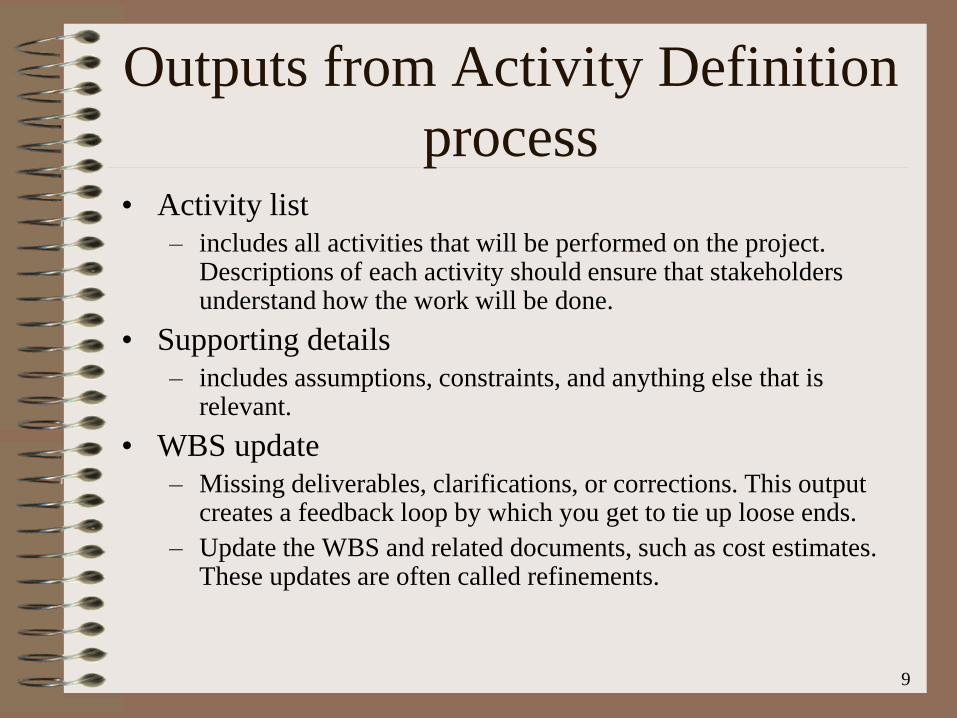
process • Activity list
– includes all activities that will be performed on the project. Descriptions of each activity should ensure that stakeholders understand how the work will be done.
• Supporting details
– includes assumptions, constraints, and anything else that is relevant.
• WBS update
– Missing deliverables, clarifications, or corrections. This output creates a feedback loop by which you get to tie up loose ends.
– Update the WBS and related documents, such as cost estimates. These updates are often called refinements.

10
Activity Sequencing
• 5th planning phase process
• Involves reviewing activities and determining dependencies
– Mandatory dependencies: inherent in the nature of the work; hard logic
– Discretionary dependencies: defined by the project team; soft logic
– External dependencies: involve relationships between project and non-project activities
• You must determine dependencies in order to use critical path analysis
Chapter 5

11
Inputs to Activity Sequencing
• Activities list
– includes all activities that will be performed on the project.
• Product description
– product characteristics. These often affect Activity Sequencing.
• Mandatory dependencies
– inherent in the nature of the work being done. They often involve physical limitations. Constraints caused by mandatory dependencies are call hard-logic.
• Discretionary dependencies
– defined by the project management team. Constraints caused by discretionary dependencies are called soft logic.
• External dependencies
– involve a relationship between project and non-project activities.
• Milestones
– part of activity sequencing to ensure that requirement for the milestone events are being met.
12
Tools & techniques
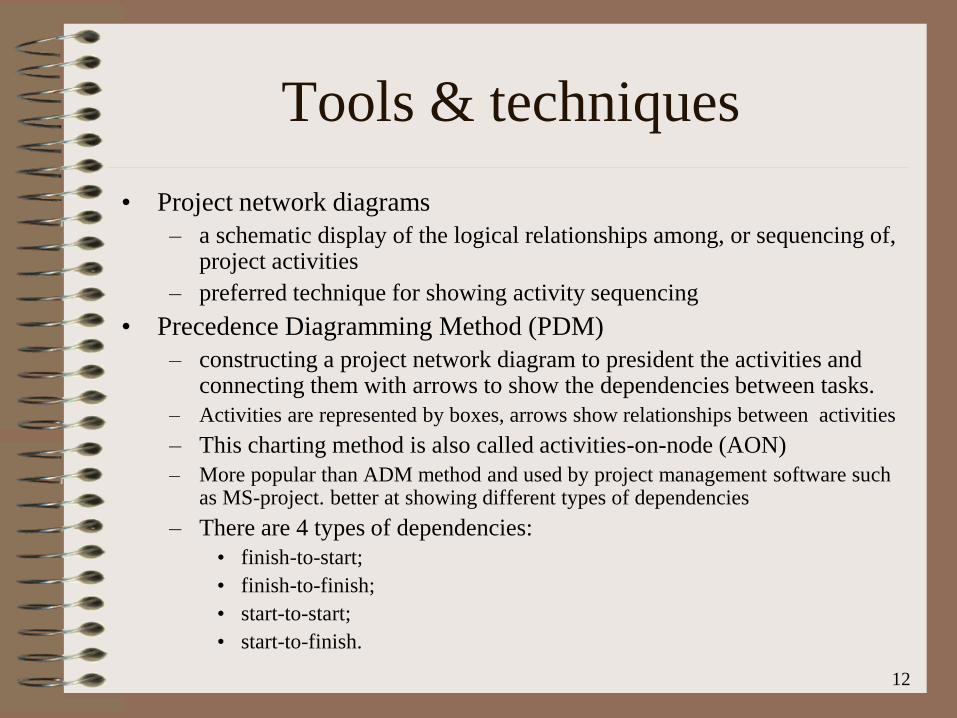
• Project network diagrams
– a schematic display of the logical relationships among, or sequencing of, project activities
– preferred technique for showing activity sequencing
• Precedence Diagramming Method (PDM)
– constructing a project network diagram to president the activities and connecting them with arrows to show the dependencies between tasks.
– Activities are represented by boxes, arrows show relationships between activities
– This charting method is also called activities-on-node (AON)
– More popular than ADM method and used by project management software such as MS-project. better at showing different types of dependencies
– There are 4 types of dependencies:
• finish-to-start;
• finish-to-finish;
• start-to-start;
• start-to-finish.

13
Tools & techniques (2)
• Arrow diagramming method (ADM)
– constructing a project network diagram by using arrows to represent the activities and connecting them at nodes to show the dependencies.
– Nodes or circles are the starting and ending points of activities
– It is known as activities-on-arrow (AOA). This method uses only finish-to-start activities.
• Conditional diagramming methods
– allow for non-sequential activities such as loops or conditional branches, neither of which is possible in the PDM or ADM.
• Network templates
– Can expedite the preparation of project network diagrams
14
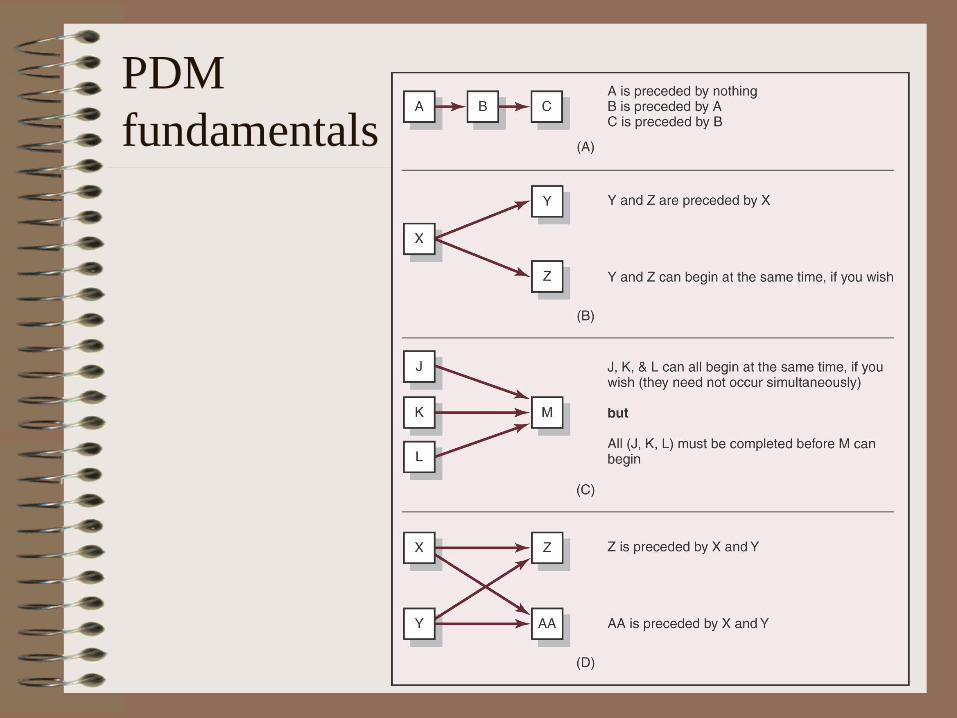
PDM
fundamentals

15
Task Dependency Types in PDM
Chapter 5

16
Sample Precedence Diagramming Method (PDM)
Network Diagram for Project X
Project 98 file
17
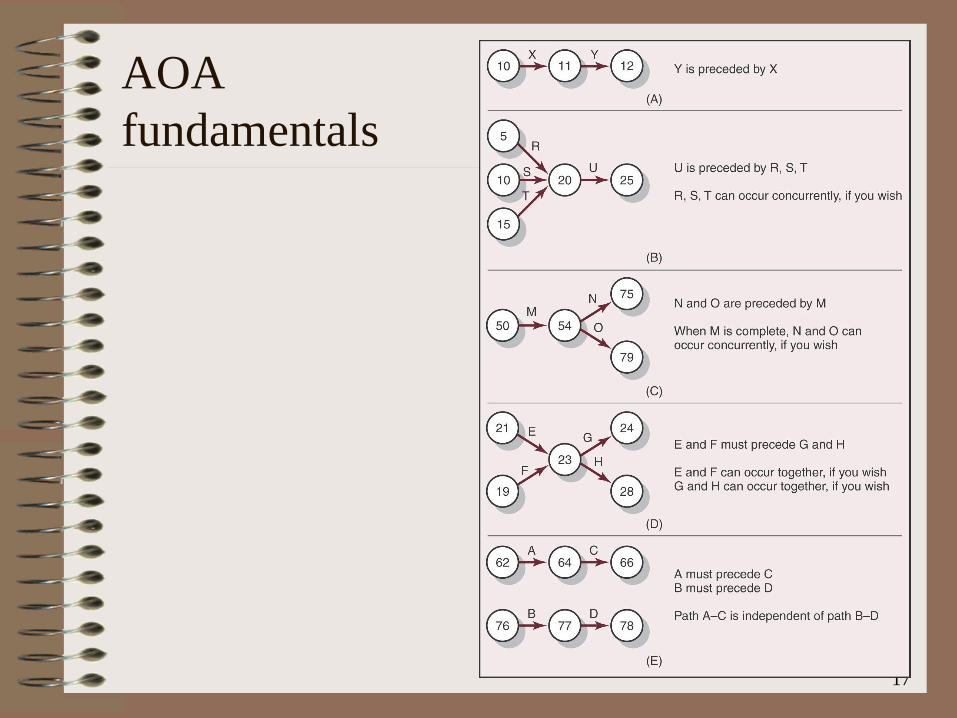
AOA
fundamentals

18
Sample Activity-on-Arrow (AOA)
Network Diagram for Project X
Chapter 5

19
Steps for Creating AOA Diagrams
1. Find all of the activities that start at node 1. Draw their finish nodes
and draw arrows between node 1 and those finish nodes. Put the
activity letter or name and duration estimate on the associated arrow
2. Continuing drawing the network diagram, working from left to right.
Look for bursts and merges. Bursts occur when a single node is
followed by two or more activities. A merge occurs when two or
more nodes precede a single node
3. Continue drawing the project network diagram until all activities are
included on the diagram that have dependencies
4. As a rule of thumb, all arrowheads should face toward the right, and
no arrows should cross on an AOA network diagram
Chapter 5

20
Outputs from Activity
Sequencing
• Project network diagram
– a schematic delay of the project’s activities and the
logical relationships (dependencies) among them.
(note: it is not called a PERT chart)
• Activity list update
– allow a feedback loop if a network diagram reveals
instances where an activity must be redefined in order
to diagram the correct logical relationships

21
Activity Duration Estimating
• 6th of 21 planning phase process
• After defining activities and determining their sequence, the next step in time management is duration estimating
• Duration includes the actual amount of time worked on an activity plus elapsed time
• People doing the work should help create estimates, and an expert should review them
Chapter 5
22
Inputs to Activity Duration
Estimation • Activity list
– includes all activities that will be performed on the project.
• Constraints
– Factors that limit the performance of the project. When constraint are involved, special considerations are often required for communications.
• Assumptions
– Factors that for planning purposes are considered to be true, real, or certain.
• Resource requirements
– controlling factors on activities duration. The duration of most activities will be significantly influenced by the resources assigned to them.
• Resource capabilities
– staff and material resources assigned to them will affect the duration of most activities.
• Historical information
– may be available for review from project records, commercial duration-estimating databases, and team knowledge.

23
Tools & techniques
• Expert judgment
– Judgment guided by historical information should be used whenever possible.
• An example is the Delphi Technique, which is a forecasting technique that relies on gathering expert opinions. After several iterations, the experts reach consensus of opinions.
• Analogous estimating
– uses the duration of a previous, similar activity as the basis for estimating the duration of a future activity.
– It is also called top-down estimating.
• Simulation
– calculates multiple durations with different sets of assumptions.
– The most common is the Monte Carlo Analysis.

24
Outputs from Activity Duration
Estimation
• Activities duration estimation
– Quantitative assessments of the likely number of work
periods – such as hours, days, weeks, or months – that
will be required to complete an activities.
• Basis of estimates
– includes the assumptions made in developing your
estimates, which must be documented.
• Activities list updates
– this feedback loop ensures completeness.

25
Gantt Charts
• Gantt charts provide a standard format for
displaying project schedule information by listing
project activities and their corresponding start and
finish dates in a calendar format
• Symbols include:
– A black diamond: milestones or significant events on a
project with zero duration
– Thick black bars: summary tasks
– Lighter horizontal bars: tasks
– Arrows: dependencies between tasks
Chapter 5

26
Schedule development
• 7th of 21 planning phase process
• It is the process of determining the start
and finish dates for all project activities
• The activity sequences, activity duration,
and resource requirement are analyzed
together to create the project schedule.

27
Schedule Development
• 7th of 21 planning phase process
• Schedule development uses results of the other time management processes to determine the start and end date of the project and its activities
• Ultimate goal is to create a realistic project schedule that provides a basis for monitoring project progress for the time dimension of the project
• Important tools and techniques include Gantt charts, PERT analysis, critical path analysis, and critical chain scheduling
Chapter 5

28
Inputs to Schedule development
• Project network diagram: A schematic display of the project’s activities and the logical relationships (dependencies) among them.
• Activities duration estimation: Quantitative assessments of the likely number of work periods – such as hours, days, weeks, or months – that will be required to complete an activities.
• Resource requirements: define what physical resources (people, equipment, and materials) and what quantities of each are needed to perform project activities.
• Resource pool descriptions: identify the required resources, listing who will be available, when, and in what patterns, as necessary for schedule development.

29
Inputs to Schedule development (2)
• Calendars: identify the time when work is allowed. Project calendars affect all resource. Resource calendars affect a specific resource or category of resource.
• Constraints: constraints to consider during schedule development include: a) imposed dates; b) key events or major milestones.
• Assumptions: factors that, for planning purposes, are considered to be true, real, or certain.
• Leads and lags: the lead is the minimum necessary lapse of time between the start of one activity and the start of an overlapping activity. The lag is the waiting time between two tasks (negative lead) such as waiting for concrete to harden or paint to dry.

30
Inputs to Schedule development (3)
• Risk management plan: A subsidiary part of the
project plan. It documents the procedures to
manage risk throughput the project.
• Activity attributes: describes various
characteristics of the activities scheduled –
responsibilities, WBS order, the location where
the work will be performed, the level.
31
Tools & techniques
• Mathematical analysis
– Calculating theoretical early and late start and finish dates for all project activities without any resource pool limitations.
– The most common analysis techniques are
• Critical path method (CPM);
• Graphical evaluation and review technique (GERT);
• PERT.
• Duration compression methods
– ways to shorten the project schedule without changing the project scope.
– Two techniques are used:
• crashing;
• fast-tracking.

32
Tools & techniques (2)
• Simulation:
– calculates multiple durations with different sets of assumptions.
– The most common is Monte Carlo analysis, in which a distribution of probable results is defined for each activity and used to calculate a distribution of probable results for the total project.
• Resource level heuristics
– use mathematical analysis to produce a preliminary schedule.
– Resource leveling heuristics are used when the schedule requires more resources during certain time periods than are available, or requires changes in resource level that are not manageable.
• Project management software
– widely used to assist with schedule development

33
Outputs from Schedule
development • Project schedule
– includes at a minimum the planned start and expected finish dates for each detailed activity.
– displayed graphically in one of the following formats
• project network diagrams (e.g. Gantt Chart)
• bar charts
• milestone charts
• Support details
– include at least documentation of all identified assumptions and constrains. Some examples are resource histograms, alternative schedules, and cash-flow schedules.
• Schedule management plan
– defines how changes to the schedules will be managed.
• Resource requirement updates
– a result of resource leveling and activity list updates.


36
Sample Tracking Gantt Chart
Project 98 file white diamond: slipped milestone
two bars: planned and actual times
Chapter 5

37
Critical Path Method (CPM)
• CPM is a project network analysis technique
used to predict total project duration
• A critical path for a project is the series of
activities that determines the earliest time by
which the project can be completed
• The critical path is the longest path through
the network diagram and has the least
amount of slack or float
Chapter 5

38
Finding the Critical Path
• First develop a good project network
diagram
• Add the durations for all activities on each
path through the project network diagram
• The longest path is the critical path
Chapter 5

39
Simple Example of Determining
the Critical Path
• Consider the following project network
diagram. Assume all times are in days.
2 3
4
5
A=2 B=5C=2
D=7
1 6
F=2
E=1
start finish
1. How many paths are on this network diagram?
2. How long is each path?
3. Which is the critical path?
4. What is the shortest amount of time needed to
complete this project? Chapter 5

40
Determining the Critical Path
for Project X

41
More on the Critical Path
• If one of more activities on the critical path takes
longer than planned, the whole project schedule
will slip unless corrective action is taken
• Misconceptions:
– The critical path is not the one with all the critical
activities; it only accounts for time
– There can be more than one critical path if the lengths
of two or more paths are the same
– The critical path can change as the project progresses
Chapter 5
42
Using Critical Path Analysis to
Make Schedule Trade-offs • Knowing the critical path helps you make schedule
trade-offs
• Free slack or free float is the amount of time an
activity can be delayed without delaying the early
start of any immediately following activities
• Total slack or total float is the amount of time an
activity may be delayed from its early start without
delaying the planned project finish date
Chapter 5

43
Free and Total Float or Slack for
Project X

44
Techniques for Shortening a
Project Schedule
• Shortening durations of critical tasks for adding
more resources or changing their scope
– Crashing tasks by obtaining the greatest amount of
schedule compression for the least incremental cost
– Fast tracking tasks by doing them in parallel or
overlapping them
Chapter 5

45
Importance of Updating Critical
Path Data
• It is important to update project schedule
information
• The critical path may change as you enter
actual start and finish dates
• If you know the project completion date
will slip, negotiate with the project sponsor
Chapter 5

46
Multitasking Example

47
Program Evaluation and Review
Technique (PERT)
• PERT is a network analysis technique
– to estimate project duration when there is a high
degree of uncertainty about the individual activity
duration estimates
• PERT uses probabilistic time estimates based on
different estimates of activity durations
– optimistic estimates (weighting 1)
– most likely estimates (weighting 4)
– pessimistic estimates (weighting 1)
Chapter 5

48
PERT Formula and Example
• PERT weighted average formula: optimistic time + 4x most likely time + pessimistic time
6
• Example:
PERT weighted average =
8 workdays + 4 X 10 workdays + 24 workdays = 12 days 6
where 8 = optimistic time, 10 = most likely time,
and 24 = pessimistic time

49
Controlling Changes to the
Project Schedule • 4th of 8 Controlling phase process
• It involves managing changes to the schedule. The major activities include
– monitor the schedule performance of project activities
– detect variances from the original schedule baseline.
– general steps:
• Perform reality checks on schedules
– Allow for contingencies
– Don’t plan for everyone to work at 100% capacity all the time
– Hold progress meetings with stakeholders and be clear and honest in communicating schedule issues Chapter 5

50
Inputs to Schedule control
• Project schedule
– As a part of the integrated project plan, the approved schedule is called schedule baseline.
– Project team/manager re-baseline when the schedule becomes unrealistic.
– Re-baselining occurs when project team/manager do any major update in order to have a better control the schedule.
• Performance reports
– provide information on schedule execution – showing if planned dates have been met. These reports also alert project team on issues that may cause problem in future.
• Change requests
– any update of schedule, that may require extending or accelerating the schedule.
• Scope management plan
– describes how changes will be integrated into the project. It is part of the project plan.

51
Tools & techniques for Schedule
control process • Schedule change control system:
– defines the procedures for changing the project schedule. It includes the paperwork, tracking systems, and approval levels necessary for authorizing changes.
• Performance measurement techniques:
– assess the magnitude of any variations that occur in project performance. An important part of Schedule Control is to decide if the schedule variation requires corrective action.
• Additional planning:
– prospective changes may require new or revised activity duration estimates, modified activity sequences, or analysis of alternative schedules.
• Project management software:
– widely used to assist with schedule development and control. In the context of controlling, it is schedule tracking, and reporting. It helps
levels resources, for schedule alternatives.

52
Using Software to Assist in
Time Management
• Software for facilitating communications
helps people exchange schedule-related
information
• Decision support models help analyze
trade-offs that can be made
• Project management software can help in
various time management areas
Chapter 5

53
Outputs from schedule control
process • Schedule updates:
– include any modification to the schedule used to manage the project. A special category of schedule updates, revisions, describes changes to start and finish dates in the approval project schedule.
• Corrective action:
– encompasses anything that brings your expected future schedule back in line with the project plan. These actions are outputs from the other knowledge areas.
• Lessons learned:
– document causes of variances, the reasoning behind corrective actions, and other lessons learned from schedule change.

54
Working with People Issues
• Strong leadership helps projects succeed
more than good PERT charts
• Project managers should use
– empowerment
– incentives
– discipline
– negotiation
Chapter 5

55
Summary
• importance of project schedules: IT project always over-run
• Time management process
– definition (planning)
– sequence (planning)
– schedule estimation (planning)
– schedule development (planning)
– schedule control (control)
Chapter 5

56
Summary (2)
• definition: charter and scope statement
• sequence: mandatory dependencies, discretionary dependencies, external dependencies
• schedule: ADM, PDM
• estimation: actual time + elapsed time. An art require experience.
• schedule development: Gantt chart, CPM and PERT
• schedule control and change control: perform checks, allow contingencies, communicate with stakeholders regularly