7th ecpr general conference · 7th ecpr general conference bordeaux, 4-7 september 2013 ... the...
TRANSCRIPT

1
7th ECPR General Conference
Bordeaux, 4-7 September 2013
Nicola Maggini (research fellow at University of Florence and collaborator of CISE)
Understanding the Electoral Rise of the Five Star Movement in Italy
Abstract
The economic crisis, the fall of Berlusconi government and the birth of the technocratic government
led by Mario Monti have produced several changes in the Italian political system. Surely, one of the
most important innovations in the Italian political context has been the emergence of the Five Star
Movement. Such new party has achieved spectacular overnight success in several elections at sub-
national level, and now it is the most voted party in the 2013 national elections. Five Star Movement
combines anti-establishment rhetoric with demands for political reform, transparency and new ways
of ‘doing politics’. The proposed paper aims to analyse the electoral growth of the Five Star
Movement using both aggregate data and individual data from “Osservatorio Politico Cise-Centro
Italiano di Studi Elettorali” (i.e. cross-section and panel surveys conducted from November 2011 to
March 2013). In particular, I investigate whether the profile of voters and supporters of the Five Star
Movement has changed over time, both from a political and a social standpoint. Finally, I analyse
which factors influence the electoral choice for the Five Star Movement, also in a longitudinal
perspective.
1. The background and the electoral success of Five Star Movement in 2013 political
elections
The Five Star Movement (M5S) led by the former comedian Beppe Grillo has become a major actor
on the Italian political scene. It is one of most important political subjects of the ‘new transition’ that
started in Italian politics with the end of the Berlusconi government in November 2011 [Ceccarini,
Diamanti and Lazar 2012]. Several factors enabled the M5S to become a relevant political actor: the
ongoing de-structuring of the Italian party system that accelerated significantly in 2011 [Bosco and
McDonnell 2012]; the consequences of the global economic crisis and the arena offered to the new
party by some local elections. The crisis of the Italian party system1, the redefinition of the political
1 For an analysis of the evolution of the party system in Italy, see Chiaramonte [2007; 2010].

2
supply and the emergence of a new competitive electoral space benefited the M5S, which is
progressively filling the ‘void’ left by the traditional parties. Moreover, the global economic crisis
undoubtedly favoured the growing popularity of the M5S: uncertainty about the future and the
demand for social protection clashed with the anti-crisis austerity measures, reinforcing the anti-party
and anti-politics sentiment. The financial and economic crisis accelerated the end of Berlusconi’s
government and the formation of Monti’s technocratic government. The latter was supported by an
anomalous ‘grand coalition’ (Pdl, Pd and Udc). These events have contributed, indirectly, to create
favourable conditions for the M5S’s success. Although Monti enjoyed high personal credibility, his
anti-crisis measures have been strongly criticized by citizens for their social cost. They also reduced
tolerance of wasted resources in politics. The social delegitimation of ‘traditional’ leaders and parties
marked the climate of the local elections in May 2012, with the electoral growth of the M5S. Distrust
toward parties and their leaders was made worse by various practices that came to light in the course
of the year. These concerned political corruption and the illegal use of public funds allocated to the
parties. The resulting judicial inquiries further weakened the party system. Big and small parties alike,
from across the whole political spectrum, have been implicated.
The local elections held in May 2012 were a success for the M5S: the new party managed, for the
first time, to get four mayors elected (the most important one was Federico Pizzarotti, in Parma, who
defeated the candidate of the left coalition in a run-off election). The success in local elections in May
2012 came after the good performance of the 2010 regional elections and, above all, after the electoral
success obtained in the regional elections held in Sicily on 28 October 2012 when the M5S turned
out to be the largest party in the island, though it was not able to win the governorship2.
On 21 December 2012, Mario Monti resigned. He did so following a critical speech by Angelino
Alfano, the secretary of the People of Freedom, one of the parties that had supported his government
until then. His resignation was the start of the most important electoral campaign in recent Italian
history. Elections were set on 24 and 25 February 2013. Their outcome was a surprise and threw Italy
in a difficult and uncertain situation as no clear winner emerged3. Four main groups competed in this
election: the left coalition led by Pierluigi Bersani and formed by the Democratic Party (Pd) and Left,
Ecology and Freedom (Sel); the right-wing coalition led by Silvio Berlusconi and formed by his party,
People of Freedom (Pdl), the Northern League (Ln) and some other small groups; the Five Star
Movement; and the centrist alliance led by Mario Monti and formed by the Centrist Democratic Union
(Udc) , Future, Liberty, Italy (Fli) and a new electoral list called ‘Civic choice with Monti for Italy’.
2 On the history, organization and electoral performance of the M5S see Corbetta and Gualmini [2013]; Biorcio and
Natale [2013]; Bordignon and Ceccarini [2013]. 3 For an in-depth analysis, see De Sio, Cataldi and De Lucia [2013].

3
At the close of polling, the left won in the Chamber only by 0.4 percentage points. And it did not win
in the Senate.
In this election, the biggest surprise of all was the astonishing success of the Five Star Movement,
whose leader, Beppe Grillo, did not even run as a candidate. The party never competed in a national
election before.
The M5S has been defined as ‘a strange animal… in the zoo of Italian politics’ [Corbetta and
Gualmini 2013, p. 197]. According to Corbetta (ibidem) it shows most of the traits of populist parties
but its use of the web puts it in a different category. It is certainly not a single issue party like the
Greens. Its program is a mix of proposals that cuts across the traditional political spectrum based on
the left-right distinction. They include a two-term limit for elected officials, the ineligibility to public
office of indicted politicians, free internet access, an end to the public funding of political parties and
newspapers, more energy saving and renewables, a 20 hours work week, better social services, lower
taxes, etc. All of this is combined with a basic anti-growth philosophy and a radical critique of
representative democracy. The anti-establishment stand of the movement is what keeps everything
together. The establishment being the old political class, the unions, the big companies and the
traditional media. The M5S combines this anti-establishment rhetoric with demands for political
reform, transparency and new ways of ‘doing politics’. This is what explains a great part of Grillo’s
success so far.
Indeed, the true political winner of these elections is the M5S. Without including the foreign
constituency, it got 25.6 % (obtaining little more than 8,5 million votes) in the Chamber making it
the largest party in the country. In the Senate, its vote share was 23.6 %. For a new party competing
for the first time in a national election it is an impressive feat: never in the history of the Republic
after the elections of 1946, a new party had obtained a similar percentage at its first political elections.
Not even Berlusconi in 1994 with its Forza Italia achieved such a success. As it can be seen in Figure
1 it is the first party in almost half of the provinces (50 out of 109) and it is the only one with a truly
national base. Unlike its major competitors, it has gained more or less the same percentage of votes
in the North, Centre and South (Table 1). Therefore, M5S shows an ability in collecting votes which
is pretty homogeneous at the national level, registering peaks in Sicily (33.5%), in the Marche and in
Liguria (32.1%). On this subject it has to be underlined how Liguria and Sicily are also the regions
where the centre-right coalition loses more votes compared to 2008 (almost half of the votes) and at
the same time are two regions where the centre-left coalition (still compared to 2008) registers losses
above the national average. The success of Grillo's movement for certain occurred to the detriment
of the other main parties. Indeed, the analysis of vote shifts4 in major cities (Table 2) proves that it
4 These are estimates done with precinct level data using the Goodman model.

4
drew its support from across the political spectrum. Left and right contributed almost equally to the
M5S success.
Figure 1 - The party with the most votes by province (in parentheses the number of provinces),
Chamber of Deputies, %
Sources: CISE [Cataldi and Emanuele 2013]
Lega nord (1)
M5S (50)
Pd (40)
Pdl (17)
altri (2)
44
28
26
29
28
27
32
24
28
27
32
28
27
24
32
31
30
30
29
41
41
25
32
34
28
44
26
31
28
25
31
36
27
23
28
25
36
28
26
28
24
28
31
29
2225
39
32
35
30
29
30
34
26
29
37
24
36
30
40
41
2626
32
27
37
33
25
27
31
32
40
30
30
32
28
26
39
28
33
33
26
30
31
24
32
23
34 35
26 29
37
2726
27
23
32
30
27
30
38
31
32
33
26
27
30
25
37
38
29
Ln (1)
Others (2)
5
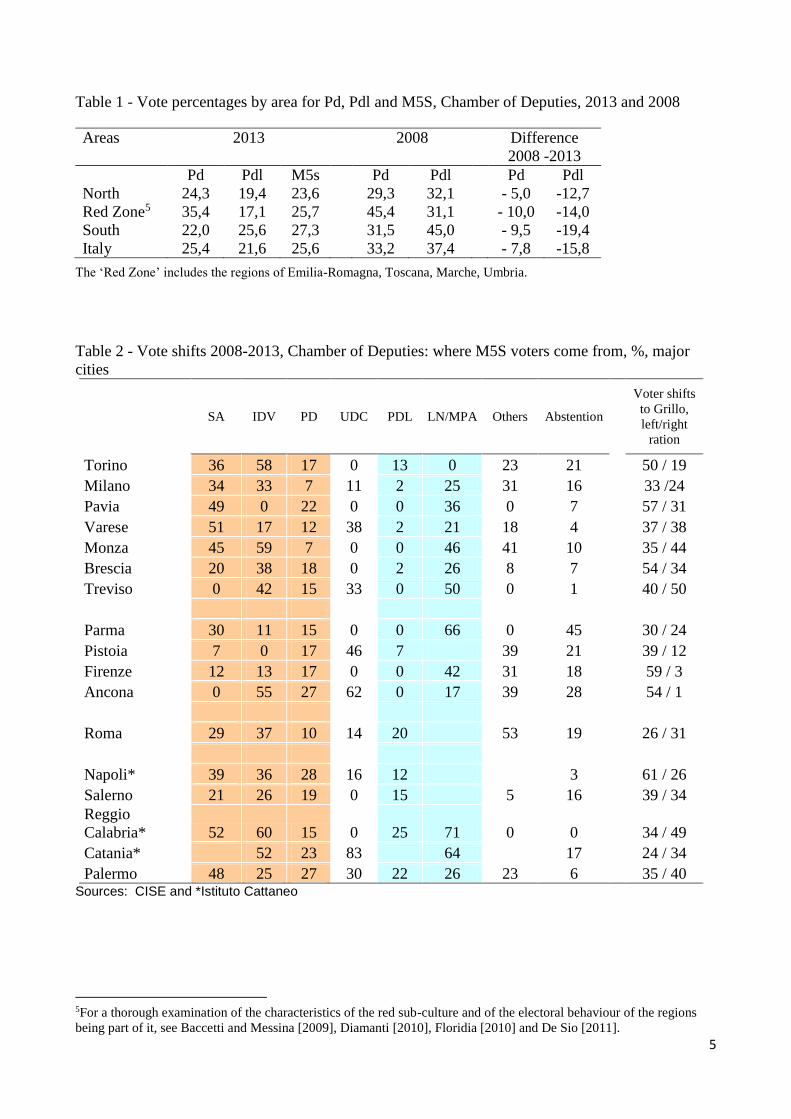
Table 1 - Vote percentages by area for Pd, Pdl and M5S, Chamber of Deputies, 2013 and 2008
The ‘Red Zone’ includes the regions of Emilia-Romagna, Toscana, Marche, Umbria.
Table 2 - Vote shifts 2008-2013, Chamber of Deputies: where M5S voters come from, %, major
cities
SA IDV PD UDC PDL LN/MPA Others Abstention
Voter shifts
to Grillo,
left/right
ration
Torino 36 58 17 0 13 0 23 21 50 / 19
Milano 34 33 7 11 2 25 31 16 33 /24
Pavia 49 0 22 0 0 36 0 7 57 / 31
Varese 51 17 12 38 2 21 18 4 37 / 38
Monza 45 59 7 0 0 46 41 10 35 / 44
Brescia 20 38 18 0 2 26 8 7 54 / 34
Treviso 0 42 15 33 0 50 0 1 40 / 50
Parma 30 11 15 0 0 66 0 45 30 / 24
Pistoia 7 0 17 46 7 39 21 39 / 12
Firenze 12 13 17 0 0 42 31 18 59 / 3
Ancona 0 55 27 62 0 17 39 28 54 / 1
Roma 29 37 10 14 20 53 19 26 / 31
Napoli* 39 36 28 16 12 3 61 / 26
Salerno 21 26 19 0 15 5 16 39 / 34
Reggio
Calabria* 52 60 15 0 25 71 0 0 34 / 49
Catania* 52 23 83 64 17 24 / 34
Palermo 48 25 27 30 22 26 23 6 35 / 40 Sources: CISE and *Istituto Cattaneo
5For a thorough examination of the characteristics of the red sub-culture and of the electoral behaviour of the regions
being part of it, see Baccetti and Messina [2009], Diamanti [2010], Floridia [2010] and De Sio [2011].
Areas 2013 2008 Difference
2008 -2013
Pd Pdl M5s Pd Pdl Pd Pdl
North 24,3 19,4 23,6 29,3 32,1 - 5,0 -12,7
Red Zone5 35,4 17,1 25,7 45,4 31,1 - 10,0 -14,0
South 22,0 25,6 27,3 31,5 45,0 - 9,5 -19,4
Italy 25,4 21,6 25,6 33,2 37,4 - 7,8 -15,8
6
The data in Table 2 show the percentage of voters who chose one of the old parties in 2008
and then changed their vote to the M5S in 2013. For example, in Treviso, a North-eastern city in the
heart of the Northern League territory, the defections reached 50%. In the Northern city of Monza,
46 % of former Ln voters shifted to the M5S. There is no doubt about the attraction M5S had on the
Ln voters all over the North. Much more so than in the case of Pdl voters. But in Monza itself 45 %
of voters of the radical left in 2008 and 59 % of Idv6 voters chose the M5S in 2013. The Pd and the
Pdl also contributed to the success of the M5S. For both parties this seems to be true more in the
Centre and in the South than in the North.
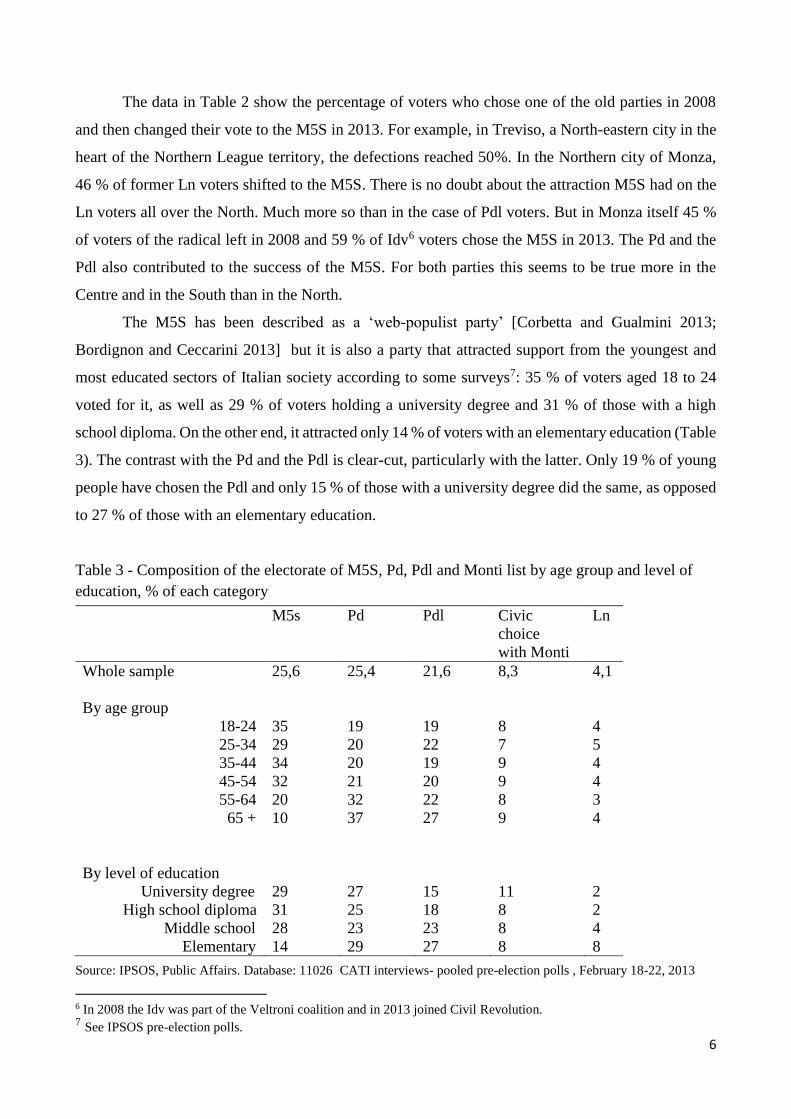
The M5S has been described as a ‘web-populist party’ [Corbetta and Gualmini 2013;
Bordignon and Ceccarini 2013] but it is also a party that attracted support from the youngest and
most educated sectors of Italian society according to some surveys7: 35 % of voters aged 18 to 24
voted for it, as well as 29 % of voters holding a university degree and 31 % of those with a high
school diploma. On the other end, it attracted only 14 % of voters with an elementary education (Table
3). The contrast with the Pd and the Pdl is clear-cut, particularly with the latter. Only 19 % of young
people have chosen the Pdl and only 15 % of those with a university degree did the same, as opposed
to 27 % of those with an elementary education.
Table 3 - Composition of the electorate of M5S, Pd, Pdl and Monti list by age group and level of
education, % of each category
Source: IPSOS, Public Affairs. Database: 11026 CATI interviews- pooled pre-election polls , February 18-22, 2013
6 In 2008 the Idv was part of the Veltroni coalition and in 2013 joined Civil Revolution. 7 See IPSOS pre-election polls.
M5s Pd Pdl Civic
choice
with Monti
Ln
Whole sample 25,6 25,4 21,6 8,3 4,1
By age group
18-24 35 19 19 8 4
25-34 29 20 22 7 5
35-44 34 20 19 9 4
45-54 32 21 20 9 4
55-64 20 32 22 8 3
65 + 10 37 27 9 4
By level of education
University degree 29 27 15 11 2
High school diploma 31 25 18 8 2
Middle school 28 23 23 8 4
Elementary 14 29 27 8 8

7
The M5S is also a ‘catch-all’ party from a social standpoint (Table 4). In terms of employment/non
employment status it received more votes than all the other parties from all the sectors excluding
retired people and housewives. Even among the self-employed, who have represented for a long time
one of the main sources of support for the right-wing parties, today the M5S does better than the Pdl.
On the other end, it is also the party that has attracted a higher percentage of manual workers,
unemployed and students than the Pd. The Pdl and the Pd do well only among the housewives (the
Pdl) and the retired (the Pd).
Table 4 - Composition of the electorate of M5S, Pd, Pdl and Monti list by type of work and public
vs. private employment, % of each category.
Source: IPSOS, Public Affairs. Database: 11026 CATI interviews- pooled pre-election polls , February 18-22, 2013
The youngest and the most dynamic sectors of Italian society seem to have chosen in these elections
the M5S. The M5S has been compared to a bus [Bordignon and Ceccarini 2012; Diamanti 2012]. As
I explained earlier, everybody can find something appealing in its program. But the real bond of its
composite electorate and the main reason of its present success maybe is the demand for change
which runs deep among people of any political affiliation. This demand has favoured a widespread
protest vote that Grillo and his movement have been able to capture thanks to a ‘post-ideological’
message, an effective campaign and an uncompromising stance against the old establishment.
M5s Pd Pdl Civic
choice
with Monti
Ln
Whole sample 25,6 25,4 21,6 8,3 4,1
Entrepreneurs,
professionals,
managers
25 23 17 13 3
Self-employed 39 15 20 7 3
Clerks/teachers 31 25 15 9 5
Manual workers 29 20 24 7 5
Unemployed 33 18 25 4 4
Students 37 23 11 9 1
Housewives 21 22 29 9 5
Retired 11 37 25 9 4
Public sector employees 31 29 14 9 4
Private sector employees 30 21 20 9 5

8
2. Methodology and research question
The basis of this analysis is the comparative method. The goal is to find out the factors which have a
greater impact on the propensity to vote for the Five Star Movement. Precisely, it will be a diachronic
comparison and being a large-n study, the analysis will rely on quantitative methods. I will use
statistical techniques to achieve inferences: in fact, I will build a multilevel random-effects regression
model8 with pooled data matrix in long format in order to test my hypotheses.
For the abovementioned reasons, I employ individual data (i.e. cross-section and panel surveys
data collected from November 2011 to March 2013) from “Osservatorio Politico Cise-Centro Italiano
di Studi Elettorali” (http://www.cise.luiss.it). In particular, I employ the voter-level survey data
collected from the cross-section survey9 held on November 2011 and the panel study10 held from
April 2012 to March 2013. The panel study is a longitudinal survey in which variables are measured
on the same units over time: in this case, respondents have been interviewed before and after the
general elections held on 24-25 February 2013. Panel surveys are particularly useful in order to
understand changes at the individual level. Furthermore, panel data can also be used to answer typical
cross-sectional questions about level and trend.
The analysis is divided into two stages: first, the relevant independent and dependent variables
have been selected; then, a pooled data matrix in long format and a multilevel random-effects
regression model have been built. I employed as dependent variable the propensity to vote for a party
(Ptv), following a proved measurement and an analysis strategy developed by some scholars [van der
Eijk and Franklin 1996; van der Eijk et al. 2006]. In order to organize the independent variables
related to individual characteristics, I have decided to follow the “funnel of causality” approach, the
theory elaborated by a group of University of Michigan researchers who, in the Sixties, created a
model regarding the influences of both sociological and psychological factors on voting behaviour
[Campbell, Converse et al. 1960; 1966]. This model describes the voting process in terms of a funnel
of causality: in the mouth of the funnel, there are the socio-economic conditions that generate
society’s main political divisions. These factors influence the structure of the party systems, but they
are far from the voting decisions of citizens. Moving along the funnel (on the bottom of which is the
voting decision), one sees how socio-economic conditions influence the primary groups and values
that are more explicitly tied to political attitudes. These attitudes are closely linked to the voting
decision and have a strong impact on voting behaviour. All these independent variables are related to
8 The multilevel regression command that I have applied in Stata 12 is xtreg, re that fits cross-sectional time-series
random-effects regression model by using the GLS estimator. 9 CATI interviews. 10 CATI and CAMI interviews.

9
different theories of party choice. We have to begin, therefore, with the socio-demographic variables,
those that are farthest away from the voting choice. The earliest academic voting studies stressed the
fact that membership in groups defined by social cleavages underlies voting choice [Lazarsfeld,
Berelson and Gaudet 1944; Berelson, Lazarsfeld and McPhee 1954]. The proper theoretical definition
of social cleavage theory, however, was made by Lipset and Rokkan [1967]: the origins of political
parties date back to the lines of social cleavages that underlay political divisions at the time of
introduction of mass suffrage. After selecting the socio-demographic variables11, it is necessary to
characterize the other independent variables: mass media used as source of political information12,
political awareness13, attitudes linked to values14, opinions on a specific issue15, which are all
variables that are closer to voting decisions according to the above cited “funnel of causality”
approach. Values are relatively stable convictions that carry out the function of providing a guideline
of attitudes and actions in several fields. The importance of issues is stressed by theories of issue
voting: voters compare their own position to that of parties defined in terms of specific issues. Voters
use such issues as criteria for choice (relevant summaries of the debate can be found in Converse
1975; Smith 1989; Dalton and Wattenberg 1993; Kuechler 1991). Finally, the last independent
variable which has to be included in the model is the self-placement along the left/right spectrum16.
Indeed, “rational choice” theories propose the idea that voters choose among candidates and parties
on the basis of alternative packages of policy outcomes. Alternative sets of policy proposals are often
encapsulated in more general ideological dimension; the most important one is the left/right
distinction [Downs 1957]. The assumption is that voters are able to characterize not only parties in
such terms, but themselves as well. The party choice can be viewed in terms of a comparison between
one’s own position and that of parties in terms of ideology.
As said before, the dependent variable is the propensity to vote (Ptv). The propensity to vote has
been measured by asking respondents to report separately for each party the likelihood that they will
ever vote for that party.
11 These variables are gender, age, education, profession, religion (church attendance), geographical area of residence. 12 In this case, I have created a dummy variable: 1 means “Internet” and 0 means “all other media”. With regard to the
media effects during an electoral campaign in Italy see Sani and Legnante [2001], Legnante [2002], Legnante and
Baldassarri [2010]. 13 Level of political interest of respondent measured on a four-point scale. 14 In this case, I have run a factor analysis (PCF) including variables linked to issues on moral topics (e.g. opinion on civil
partnership, on gay marriage, on euthanasia, on abortion) and variables showing attitudes towards other issues. The result
was two different factor components. Therefore, an additive index linked to the first factor component has been created
as an indicator of libertarian values. 15 In particular, opinion on the statement “Italy should leave the Euro system”. The position of the voter on this issue is
determined on a four point-scale with scores corresponding to “I strongly agree”, “I quite agree”, “I little agree”, “I don’t
agree at all”. 16 The political self-placement of respondent is measured on a scale from 0 to 10, where 0 means “left” and 10 means
“right”.

10
Moreover, we need a multilevel GLS random-effects model17 because of the structure of the data
consisting of multiple levels of nested groups. There are, indeed, two levels: waves and respondents.
Waves are nested within respondents. Random intercepts are specified at the respondent level, that is
the panel variable18. Indeed, GLS random effects models fits panel data.
These kind of data permit me to investigate whether the profile of voters and supporters of the Five
Star Movement has changed over time. Moreover, I am able to disentangle the factors which have a
greater impact on the propensity to vote for the Five Star Movement assuming that this is the main
goal of the current analysis. In this regard, I expect to discover changes over time both from a political
and social standpoint and at this aim, I run OLS regressions on the Ptv for the M5S, separately for
each wave of the study. In other words, I hypothesize that the factors influencing the propensity to
vote for the M5S have changed over time in a period characterized by an impressive electoral growth
of the M5S. In particular, my hypotheses are:
H1. Behind the electoral success of the M5S there is a generational divide: Young people are more
likely to vote for the M5S than adult and old people.
H2. Political self-placement based on the left-right dimension affects the propensity to vote for the
M5S only in the first waves. In other words, I expect that M5S originally collects consensus especially
on the left of the political space, but it loses this ideological characterization over time.
3. Findings
3.1. The profile of the Five Star Movement supporters
I proceeded to test my hypotheses by creating regression models. However, before examining the
results of the regression analysis, I have investigated whether the profile of supporters of the Five
Star Movement has changed over time, both from a political and a social standpoint. In order to do
that I used the individual data from “Osservatorio Politico-Cise” by cross-tabulating the propensity
to vote for the M5S and some political and socio-demographic variables. As said before, the
propensity to vote for the M5S has been measured on an eleven-point scale from “certainly would
never vote for this party” to “certainly would vote for this party at some time”. In this way, I can
17 See Verbeke and Molenberghs [2000]; Demidenko [2004]; Skrondal and Rabe-Hesketh [2004], Baltagi [2008],
McCulloch, Searle and Neuhaus [2008], Rabe-Hesketh and Skrondal [2008]; Wooldridge [2009] for good overviews of
fixed-effects and random-effects models. 18 In order to specify the panel variable in Stata 12 I have applied the xtset command.

11
identify the core supporters of the M5S. Indeed, the Ptv is useful for two reasons: first, it allows us to
detect the orientations of the whole sample, since almost all of the respondents answered these
questions (whereas with regard to the voting intentions only a minority responds, and for smaller
parties, such as M5S in the first waves, the number of cases is therefore very low); secondly, the Ptv
allows us to identify the electoral potential of a party by selecting those who show a high probability
to vote for that party. Therefore, I recoded the Ptv for the M5S into three categories: "very unlikely"
(values from 0 to 4), "maybe" (value of 5), "very likely" (values from 6 to 10 ). A Ptv value of more
than five thus indicates the electoral potential of a certain party and in the cross-tabulations I
considered the Ptv for the M5S only if it is more than five. In this way, I can outline the profile of the
M5S supporters over time.
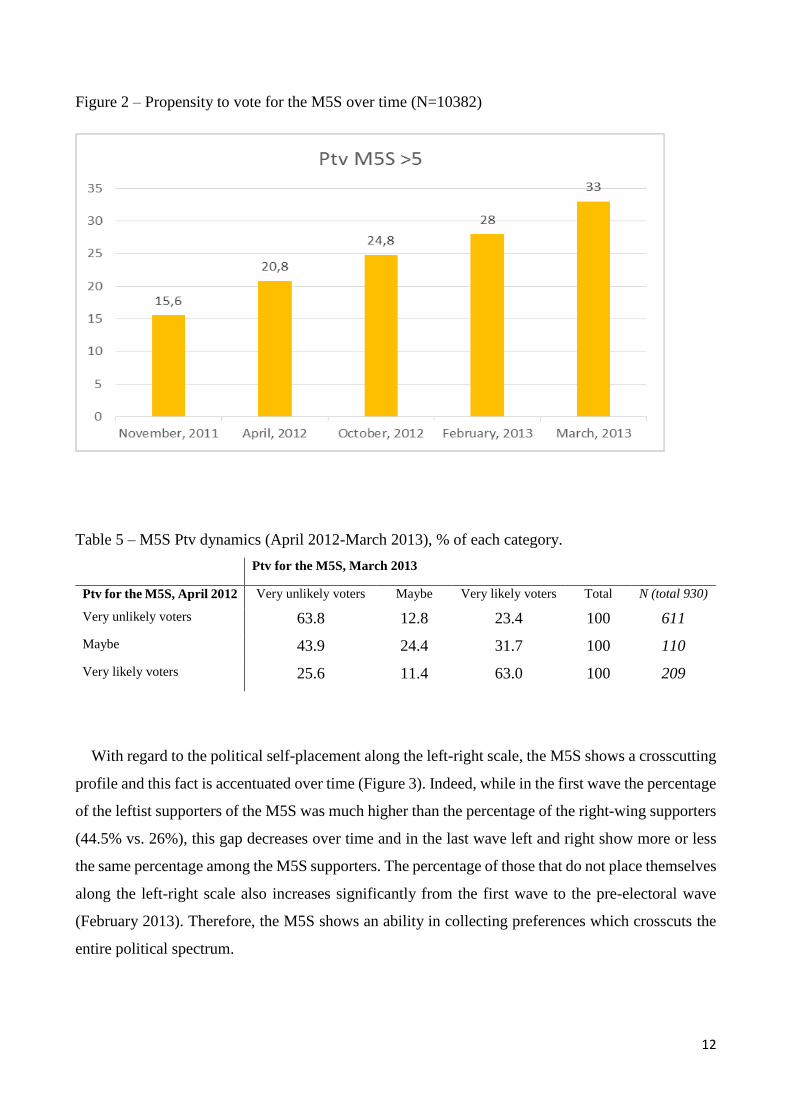
As it can be seen in Figure 2, electoral potential of the M5S increases linearly during our period of
investigation: in the first wave (November 2011) the M5S supporters (Ptv>5) represent the 15.6% of
respondents and in the post-electoral panel wave (March 2013) they represent the 33%. The trend
analysis suggests an increasing electoral potential of the M5S. But how great is the probability of
becoming a supporter of the M5S? In order to answer this question, I transformed data from long into
wide format and I calculated the percentage of individuals moving from very unlikely voters (Ptv
between 0 and 4) to very likely voters (Ptv>5). A simple cross-tabulation between the Ptv for the
M5S in April 2012 and the Ptv for M5S in March 2013 shows the percentage of people that moved
into or out the electoral potential of the M5S. The Ptv for M5S is distinguished into the three
aforementioned categories. Table 5 summarizes the results of the panel analysis and shows the Ptv
for the M5S of April 2012 in the rows and the Ptv for M5S of March 2013 in the columns. Of those
individuals that were very unlikely voters of the M5S in April 2012, 63.8% are also unlikely voters
of the M5S in March 2013, while 12.8% entered the “maybe” category and 23.4% became very likely
voters of the M5S in March 2013. Therefore, the probability of becoming a supporter of the M5S is
23.4%. Of those individuals that were very likely voters of the M5S in the first panel wave, 63% are
also very likely voters in the last panel wave, while 25.6% became very unlikely voters of the M5S
and 11.4% entered the “maybe” category in the last panel wave. The percentage of those who moved
into the electoral potential of the M5S is almost the same of those who became very unlikely voters
of the M5S. Those who stayed in their original status are around the 63%. Therefore, those who
changed their status are the minority. The category less stable over time is the “maybe” category. In
this case, those who changed their status are the majority: 43.9% became very unlikely voters and
31.7% became very likely voters of the M5S. In synthesis, it can be said that at the individual level
there is more stability than suggested by the trend analysis.
12
Figure 2 – Propensity to vote for the M5S over time (N=10382)
Table 5 – M5S Ptv dynamics (April 2012-March 2013), % of each category.
Ptv for the M5S, March 2013
Ptv for the M5S, April 2012 Very unlikely voters Maybe Very likely voters Total N (total 930)
Very unlikely voters 63.8 12.8 23.4 100 611
Maybe 43.9 24.4 31.7 100 110
Very likely voters 25.6 11.4 63.0 100 209
With regard to the political self-placement along the left-right scale, the M5S shows a crosscutting
profile and this fact is accentuated over time (Figure 3). Indeed, while in the first wave the percentage
of the leftist supporters of the M5S was much higher than the percentage of the right-wing supporters
(44.5% vs. 26%), this gap decreases over time and in the last wave left and right show more or less
the same percentage among the M5S supporters. The percentage of those that do not place themselves
along the left-right scale also increases significantly from the first wave to the pre-electoral wave
(February 2013). Therefore, the M5S shows an ability in collecting preferences which crosscuts the
entire political spectrum.

13
Figure 3 – Political profile of the M5S voters (Ptv>5) by self-placement along the left-right scale over
time (N=1397; 2949; 2513; 2031; 1492)
The M5S supporters show a crosscutting profile also from a socio-demographic standpoint. In
terms of gender, the potential voters of the M5S display more or less the same percentage of females
and males over time, with a prevalence of male supporters (Figure 4). Even if we look at the profile
of M5S potential voters by age group, we can notice that different generations are well represented
among the M5S supporters and not only the youngest ones (Figure 5). Indeed, in the first wave those
who are 18-35 years old represent the 33.1% of the electoral potential of the M5S and those who are
36-55 years old represent the 43.2% of the M5S supporters. In the last wave, those who are 18-35
years old still represent the 33.1% of the electoral potential of the M5S and those who are 36-55 years
old represent the 47.3% of the M5S supporters. Anyway, the young and the middle age groups are
over-represented among the M5S supporters with respect to the whole sample, whereas the two older
age groups are under-represented among the M5S potential voters if compared to the whole average.

14
Figure 4 - Socio-demographic profile of the M5S voters (Ptv>5) by gender over time (N=1397;
2949; 2513; 2031; 1492)
Figure 5 – Socio-demographic profile of the M5S voters (Ptv>5) by age group over time (N=1397;
2938; 2505; 2027; 1489)
The M5S supporters show a clear crosscutting profile also in terms of employment/non employment
status: Figure 6 is represented by a perfect rainbow over time. In particular, we can notice that in the
pre-electoral wave (just few days before the general elections) the retired people are the smallest
category, while the manual workers are the largest category. If we consider the level of education,

15
the profile of the M5S supporters is more clear-cut: in each wave, those holding a middle school and
a high school diploma represent the largest category among the M5S supporters. On the other end,
those with an elementary education are almost always the smallest category in the M5S electorate
(Figure 7).
Figure 6 - Socio-demographic profile of the M5S voters (Ptv>5) by profession over time (N=1393;
2941; 2511; 2031; 1492)
Figure 7 - Socio-demographic profile of the M5S voters (Ptv>5) by level of education over time
(N=1397; 2945; 2510; 2029; 1490)

16
Finally, it can be noticed that over time the relative share of M5S supporters from the Centre-South
increases, whereas those from the Red Zone and, to some extent, those from the North decrease
(Figure 8).
Figure 8 - Socio-demographic profile of M5S voters (Ptv>5) by geographical area of residence over
time (N=1397; 2936; 2503; 2028; 1489)
3.2. The determinants of the vote for the Five Star Movement
I have just described the profile of the M5S supporters and its changes over time in a period
characterized by the electoral growth of the Grillo’s movement ended up with the great success at the
2013 general elections. However, the main goal of the current analysis is to find out the factors which
have a greater impact on the propensity to vote for the M5S. For this purpose, as said in the previous
paragraph, I have created a multilevel GLS random-effects model. Furthermore, I have redefined the
dependent variable: it is no longer the Ptv for the M5S, but the “relative” Ptv for the M5S. That is to
say, I have calculated the mean Ptv for all the parties and I have subtracted it from the Ptv for the
M5S. In this way, I get a measure that permits us to consider the true propensity to vote for the M5S.
Indeed, there are respondents who give a high Ptv score not only to the M5S, but also to other parties:
these are not real M5S supporters and I need to take into account this fact by creating the relative Ptv
for the M5S. Then, I have included in the pooled model the set of independent variables presented in

17
the previous paragraph: socio-demographic variables19; political interest; Internet as main source of
political information; attitudinal variables (libertarian values index and opinions on the Euro
membership); political self-placement20. Furthermore, I have included in the model dummies
identifying the waves of the panel study21 in order to take into account the variance due to different
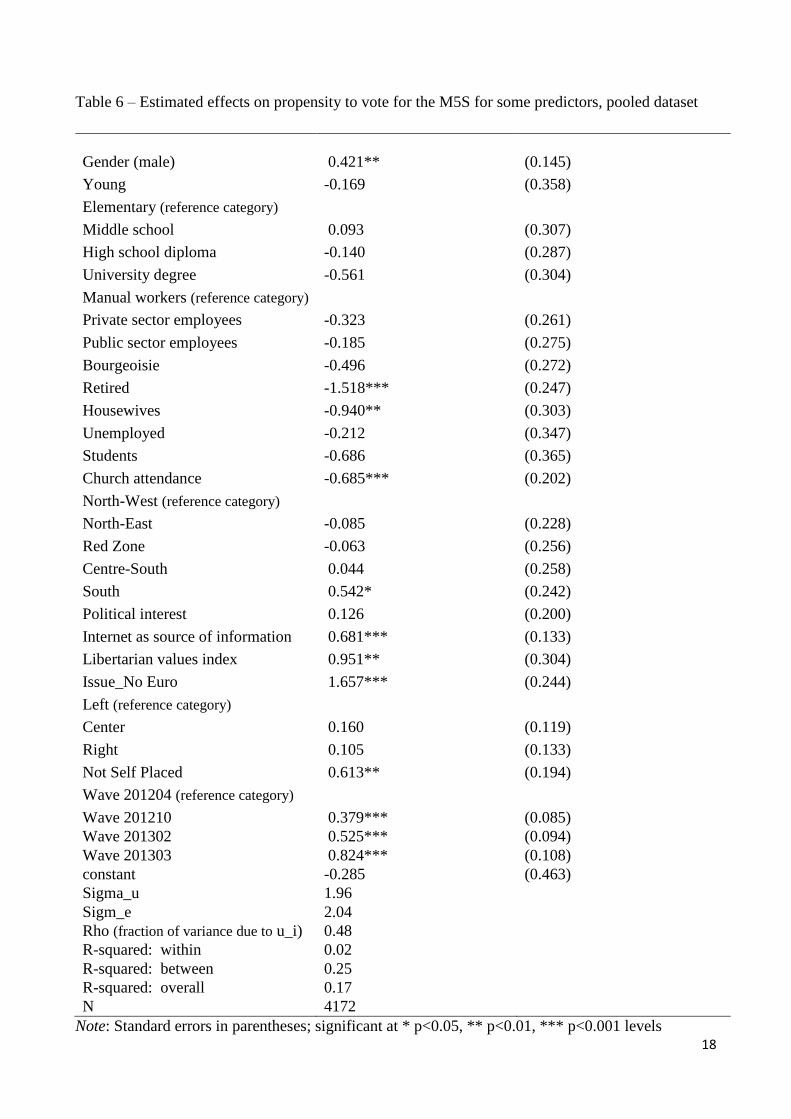
period effects. The results of estimation are presented in Table 6, which includes b coefficients (with
standard errors) as well as goodness-of-fit statistics. The table reports how differences in the
propensity to vote for the M5S (the dependent variable) are shaped by differences in the independent
variables. As we can see, the time/wave dummies are all statistically significant and their coefficients
increase linearly over time with respect to the reference category (i.e. the first wave of the panel).
Looking at the b coefficients and to the standard errors of the predictors, we can notice that gender,
some professional categories, church attendance, a specific geographical zone (i.e. the South),
Internet as main source of political information, the libertarian values index, the anti-Euro issue, a
specific category of the left-right dimension (i.e. those not self-placed along such dimension), are all
variables which have an influence on propensity to vote for the M5S. It is important to notice that
variables like education, age (“young dummy”) and political interest are not significant. The level of
education and the level of political involvement, such as the young age, do not seem to be linked to
the probability to vote for the M5S. This result is contrary to expectations because in the second
paragraph we have seen that the youngest and most educated people voted more for the M5S than for
the main parties. Anyway, young age and level of education are not explicative factors of the vote for
the M5S when others individual characteristics are taken into account. Therefore, H1 has not been
confirmed: young age is not a predictor of the Ptv for the M5S.
At the same time, ideological categories in terms of left and right do not matter. Indeed, Centre
and Right dummies with respect to Left dummy do not have any impact on the M5S support. This
means that there are no significant differences in terms of left and right among the M5S voters.
Conversely, the dummy identifying those who do not place themselves on the left-right dimension is
very significant at 1% level. In other words, the probability of voting for the M5S increases among
those who reject the traditional left-right axis in comparison with those who place themselves on the
left.
19 With regard to age, I have created a dummy identifying as young people all those who are 18-25 years old at the time
of the 2013 general election. 20 With regard to the political self-placement of respondents, I have recoded the left-right scale by creating four
dummies identifying “the left”, “the center”, “the right”, “those not self-placed”. 21 In the pooled analysis, I have considered only the panel study because in the 2011 cross-section survey there were not
some important questions (i.e. issues linked to Euro and to some moral topics, the question on mass media as source of
political information).
18
Table 6 – Estimated effects on propensity to vote for the M5S for some predictors, pooled dataset
Gender (male) 0.421** (0.145)
Young -0.169 (0.358)
Elementary (reference category)
Middle school 0.093 (0.307)
High school diploma -0.140 (0.287)
University degree -0.561 (0.304)
Manual workers (reference category)
Private sector employees
-0.323 (0.261)
Public sector employees -0.185 (0.275)
Bourgeoisie -0.496 (0.272)
Retired -1.518*** (0.247)
Housewives -0.940** (0.303)
Unemployed -0.212 (0.347)
Students -0.686 (0.365)
Church attendance -0.685*** (0.202)
North-West (reference category)
North-East -0.085 (0.228)
Red Zone -0.063 (0.256)
Centre-South 0.044 (0.258)
South 0.542* (0.242)
Political interest 0.126 (0.200)
Internet as source of information 0.681*** (0.133)
Libertarian values index 0.951** (0.304)
Issue_No Euro 1.657*** (0.244)
Left (reference category)
Center 0.160 (0.119)
Right 0.105 (0.133)
Not Self Placed 0.613** (0.194)
Wave 201204 (reference category)
Wave 201210 0.379*** (0.085)
Wave 201302 0.525*** (0.094)
Wave 201303 0.824*** (0.108)
constant -0.285 (0.463)
Sigma_u 1.96
Sigm_e 2.04
Rho (fraction of variance due to u_i) 0.48
R-squared: within 0.02
R-squared: between 0.25
R-squared: overall 0.17
N 4172
Note: Standard errors in parentheses; significant at * p<0.05, ** p<0.01, *** p<0.001 levels

19
If we look at the geographical area of residence, only the dummy identifying the South with respect
to the North-West is significant (at 5% level of statistical significance). This means that geographical
area of residence of respondent does not show a great discriminative ability among the M5S voters,
except the fact of living in the South. In this case, the probability of voting for the M5S increases
among those who live in the South in comparison with those who live in the North-West.
A greater impact on propensity to vote has been shown by some professional categories. The
categories of retired and housewives (in comparison with the category of manual workers) are
negatively correlated with the propensity to vote for the M5S and they are good predictors of the Ptv
for the M5S both in terms of strength of the coefficient and of level of statistical significance. These
dummies, indeed, are significant at 0.1% level (retired people) and at 1% level (housewives) and their
coefficients are high. In particular, the coefficient for housewives is -0.9 and the coefficient for the
retired is -1.5. This means that the probability of voting for the M5S hugely decreases among the
retired people and the housewives in comparison with the manual workers. Conversely, belonging to
the working class increases the probability to vote for the M5S. With regard to the occupational
categories not mentioned, there are not significant differences between such categories and manual
workers in terms of propensity to vote for the M5S. This means that the electoral support for the M5S
crosscuts all the sectors of the labour market.
A negative impact on propensity to vote for the M5S has been exercised by another sociological
variable: church attendance. Indeed, such variable shows a negative sign for the coefficient and it is
very significant at 0.1% level. This means that an increase in the church attendance is associated with
a decrease in the probability to vote for the M5S: supporters of Grillo’s movement are likely among
those who are not religious practitioners. This result is consistent with that for the index of libertarian
values. Indeed, such index is significant at 1% level and its coefficient is high, meaning that libertarian
values have an influence on propensity to vote for the M5S. Since the sign of the coefficient is
positive, we can say that people with libertarian opinions on moral topics are more likely to vote for
M5S. It is important to notice that the traditional dimension based on left and right does not have any
influence on Ptv for the M5S, whereas the cultural dimension linked to values does matter. This seems
to confirm what was suggested by Flanagan [1982], namely that a new social axis of political
polarization based on the distinction Authoritarian-Libertarian would have added to the political
space alongside the traditional economic axis based on the left-right distinction.
Finally, two variables are particularly linked to the propensity to vote for the M5S: the anti-Euro
issue and the dummy identifying Internet as main source of political information. Both variables are
very significant at 0.1% and their coefficient are 1.7 and 0.7, respectively. This means that anti-Euro
attitudes and the use of the web as main source of political information are associated with the

20
propensity to vote for the M5S. The first result leads to point out that for the M5S voters the European
Union is a matter of political distinction, maybe another axis of political polarization alongside the
cultural axis and the left-right axis (and the last one is not useful in order to explain the vote for M5S).
The second result is very interesting because it shows that the kind of media used in order to achieve
information about politics is an important factor when we want to explain the vote for the M5S. The
success of the M5S has been often interpreted as the consequence of a generational cleavage: a sort
of rebellion of young people, with a triumph of the M5S in the youngest age group. In reality, in our
regression model the dummy identifying the youngest voters is not significant from a statistical point
of view. Indeed, as we have seen previously, Grillo’s movement gets percentages above the average
in the age groups up to 54. Young people are not the only ones particularly attracted to the M5S.
Behind the electoral success of the M5S, there is not a generational divide, but maybe a technological
divide. Indeed, our data show that there is a strong relationship between the prevailing means of
political information and the propensity to vote for the M5S. People who get political information
mainly through the web are more likely to vote for the M5S, a movement that is present in a more
systematic, widespread and professional way on the Net if compared to the traditional parties.
Until now we have seen which are the factors linked to the propensity to vote for the Five Star
Movement. In order to discover if these factors have changed over time I have run OLS regressions
on the Ptv for the M5S, separately for each wave of the study (Table 7). In order to enlarge the time
span, I have considered also the data from the wave of November 2011. At this aim, I have included
in the regression models only the variables that are present in all the five waves.
As it can be seen in Table 7, there are changes over time with regard to the factors influencing the
propensity to vote for the M5S. For what concerns the socio-demographic variables, gender has an
influence on Ptv for the M5S only in Model B and in Model C (April and October 2012). In the pre-
electoral and post-electoral waves (Model D and Model E) this variable is no longer significant (as
in Model A, i.e. November 2011). In general, it can be said that gender is not one of the most powerful
predictors of Ptv for the M5S. With regard to the age effects, we have recoded age in different age
groups (each one represented by a dummy variable and the 18-25 age group is the reference category).
In Model B, the 26-35 age group is statistically significant (at 5% level) and positively correlated
with the propensity to vote for the M5S with respect to the youngest age group (18-25). Conversely,
in Model C and D those who are more than 55 years old are less likely to vote for the M5S with
respect to those who are 18-25 years old. In model E (the post-electoral wave), this is true for those
over 45. It has been confirmed that the M5S receives less support among the old voters, but there is
not difference from a statistical standpoint between young and middle-aged voters.

21
If we look at the level of education, it has been confirmed that this variable is not useful to explain
the propensity to vote for the M5S. Just two categories are significant in two waves: the dummy
identifying those with a high school diploma compared to those with elementary education in Model
A (at 1% level of significance) and the dummy identifying those with a university degree compared
to those with elementary education in Model C (at 5% level). In November 2011, those with a high
school diploma are more likely to vote for the M5S than those with elementary education, whereas
in October 2012 those with a university degree are less likely to vote for the M5S than those with
elementary education.
With regard to the employment/non employment status, it can be noticed that there are some
interesting changes over time. In the first three waves, this variable does not have any influence on
the Ptv for the M5S. In the pre-electoral wave (Model D), dummies for retired people and housewives
become significant at 5% level and negatively correlated with the propensity to vote for the M5S.
This point confirms the fact that the probability of voting for the M5S decreases among the retired
people and the housewives in comparison with the manual workers. In the post-electoral wave (Model
E), the categories of retired people and housewives are no longer significant, while the student dummy
becomes significant at 5% level and negatively associated with the Ptv for the M5S in comparison
with manual workers. These data tell us that in the post-electoral wave students are less likely to vote
for the M5S in comparison with manual workers. This is interesting because we have seen that young
people are more likely to vote for the M5S than old ones, and students are young. But if we take into
account the professional categories, students are not positively correlated with the Ptv for the M5S in
comparison with manual workers. It is not the young age, but the working class status that seems to
be associated with the M5S support.
With regard to another sociological variable (church attendance), there is continuity over time: it
always shows a negative sign for the beta coefficient and it is almost always very significant (except
in Model A, and D). This means that such variable is a powerful predictor of the propensity to vote
for the M5S: an increase in the church attendance is associated over time with a decrease in the
probability to vote for the M5S.
Conversely, the variable measuring the level of political interest of respondent is never significant,
except in October 2012 (when it gets the 0.1% level of significance and it is positively associated
with the Ptv for the M5S). In general, it has been confirmed that the level of political involvement is
not an explicative factor of the vote for the M5S.
As far as the geographical area of residence is considered, there are changes over time. In the first
wave, such variable is not significant. On the contrary, in the second wave (Model B) all the
geographical categories (except the South) become significant with respect to the reference category

22
(i.e. North-West) and are all negatively correlated with the Ptv for the M5S. This means that living
in the North-West increases the probability of voting for the M5S. This is true in particular in contrast
with those who live in the North-East and in the Red Zone: these dummies are significant at 1% level
and their (negative) beta coefficients are higher than the coefficient of the other geographical category
(i.e. Centre-South). Indeed, in Model C (October 2012) only the dummies for North-East and Red
Zone keep their statistical significance. This means that there is no longer difference between those
who live in the North-West and those who live in the Centre-South in terms of propensity to vote for
the M5S. Finally, in Model D (February 2013, few days before the elections) there is no longer
statistical difference between the different geographical areas of the country in terms of the propensity
to vote for the M5S. In Model E (March 2013) only the dummy identifying the South with respect to
the North-West is significant (at 1% level) and the sign of the association has changed becoming
positively correlated with the Ptv for the M5S. As said with regard to pooled analysis, this means that
geographical area of residence of respondent does not show a great discriminative ability among the
M5S voters, except the fact of living in the South. In this case, the probability of voting for the M5S
increases among those who live in the South in comparison with those who live in the North-West.
Therefore, from April 2012 to March 2013 the relationship between geography and vote for the M5S
has been reversed: living in the North-West does not increase any longer the probability of voting for
the M5S compared to living in the South, but the reverse is true.
Finally, the influence of ideological categories on the Ptv for the M5S also changes over time.
Indeed, Right dummy with respect to Left dummy is significant in Model A (November 2011), in
Model B (April 2012) and in Model C (October 2012). In particular, Right dummy is very significant
(at 0.1% level in Model A and B; at 1% level in Model C) and its beta coefficient is the highest one
in the first two waves. This ideological category is negatively correlated with the Ptv for the M5S:
placing on the Right of the political space decrease the probability of voting for the M5S. Conversely,
leftist respondents are more likely to vote for the M5S in the first three waves. Things change in the
last two waves: the dummy identifying those who do not place themselves on the left-right scale
becomes very significant (at 0.1% level), while the right-wing category is no longer significant. On
the contrary, in the first three waves the dummy identifying those who do not place themselves on
the left-right dimension was never significant. All this means that there are no longer significant
differences in terms of left and right among the M5S voters as previously shown by the pooled
analysis. Therefore, from November 2011 to March 2013 there was a sharp change from the
ideological point of view among the supporters of the M5S: being leftist does not increase any longer
the probability of voting for the M5S in comparison with those who are right-wing supporters,
whereas rejecting the left-right dimension increases the propensity to vote for the M5S. In other

23
words, according to H2, the M5S originally collects consensus especially on the left, but this
ideological characterization is lost over time. All this happens in a period of electoral growth for the
M5S and it confirms the crosscutting profile of Grillo’s movement.
As far as the pre-electoral wave is concerned, it can be noticed that few predictors are significant.
Such predictors are: age over 55 (in comparison with 18-25 age group), the categories of retired
people and housewives (in comparison with manual workers) and the category of those who do not
place themselves on the left-right dimension (in comparison with the leftist respondents). In other
words, few days before the 2013 general elections, the M5S shows a crosscutting profile in terms of
traditional socio-demographic and political variables underlying the party choice.

24
Table 7 – Estimated effects on propensity to vote for the M5S for some predictors over time
Model A (2011-11) Model B (2012-04) Model C (2012-10) Model D (2013-02) Model E (2013-03) beta s.e. beta s.e. beta s.e. beta s.e. beta s.e.
Gender (male) 0.036 (0.157) 0.065** (0.138) 0.076** (0.171) 0.045 (0.204) 0.042 (0.238)
Age 26-35 0.074 (0.434) 0.072* (0.288) 0.011 (0.393) -0.052 (0.586) 0.002 (0.592)
Age 36-45 0.037 (0.445) 0.077 (0.280) -0.009 (0.396) -0.012 (0.609) -0.068 (0.624)
Age 46-55 0.018 (0.458) -0.010 (0.295) -0.083 (0.408) -0.059 (0.608) -0.155* (0.637)
Age 56-65 -0.041 (0.485) -0.041 (0.333) -0.140** (0.423) -0.159* (0.643) -0.311*** (0.651)
Age 66+ -0.115 (0.489) -0.083 (0.364) -0.169** (0.484) -0.178* (0.674) -0.389*** (0.689)
Middle school 0.071 (0.230) 0.025 (0.245) -0.049 (0.301) -0.004 (0.353) 0.055 (0.444)
High school diploma 0.128** (0.256) 0.028 (0.250) -0.053 (0.296) -0.031 (0.352) 0.045 (0.437)
University degree 0.047 (0.265) -0.007 (0.278) -0.071* (0.317) -0.048 (0.384) -0.019 (0.469)
Private sector
employees employees
0.031 (0.375) -0.008 (0.256) -0.029 (0.294) 0.010 (0.404) -0.073 (0.446)
Public sector employees 0.027 (0.380) -0.002 (0.294) -0.032 (0.319) -0.070 (0.454) -0.062 (0.512)
Bourgeoisie 0.020 (0.378) 0.018 (0.307) -0.023 (0.321) -0.014 (0.440) -0.087 (0.485)
Retired 0.013 (0.359) -0.062 (0.316) -0.092 (0.354) -0.126* (0.428) -0.080 (0.493)
Housewives -0.009 (0.358) -0.009 (0.293) -0.031 (0.334) -0.096* (0.441) -0.066 (0.511)
Unemployed 0.062 (0.432) 0.016 (0.303) -0.026 (0.344) -0.024 (0.469) -0.063 (0.558)
Students 0.032 (0.507) -0.030 (0.333) -0.052 (0.475) -0.086 (0.657) -0.130* (0.700)
Church attendance -0.058 (0.051) -0.111*** (0.042) -0.072** (0.048) -0.049 (0.063) -0.140*** (0.068)
North-East -0.027 (0.288) -0.103** (0.250) -0.114** (0.251) -0.017 (0.368) 0.053 (0.330)
Red Zone -0.044 (0.301) -0.104** (0.262) -0.082* (0.276) 0.025 (0.377) 0.034 (0.365)
Centre-South -0.070 (0.323) -0.075* (0.276) -0.005 (0.293) 0.017 (0.396) 0.065 (0.410)
South -0.038 (0.294) -0.060 (0.253) 0.009 (0.280) 0.099 (0.387) 0.126** (0.369)
Political interest -0.003 (0.090) 0.031 (0.075) 0.114*** (0.100) 0.029 (0.126) 0.012 (0.145)
Centre -0.065 (0.228) -0.046 (0.177) 0.026 (0.207) -0.000 (0.274) 0.059 (0.277)
Right -0.216*** (0.202) -0.153*** (0.167) -0.093** (0.194) -0.025 (0.233) 0.031 (0.259)
Not Self Placed -0.036 (0.223) -0.026 (0.203) 0.025 (0.270) 0.172*** (0.378) 0.144** (0.598)
N 1387 2901 2482 2018 1482
R-squared 0.116 0.096 0.095 0.116 0.205
AIC 6270.8 14133.3 12409.8 10335.7 7466.2
BIC 6406.9 14288.6 12561.1 10481.6 7604.1
Note: Standardized beta coefficients; Standard errors in parentheses. Significant at * p<0.05, ** p<0.01, *** p<0.001 levels

25
As said previously, the results shown in Table 7 are not able to consider some important variables
included in the pooled analysis. These variables are the libertarian values index, the anti-Euro issue
and the dummy identifying Internet as main source of political information for respondent. According
to the pooled analysis, all these variables affect the propensity to vote for the M5S. Therefore, I
included such variables in the OLS regression models only for the panel waves. Table 8 shows the
goodness-of-fit of OLS regressions for each panel wave comparing the model without these three
predictors (base model) and the model that includes these predictors (full model). It can be noticed
that in each panel wave the variance explained by the full model is much more than the variance
explained by the base model: 17% vs. 10% in April 2012; 16% vs. 10% in October 2012; 21% vs.
12% in February 2013; 29% vs. 21% in March 2013. Including in the regression models three
variables (Internet dummy, anti-Euro issue and libertarian values index) increase the R-squared by
0.077 in April 2012 survey, by 0.068 in October 2012 survey, by 0.091 in February 2013 survey and
by 0.087 in March 2013 survey. Therefore, the overall predictive power of the full model is always
greater than the overall predictive power of the base model. Furthermore, AIC and BIC coefficients
for the full model decrease considerably in each wave with respect to the base model: the lower the
AIC and BIC coefficients, the better the model fits the data. All this means that the goodness-of-fit
of the regression models increases significantly when media related variable and variables linked to
values and to attitudes towards the European Union are taken into accounts. Using Internet as main
source of political information, being open-mind with regard to moral topics and having negative
attitudes towards the Euro increase the probability of voting for the M5S.
Table 8 – Goodness-of-fit of OLS regressions for each panel wave, base model and full model
compared
2012-04 2012-10 2013-02 2013-03
Base model R-squared 0.096 0.095 0.116 0.205
AIC 14133.3 12409.8 10335.7 7466.2
BIC 14288.6 12561.1 10481.6 7604.1
Full model* R-squared 0.173 0.163 0.207 0.292
AIC 5301.7 5479.7 5446.4 4414.8
BIC 5446.4 5624.5 5591.2 4553.8
* libertarian values index, anti-euro issue and internet as source of information added.

26
4. Concluding remarks
The present article had the purpose to investigate what stands behind the electoral growth of the Five
Star Movement. We opened the article describing the electoral results of the general elections held
in Italy on 24-25 February 2013, focusing on the main features of the M5S electoral success. Moving
from the most important theories related to the individual voting behaviour, this article aimed at
answering some important questions raised in the second paragraph from an empirical perspective. I
wondered if the profile of the M5S supporters has changed over time. The results show that the M5S
has a crosscutting profile both from a political and sociological standpoint, with some changes over
time. In particular, while in November 2011 the percentage of the leftist supporters of the M5S was
much more than the percentage of the right-wing supporters, this gap decreases over time and in
March 2013 left and right show more or less the same percentage among the M5S supporters.
Moreover, the percentage of those that do not place themselves along the left-right scale increases
significantly over time. In addition, it can be noticed that over time the relative share of M5S
supporters from the Centre-South increases, whereas those from the Red Zone and, to some extent,
those from the North decrease.
Furthermore, I was interested to discover which factors have a greater impact on propensity to vote
for the M5S and how these factors have changed over time. Through the use of multilevel and OLS
regression models applied to individual data from “Osservatorio Politico-CISE” (i.e. cross-section
and panel surveys conducted from November 2011 to March 2013), I tested the impact of some
individual characteristics on the Ptv – the propensity to vote for the M5S– which in turn represented
the dependent variable of the analysis. I expected that young age was an important predictor of the
Ptv for the M5S and I hypothesized that the impact of some variables (in particular political self-
placement) could change over time.
The findings are interesting and, to a certain extent, surprising. Indeed, according to several surveys
(some of them reported in the first paragraph) the youngest and most educated people voted more for
the M5S than for the main parties. Contrary to the expectation, the analysis shows that young age
(18-25) is not an explicative factor of the vote for the M5S when others individual characteristics are
taken into account. Furthermore, level of education and political involvement are not predictors of
the propensity to vote for the M5S. Not even geography matters, if we do not consider that living in
the South increases the probability of voting for the M5S compared to living in the North-West. In
order to explain the M5S support, other variables are more important, in particular attitudes towards
the Euro, one media-related variable (the use of the web as main source of political information),
church attendance, the cultural dimension based on the distinction Libertarian-Authoritarian and the

27
rejection of political dimension based on left and right. Furthermore, the probability of voting for the
M5S decreases consistently among the housewives and the retired people in comparison with the
manual workers. On the contrary, there are not significant differences between manual workers and
the other occupational categories in terms of propensity to vote for the M5S.
Factors explaining the propensity to vote for the M5S and their relative importance have changed
over time. In particular, as I expected, this is true for political self-placement and also for territorial
variables and, to some extent, for social-class related variables. From November 2011 to March 2013,
there was a sharp change with regard to political self-placement: being leftist does not increase any
longer the probability of voting for the M5S in comparison with those who are right-wing supporters,
while rejecting the left-right dimension increases the propensity to vote for the M5S. In other words,
the M5S originally collects consensus especially on the left of the political space, but this ideological
characterization is lost over time. Moreover, from April 2012 to March 2013 the relationship between
geography and vote for the M5S has been reversed: living in the North-West does not increase any
longer the probability of voting for the M5S compared to living in the South, but the reverse is true.
With regard to social-class-related variables, in the first three waves (from November 2011 to October
2012) employment/non employment status does not have any influence on the Ptv for the M5S.
Afterwards, being retired or housewife affects negatively the propensity to vote for the M5S in
comparison with manual workers. In the last wave (i.e. the post-electoral), students are less likely to
vote for the M5S in comparison with manual workers. As far as the other professional categories are
concerned, there are no longer differences in terms of the propensity to vote for the M5S.
In conclusion, it can be said that some sociological and media-related variables and variables linked
to values and to attitudes towards the European Union have an important influence on the M5S
support. More precisely, using Internet as main source of political information, having negative
attitudes towards the Euro, rejecting the left-right dimension, being not a religious practitioner and
being open-mind with regard to moral topics increase the probability of voting for the M5S. It has to
point out that for the M5S voters the European Union is a matter of political distinction, maybe
another axis of political polarization alongside the cultural axis and the left-right axis (and the last
one is not useful in order to explain the vote for the M5S). Furthermore, behind the electoral success
of the M5S there is not a generational divide, but a technological divide. Indeed, our data show that
there is a strong relationship between the use of Internet as main source of political information and
the propensity to vote for the M5S.

28
References
Baccetti, C. and Messina, P. [2009], L’eredità. Le subculture politiche della Toscana e del Veneto,
Torino, Liviana.
Baltagi, B. H. [2008], Econometric Analysis of Panel Data, 4th edition, Chichester, John Wiley &
Sons.
Berelson, B., Lazarsfeld, P. F. and Mcphee, W. N. [1954], Voting. A study of opinion formation in a
presidential campaign, Chicago, University of Chicago Press.
Bordignon, F. and Ceccarini, L. [2013], Five Stars and a Cricket. Beppe Grillo Shakes Italian
Politics, in “South European Society and Politics”, DOI:10.1080/13608746.2013.775720.
Bordignon, F. and Ceccarini, L. [2012], 5 Stelle, un autobus in MoVimento, Il Mulino, 5: 808–816.
Bosco, A. and McDonnell, D. [2012], Introduzione. Da Berlusconi a Monti: default dei partiti?, in
“Politica in Italia. I fatti dell’anno e le interpretazioni. Edizione 2012”,( eds) A. Bosco and D.
McDonnell, Bologna, Il Mulino: 43–61.
Campbell, A., Converse, P.E., Miller, W.E., and Stokes, D. [1960], The American Voter, New York,
London, Wiley.
Campbell, A., Converse, P.E., Miller, W.E., and Stokes, D. [1966], Elections and the political Order,
New York, Wiley.
Cataldi, M. and Emanuele, V. [2013], Lo tsunami cambia la geografia e strappa 50 province a Pd e
Pdl, in L. De Sio, M. Cataldi and F. De Lucia (eds.), Le elezioni politiche 2013, Dossier CISE
Nr. 4, Roma, CISE, available on line at cise.luiss.it.
Ceccarini, L., Diamanti, I. and Lazar, M. [2012], Fine di un ciclo: la destrutturazione del sistema
partitico italiano, in Politica in Italia. I fatti dell’anno e le interpretazioni. Edizione 2012,
(eds) A.Bosco and D. McDonnell, Bologna, Il Mulino: 63–82.
Chiaramonte, A. [2007], Il nuovo sistema partitico italiano tra bipolarismo e frammentazione, in R.
D’Alimonte and A. Chiaramonte (eds), Proporzionale ma non solo. Le elezioni politiche del
2006, Bologna, Il Mulino: 369-406.
Chiaramonte, A. [2010], Dal bipolarismo frammentato al bipolarismo limitato? Evoluzione del
sistema partitico italiano, in R. D'Alimonte and A. Chiaramonte (eds), Proporzionale se vi
pare. Le elezioni politiche del 2008, Bologna, Il Mulino: 203-228.
Converse, P. E. [1975], Public Opinion and Voting Behavior in Fred -I. Greenstein and Nelson W.
Polsby (eds.), Handbook of Political Science, Vol. 4. Reading, Mass.: Addison-Wesley.
Corbetta P. and Gualmini, E. (eds.) [2013], Il partito di Grillo, Bologna, Il Mulino.
Dalton, R. J., Wattenberg, M. P. [1993], The Not Simple Act of Voting in Political Science: The State
of the Discipline, Ada Finifter, American Political Science Association: 193-218.

29
Demidenko, E. [2004], Mixed Models: Theory and Applications, Hoboken, NJ, Wiley.
De Sio, L. (ed) [2011], La polita cambia i valori restano? Una ricerca sulla cultura politica dei
cittadini toscani, Firenze, Florence University Press.
De Sio, L., Cataldi, M. and De Lucia, F. (eds.) [2013], Le elezioni politiche 2013, Dossier CISE Nr.
4, Roma, CISE, available on line at cise.luiss.it.
Diamanti, I. [2010], Le subculture territoriali sono finite. Quindi (re)esistono, in C. Baccetti et al.
(eds), La politica e le radici, Torino, Liviana.
Diamanti, I. [2012], L’autobus di Grillo nel paese della politica-che-non-c’e`, available online: at
www.Repubblica.it, 13 July.
Downs, A. [1957], An Economic Theory of Democracy, It. Trans. [1988], Teoria Economica della
Democrazia, Bologna, Il Mulino.
van der Eijk, C. and Franklin, M. N. [1996], Choosing Europe? The European Electorate and
National Politics in the Face of the Union, Ann Arbor, MI, The University of Michigan Press.
van der Eijk, C., van der Brug, W., Kroh, M., and Franklin, M. N. [2006], Rethinking the Dependent
Variable in Voting Behavior: On the Measurement and Analysis of Electoral Utilities, in
“Electoral Studies”, 25 (3): 424-447.
Flanagan, S.C. [1982], Changing Values in Advanced Industrial Societies, in “Comparative Political
Studies”, 14 (4): 403-444.
Floridia, A. [2010], Le subculture politiche territoriali in Italia: epilogo o mutamento? in C. Baccetti
et al. (eds), La politica e le radici, Torino, Liviana.
Kuechler, M. [1991], Issues and Voting in the European Elections 1989, in “European Journal of
Political Research”, 19: 81-103.
Lazarsfeld, P., Berelson, B., Gaudet, H. [1944], The People’s Choice. How the Voter Makes up his
Mind in a Presidential Campaign, New York, Columbia University Press.
Legnante, G. [2002], Tra influenza e incapsulamento: cittadini, comunicazione e campagna
elettorale, in M. Caciagli e P. Corbetta (eds), Le ragioni dell’elettore: perché ha vinto il
centro-destra nelle elezioni italiane del 2001, Bologna, Il Mulino: 233-273.
Legnante, G. and Baldassarri, D. [2010], Campagne elettorali e mediazione sociale: esposizione ai
media e relazioni interpersonali, in P. Bellucci and P. Segatti (eds), Bologna, Il Mulino: 249-
288.
Lipset, S.M. and Rokkan, S. [1967], Cleavage Structures, Party Systems and Voter Alignments: An
Introduction, in S.M. Lipset and S. Rokkan (eds), Party Systems and Voter Alignments: Cross-
National Perspectives, New York, The Free Press: 1-64.
McCulloch, C. E., Searle, S.R., and Neuhaus, J.M. [2008], Generalized, Linear, and Mixed Models,
2nd ed. Hoboken, NJ, Wiley.

30
Natale, P. and Biorcio, R. [2013], Politica a 5 Stelle. Idee, storia e strategie del movimento di Grillo,
Milano, Feltrinelli.
Rabe-Hesketh, S., and Skrondal, A. [2008], Multilevel and Longitudinal Modeling Using Stata, 2nd
ed. College Station, TX, Stata Press.
Sani, G., and Legnante, G. [2001], La comunicazione politica in televisione (1998-1999), in G. Sani
(eds), Mass media ed elezioni, Bologna, Il Mulino: 127-158.
Skrondal, A., and Rabe-Hesketh, S. [2004], Generalized Latent Variable Modeling: Multilevel,
Longitudinal, and Structural Equation Models, Boca Raton, FL, Chapman & Hall/CRC.
Smith, E. R. A. N. [1989], The Unchanging American Voter, Berkeley and Los Angeles, University
of California Press.
Wooldridge, J. [2009], Introductory Econometrics: A Modern Approach, 4th ed. Mason, OHSouth-
Western College.
Verbeke, G., and Molenberghs, G. [2000], Linear Mixed Models for Longitudinal Data, New York,
Springer.