7th international forum russian power 2006
TRANSCRIPT
Confidential
The Russian Power 2006
7th International Forum
Alexander Abolmasov
Alternative energy vs Traditional
Zindel Investment Partners
2
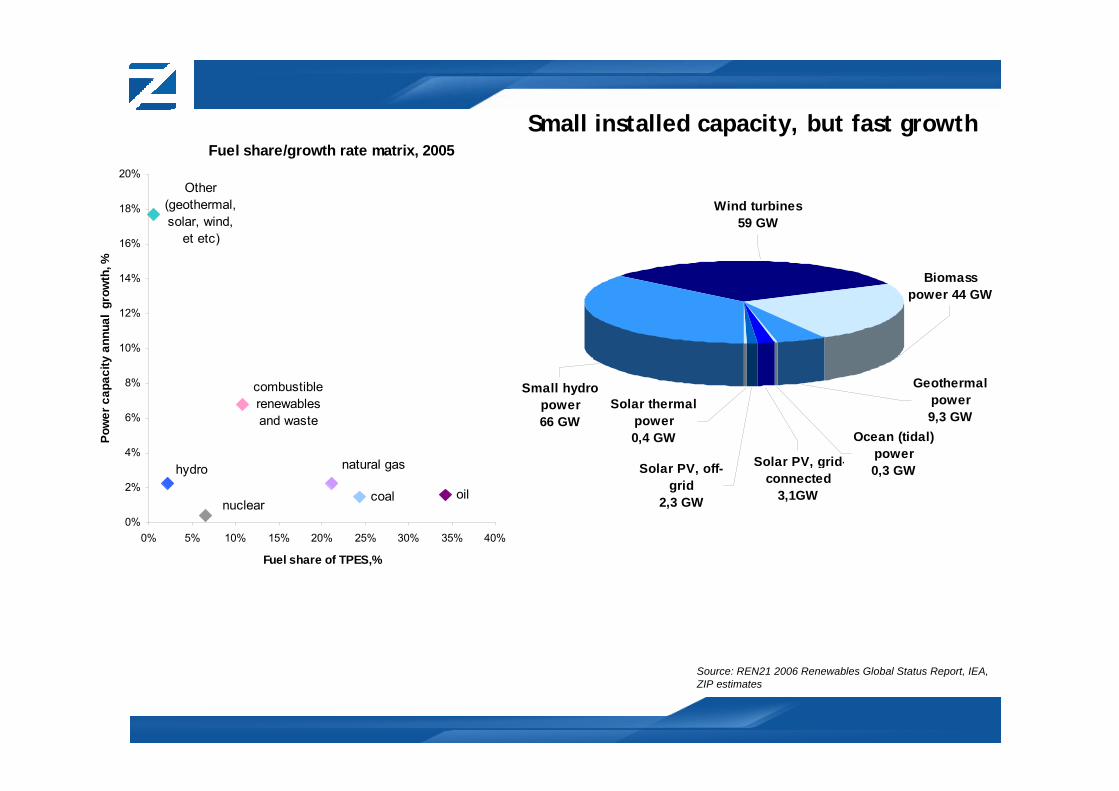
Small installed capacity, but fast growth
Renewable Energy Existing Capacities, 2005
Fuel share/growth rate matrix, 2005
oilcoal
combustible renewables and waste
Other (geothermal,solar, wind,
et etc)
natural gas
nuclear
hydro
0%
2%
4%
6%
8%
10%
12%
14%
16%
18%
20%
0% 5% 10% 15% 20% 25% 30% 35% 40%
Fuel share of TPES,%
Pow
er c
apac
ity a
nnua
l gr
owth
, %
Ocean (tidal) power0,3 GWSolar PV, grid-
connected3,1GW
Solar PV, off-grid
2,3 GW
Solar thermal power0,4 GW
Geothermal power9,3 GW
Biomass power 44 GW
Small hydro power 66 GW
Wind turbines 59 GW
Source: REN21 2006 Renewables Global Status Report, IEA, ZIP estimates
3
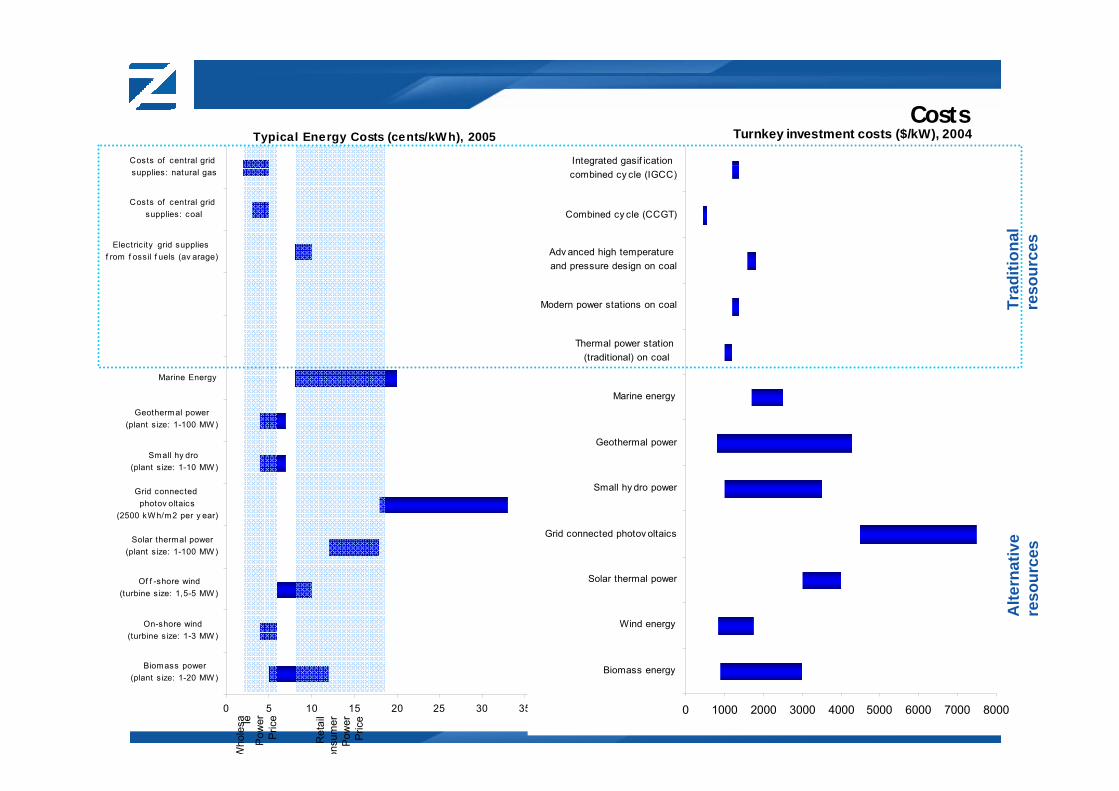
Typical Energy Costs (cents/kWh), 2005
0 5 10 15 20 25 30 35
Biomass power(plant size: 1-20 MW)
On-shore wind(turbine size: 1-3 MW)
Of f -shore wind(turbine size: 1,5-5 MW)
Solar thermal power(plant s ize: 1-100 MW)
Grid connected photov oltaics
(2500 kWh/m2 per y ear)
Small hy dro (plant size: 1-10 MW)
Geothermal power(plant s ize: 1-100 MW)
Marine Energy
Electric ity grid supplies f rom f ossil f uels (av arage)
Costs of central grid supplies: coal
Costs of central grid supplies: natural gas
Turnkey investment costs ($/kW), 2004
0 1000 2000 3000 4000 5000 6000 7000 8000
Biomass energy
Wind energy
Solar thermal power
Grid connected photov oltaics
Small hy dro power
Geothermal power
Marine energy
Thermal power station (traditional) on coal
Modern power stations on coal
Adv anced high temperature and pressure design on coal
Combined cy cle (CCGT)
Integrated gasif ication combined cy cle (IGCC)
Costs
Who
lesa le
Pow
erP
rice
Ret
ail
onsu
mer
Pow
erP
rice
Trad
ition
al
reso
urce
sA
ltern
ativ
e re
sour
ces
4
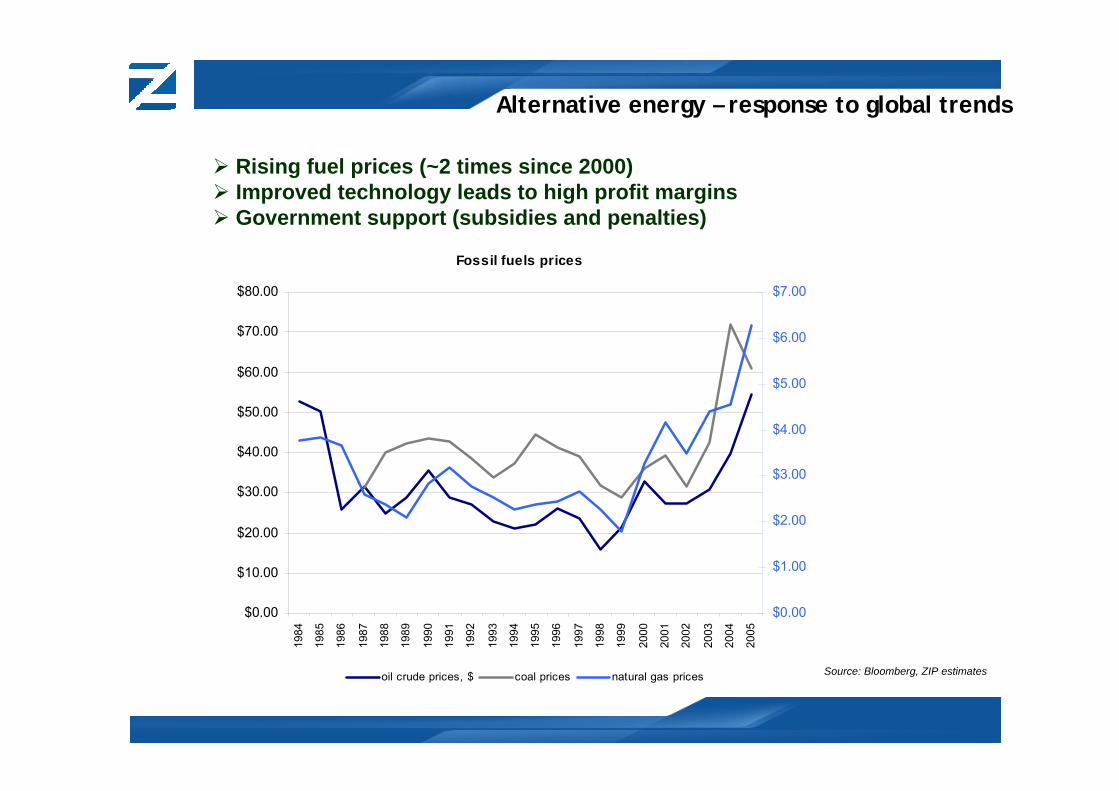
Alternative energy – response to global trends
Fossil fuels prices
$0.00
$10.00
$20.00
$30.00
$40.00
$50.00
$60.00
$70.00
$80.0019
84
1985
1986
1987
1988
1989
1990
1991
1992
1993
1994
1995
1996
1997
1998
1999
2000
2001
2002
2003
2004
2005
$0.00
$1.00
$2.00
$3.00
$4.00
$5.00
$6.00
$7.00
oil crude prices, $ coal prices natural gas prices Source: Bloomberg, ZIP estimates
Rising fuel prices (~2 times since 2000)Improved technology leads to high profit marginsGovernment support (subsidies and penalties)
5
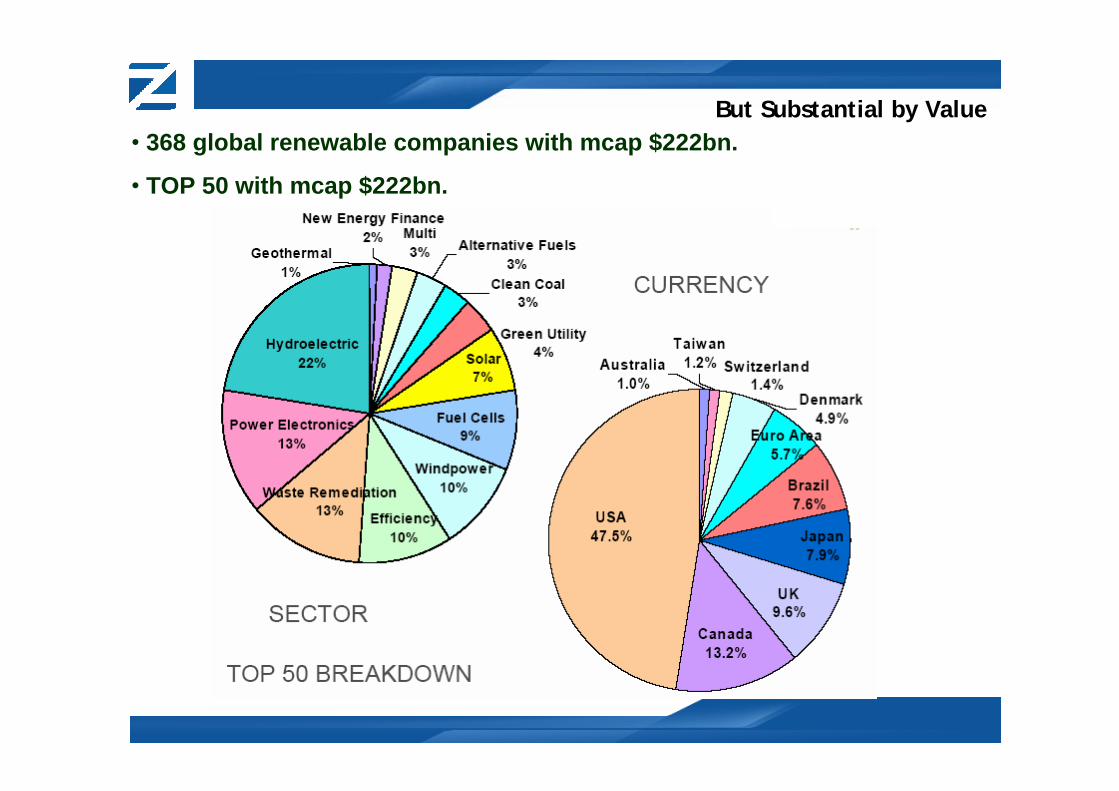
• 368 global renewable companies with mcap $222bn.
• TOP 50 with mcap $222bn.
But Substantial by Value
6
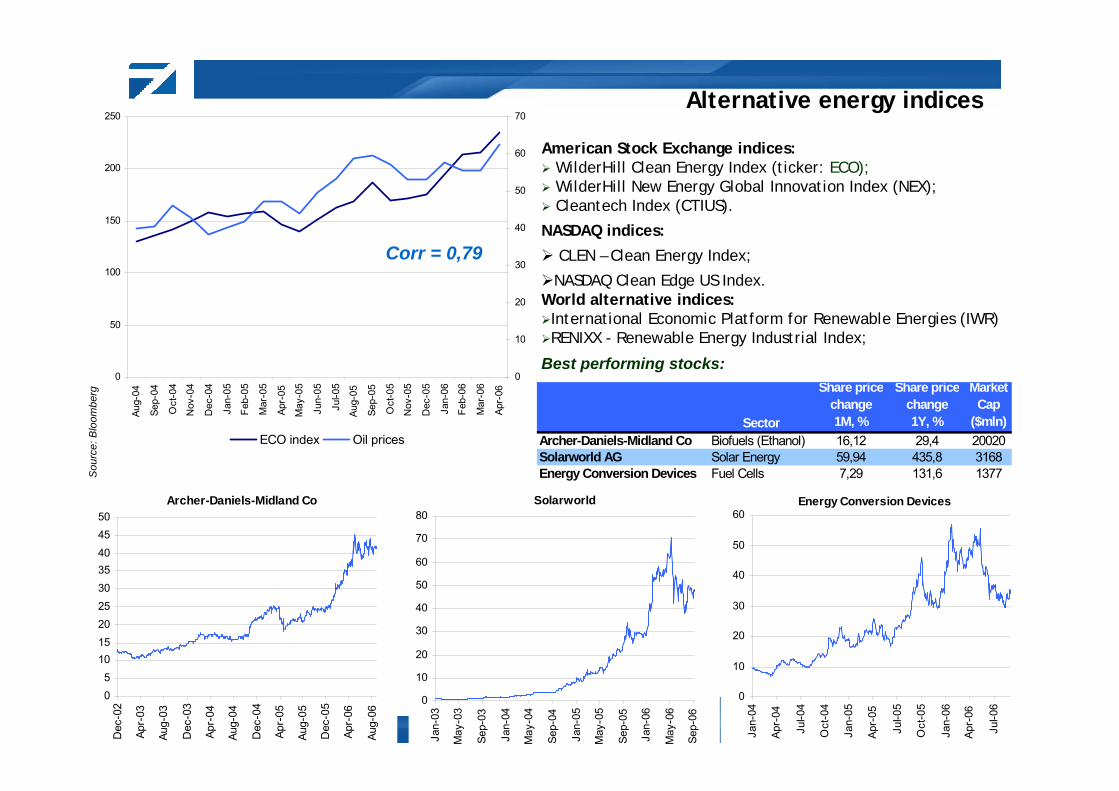
Alternative energy indices
American Stock Exchange indices:WilderHill Clean Energy Index (ticker: ECO);WilderHill New Energy Global Innovation Index (NEX);Cleantech Index (CTIUS).
NASDAQ indices:
CLEN – Clean Energy Index;
NASDAQ Clean Edge US Index.World alternative indices:International Economic Platform for Renewable Energies (IWR)RENIXX - Renewable Energy Industrial Index;
0
50
100
150
200
250
Aug-
04
Sep-
04
Oct
-04
Nov
-04
Dec
-04
Jan-
05
Feb-
05
Mar
-05
Apr-
05
May
-05
Jun-
05
Jul-0
5
Aug-
05
Sep-
05
Oct
-05
Nov
-05
Dec
-05
Jan-
06
Feb-
06
Mar
-06
Apr-
06
0
10
20
30
40
50
60
70
ECO index Oil prices
Corr = 0,79
Archer-Daniels-Midland Co
05
101520253035404550
Dec
-02
Apr-
03
Aug-
03
Dec
-03
Apr-
04
Aug-
04
Dec
-04
Apr-
05
Aug-
05
Dec
-05
Apr-
06
Aug-
06
Solarworld
0
10
20
30
40
50
60
70
80
Jan-
03
May
-03
Sep-
03
Jan-
04
May
-04
Sep-
04
Jan-
05
May
-05
Sep-
05
Jan-
06
May
-06
Sep-
06
Energy Conversion Devices
0
10
20
30
40
50
60
Jan-
04
Apr-
04
Jul-0
4
Oct
-04
Jan-
05
Apr-
05
Jul-0
5
Oct
-05
Jan-
06
Apr-
06
Jul-0
6
Sector
Share pricechange 1M, %
Share pricechange 1Y, %
MarketCap
($mln)Archer-Daniels-Midland Co Biofuels (Ethanol) 16,12 29,4 20020Solarworld AG Solar Energy 59,94 435,8 3168Energy Conversion Devices Fuel Cells 7,29 131,6 1377
Best performing stocks:
Sou
rce:
Blo
ombe
rg
7
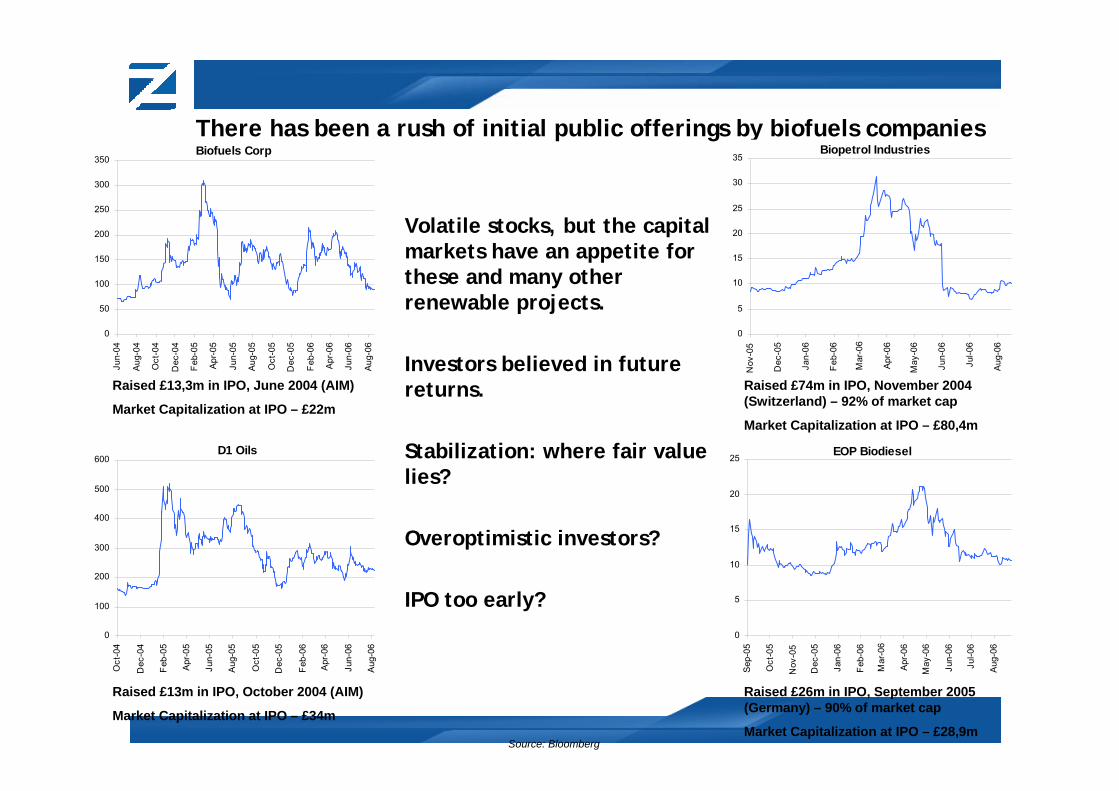
There has been a rush of initial public offerings by biofuels companies
Volatile stocks, but the capital markets have an appetite for these and many other renewable projects.
Investors believed in future returns.
Stabilization: where fair value lies?
Overoptimistic investors?
IPO too early?
Biofuels Corp
0
50
100
150
200
250
300
350
Jun-
04
Aug
-04
Oct
-04
Dec
-04
Feb
-05
Apr
-05
Jun-
05
Aug
-05
Oct
-05
Dec
-05
Feb
-06
Apr
-06
Jun-
06
Aug
-06
D1 Oils
0
100
200
300
400
500
600
Oct
-04
Dec
-04
Feb
-05
Apr
-05
Jun-
05
Aug
-05
Oct
-05
Dec
-05
Feb
-06
Apr
-06
Jun-
06
Aug
-06
Biopetrol Industries
0
5
10
15
20
25
30
35
Nov
-05
Dec
-05
Jan-
06
Feb
-06
Mar
-06
Apr
-06
May
-06
Jun-
06
Jul-0
6
Aug
-06
EOP Biodiesel
0
5
10
15
20
25
Sep
-05
Oct
-05
Nov
-05
Dec
-05
Jan-
06
Feb
-06
Mar
-06
Apr
-06
May
-06
Jun-
06
Jul-0
6
Aug
-06
Raised £13,3m in IPO, June 2004 (AIM)
Market Capitalization at IPO – £22m
Raised £13m in IPO, October 2004 (AIM)
Market Capitalization at IPO – £34m
Raised £74m in IPO, November 2004 (Switzerland) – 92% of market cap
Market Capitalization at IPO – £80,4m
Raised £26m in IPO, September 2005 (Germany) – 90% of market cap
Market Capitalization at IPO – £28,9mSource: Bloomberg
8
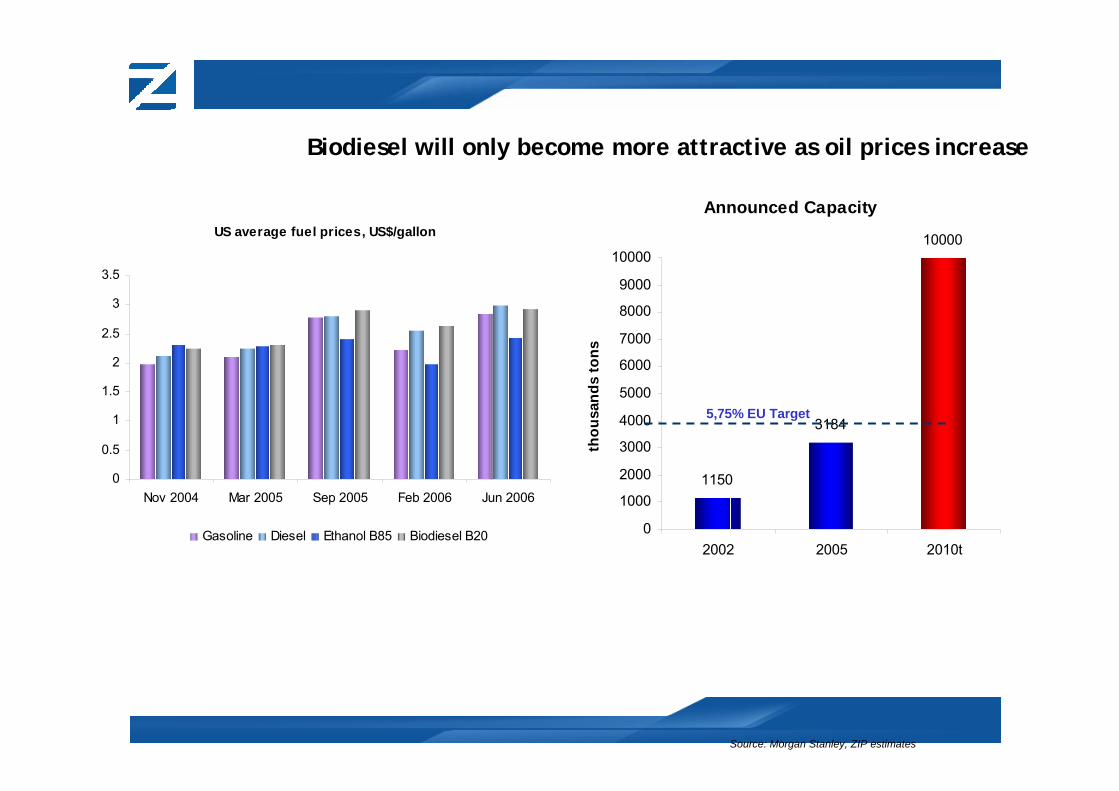
Announced Capacity
1150
3184
10000
0
1000
2000
3000
4000
5000
6000
7000
8000
9000
10000
2002 2005 2010t
thou
sand
s to
ns
Biodiesel will only become more attractive as oil prices increase
5,75% EU Target
Source: Clean Cities Alternative Fuel Report, DOE
Source: Morgan Stanley, ZIP estimates
US average fuel prices, US$/gallon
0
0.5
1
1.5
2
2.5
3
3.5
Nov 2004 Mar 2005 Sep 2005 Feb 2006 Jun 2006
Gasoline Diesel Ethanol B85 Biodiesel B20
9
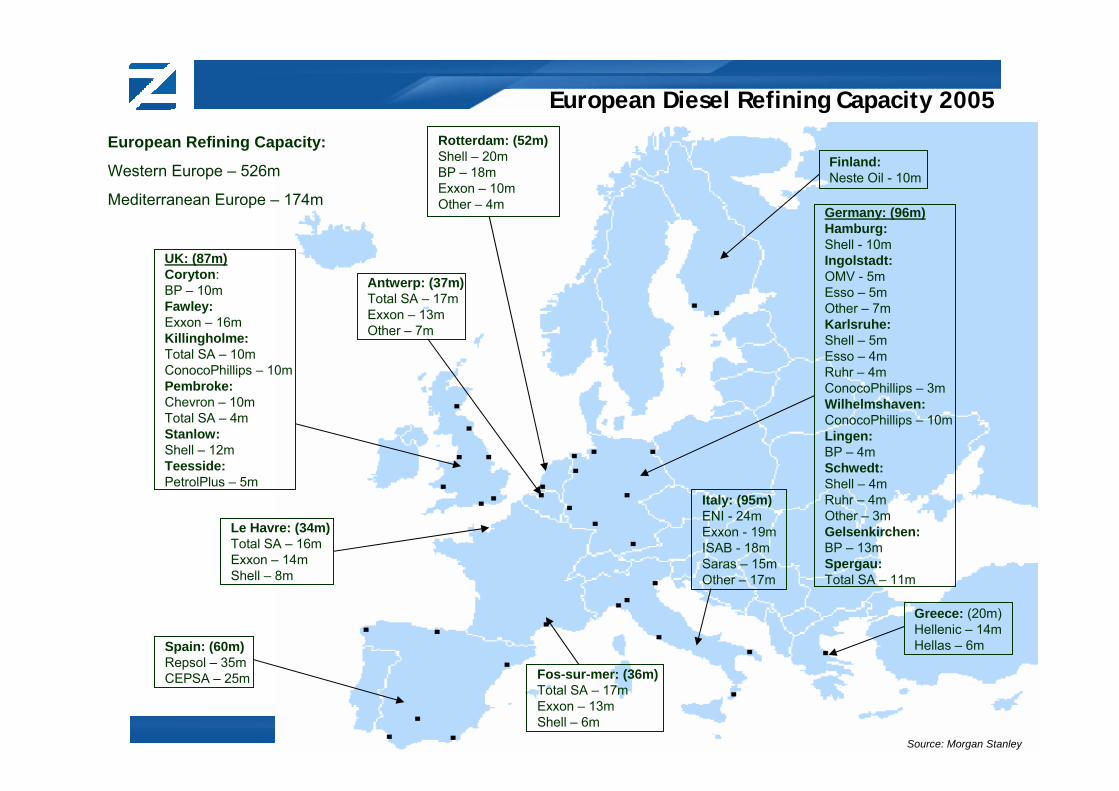
European Diesel Refining Capacity 2005
Finland:Neste Oil - 10m
Germany: (96m)Hamburg:Shell - 10mIngolstadt:OMV - 5mEsso – 5mOther – 7mKarlsruhe:Shell – 5mEsso – 4mRuhr – 4mConocoPhillips – 3mWilhelmshaven:ConocoPhillips – 10mLingen:BP – 4mSchwedt:Shell – 4mRuhr – 4mOther – 3mGelsenkirchen:BP – 13mSpergau:Total SA – 11m
Greece: (20m)Hellenic – 14mHellas – 6m
Fos-sur-mer: (36m)Total SA – 17mExxon – 13mShell – 6m
Italy: (95m)ENI - 24mExxon - 19mISAB - 18mSaras – 15mOther – 17m
Spain: (60m)Repsol – 35mCEPSA – 25m
Le Havre: (34m)Total SA – 16mExxon – 14mShell – 8m
UK: (87m)Coryton:BP – 10mFawley:Exxon – 16mKillingholme:Total SA – 10mConocoPhillips – 10mPembroke:Chevron – 10mTotal SA – 4mStanlow:Shell – 12mTeesside:PetrolPlus – 5m
Rotterdam: (52m)Shell – 20mBP – 18mExxon – 10mOther – 4m
Antwerp: (37m)Total SA – 17mExxon – 13mOther – 7m
European Refining Capacity:
Western Europe – 526m
Mediterranean Europe – 174m
Source: Morgan Stanley
10
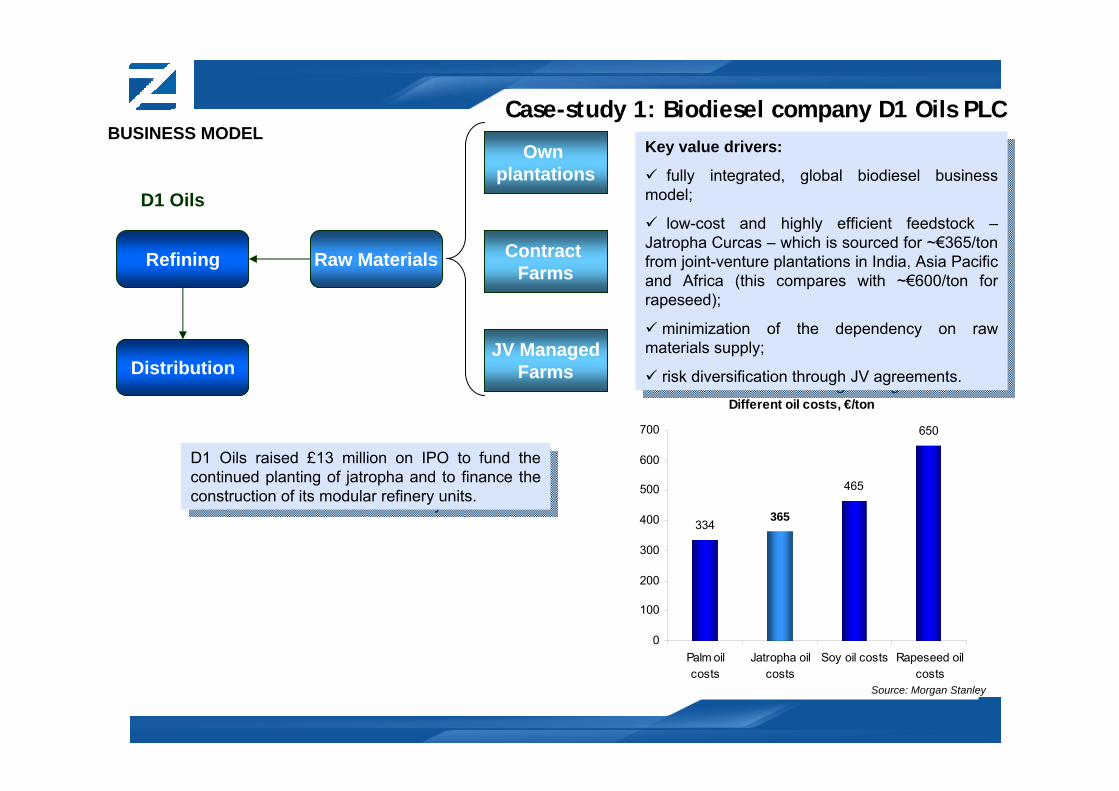
Different oil costs, €/ton
334
465
650
365
0
100
200
300
400
500
600
700
Palm oilcosts
Jatropha oilcosts
Soy oil costs Rapeseed oilcosts
Case-study 1: Biodiesel company D1 Oils PLC
D1 Oils raised £13 million on IPO to fund the continued planting of jatropha and to finance the construction of its modular refinery units.
D1 Oils raised £13 million on IPO to fund the continued planting of jatropha and to finance the construction of its modular refinery units.
BUSINESS MODEL
Refining
Distribution
D1 Oils
Raw Materials
Own plantations
Contract Farms
JV ManagedFarms
Key value drivers:
fully integrated, global biodiesel business model;
low-cost and highly efficient feedstock –Jatropha Curcas – which is sourced for ~€365/ton from joint-venture plantations in India, Asia Pacificand Africa (this compares with ~€600/ton for rapeseed);
minimization of the dependency on raw materials supply;
risk diversification through JV agreements.
Source: Morgan Stanley
11
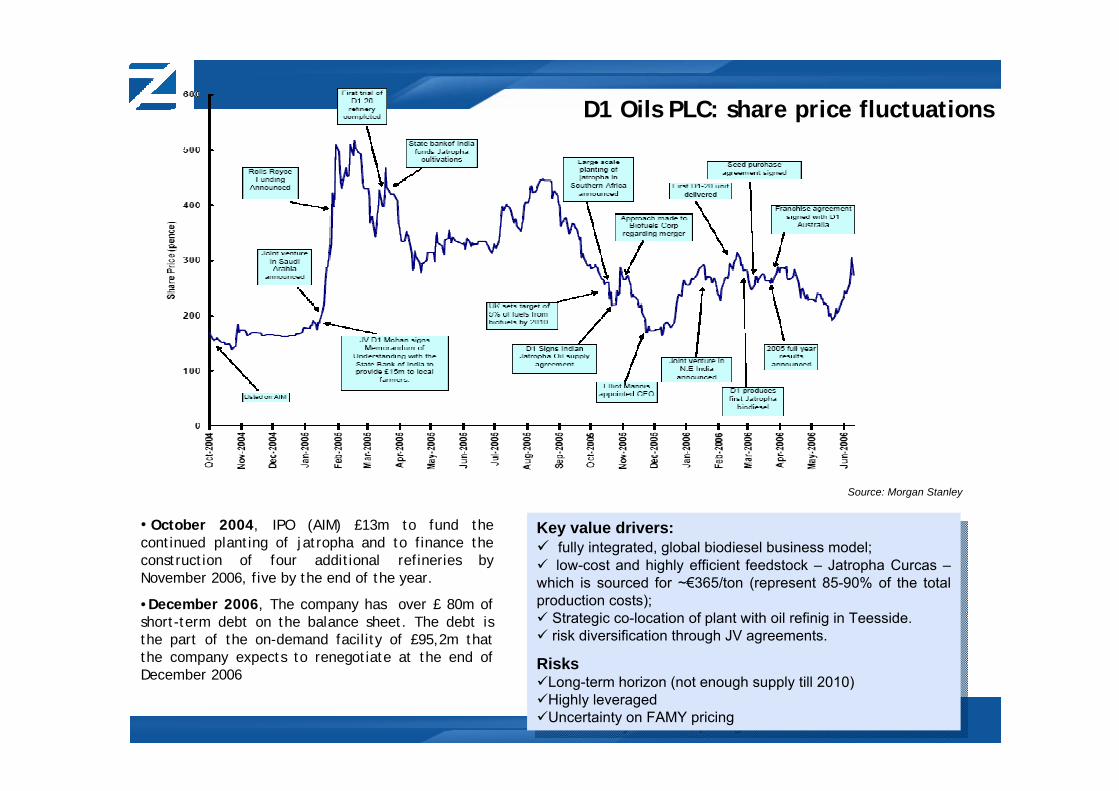
D1 Oils PLC: share price fluctuations
Key value drivers:fully integrated, global biodiesel business model; low-cost and highly efficient feedstock – Jatropha Curcas –
which is sourced for ~€365/ton (represent 85-90% of the total production costs);
Strategic co-location of plant with oil refinig in Teesside.risk diversification through JV agreements.
RisksLong-term horizon (not enough supply till 2010)Highly leveragedUncertainty on FAMY pricing
• October 2004, IPO (AIM) £13m to fund the continued planting of jatropha and to finance the construction of four additional refineries by November 2006, five by the end of the year.
•December 2006, The company has over £ 80m of short-term debt on the balance sheet. The debt is the part of the on-demand facility of £95,2m that the company expects to renegotiate at the end of December 2006
Source: Morgan Stanley
12
Finland6%Austria
5%
Sweden19%
US8%
Denmark7%
Germany5%
Poland5%
Others (less than 5%)
11%
Canada13%
Baltics11% Russia
10%
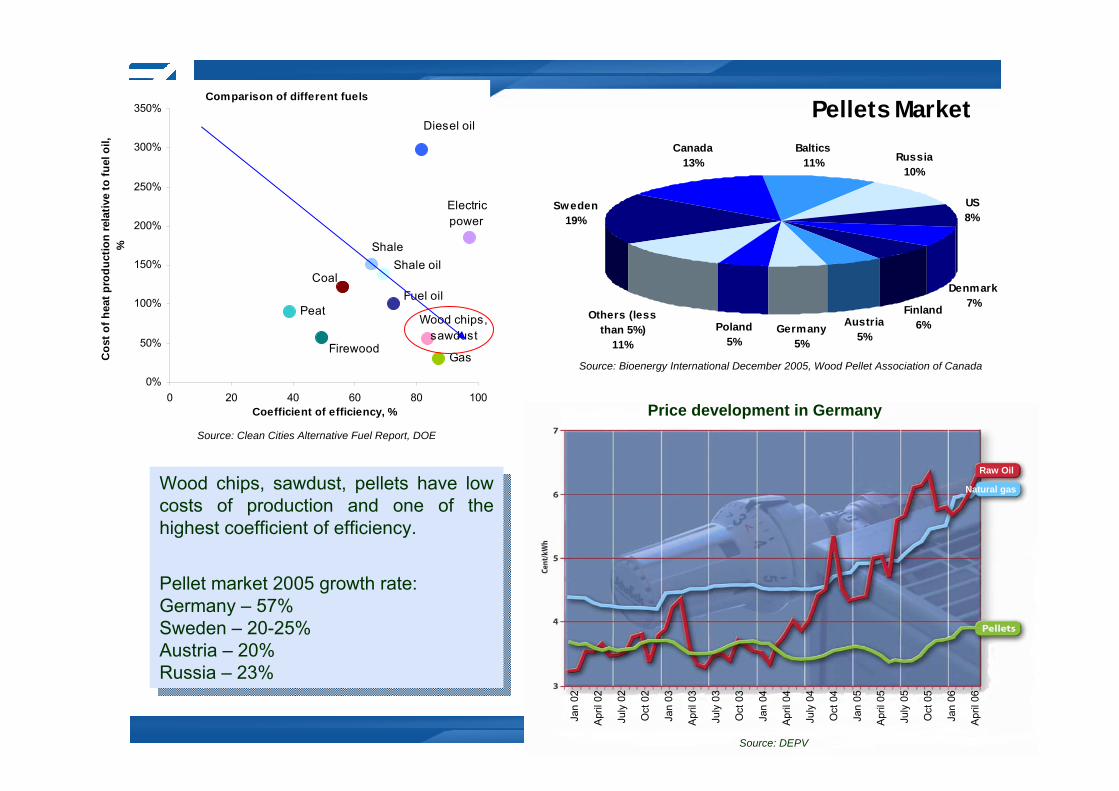
Pellets MarketComparison of different fuels
Gas
PeatWood chips,
sawdust Firewood
Fuel oilCoal
Shale oil Shale
Electric power
Diesel oil
0%
50%
100%
150%
200%
250%
300%
350%
0 20 40 60 80 100Coefficient of efficiency, %
Cos
t of h
eat p
rodu
ctio
n re
lativ
e to
fuel
oil,
%
Wood chips, sawdust, pellets have low costs of production and one of the highest coefficient of efficiency.
Pellet market 2005 growth rate:Germany – 57%Sweden – 20-25%Austria – 20%Russia – 23%
Wood chips, sawdust, pellets have low costs of production and one of the highest coefficient of efficiency.
Pellet market 2005 growth rate:Germany – 57%Sweden – 20-25%Austria – 20%Russia – 23%
Raw Oil
Natural gas
Jan
02
Apr
il 02
July
02
Oct
02
Jan
03
Apr
il 03
July
03
Oct
03
Jan
04
Apr
il 04
July
04
Oct
04
Jan
05
Apr
il 05
July
05
Oct
05
Jan
06
Apr
il 06
Source: DEPV
Source: Clean Cities Alternative Fuel Report, DOE
Price development in Germany
Source: Bioenergy International December 2005, Wood Pellet Association of Canada
13
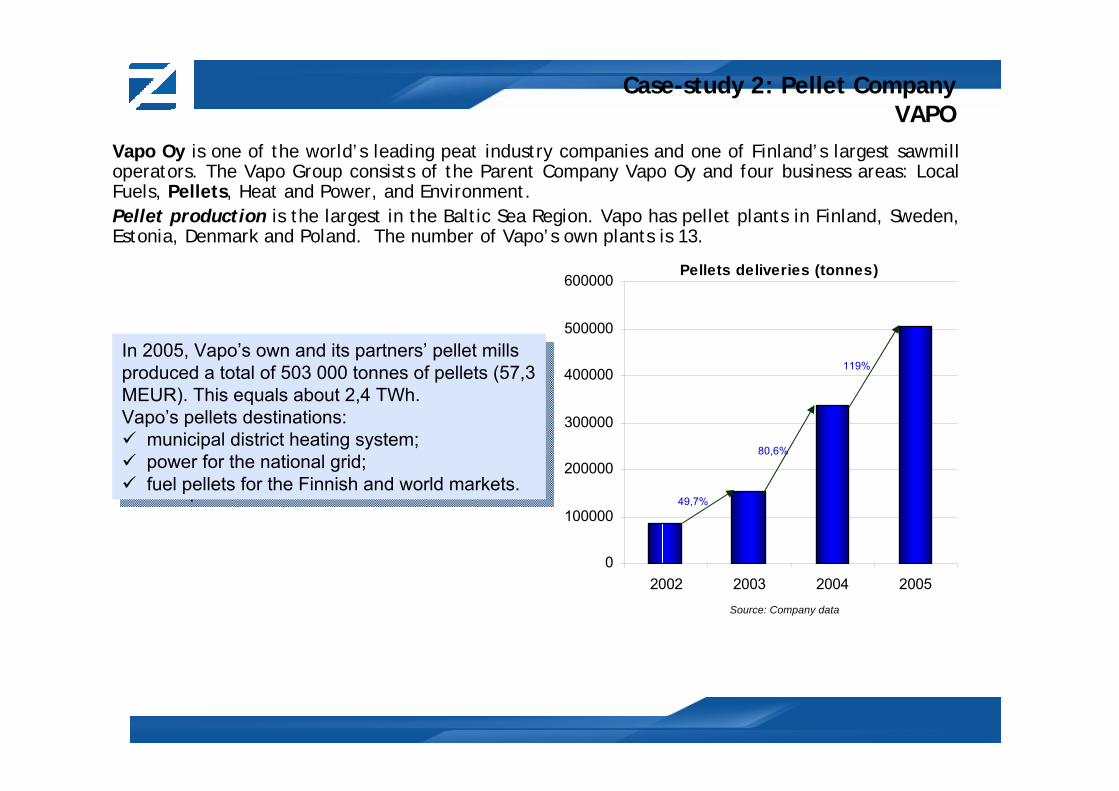
Case-study 2: Pellet CompanyVAPO
Vapo Oy is one of the world’s leading peat industry companies and one of Finland’s largest sawmill operators. The Vapo Group consists of the Parent Company Vapo Oy and four business areas: Local Fuels, Pellets, Heat and Power, and Environment. Pellet production is the largest in the Baltic Sea Region. Vapo has pellet plants in Finland, Sweden, Estonia, Denmark and Poland. The number of Vapo’s own plants is 13.
Pellets deliveries (tonnes)
0
100000
200000
300000
400000
500000
600000
2002 2003 2004 2005
80,6%
49,7%
119%In 2005, Vapo’s own and its partners’ pellet mills produced a total of 503 000 tonnes of pellets (57,3 MEUR). This equals about 2,4 TWh.Vapo’s pellets destinations:
municipal district heating system;power for the national grid;fuel pellets for the Finnish and world markets.
In 2005, Vapo’s own and its partners’ pellet mills produced a total of 503 000 tonnes of pellets (57,3 MEUR). This equals about 2,4 TWh.Vapo’s pellets destinations:
municipal district heating system;power for the national grid;fuel pellets for the Finnish and world markets.
Source: Company data
14
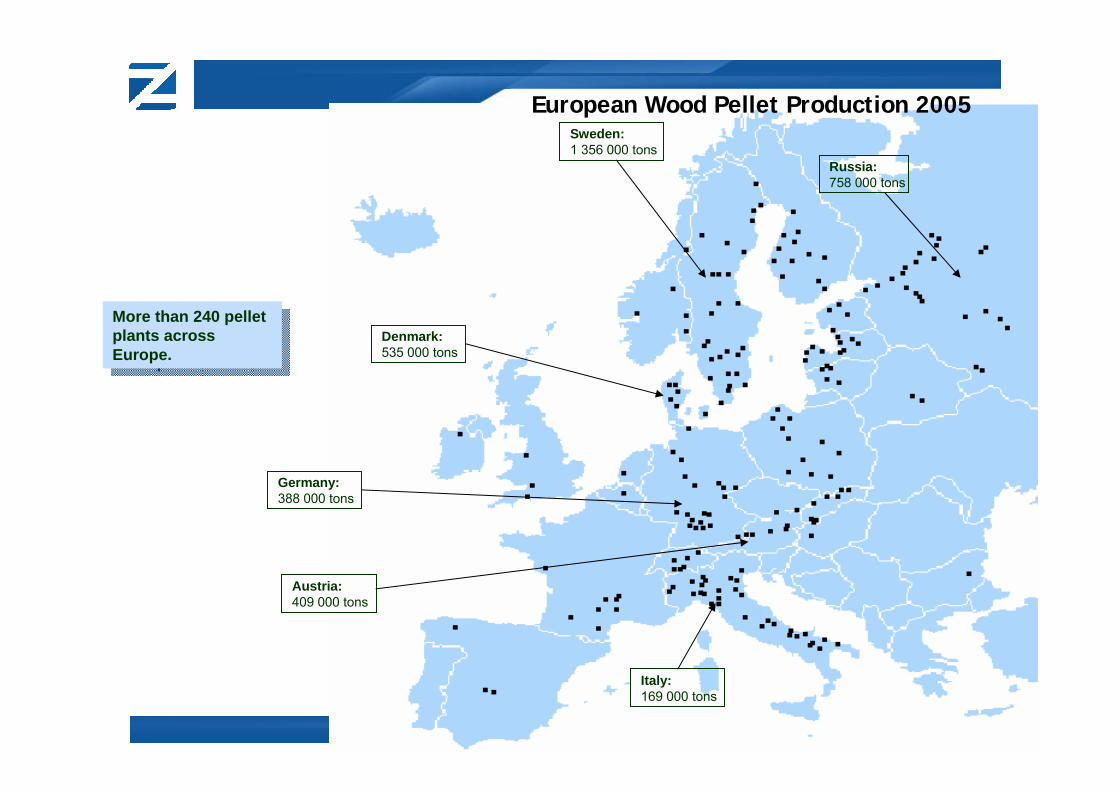
European Wood Pellet Production 2005
More than 240 pellet plants across Europe.
More than 240 pellet plants across Europe.
Sweden:1 356 000 tons
Russia:758 000 tons
Denmark:535 000 tons
Germany:388 000 tons
Austria:409 000 tons
Italy:169 000 tons
15
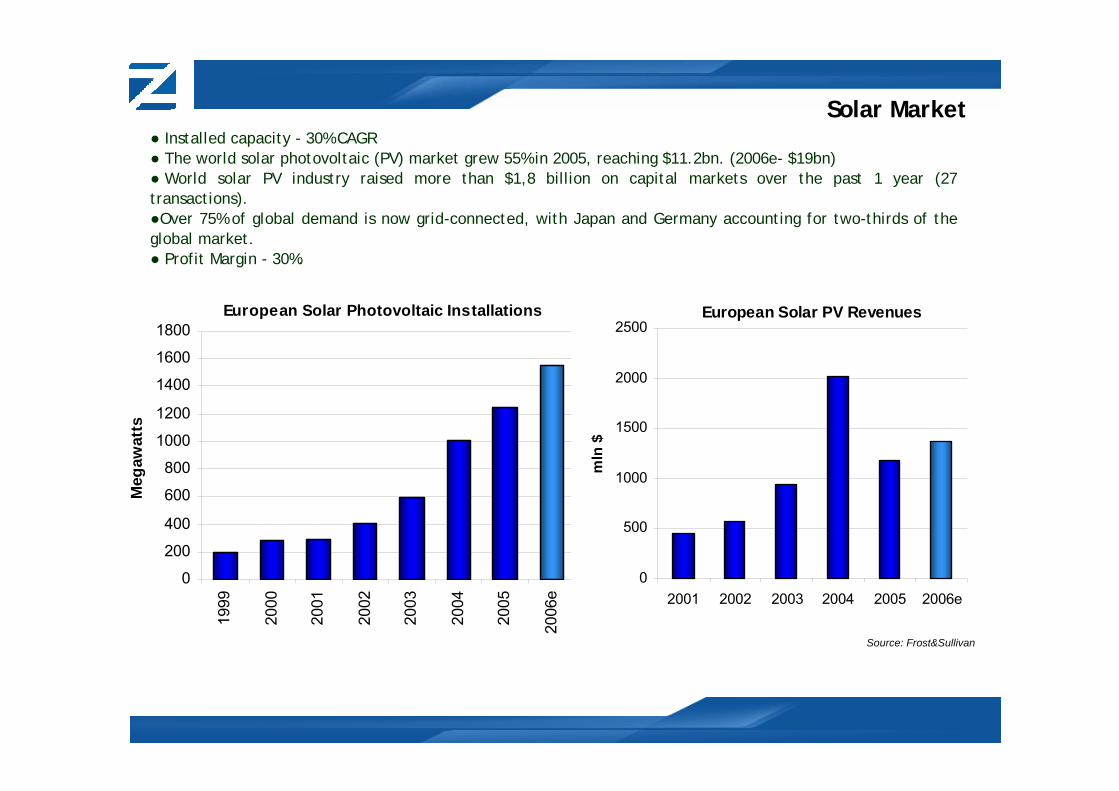
European Solar Photovoltaic Installations
0
200
400
600
800
1000
1200
1400
1600
1800
1999
2000
2001
2002
2003
2004
2005
2006
e
Meg
awat
tsSolar Market
● Installed capacity - 30% CAGR ● The world solar photovoltaic (PV) market grew 55% in 2005, reaching $11.2bn. (2006e- $19bn)● World solar PV industry raised more than $1,8 billion on capital markets over the past 1 year (27 transactions). ●Over 75% of global demand is now grid-connected, with Japan and Germany accounting for two-thirds of theglobal market. ● Profit Margin - 30%.
European Solar PV Revenues
0
500
1000
1500
2000
2500
2001 2002 2003 2004 2005 2006em
ln $
Source: Frost&Sullivan
16
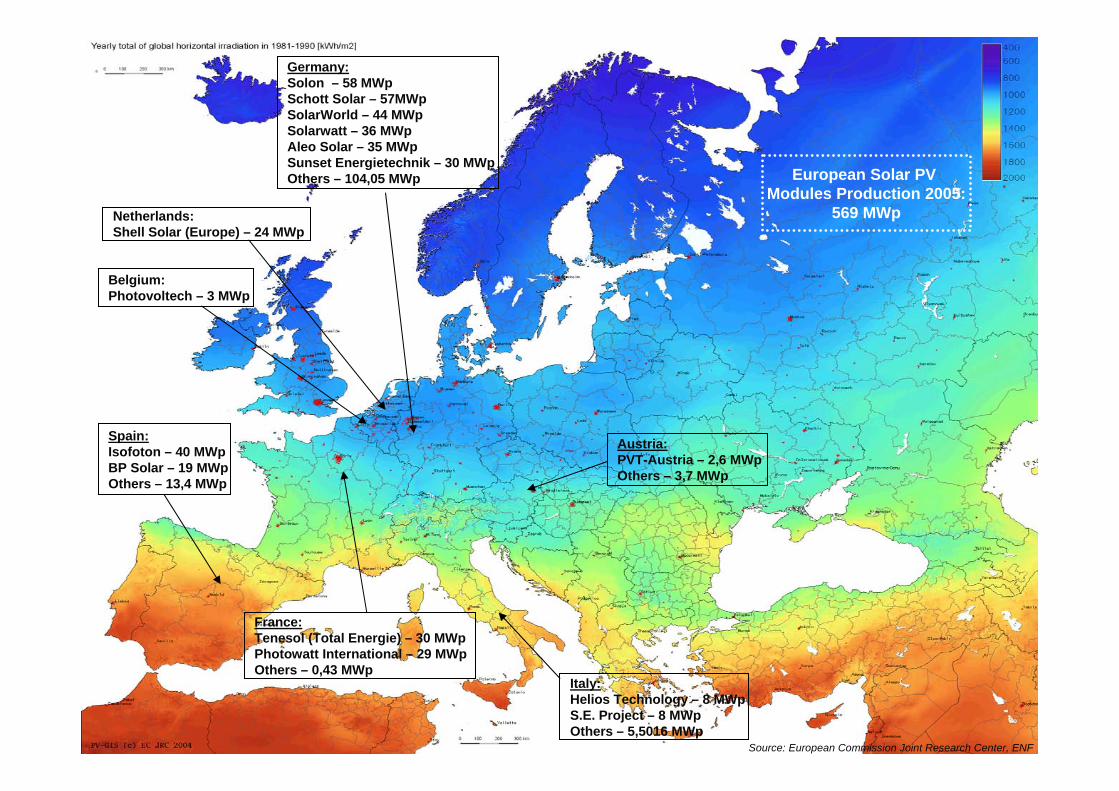
Source: European Commission Joint Research Center, ENF
Germany:Solon – 58 MWpSchott Solar – 57MWpSolarWorld – 44 MWpSolarwatt – 36 MWpAleo Solar – 35 MWpSunset Energietechnik – 30 MWpOthers – 104,05 MWp
Italy:Helios Technology – 8 MWpS.E. Project – 8 MWpOthers – 5,5016 MWp
Spain:Isofoton – 40 MWpBP Solar – 19 MWpOthers – 13,4 MWp
France:Tenesol (Total Energie) – 30 MWpPhotowatt International – 29 MWpOthers – 0,43 MWp
Austria:PVT-Austria – 2,6 MWpOthers – 3,7 MWp
Belgium:Photovoltech – 3 MWp
Netherlands:Shell Solar (Europe) – 24 MWp
European Solar PV Modules Production 2005:
569 MWp
17
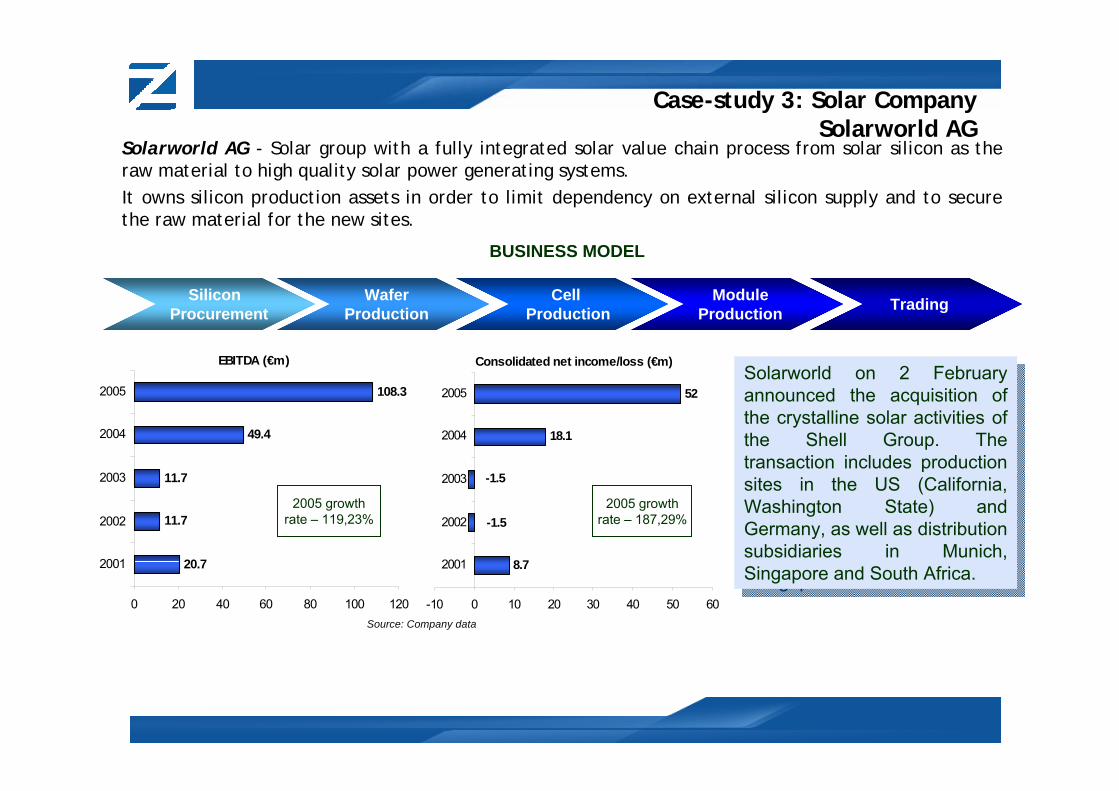
Case-study 3: Solar CompanySolarworld AG
Solarworld AG - Solar group with a fully integrated solar value chain process from solar silicon as the raw material to high quality solar power generating systems. It owns silicon production assets in order to limit dependency on external silicon supply and to secure the raw material for the new sites.
Silicon Procurement
WaferProduction
CellProduction
ModuleProduction Trading
BUSINESS MODEL
EBITDA (€m)
20.7
11.7
11.7
49.4
108.3
0 20 40 60 80 100 120
2001
2002
2003
2004
2005
Consolidated net income/loss (€m)
8.7
18.1
52
-1.5
-1.5
-10 0 10 20 30 40 50 60
2001
2002
2003
2004
2005
2005 growthrate – 119,23%
2005 growthrate – 187,29%
Solarworld on 2 February announced the acquisition of the crystalline solar activities of the Shell Group. Thetransaction includes productionsites in the US (California, Washington State) andGermany, as well as distribution subsidiaries in Munich,Singapore and South Africa.
Solarworld on 2 February announced the acquisition of the crystalline solar activities of the Shell Group. Thetransaction includes productionsites in the US (California, Washington State) andGermany, as well as distribution subsidiaries in Munich,Singapore and South Africa.
Source: Company data
18
www.zindelfund.com
Think about New Energy!!!