7y, - insurance corporation of british columbia · 2019-11-27 · 7y, information. ~l,c,{!j2_,~...
TRANSCRIPT

~ January 30, 2019
British Columbia Utilities Commission Suite 410 900 Howe Street Vancouver, BC V6Z 2N3
building trust. driving confidence.
Attention: Mr. Patrick Wruck, Commission Secretary and Manager, Regulatory Services
Re: Filing of Supplementary Information
Dear Mr. Wruck:
This letter is in further response to the British Columbia Utility Commission's (BCUC) letter dated January 28, 2019 (Exhibit A-6) extending the time for ICBC to file the redacted version of the supplementary information filed on January 24, 2019 (Exhibit B-1-3) in response to Exhibit A-5.
The supplementary information contains confidential information which, if disclosed, could influence ICBC's settlement negotiations with claimants. Disclosure of this information could therefore prejudice ICBC and its Basic insurance policyholders and thereby harm ICBC's financial interest. In addition, the supplementary information contains data that is only available on a total basis, meaning that the data set includes information about both Basic and Optional insurance. Disclosure of this information could similarly harm ICBC's economic interests. ICBC has therefore provided the supplementary information here with redactions. ICBC has separately filed the confidential version of the supplementary information with the BCUC.
Pursuant to Exhibit A-6, please find attached the redacted version of the supplementary information.
7Y, ~l,c,{!J2_,~
June Elder Manager, Corporate Regulatory Affairs gl/jb
Cc: Registered Interveners Bill Carpenter, Vice President, Insurance, ICBC
Attachment
151 West Esplanade I North Vancouver I British Columbia I V7M 3H9 I 604-661-2800 I [email protected]

Page 1 of 15
BI SEGMENTED ANALYSIS AS OF AUGUST 2018
A. EXECUTIVE SUMMARY
1. The purpose of this report is to describe the BI segmented analysis in connection with the
estimation of ICBC’s Total Bodily Injury (BI) claims costs (i.e., Basic and Optional BI). It
is prepared solely for that purpose and it is not intended, nor is it necessarily suitable, for
any other purpose. The intended users of this report are the Corporation, its external
auditors, and provincial regulators of the Corporation. This report is confidential as it
contains proprietary information, which, if publicly revealed, could have material adverse
commercial consequences for the Corporation. Accordingly, neither the report nor its
content may be disclosed to any party, other than the intended users, without the prior
consent of the Corporation. Should a request for disclosure of this report or any of its
content be made by any third party, or granted to a third party under any freedom of
information legislation, then the Corporation should be notified immediately. If permission
is granted for distribution of this document, it should be distributed in its entirety rather
than any excerpt thereof.
2. Unless noted otherwise, references to loss amounts within this report should be
understood as being gross of reinsurance but net of all other recovered amounts, and
references to incurred count or incurred severity should be understood as excluding claims
completed with no amount (CNA).1
3. BI claim closure rates, which prior to fiscal year 2013 had been very stable, have
progressively fallen below their historical levels, and have not yet stabilized into a new,
steady pattern, as can be seen from Exhibits 4.3 and 5.9. ICBC actuaries are therefore
unable to rely fully on the standard Paid Development Method because a key assumption
inherent to the method is that claims closure patterns are stable over time.2 Instead,
ICBC actuaries have relied on other methods. The Incurred Development Method is
selected for fiscal loss years (FLYs) 2009 to 2011 because at this stage of their
development they are not affected to a significant extent by the changes to the closure
rates. The Hindsight Outstanding Severity Method is selected for FLYs 2012 to 2018,
which involves the estimation of “outstanding severities” (i.e., the average cost of claims
1 See paragraph 2 in Technical Appendix C.0, Chapter 3 of ICBC’s 2019 Revenue Requirements Application. 2 Since this assumption does not hold true for FLYs 2009 to 2018, the standard paid development method should only be used for FLYs prior to 2009 where there is little or no distortion from the slowdown in closures.
Page 2 of 15
that are not yet settled) by fiscal loss year, because it better accounts for the impact of
changing closure rates.
4. Outstanding severities are affected by changes in the pattern of closure rates and the mix
of claims by their level of complexity. ICBC actuaries have undertaken to refine their
estimation of outstanding severity by separating the claims data into segments of similar
complexity. The resulting three segments in the current analysis, listed in order of
increasing complexity, are: Unrepresented, Represented excluding Large and
Catastrophic, and Represented Large and Catastrophic. The frequency of claim exposures
shows different trend rates across the three segments, and recent changes in the closure
pattern of claims have not affected all segments equally. The refined segmentation of BI
claims has allowed ICBC actuaries to capture changes in the mix of the complexity of
outstanding claims that is driven by changes in the closure patterns within each segment,
and changes in the frequency of claim exposures by segment, which impacts severity
trend rates. The methodology used in this analysis, as well as changes to methodology
and assumptions from the previous analysis as of May 2017 are described in this report.
5. Key findings of the analysis are discussed below. The frequency shown is the incurred
CWA BI claim exposure frequency, which is calculated as the BI completed with amount
(CWA) claim exposure count divided by Third Party Liability earned exposure. The severity
shown is the incurred severity per BI CWA claim exposure count, which is calculated as
the BI incurred loss and allocated loss adjustment expense (ALAE) divided by the incurred
BI CWA claim exposure count.
As shown in Figure A.1, the frequency trend of represented claim exposures has turned
since FLY 2010 from a gently downward trend to a strong upward trend. In contrast,
the frequency of unrepresented claim exposures was steadily decreasing prior to FLY
2010, but while varying from year to year, has remained at a relatively consistent level
since FLY 2009. The shift in the mix of claims towards more represented claimants
has contributed to the shift in closure rates discussed above, as represented claims on
average are more complex and take longer to resolve. This has also led to a similar
shift in the mix of the pending claim inventory, which has contributed to a higher cost
of outstanding claims, as represented claims, on average, are also more costly to
resolve than unrepresented claims. Figure A.1 reflects a change in the proportion of
represented claim exposures from 47% for FLY 2010 to 57% for FLY 2018.

Page 3 of 15
Figure A.1 – BI Incurred Frequency by Legal Representation Status
As shown in Figure A.2, there has been a significant increase in the emergence of
represented large and catastrophic claim exposures from historical FLYs since the
previous analysis as of May 2017. Although these claims make up a relatively small
proportion of BI claim exposures, they can significantly influence the incurred costs,
as the average cost of these claim exposures is significantly higher than the average
cost of claim exposures in the other segments (as shown in Exhibit 5.11 for
Represented Large and Catastrophic compared to Exhibits 3.8 and 4.5 for
Unrepresented and Represented excluding Large and Catastrophic respectively). The
number of represented large and catastrophic claim exposures that emerged in fiscal
year 2018 grew by 81% from fiscal year 2017, to an unprecedented level. Many of
these claim exposures are from older FLYs: approximately one quarter of them are
from crashes occurring in FLYs 2013 and earlier, and approximately 44% of them are
from crashes occurring in FLYs 2014 and earlier. Although traditional catastrophic
injuries can often be readily identified soon after a crash occurs, some large BI claim
exposures may be the result of more complex cases that develop over time, and where
the information required to fully assess the costs becomes available many years
afterwards. The increased number of represented large and catastrophic claim
FLY 2010: 47% represented
FLY 2018: 57% represented
0.0%
0.2%
0.4%
0.6%
0.8%
1.0%
1.2%
1.4%
2002 2003 2004 2005 2006 2007 2008 2009 2010 2011 2012 2013 2014 2015 2016 2017 2018
Incu
rre
d F
req
eu
ncy
(C
laim
Exp
osu
re B
asis
)
Fiscal Loss YearUnrepresented Represented Long Term Trend (2002-2008)

Page 4 of 15
exposures therefore contributes to a higher cost of outstanding claim exposures that
is reflected across many FLYs.
Figure A.2 – Represented Large and Catastrophic Emergence
Even though the BI severity trend rates of represented and unrepresented claims have
been relatively mild, there is a stronger upward trend in the total severity, as shown
in Figure A.3 (+4.0% average annual growth rate from $37,000 for FLY 2011 to
$50,000 for FLY 2018). This is a direct consequence of the shift in the mix of claims
to higher complexity represented claims.
0
1,000
2,000
3,000
4,000
2014 2015 2016 2017 2018
Nu
mb
er o
f La
rge
($
20
0k+
) an
d C
atas
tro
ph
ic
Exp
osu
res
Fiscal Year

Page 5 of 15
Figure A.3 – BI Severity by Legal Representation Status
B. SUMMARY OF CHANGES FROM THE MAY 2017 ANALYSIS
6. The requirements in the Standards of Practice of the Canadian Institute of Actuaries with
respect to disclosure in an external user report (Section 1710.01) require a description
and a rationale for each assumption that is material to the results of the work, and
disclosure of any assumption (other than a model or data assumption) that is different
from the continuance of the status quo assumption. This report includes detailed
information about the basis of selection of many of the assumptions used in the derivation
of the estimation of ICBC’s Total BI claims costs. A discussion of those assumptions
considered to be of greatest relevance to the intended users of this report have been
included. ICBC believes that the disclosures made in this report comply with the spirit
and intent of Section 1710.01. A description and rationale for each and every assumption
that may be deemed to be material to the results of the estimation of Total BI claims costs
is not provided, however, ICBC considers the disclosures pertaining to the assumptions in
this report to be reasonable and appropriate to the circumstances. This section
summarizes the most significant changes to the methodology and presentation of the BI
segmented analysis in this report as compared to the May 2017 report. Other significant
Un
rep
resen
ted
In
cu
rred
Severit
y (
Cla
im E
xp
osu
re
Basis
)
Rep
resen
ted
an
d T
ota
l In
cu
rred
Severit
y (
Cla
im
Exp
osu
re B
asis
)
Fiscal Loss Year
Represented Total 2011-2018 Trend Unrepresented

Page 6 of 15
changes in the basis of selection of assumptions are identified in more detail in sections E
through H.
This analysis relies on a new and more accurate data source for the determination of
the legal representation status for claim exposures managed in the new claims
management system. Please see paragraph 14 for more detail. The impact of this
change is available.
The adjustment made in the May 2017 analysis for future closures based on the
integrated staffing model has been removed in this analysis. Closure rates have not
continued to increase, and future closure levels are now expected to be consistent with
observed closure rates from recent fiscal years. Had this adjustment not been included
in the May 2017 analysis, the BI incurred loss and ALAE estimated would have been
higher by $74 million.
The methods and summary exhibits for claim exposure counts including CNA are not
included in this analysis. Claim exposure counts including CNA do not directly impact
the loss and ALAE estimates. They were included in the May 2017 analysis to support
the adjustment for future closures based on the integrated staffing model. Since this
adjustment has been removed, as discussed in the previous paragraph, the inclusion
of claim exposure counts including CNA are no longer required.
Disposal rate selections for the Unrepresented and Represented excluding Large and
Catastrophic segments are based on longer averages compared to the May 2017
analysis. The experience has not generally shown the continuation of heightened
closure rates that were evident at that time.
Severity starting points are calculated from multi-year averages of severities, rather
than relying on the latest fiscal year value as in the May 2017 analysis. The use of
average severities will provide greater stability to the severity starting points over
time. The impact of this change is available.
Selected severity trends are based on periods that include the current fiscal year,
rather than ending in the previous fiscal year as in the May 2017 analysis. Including
the current fiscal year makes the trend more responsive to the most recent experience,
and the latest point now includes more actual data (5 months to August) as compared
to the May 2017 analysis (2 months to May). The impact of this change is available.

Page 7 of 15
As a result of the increasing emergence of large and catastrophic claims observed in
recent years, efforts have been made to improve the identification of large losses
earlier in the claims life cycle, including through reviews of pending claims. Since a
further increase in the emergence of large claims would be expected to result from
these efforts, but for only a limited period of time, the latest year’s experience is no
longer most representative of expected future experience for emergence of large and
catastrophic BI claims. Therefore, a longer experience period has been selected for
the development of large and catastrophic claim exposure counts. In addition, a new
method has been introduced in order to reflect the risk of large losses yet to emerge
from the growing volume of pending represented claims from each individual fiscal
loss year. This method is referred to as the Hindsight Method, and it assumes that at
each development age, the proportion of pending represented claim exposures that
are large and catastrophic in older, more mature fiscal loss years will hold true for the
more recent, less mature fiscal loss years. The application of the Hindsight Method is
described below in paragraph 41, and is shown in Exhibits 5.5 to 5.7.
C. OVERVIEW OF ANALYSIS
7. This analysis produces estimates of Total (Basic and Optional) BI incurred loss and ALAE,
from which Basic amounts are derived for use in the loss and ALAE estimation methods
presented in the 2019 Revenue Requirements Application (see Chapter 3, Technical
Appendix C.1.5.3).
8. The 2019 Revenue Requirements Application analysis requires Basic BI estimates of
incurred loss and ALAE. However, the amount of Basic coverage applies at the claim level
(and separately for BI and Property Damage) and not separately for each injured
claimant.3 Since this analysis requires data at the claim exposure level, Total BI data is
used. It follows that the resulting estimates of incurred loss and ALAE must be allocated
between Basic and Optional components. Therefore, to determine the Basic incurred loss
and ALAE by fiscal loss year, the Optional BI incurred loss and ALAE amounts estimated
in the August 2018 reserve analysis are subtracted from the Total BI incurred loss and
ALAE amounts estimated in this BI Segmented Analysis. The calculated BI Basic incurred
loss and ALAE amounts for each fiscal loss year from 2002 to 2018 are shown in
Exhibit 1.1.
3 See Paragraph 75 in Technical Appendix C.0, Chapter 3 of ICBC’s 2019 Revenue Requirement Application.
Page 8 of 15
9. The following describes the Total BI analysis, which is performed at the segmented level,
based on the claims closure model proposed by Adler and Kline.4 Exhibit sets 3 to 5
provide the calculations of the analysis for the Unrepresented, Represented excluding
Large and Catastrophic, and Represented Large and Catastrophic segments, respectively.
Unless noted otherwise, the analyses for each segment proceed in the same manner.
10. Within each segment, claim exposure count by FLY is first forecasted to the end of fiscal
year 2019 (i.e., to March 31, 2019), as described in paragraph 17. These forecast claim
exposure counts as of 2019 fiscal year end are then projected to their incurred values
based on historical development patterns.
11. The future closure pattern for CWA claim exposures is estimated for each segment based
on historical disposal rates, which is the ratio of the change in CWA claim exposures during
a period to the number of outstanding claim exposures at the beginning of the period.
12. The average paid loss and ALAE per CWA claim exposure (CWA severity) by FLY for each
segment is forecasted for the full 2019 fiscal year, as described in paragraph 17. CWA
severities for future fiscal years are projected at each development period based on a
historical trend rate, applied to a selected starting point (in most cases, the average of
the 2016 to 2019 fiscal years trended to the 2019 level). The future paid loss and ALAE
amounts are derived by multiplying the future CWA claim exposure counts with the
projected CWA severities in each development period. The estimated incurred loss and
ALAE for each fiscal loss year is the sum of the actual past and projected future paid loss
and ALAE amounts.
13. For Unrepresented and Represented excluding Large and Catastrophic, the baseline
selection for the claim exposure count development factors is the average of the four most
recent loss development factors, and the baseline selection for the CWA disposal rates
used for CWA exposure count closure pattern is the average of the four most recent
disposal rates. For Represented Large and Catastrophic, the baseline selection for the
claim exposure count development factors is the average of the six most recent loss
development factors, and the baseline selection for the CWA disposal rates used for CWA
claim exposure count closure pattern is the average of the six most recent disposal rates.
Final selections and departures from the baseline in the analysis are discussed below.
4 Martin Adler and Charles D. Kline Jr., Evaluating Bodily Injury Liabilities Using a Claims Closure Model, accessed August 13, 2014, http://www.casact.org/pubs/dpp/dpp88/88dpp001.pdf
Page 9 of 15
D. DATA SOURCES AND DEFINITIONS
14. Data Sources – BI loss and ALAE amounts (including paid loss and ALAE, case reserves,
and recovered amounts) and claim exposure count data are extracted from the Enterprise
Data Warehouse (for both the legacy and the new claims management systems),
organized into an appropriate format, combined, and downloaded into spreadsheets. The
data is gross of reinsurance recoveries. In the current analysis, the data source for the
legal representation status for claim exposures managed in the new claims management
system was updated. The new data source identifies the represented status at a claimant
level, as opposed to a claim exposure level, which provides greater accuracy than the old
data source. As a result of this change, the new claims management system portion of
the actuarial data triangles (FLYs 2014 and later) has been restated and differs from the
data used in the May 2017 analysis.
15. Data extracted as of August 31, 2018 is projected to March 31, 2019 as described in the
section below, and then combined with data extracted as of fiscal year-end points from
2006 to 2018.
16. The loss and ALAE data used in this analysis are verified to be consistent with other
financial records of ICBC through comparison with the actuarial loss reserving data, which
are reconciled with accounting records, as discussed in Technical Appendix C.0, Section H
of the 2019 Revenue Requirements Application.
17. Fiscal Year 2019 Expected Count and CWA Severity – Data shown in the exhibits as
of March 31, 2019 was derived based on data to August 31, 2018 and a prior expectation
of counts and payments over the course of the 2019 fiscal year, taking into consideration
relevant information from consultation with internal subject matter experts. The prior
expected values used in projecting the count and CWA severities to March 31, 2019 are
from the results of a corresponding segmented analysis as of March 31, 2018.
18. Segment Definitions – As discussed in Section A, the BI claims data are separated into
three segments. In order to achieve this, the claims data are first separated into
unrepresented and represented using the legal representation status of each claim
exposure at each point in time. Within the represented data, the claim exposures that
have either a case incurred amount greater than $200,000, or an injury results code of
010, 011, 012, 013, 020, 030, 040, 050, 051, 060, 070, 080, 090, 121, 122, 123, 130,
140, 190, or 225 and a case incurred amount greater than $10,000, are assigned to the

Page 10 of 15
Represented Large and Catastrophic segment.5 Injury result information is not recorded
in the same way in the new claims management system, and so this criteria is not applied
(only claim exposures with a case incurred amount greater than $200,000 are assigned
to the Represented Large and Catastrophic segment).6
E. SUMMARY OF TOTAL INCURRED COUNT SELECTIONS
19. Exhibit 2.1 – Incurred Claim Exposure Count Summary by Segment – This exhibit
summarizes the final selected incurred claim exposure count for each segment, and in
total, as well as calculating a representation rate (including Large and Catastrophic) for
each FLY. The representation rate is also shown in the 2019 Revenue Requirements
Application, Appendix D.0, Figure D.0.9.
20. Exhibit 2.2 – Incurred Claim Exposure Count Summary – The selected incurred claim
exposure counts are from the Development Method for FLYs 2018 and prior. The
Bornhuetter-Ferguson Method is selected for FLY 2019. This represents a change from
the May 2017 analysis where the incurred claim exposure counts for the latest two FLYs
(2017 and 2018) were calculated as the product of the FLY 2016 claim exposure to claim
ratio and the corresponding incurred claim count estimates. This calculation is no longer
required in the August 2018 analysis because the claim exposure to claim ratio for FLYs
2018 and 2019 are consistent with older FLYs.
21. Exhibit 2.3-2.4 – Incurred Claim Exposure Count Development Method and
Bornhuetter-Ferguson Method – The baseline is selected up to 168 months and a factor
of one is selected from 168 months, except for the period from 12 to 24 months where an
average of the three most recent factors is selected in order to reflect the increased level
of late reporting for BI claim exposures.
F. SUMMARY OF UNREPRESENTED BI SELECTIONS
22. Exhibit 3.1 – Incurred Summary – This exhibit summarizes the final selected incurred
claim exposure counts and incurred loss and ALAE amounts.
23. Exhibit 3.2 – Incurred Claim Exposure Count Summary – The selected incurred claim
exposure counts are from the Development Method for FLYs 2002 to 2018. For FLY 2019,
5 Injury results codes are listed in the CL314 code chart (http://icbcwebapps/corpforms/formspdf/CL314.pdf) and the data is available through the Claim Customer System (CCUS). 6 In recent years, over 95% of the claim exposures in the Large and Catastrophic segment have a case incurred amount greater than $200,000.

Page 11 of 15
the selected incurred claim exposure count is based on the total incurred claim exposure
count and a weighted average of the trended 2019 unrepresented claim exposure ratio
(five twelfths weight) and a prior expected unrepresented claim exposure ratio (seven
twelfths weight). The prior expected unrepresented claim exposure ratio is from the
results of a corresponding segmented analysis as of March 31, 2018. The weighted
average represents a balance between the prior expected unrepresented claim exposure
ratio and the trended unrepresented ratio that includes the five months of data that has
emerged since March 2018. This selection represents a change from the May 2017
analysis where the latest two FLYs (2017 and 2018) were calculated from the total incurred
claim exposure count excluding Represented Large and Catastrophic and estimates of the
unrepresented claim exposure ratio to total incurred claim exposure count excluding
represented large and catastrophic. The ratio has been simplified by the inclusion of
represented large and catastrophic claims, and FLY 2018 incurred claim exposure count
no longer relies on a trended ratio because the result from the Development Method is
reasonably consistent with the trended ratio.
24. Exhibit 3.3-3.4 – Incurred Claim Exposure Count Development Method – The
baseline is selected up to 168 months, and a factor of one is selected from 168 months
onward, except for the period from 12 to 24 months where an average of the three most
recent factors is selected in order to reflect the increased level of late reporting for BI
claim exposures.
25. Exhibit 3.5-3.6 – CWA Claim Exposure Count Closure Pattern – The average of the
three most recent disposal rates is selected up to 36 months and the baseline is selected
from 36 to 96 months. This represents a change from the May 2017 analysis where the
average of the two most recent disposal rates was selected from 12 to 96 months.
Baseline factors are now selected for the periods beyond 36 months because heightened
closure rates are no longer evident in these periods. A disposal rate of 33% is selected
from 96 to 204 months, and a disposal rate of 100% is selected from 204 to 216 months.
26. Exhibit 3.7 – Paid Loss and ALAE Development – Paid loss and ALAE amounts are
projected to their incurred values by multiplying the future incremental CWA claim
exposure counts in Exhibit 3.5 (2) by the forecasted incremental paid severities in
Exhibit 3.8 (1).
27. Exhibit 3.8 – Incremental Paid Severities – The forecasted incremental paid severities
are based on the trend in Exhibit 3.10, row (a), beginning from the selected starting points
shown in Exhibit 3.9, row (a).
Page 12 of 15
28. Exhibit 3.9 – Incremental Paid Severity Starting Points – The four most recent
points are trended to the current period, and the average of those trended points is
selected for all periods. This represents a change from the May 2017 analysis where the
latest point was selected for all periods. A trended average is selected in the current
analysis to provide greater stability to the severity starting points.
29. Exhibit 3.10 – Fiscal Year Paid Severity Trend – The selected incremental paid
severity trend for all development periods is based on an exponential trend of the fiscal
year paid severity over fiscal years 2015 to 2019. This represents a change from the May
2017 analysis where the five year exponential model did not include the current year. The
current fiscal year is included in the current analysis to be more responsive to the most
recent experience, and because it now includes more actual data (5 months) as compared
the May 2017 analysis (2 months).
G. SUMMARY OF REPRESENTED EXCLUDING LARGE AND
CATASTROPHIC BI SELECTIONS
30. Exhibit 4.1 – Incurred Summary – This exhibit summarizes the final selected incurred
claim exposure counts and incurred loss and ALAE amounts.
31. Exhibit 4.2-4.3 – CWA Claim Exposure Count Closure Pattern – The average of the
three most recent disposal rates is selected up to 36 months and then baseline is selected
from 36 to 144 months. This represents a change from the May 2017 analysis where the
average of the two most recent disposal rates was selected up to 120 months. Baseline
factors are now selected for the periods beyond 36 months because heightened closure
rates are no longer evident in these periods. A disposal rate of 33% is selected from 144
to 204 months, and a disposal rate of 100% is selected from 204 to 216 months.
32. Exhibit 4.4 – Paid Loss and ALAE Development – Paid loss and ALAE amounts are
projected to their incurred values by multiplying the future incremental CWA claim
exposure counts in Exhibit 4.2 (2) by the forecasted incremental paid severities in
Exhibit 4.5 (1).
33. Exhibit 4.5 – Incremental Paid Severity – The forecasted incremental paid severities
are based on selected trends beginning from selected starting points. The trends for the
12 to 24 month period, and the periods beyond 24 months are from Exhibit 4.7, row (a)
and Exhibit 4.8, row (a) respectively, and the selected starting points are shown in
Exhibit 4.6, row (a).
Page 13 of 15
34. Exhibit 4.6 – Incremental Paid Severity Starting Points – The four most recent
points are trended to the current period, and the average of those points is selected for
all periods. This represents a change from the May 2017 analysis where the latest point
was selected for all periods. A trended average is selected in the current analysis to
provide greater stability to the severity starting points.
35. Exhibit 4.7 – Fiscal Year Paid Severity Trend (0 to 24 months) – The selected
incremental paid severity trend for the periods up to 24 months is based on an exponential
trend of the fiscal year paid severity over fiscal years 2010 to 2019. This represents a
change from the May 2017 analysis where the ten year exponential model did not include
the current year. The current fiscal year is included in the current analysis to be more
responsive to the most recent experience, and because it now includes more actual data
(5 months) as compared to the May 2017 analysis (2 months).
36. Exhibit 4.8 – Fiscal Year Paid Severity Trend (24 months and later) – The selected
incremental paid severity trend for the periods from 24 and later is based on an
exponential trend of the fiscal year paid severity over fiscal years 2010 to 2019. This
represents a change from the May 2017 analysis where the ten year exponential model
did not include the current year. The current fiscal year is included in the current analysis
to be more responsive to the most recent experience, and because it now includes more
actual data (5 months) as compared to the May 2017 analysis (2 months).
37. Exhibit 4.9 – Open Claim Exposure Count – This exhibit shows open claim exposures
by fiscal loss year and development year. These values are used in the calculation of the
Hindsight Method estimated incurred claim exposure count for the Represented Large and
Catastrophic segment.
H. SUMMARY OF REPRESENTED LARGE AND CATASTROPHIC BI
SELECTIONS
38. Exhibit 5.1 – Incurred Summary – This exhibit summarizes the final selected incurred
claim exposure counts and incurred loss and ALAE amounts.
39. Exhibit 5.2 – Incurred Claim Exposure Count Summary - The selected incurred claim
exposure counts are from the Development Method for FLYs 2002 to 2014, the Hindsight
Method for FLYs 2015, 2016, and 2018, and the average of the Hindsight Method and the
Bornhuetter-Ferguson Method for FLY 2017. For FLY 2019, the selected incurred claim
exposure count is an average of the Hindsight Method result and a prior expected value.
Page 14 of 15
This represents a change from the May 2017 analysis where the results of the Bornhuetter-
Ferguson method was selected for the most recent six FLYs (2013 to 2018). The Hindsight
Method has been introduced in the current analysis in order to be more responsive to the
growing volume of pending represented claims from each individual fiscal loss year, from
which a greater number of large and catastrophic claims have been identified.
40. Exhibit 5.3-5.4 – Incurred Claim Exposure Count Development Method and
Bornhuetter-Ferguson Method – An average of all factors is selected up to 168 months
and a factor of one is selected from 168 months onward. This represents a change from
the May 2017 analysis where the average of the three most recent factors was selected
from 12 to 120 months and then baseline (average six) was selected from 120 to 168
months. The current selection of the average of all factors puts less weight on the factors
in the latest two diagonals, which are relatively high. This is done to recognize that efforts
made to improve the identification of large losses have been resulting in a greater
emergence of claims in this segment, but this effect is not expected to continue
indefinitely. The credibility complement in the Bornhuetter-Ferguson Method is the
product of risk exposure and the results of an exponential trend line on historical incurred
frequencies (FLYs 2002 to 2011). This represents a change from the May 2017 analysis
where the exponential trend line was based on FLYs 2001 to 2012 historical incurred
frequencies. The FLY 2012 frequency is excluded from the exponential trend line in the
current analysis because it has been impacted by increased emergence during fiscal year
2018 and therefore is still subject to significant uncertainty. FLY 2002 is the earliest year
available in the current analysis.
41. Exhibit 5.5-5.7 – Incurred Claim Exposure Count Hindsight Method – The Hindsight
Method restates open claim exposure count in the latest diagonal based on expected ratios
of open represented large and catastrophic claim exposures to open represented claim
exposures for each development period. The expected ratios are selected from a historical
period where the ratios are relatively stable, that period being fiscal years 2006 to 2009.
This can be seen from examination of Exhibit 5.7. After restating the latest diagonal of
represented large and catastrophic open claim exposure counts, represented large and
catastrophic CWA claim exposure counts are added back at each development period. The
open and CWA claim exposure count triangle is then developed using selected count
development factors that align with the historical period selected for the expected ratio
calculation. The open and CWA claim exposure count triangle with the restated latest
diagonal is shown in Exhibit 5.6 (1) and the resulting count development factors are shown

Page 15 of 15
in the bottom half of Exhibit 5.6. After 108 months, baseline count development factors
are selected.
42. Exhibit 5.8-5.9 – CWA Claim Exposure Count Closure Pattern – The average of the
two most recent disposal rates is selected up to 96 months. This represents a change
from the May 2017 analysis where the average of the four most recent disposal rates was
selected up to 96 months. A shorter-term average is selected in the current analysis to
reflect the recent closure levels that have emerged and are expected to continue. A
disposal rate of 33% is selected from 96 to 204 months and a disposal rate of 100% is
selected from 204 to 216 months.
43. Exhibit 5.10 – Paid Loss and ALAE Development – Paid loss and ALAE amounts are
projected to their incurred values by multiplying the future incremental CWA claim
exposure counts in Exhibit 5.8 (2) by the forecasted incremental paid severities in
Exhibit 5.11 (1).
44. Exhibit 5.11 – Incremental Paid Severities - The forecasted incremental paid
severities are based on the trend in Exhibit 5.13, row (a), beginning from the selected
starting points shown in Exhibit 5.12, row (a).
45. Exhibit 5.12 – Incremental Paid Severity Starting Points – The average of the six
most recent points is selected for all periods. This represents a change from the May 2017
analysis where the latest point was selected from 12 to 72 months and the average of the
four most recent points was selected from 72 months onward. A longer average is
selected in the current analysis to provide greater stability to the severity starting points.
46. Exhibit 5.13 – Fiscal Year Paid Severity Trend – The selected incremental paid
severity trend for all development periods is based on an exponential trend of the fiscal
year paid severity over fiscal years 2010 to 2019. This represents a change from the May
2017 analysis where the ten year exponential model did not include the current year. The
current fiscal year is included in the current analysis to be more responsive to the most
recent experience, and because it now includes more actual data (5 months) as compared
to the May 2017 analysis (2 months).

Insurance Corporation of British Columbia Table of Contents
Exhibit Set 1 Bodily Injury Liability Loss* and ALAE Summary and Allocation
1.1 Incurred Loss and ALAE Summary
1.2 Incurred Loss and ALAE Summary by Segment
Exhibit Set 2 Total Bodily Injury Liability Incurred Count
2.1 Incurred Claim Exposure Count Summary by Segment
2.2 Incurred Claim Exposure Count Summary
2.3 - 2.4 Incurred Claim Exposure Count Development Method and Bornhuetter-Ferguson Method
Exhibit Set 3 Unrepresented Bodily Injury Liability
3.1 Summary of Incurred Estimates
3.2 Incurred Claim Exposure Count Summary
3.3 - 3.4 Incurred Claim Exposure Count Development Method
3.5 CWA Claim Exposure Count Closure Pattern
3.6 CWA Disposal Rate
3.7 Paid Loss and ALAE Development
3.8 Incremental Paid Severities
3.9 Incremental Paid Severity Starting Points
3.10 Fiscal Year Paid Severity Trend
Exhibit Set 4 Represented Excluding Large and Catastrophic Bodily Injury Liability
4.1 Summary of Incurred Estimates
4.2 CWA Claim Exposure Count Closure Pattern
4.3 CWA Disposal Rate
4.4 Paid Loss and ALAE Development
4.5 Incremental Paid Severities
4.6 Incremental Paid Severity Starting Points
4.7 Fiscal Year Paid Severity Trend (0 to 24 months)
4.8 Fiscal Year Paid Severity Trend (24 months and later)
4.9 Open Claim Exposure Count
Exhibit Set 5 Represented Large and Catastrophic Bodily Injury Liability
5.1 Summary of Incurred Estimates
5.2 Incurred Claim Exposure Count Summary
5.3 Incurred Claim Exposure Count Development Method and Bornhuetter-Ferguson Method
5.4 Incurred Claim Exposure Count Development Method
5.5 - 5.7 Incurred Claim Exposure Count Hindsight Method
5.8 CWA Claim Exposure Count Closure Pattern
5.9 CWA Disposal Rate
5.10 Paid Loss and ALAE Development
5.11 Incremental Paid Severities
5.12 Incremental Paid Severity Starting Points
5.13 Fiscal Year Paid Severity Trend
* All loss amounts shown in the exhibits of the Injury Segment Analysis are gross of reinsurance, but net of all other recoveries
Corporate Actuarial Department

Insurance Corporation of British Columbia Exhibit 1.1
Bodily Injury Liability Loss and ALAE Summary and Allocation
Incurred Loss and ALAE Summary ($000's)
Up to March 31, 2019
(1) (2) (3)
(2) - (1)
Fiscal Loss
Year
Total Optional
Incurred Loss
and ALAE
from 2018
August
Reserve
Analysis
Total Incurred
Loss and
ALAE
Basic
Incurred Loss
and ALAE
2002 859,244
2003 885,134
2004 961,487
2005 1,017,810
2006 1,096,458
2007 1,099,532
2008 1,139,871
2009 1,172,359
2010 1,220,898
2011 1,372,330
2012 1,415,068
2013 1,562,194
2014 1,739,617
2015 1,932,069
2016 2,129,672
2017 2,238,578
2018 2,623,340
Total 24,465,662
(1) From ICBC's analysis of Optional Bodily Injury claims reserves as of August 31, 2018
(2) From Exhibit 1.2 Col. (4)
(3) These estimated Basic incurred loss and ALAE amounts are also provided in
Technical Appendix C.1.5.3 Col. (1) of the 2019 Revenue Requirements Application
Corporate Actuarial Department

Insurance Corporation of British Columbia Exhibit 1.2
Bodily Injury Liability Loss and ALAE Summary and Allocation
Incurred Loss and ALAE Summary by Segment ($000's)
Up to March 31, 2019
(1) (2) (3) (4)
(1) + (2) + (3)
Fiscal Loss
Year Unrepresented
Represented
excluding
Large and
Catastrophic
Represented
Large and
Catastrophic Total
2002
2003
2004
2005
2006
2007
2008
2009
2010
2011
2012
2013
2014
2015
2016
2017
2018
Total
(1) From Exhibit 3.1 Col. (2)
(2) From Exhibit 4.1 Col. (2)
(3) From Exhibit 5.1 Col. (2)
Corporate Actuarial Department

Insurance Corporation of British Columbia Exhibit 2.1
Total Bodily Injury Liability Incurred Count
Incurred Claim Exposure Count Summary by Segment
Up to March 31, 2019
(1) (2) (3) (4) (5)
(4) - (1) - (3) [(2) + (3)] ÷ (4)
Fiscal Loss
Year Unrepresented
Represented
excluding
Large and
Catastrophic
Represented
Large and
Catastrophic Total
Rep Rate
(including
Large and
Catastrophic)
2002 29,734 17,012 885 47,631 37.6%
2003 27,242 16,202 938 44,382 38.6%
2004 27,722 16,743 1,005 45,470 39.0%
2005 26,702 16,649 1,073 44,424 39.9%
2006 26,969 17,385 1,157 45,511 40.7%
2007 26,227 17,293 1,165 44,685 41.3%
2008 25,137 17,489 1,278 43,903 42.7%
2009 23,152 17,257 1,388 41,797 44.6%
2010 21,965 18,280 1,403 41,648 47.3%
2011 24,325 19,720 1,585 45,630 46.7%
2012 22,871 21,393 1,586 45,851 50.1%
2013 22,245 22,803 1,842 46,889 52.6%
2014 22,697 23,670 2,102 48,469 53.2%
2015 24,647 26,295 2,219 53,160 53.6%
2016 26,708 30,266 2,199 59,173 54.9%
2017 27,731 31,969 2,281 61,981 55.3%
2018 28,266 35,218 2,603 66,086 57.2%
2019 28,009 36,290 2,918 67,217 58.3%
Total 462,348 401,934 29,627 893,909
(a) Trend 1.4%
(1) From Exhibit 3.1 Col. (1)
(3) From Exhibit 5.1 Col. (1)
(4) From Exhibit 2.2 Col. (3)
(a) Linear trend of (5) over fiscal loss years 2008 to 2017
Corporate Actuarial Department

Insurance Corporation of British Columbia Exhibit 2.2
Total Bodily Injury Liability Incurred Count
Incurred Claim Exposure Count Summary
Up to March 31, 2019
(1) (2) (3)
Fiscal Loss
Year
Development
Method
Bornhuetter-
Ferguson
Method
Selected
Incurred Claim
Exposure
Count
2002 47,631 47,631 47,631
2003 44,382 44,382 44,382
2004 45,470 45,470 45,470
2005 44,424 44,424 44,424
2006 45,511 45,511 45,511
2007 44,685 44,685 44,685
2008 43,903 43,903 43,903
2009 41,797 41,797 41,797
2010 41,648 41,648 41,648
2011 45,630 45,630 45,630
2012 45,851 45,851 45,851
2013 46,889 46,889 46,889
2014 48,469 48,471 48,469
2015 53,160 53,160 53,160
2016 59,173 59,163 59,173
2017 61,981 61,982 61,981
2018 66,086 66,110 66,086
2019 66,576 67,217 67,217
Total 893,268 893,925 893,909
(1) From Exhibit 2.3 Col. (4)
(2) From Exhibit 2.3 Col. (9)
(3) = Col. (1) for fiscal loss years 2002 to 2018
= Col. (2) for fiscal loss year 2019
Corporate Actuarial Department

Insurance Corporation of British Columbia Exhibit 2.3
Total Bodily Injury Liability Incurred Count
Incurred Claim Exposure Count Development Method and Bornhuetter-Ferguson Method
Up to March 31, 2019
(1) (2) (3) (4) (5) (6) (7) (8) (9)
(1) x (3) (4) ÷ (5) 1 - 1 ÷ (3)
Fiscal Loss
Year
Open and
CWA* Claim
Exposure
Count
Age-to-
Age CDF**
Age-to-
Ultimate
CDF
Incurred
Claim
Exposure
Count
Risk
Exposure
Indicated
Incurred
Frequency
Trended
Incurred
Frequency
Percentage
Unreported
Count
Incurred Claim
Exposure
Count
(Bornhuetter-
Ferguson
Method)
2002 47,631 1.0000 1.0000 47,631 2,363,098 2.016% 0.00% 47,631
2003 44,382 1.0000 1.0000 44,382 2,397,249 1.851% 0.00% 44,382
2004 45,470 1.0000 1.0000 45,470 2,438,711 1.865% 0.00% 45,470
2005 44,424 1.0000 1.0000 44,424 2,497,756 1.779% 0.00% 44,424
2006 45,511 1.0000 1.0000 45,511 2,562,601 1.776% 0.00% 45,511
2007 44,677 1.0002 1.0002 44,685 2,634,785 1.696% 0.02% 44,685
2008 43,883 1.0003 1.0005 43,903 2,709,074 1.621% 0.05% 43,903
2009 41,770 1.0002 1.0007 41,797 2,760,413 1.514% 0.07% 41,797
2010 41,606 1.0004 1.0010 41,648 2,785,866 1.495% 0.10% 41,648
2011 45,569 1.0003 1.0014 45,630 2,827,554 1.614% 0.14% 45,630
2012 45,774 1.0003 1.0017 45,851 2,862,519 1.602% 0.17% 45,851
2013 46,788 1.0005 1.0022 46,889 2,902,524 1.615% 0.22% 46,889
2014 48,341 1.0005 1.0026 48,469 2,950,153 1.643% 1.672% 0.26% 48,471
2015 52,999 1.0004 1.0030 53,160 3,008,066 1.767% 1.762% 0.30% 53,160
2016 58,826 1.0029 1.0059 59,173 3,091,385 1.914% 1.857% 0.59% 59,163
2017 61,316 1.0049 1.0108 61,981 3,169,735 1.955% 1.957% 1.07% 61,982
2018 64,521 1.0133 1.0243 66,086 3,252,816 2.032% 2.063% 2.37% 66,110
2019 58,877 1.1040 1.1308 66,576 3,317,036 2.007% 2.174% 11.56% 67,217
Total 882,364 893,268 893,925
* CWA = Completed With Amount
** CDF = Count Development Factor
(1) From Exhibit 2.4
(2) From Exhibit 2.4
(3) From Exhibit 2.4
(5) From internal ICBC database; estimated for fiscal loss year 2019
(7) Exponential trend of (6) over fiscal loss years 2014 to 2018
(9) = (4) for fiscal loss years 2002 to 2013
= (1) + (5) x (7) x (8) for fiscal loss years 2014 to 2019
Corporate Actuarial Department
Insurance Corporation of British Columbia Exhibit 2.4
Total Bodily Injury Liability Incurred Count
Incurred Claim Exposure Count Development Method
(1) Open and CWA Claim Exposure Count
Fiscal Loss Year 12 24 36 48 60 72 84 96 108 120 132 144 156 168 180 192 204 216
2002 47,533 47,537 47,559 47,553 47,555 47,575 47,580 47,591 47,599 47,611 47,618 47,625 47,629 47,631
2003 44,283 44,337 44,330 44,307 44,314 44,327 44,339 44,352 44,361 44,366 44,372 44,376 44,380 44,382
2004 45,351 45,376 45,375 45,395 45,392 45,404 45,418 45,416 45,426 45,435 45,449 45,460 45,470 45,470
2005 43,833 44,200 44,271 44,308 44,315 44,334 44,345 44,356 44,374 44,392 44,401 44,411 44,419 44,424
2006 44,302 44,897 45,362 45,442 45,435 45,440 45,441 45,444 45,463 45,479 45,487 45,493 45,501 45,511
2007 42,674 43,932 44,448 44,550 44,559 44,562 44,580 44,593 44,616 44,634 44,655 44,662 44,677
2008 41,325 43,187 43,615 43,806 43,801 43,791 43,805 43,833 43,848 43,855 43,870 43,883
2009 39,955 41,101 41,551 41,661 41,676 41,687 41,723 41,730 41,736 41,750 41,770
2010 39,464 40,982 41,486 41,531 41,538 41,559 41,563 41,583 41,588 41,606
2011 43,279 44,799 45,321 45,372 45,477 45,492 45,525 45,538 45,569
2012 43,651 44,989 45,484 45,669 45,706 45,717 45,726 45,774
2013 43,215 45,792 46,496 46,658 46,743 46,747 46,788
2014 44,489 47,316 47,926 48,055 48,296 48,341
2015 48,084 51,857 52,493 52,799 52,999
2016 51,754 57,562 58,381 58,826
2017 55,029 60,489 61,316
2018 58,628 64,521
2019 58,877
Development Factors
Fiscal Loss Year 12 to 24 24 to 36 36 to 48 48 to 60 60 to 72 72 to 84 84 to 96 96 to 108 108 to 120 120 to 132 132 to 144 144 to 156 156 to 168 168 to 180 180 to 192 192 to 204 204 to 216
2002 1.0001 1.0005 0.9999 1.0000 1.0004 1.0001 1.0002 1.0002 1.0003 1.0001 1.0001 1.0001 1.0000
2003 1.0012 0.9998 0.9995 1.0002 1.0003 1.0003 1.0003 1.0002 1.0001 1.0001 1.0001 1.0001 1.0000
2004 1.0006 1.0000 1.0004 0.9999 1.0003 1.0003 1.0000 1.0002 1.0002 1.0003 1.0002 1.0002 1.0000
2005 1.0084 1.0016 1.0008 1.0002 1.0004 1.0002 1.0002 1.0004 1.0004 1.0002 1.0002 1.0002 1.0001
2006 1.0134 1.0104 1.0018 0.9998 1.0001 1.0000 1.0001 1.0004 1.0004 1.0002 1.0001 1.0002 1.0002
2007 1.0295 1.0117 1.0023 1.0002 1.0001 1.0004 1.0003 1.0005 1.0004 1.0005 1.0002 1.0003
2008 1.0451 1.0099 1.0044 0.9999 0.9998 1.0003 1.0006 1.0003 1.0002 1.0003 1.0003
2009 1.0287 1.0109 1.0026 1.0004 1.0003 1.0009 1.0002 1.0001 1.0003 1.0005
2010 1.0385 1.0123 1.0011 1.0002 1.0005 1.0001 1.0005 1.0001 1.0004
2011 1.0351 1.0117 1.0011 1.0023 1.0003 1.0007 1.0003 1.0007
2012 1.0307 1.0110 1.0041 1.0008 1.0002 1.0002 1.0011
2013 1.0596 1.0154 1.0035 1.0018 1.0001 1.0009
2014 1.0635 1.0129 1.0027 1.0050 1.0009
2015 1.0785 1.0123 1.0058 1.0038
2016 1.1122 1.0142 1.0076
2017 1.0992 1.0137
2018 1.1005
Baseline Factor
avg 4 1.0976 1.0133 1.0049 1.0029 1.0004 1.0005 1.0005 1.0003 1.0003 1.0004 1.0002 1.0003 1.0002 1.0001 1.0001 1.0001 1.0000
Selected Assumption avg 3 avg 4 avg 4 avg 4 avg 4 avg 4 avg 4 avg 4 avg 4 avg 4 avg 4 avg 4 avg 4 one one one one one
Selected Factor 1.1040 1.0133 1.0049 1.0029 1.0004 1.0005 1.0005 1.0003 1.0003 1.0004 1.0002 1.0003 1.0002 1.0000 1.0000 1.0000 1.0000 1.0000
Age-to-Ultimate Factor 1.1308 1.0243 1.0108 1.0059 1.0030 1.0026 1.0022 1.0017 1.0014 1.0010 1.0007 1.0005 1.0002 1.0000 1.0000 1.0000 1.0000 1.0000
(1 shaded area) Based on 2018 August YTD open and CWA claim exposure count, and the expectation for the remainder of the year
Corporate Actuarial Department
Insurance Corporation of British Columbia Exhibit 3.1
Unrepresented Bodily Injury Liability
Summary of Incurred Estimates
Up to March 31, 2019
(1) (2)
Fiscal Loss Year
Incurred Claim
Exposure
Count
Incurred Loss
and ALAE
($000's)
2002 29,734
2003 27,242
2004 27,722
2005 26,702
2006 26,969
2007 26,227
2008 25,137
2009 23,152
2010 21,965
2011 24,325
2012 22,871
2013 22,245
2014 22,697
2015 24,647
2016 26,708
2017 27,731
2018 28,266
2019 28,009
Total 462,348
Subtotal (2002-2018) 434,339
(1) From Exhibit 3.2 Col. (4)
(2) From Exhibit 3.7 Col. (3)
Corporate Actuarial Department
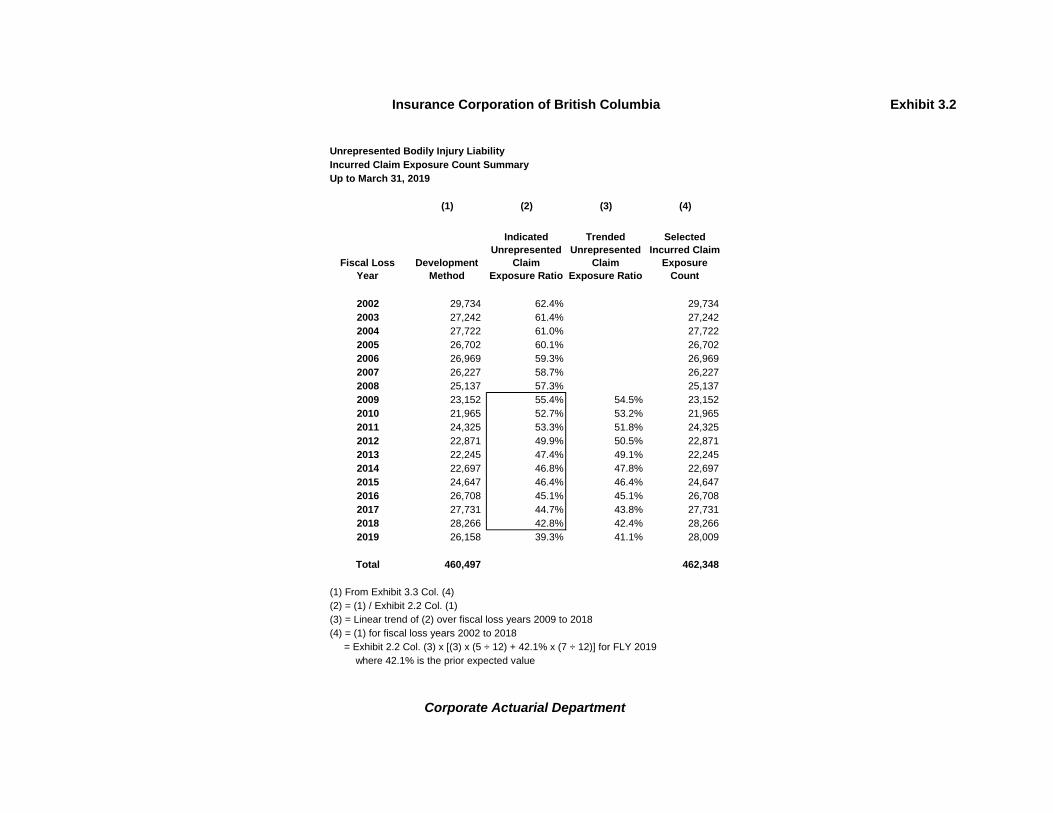
Insurance Corporation of British Columbia Exhibit 3.2
Unrepresented Bodily Injury Liability
Incurred Claim Exposure Count Summary
Up to March 31, 2019
(1) (2) (3) (4)
Fiscal Loss
Year
Development
Method
Indicated
Unrepresented
Claim
Exposure Ratio
Trended
Unrepresented
Claim
Exposure Ratio
Selected
Incurred Claim
Exposure
Count
2002 29,734 62.4% 29,734
2003 27,242 61.4% 27,242
2004 27,722 61.0% 27,722
2005 26,702 60.1% 26,702
2006 26,969 59.3% 26,969
2007 26,227 58.7% 26,227
2008 25,137 57.3% 25,137
2009 23,152 55.4% 54.5% 23,152
2010 21,965 52.7% 53.2% 21,965
2011 24,325 53.3% 51.8% 24,325
2012 22,871 49.9% 50.5% 22,871
2013 22,245 47.4% 49.1% 22,245
2014 22,697 46.8% 47.8% 22,697
2015 24,647 46.4% 46.4% 24,647
2016 26,708 45.1% 45.1% 26,708
2017 27,731 44.7% 43.8% 27,731
2018 28,266 42.8% 42.4% 28,266
2019 26,158 39.3% 41.1% 28,009
Total 460,497 462,348
(1) From Exhibit 3.3 Col. (4)
(2) = (1) / Exhibit 2.2 Col. (1)
(3) = Linear trend of (2) over fiscal loss years 2009 to 2018
(4) = (1) for fiscal loss years 2002 to 2018
= Exhibit 2.2 Col. (3) x [(3) x (5 ÷ 12) + 42.1% x (7 ÷ 12)] for FLY 2019
where 42.1% is the prior expected value
Corporate Actuarial Department

Insurance Corporation of British Columbia Exhibit 3.3
Unrepresented Bodily Injury Liability
Incurred Claim Exposure Count Development Method
Up to March 31, 2019
(1) (2) (3) (4)
(1) x (3)
Fiscal Loss
Year
Open and CWA
Claim
Exposure
Count
Age-to-Age
CDF
Age-to-Ultimate
CDF
Incurred Claim
Exposure
Count
2002 29,734 1.0000 1.0000 29,734
2003 27,242 1.0000 1.0000 27,242
2004 27,722 1.0000 1.0000 27,722
2005 26,702 1.0000 1.0000 26,702
2006 26,969 1.0000 1.0000 26,969
2007 26,225 1.0001 1.0001 26,227
2008 25,133 1.0001 1.0001 25,137
2009 23,149 1.0000 1.0001 23,152
2010 21,959 1.0001 1.0003 21,965
2011 24,315 1.0001 1.0004 24,325
2012 22,855 1.0003 1.0007 22,871
2013 22,224 1.0002 1.0009 22,245
2014 22,666 1.0004 1.0014 22,697
2015 24,603 1.0004 1.0018 24,647
2016 26,661 1.0000 1.0018 26,708
2017 27,756 0.9973 0.9991 27,731
2018 29,842 0.9480 0.9472 28,266
2019 29,657 0.9312 0.8820 26,158
Total 465,414 460,497
(1) From Exhibit 3.4
(2) From Exhibit 3.4
(3) From Exhibit 3.4
Corporate Actuarial Department

Insurance Corporation of British Columbia Exhibit 3.4
Unrepresented Bodily Injury Liability
Incurred Claim Exposure Count Development Method
(1) Open and CWA Claim Exposure Count
Fiscal Loss Year 12 24 36 48 60 72 84 96 108 120 132 144 156 168 180 192 204 216
2002 29,787 29,748 29,744 29,735 29,735 29,735 29,730 29,732 29,733 29,735 29,736 29,734 29,734 29,734
2003 27,335 27,278 27,254 27,245 27,243 27,238 27,242 27,239 27,243 27,237 27,239 27,239 27,242 27,242
2004 28,064 27,829 27,756 27,736 27,731 27,724 27,724 27,713 27,714 27,712 27,713 27,715 27,722 27,722
2005 28,366 26,942 26,737 26,737 26,714 26,713 26,710 26,703 26,698 26,700 26,701 26,701 26,702 26,702
2006 32,422 28,408 27,276 27,115 27,039 27,018 27,004 26,972 26,959 26,961 26,961 26,964 26,967 26,969
2007 30,665 27,509 26,527 26,351 26,307 26,292 26,243 26,238 26,232 26,223 26,227 26,222 26,225
2008 29,016 26,443 25,332 25,231 25,202 25,144 25,133 25,119 25,124 25,128 25,131 25,133
2009 27,438 24,319 23,331 23,248 23,162 23,154 23,142 23,141 23,137 23,142 23,149
2010 25,807 23,112 22,188 22,036 21,960 21,935 21,928 21,935 21,949 21,959
2011 28,419 25,811 24,508 24,323 24,274 24,286 24,304 24,300 24,315
2012 27,834 24,235 22,911 22,842 22,831 22,833 22,839 22,855
2013 25,882 23,335 22,305 22,184 22,190 22,200 22,224
2014 26,845 24,008 22,661 22,643 22,652 22,666
2015 29,063 26,059 24,678 24,608 24,603
2016 30,355 28,112 26,704 26,661
2017 31,383 29,177 27,756
2018 31,823 29,842
2019 29,657
Development Factors
Fiscal Loss Year 12 to 24 24 to 36 36 to 48 48 to 60 60 to 72 72 to 84 84 to 96 96 to 108 108 to 120 120 to 132 132 to 144 144 to 156 156 to 168 168 to 180 180 to 192 192 to 204 204 to 216
2002 0.9987 0.9999 0.9997 1.0000 1.0000 0.9998 1.0001 1.0000 1.0001 1.0000 0.9999 1.0000 1.0000
2003 0.9979 0.9991 0.9997 0.9999 0.9998 1.0001 0.9999 1.0001 0.9998 1.0001 1.0000 1.0001 1.0000
2004 0.9916 0.9974 0.9993 0.9998 0.9997 1.0000 0.9996 1.0000 0.9999 1.0000 1.0001 1.0003 1.0000
2005 0.9498 0.9924 1.0000 0.9991 1.0000 0.9999 0.9997 0.9998 1.0001 1.0000 1.0000 1.0000 1.0000
2006 0.8762 0.9602 0.9941 0.9972 0.9992 0.9995 0.9988 0.9995 1.0001 1.0000 1.0001 1.0001 1.0001
2007 0.8971 0.9643 0.9934 0.9983 0.9994 0.9981 0.9998 0.9998 0.9997 1.0002 0.9998 1.0001
2008 0.9113 0.9580 0.9960 0.9989 0.9977 0.9996 0.9994 1.0002 1.0002 1.0001 1.0001
2009 0.8863 0.9594 0.9964 0.9963 0.9997 0.9995 1.0000 0.9998 1.0002 1.0003
2010 0.8956 0.9600 0.9931 0.9966 0.9989 0.9997 1.0003 1.0006 1.0005
2011 0.9082 0.9495 0.9925 0.9980 1.0005 1.0007 0.9998 1.0006
2012 0.8707 0.9454 0.9970 0.9995 1.0001 1.0003 1.0007
2013 0.9016 0.9559 0.9946 1.0003 1.0005 1.0011
2014 0.8943 0.9439 0.9992 1.0004 1.0006
2015 0.8966 0.9470 0.9972 0.9998
2016 0.9261 0.9499 0.9984
2017 0.9297 0.9513
2018 0.9377
Baseline Factor
avg 4 0.9226 0.9480 0.9973 1.0000 1.0004 1.0004 1.0002 1.0003 1.0001 1.0001 1.0000 1.0001 1.0001 1.0001 1.0000 1.0000 1.0000
Selected Assumption avg 3 avg 4 avg 4 avg 4 avg 4 avg 4 avg 4 avg 4 avg 4 avg 4 avg 4 avg 4 avg 4 one one one one one
Selected Factor 0.9312 0.9480 0.9973 1.0000 1.0004 1.0004 1.0002 1.0003 1.0001 1.0001 1.0000 1.0001 1.0001 1.0000 1.0000 1.0000 1.0000 1.0000
Age-to-Ultimate Factor 0.8820 0.9472 0.9991 1.0018 1.0018 1.0014 1.0009 1.0007 1.0004 1.0003 1.0001 1.0001 1.0001 1.0000 1.0000 1.0000 1.0000 1.0000
(1 shaded area) Based on 2018 August YTD open and CWA claim exposure count, and the expectation for the remainder of the year
Corporate Actuarial Department

Insurance Corporation of British Columbia Exhibit 3.5
Unrepresented Bodily Injury Liability
CWA Claim Exposure Count Closure Pattern
(1) CWA Claim Exposure Count
Fiscal Loss
Year 12 24 36 48 60 72 84 96 108 120 132 144 156 168 180 192 204 216
2001 28,668 28,737 28,784 28,799 28,815 28,826 28,828 28,836 28,840 28,841 28,843 28,844 28,844
2002 29,445 29,590 29,654 29,678 29,698 29,702 29,709 29,722 29,729 29,725 29,730 29,732 29,733 29,733
2003 26,682 26,939 27,050 27,134 27,177 27,200 27,214 27,217 27,226 27,230 27,236 27,237 27,241 27,242 27,242
2004 26,676 27,207 27,442 27,564 27,619 27,644 27,667 27,677 27,687 27,695 27,704 27,710 27,716 27,719 27,720 27,722
2005 22,711 25,822 26,200 26,428 26,513 26,596 26,635 26,664 26,675 26,685 26,694 26,696 26,699 26,699 26,700 26,700 26,702
2006 12,217 23,534 26,176 26,531 26,728 26,831 26,889 26,919 26,920 26,939 26,947 26,956 26,960 26,965 26,966 26,967 26,968 26,969
2007 13,417 23,205 25,416 25,748 25,957 26,086 26,146 26,168 26,186 26,197 26,214 26,219 26,223 26,224 26,225 26,226 26,226 26,227
2008 13,333 22,317 24,531 24,848 24,963 25,019 25,057 25,086 25,106 25,120 25,126 25,128 25,131 25,133 25,134 25,135 25,135 25,137
2009 12,026 20,446 22,565 22,833 22,965 23,029 23,082 23,104 23,115 23,137 23,139 23,144 23,147 23,148 23,150 23,151 23,151 23,152
2010 11,333 19,659 21,430 21,696 21,812 21,875 21,888 21,912 21,935 21,944 21,951 21,956 21,959 21,961 21,963 21,964 21,964 21,965
2011 14,082 21,795 23,811 24,032 24,133 24,200 24,242 24,272 24,279 24,294 24,304 24,311 24,316 24,319 24,321 24,322 24,323 24,325
2012 11,829 19,884 22,364 22,621 22,732 22,773 22,806 22,818 22,836 22,847 22,855 22,861 22,864 22,867 22,868 22,869 22,870 22,871
2013 10,082 19,770 21,772 21,978 22,080 22,144 22,164 22,188 22,207 22,219 22,228 22,233 22,237 22,240 22,241 22,242 22,243 22,245
2014 11,079 19,917 22,168 22,407 22,525 22,574 22,605 22,632 22,654 22,668 22,678 22,684 22,688 22,691 22,693 22,694 22,695 22,697
2015 12,313 21,716 24,295 24,438 24,498 24,547 24,573 24,594 24,612 24,623 24,631 24,636 24,640 24,642 24,644 24,645 24,645 24,647
2016 13,018 23,758 26,286 26,432 26,537 26,594 26,623 26,648 26,668 26,682 26,691 26,697 26,701 26,703 26,705 26,706 26,707 26,708
2017 14,891 25,361 27,439 27,559 27,624 27,660 27,678 27,693 27,706 27,714 27,720 27,724 27,726 27,728 27,729 27,730 27,730 27,731
2018 15,394 25,692 27,934 28,070 28,144 28,184 28,205 28,223 28,237 28,247 28,253 28,257 28,260 28,262 28,263 28,264 28,265 28,266
2019 14,960 25,399 27,673 27,811 27,886 27,927 27,948 27,965 27,980 27,990 27,996 28,000 28,003 28,005 28,006 28,007 28,008 28,009
(2) Incremental CWA Claim Exposure Count
Fiscal Loss
Year 0 - 12 12 - 24 24 - 36 36 - 48 48 - 60 60 - 72 72 - 84 84 - 96 96 - 108 108 - 120 120 - 132 132 - 144 144 - 156 156 - 168 168 - 180 180 - 192 192 - 204 204 - 216
2001 69 47 15 16 11 2 8 4 1 2 1 -
2002 145 64 24 20 4 7 13 7 (4) 5 2 1 (0)
2003 257 111 84 43 23 14 3 9 4 6 1 4 1 (0)
2004 531 235 122 55 25 23 10 10 8 9 6 6 3 1 2
2005 3,111 378 228 85 83 39 29 11 10 9 2 3 (0) 1 1 2
2006 12,217 11,317 2,642 355 197 103 58 30 1 19 8 9 4 5 1 1 1 1
2007 13,417 9,788 2,211 332 209 129 60 22 18 11 17 5 4 1 1 1 0 1
2008 13,333 8,984 2,214 317 115 56 38 29 20 14 6 2 3 2 1 1 1 1
2009 12,026 8,420 2,119 268 132 64 53 22 11 22 2 4 3 2 1 1 1 1
2010 11,333 8,326 1,771 266 116 63 13 24 23 9 7 5 3 2 1 1 1 1
2011 14,082 7,713 2,016 221 101 67 42 30 7 15 10 7 4 3 2 1 1 2
2012 11,829 8,055 2,480 257 111 41 33 12 18 12 8 5 4 2 2 1 1 1
2013 10,082 9,688 2,002 206 102 64 20 23 19 13 8 6 4 2 2 1 1 1
2014 11,079 8,838 2,251 239 118 49 31 27 22 14 10 6 4 3 2 1 1 2
2015 12,313 9,403 2,579 143 60 49 25 22 17 12 8 5 3 2 2 1 1 1
2016 13,018 10,740 2,528 146 105 56 29 25 20 13 9 6 4 3 2 1 1 2
2017 14,891 10,470 2,078 120 66 35 18 16 13 8 6 4 2 2 1 1 0 1
2018 15,394 10,298 2,243 136 74 40 21 18 14 10 6 4 3 2 1 1 1 1
2019 14,960 10,439 2,274 138 76 40 21 18 14 10 6 4 3 2 1 1 1 1
(1 shaded area) = (1) prior column + (2)
For example FLY 2016 @ 60 months: 26,537 = 26,432 + 105
(2 lighter shaded area) Based on 2018 August YTD CWA claim exposure count, and the expectation for the remainder of the year
(2 darker shaded area) = Exhibit 3.6 (1) x (Exhibit 3.1 Col. (1) - (1) prior column)
For example FLY 2016 @ 48-60 months: 105 = 38.07% x (26,708 - 26,432)
Corporate Actuarial Department

Insurance Corporation of British Columbia Exhibit 3.6
Unrepresented Bodily Injury Liability
CWA Disposal Rate
(1) CWA Disposal Rate
Fiscal Loss
Year 0 - 12 12 - 24 24 - 36 36 - 48 48 - 60 60 - 72 72 - 84 84 - 96 96 - 108 108 - 120 120 - 132 132 - 144 144 - 156 156 - 168 168 - 180 180 - 192 192 - 204 204 - 216
2002 50.17% 44.44% 30.00% 35.71% 11.11% 21.88% 52.00% 58.33% -80.00% 55.56% 50.00% 50.00% -44.94%
2003 45.89% 36.63% 43.75% 39.81% 35.38% 33.33% 10.71% 36.00% 25.00% 50.00% 16.67% 80.00% 118.35% 100.00%
2004 50.76% 45.63% 43.57% 34.81% 24.27% 29.49% 18.18% 22.22% 22.86% 33.33% 33.33% 50.00% 51.69% 33.33% 100.00%
2005 77.95% 42.95% 45.42% 31.02% 43.92% 36.79% 43.28% 28.95% 37.04% 52.94% 25.00% 50.00% -14.98% 33.33% 33.33% 100.00%
2006 45.30% 76.72% 76.92% 44.77% 44.99% 42.76% 42.06% 37.55% 2.00% 38.85% 26.75% 41.09% 31.00% 51.61% 33.33% 33.33% 33.33% 100.00%
2007 51.16% 76.41% 73.16% 40.94% 43.63% 47.77% 42.54% 27.15% 30.49% 26.81% 56.60% 38.35% 46.84% 33.33% 33.33% 33.33% 33.33% 100.00%
2008 53.04% 76.11% 78.52% 52.34% 39.85% 32.26% 32.31% 36.43% 39.52% 45.75% 36.14% 18.78% 33.33% 33.33% 33.33% 33.33% 33.33% 100.00%
2009 51.94% 75.68% 78.30% 45.64% 41.35% 34.18% 43.00% 31.31% 22.79% 59.04% 15.42% 33.33% 33.33% 33.33% 33.33% 33.33% 33.33% 100.00%
2010 51.59% 78.31% 76.79% 49.68% 43.05% 41.06% 14.38% 31.00% 43.05% 29.87% 33.33% 33.33% 33.33% 33.33% 33.33% 33.33% 33.33% 100.00%
2011 57.89% 75.30% 79.70% 43.03% 34.52% 34.98% 33.72% 36.34% 13.70% 33.33% 33.33% 33.33% 33.33% 33.33% 33.33% 33.33% 33.33% 100.00%
2012 51.72% 72.95% 83.02% 50.67% 44.36% 29.45% 33.60% 18.17% 33.33% 33.33% 33.33% 33.33% 33.33% 33.33% 33.33% 33.33% 33.33% 100.00%
2013 45.32% 79.65% 80.90% 43.58% 38.25% 38.87% 20.24% 29.20% 33.33% 33.33% 33.33% 33.33% 33.33% 33.33% 33.33% 33.33% 33.33% 100.00%
2014 48.81% 76.07% 80.98% 45.19% 40.71% 28.50% 25.48% 29.20% 33.33% 33.33% 33.33% 33.33% 33.33% 33.33% 33.33% 33.33% 33.33% 100.00%
2015 49.96% 76.24% 88.00% 40.67% 28.98% 32.95% 25.48% 29.20% 33.33% 33.33% 33.33% 33.33% 33.33% 33.33% 33.33% 33.33% 33.33% 100.00%
2016 48.74% 78.45% 85.68% 34.47% 38.07% 32.95% 25.48% 29.20% 33.33% 33.33% 33.33% 33.33% 33.33% 33.33% 33.33% 33.33% 33.33% 100.00%
2017 53.70% 81.54% 87.69% 40.98% 38.07% 32.95% 25.48% 29.20% 33.33% 33.33% 33.33% 33.33% 33.33% 33.33% 33.33% 33.33% 33.33% 100.00%
2018 54.46% 80.00% 87.12% 40.98% 38.07% 32.95% 25.48% 29.20% 33.33% 33.33% 33.33% 33.33% 33.33% 33.33% 33.33% 33.33% 33.33% 100.00%
2019 53.41% 80.00% 87.12% 40.98% 38.07% 32.95% 25.48% 29.20% 33.33% 33.33% 33.33% 33.33% 33.33% 33.33% 33.33% 33.33% 33.33% 100.00%
Baseline Factor
Avg 4 79.06% 85.59% 40.98% 38.07% 32.95% 25.48% 29.20% 29.77% 40.37% 33.73% 37.79% 34.04% 46.24% 26.81% 60.56% 84.18% -44.94%
Selected Assumption avg 3 avg 3 avg 4 avg 4 avg 4 avg 4 avg 4 judg. 1/3 judg. 1/3 judg. 1/3 judg. 1/3 judg. 1/3 judg. 1/3 judg. 1/3 judg. 1/3 judg. 1/3 judg. 1
(a) Selected Factor 80.00% 87.12% 40.98% 38.07% 32.95% 25.48% 29.20% 33.33% 33.33% 33.33% 33.33% 33.33% 33.33% 33.33% 33.33% 33.33% 100.00%
(1 unshaded area) = Exhibit 3.5 (2) ÷ (Exhibit 3.1 Col. (1) - Exhibit 3.5 (1) prior column)
For example, FLY 2016 @ 12-24 months: 78.45% = 10,740 ÷ (26,708 - 13,018)
(1 shaded area) = (a)
Corporate Actuarial Department

Insurance Corporation of British Columbia Exhibit 3.7
Unrepresented Bodily Injury Liability
Paid Loss and ALAE Development
(1) Paid Loss and ALAE ($000's)
Fiscal Loss
Year 12 24 36 48 60 72 84 96 108 120 132 144 156 168 180 192 204 216
(3) Incurred
Loss and
ALAE ($000's)
2001
2002
2003
2004
2005
2006
2007
2008
2009
2010
2011
2012
2013
2014
2015
2016
2017
2018
2019
(2) Incremental Paid Loss and ALAE ($000's)
Fiscal Loss
Year 0 - 12 12 - 24 24 - 36 36 - 48 48 - 60 60 - 72 72 - 84 84 - 96 96 - 108 108 - 120 120 - 132 132 - 144 144 - 156 156 - 168 168 - 180 180 - 192 192 - 204 204 - 216
2001
2002
2003
2004
2005
2006
2007
2008
2009
2010
2011
2012
2013
2014
2015
2016
2017
2018
2019
(1 shaded area) = (1) prior column + (2)
For example FLY 2016 @ 60 months:
(2 shaded area) = Exhibit 3.5 (2) x Exhibit 3.8 (1)
(3) From the last column of (1)
Corporate Actuarial Department

Insurance Corporation of British Columbia Exhibit 3.8
Unrepresented Bodily Injury Liability
Incremental Paid Severities
(1) Incremental Paid Severity per CWA ($)
Fiscal Loss
Year 0 - 12 12 - 24 24 - 36 36 - 48 48 - 60 60 - 72 72 - 84 84 - 96 96 - 108 108 - 120 120 - 132 132 - 144 144 - 156 156 - 168 168 - 180 180 - 192 192 - 204 204 - 216
2001
2002
2003
2004
2005
2006
2007
2008
2009
2010
2011
2012
2013
2014
2015
2016
2017
2018
2019
(1 lighter shaded area) Based on 2018 August YTD paid severities, and the expectation for the remainder of the year
(1 darker shaded area) Based on trend from Exhibit 3.9 Row (b) starting from Exhibit 3.9 Row (a)
Note: Same starting point used from 36 to 216 months
Note: Grey data points on graphs are actual incremental paid severities, and black data points are forecasted incremental paid severities
Fiscal Loss Year
0 - 12 Months
Fiscal Loss Year
36 - 48 Months
Fiscal Loss Year
24 - 36 Months
Fiscal Loss Year
12 - 24 Months
Corporate Actuarial Department

Insurance Corporation of British Columbia Exhibit 3.9
Unrepresented Bodily Injury Liability
Incremental Paid Severity Starting Points
(1) Incremental Paid Severity per CWA ($)
Fiscal Loss Year 0 - 12 12 - 24 24 - 36 36+
2008
2009
2010
2011
2012
2013
2014
2015
2016
2017
2018
2019
0 - 12 12 - 24 24 - 36 36+
Selected Assumption avg trended 4* avg trended 4 avg trended 4 avg trended 4
(a) Selected Starting Point
(b) Selected Trend 2.0% 2.0% 2.0% 2.0%
(1) = Exhibit 3.7 (2) ÷ Exhibit 3.5 (2)
Note: 36+ includes up to 108 months for each fiscal loss year, except for 2016 which includes up to 216 months
For example FLY 2014 @ 36+ months:
*: avg trended 4 is calculated as the average of the last 4 years trended to the current year (FY 2019)
For example 12 - 24:
(b) = Exhibit 3.10 Row (a)
Corporate Actuarial Department

Insurance Corporation of British Columbia Exhibit 3.10
Unrepresented Bodily Injury Liability
Fiscal Year Paid Severity Trend
Up to March 31, 2019
(1) (2) (3)
(2) ÷ (1)
Fiscal Year
CWA Claim
Exposure
Count
Paid Loss and
ALAE ($000's)
Paid Severity
($)
2010 22,728
2011 25,304
2012 21,968
2013 20,760
2014 23,750
2015 23,712
2016 25,161
2017 28,721
2018 28,854
2019 27,655
(a) Trend 2.0%
(1) Based on Exhibit 3.5 (2) from 12 up to at least 144 months
For example fiscal year 2017 includes up to 204 months: 28,721 = 14,891 + 10,740 + … + 1
(2) Based on Exhibit 3.7 (2) from 12 up to at least 144 months
For example fiscal year 2017 includes up to 204 months:
(a) Exponential trend of (3) over fiscal years 2015 to 2019
Corporate Actuarial Department
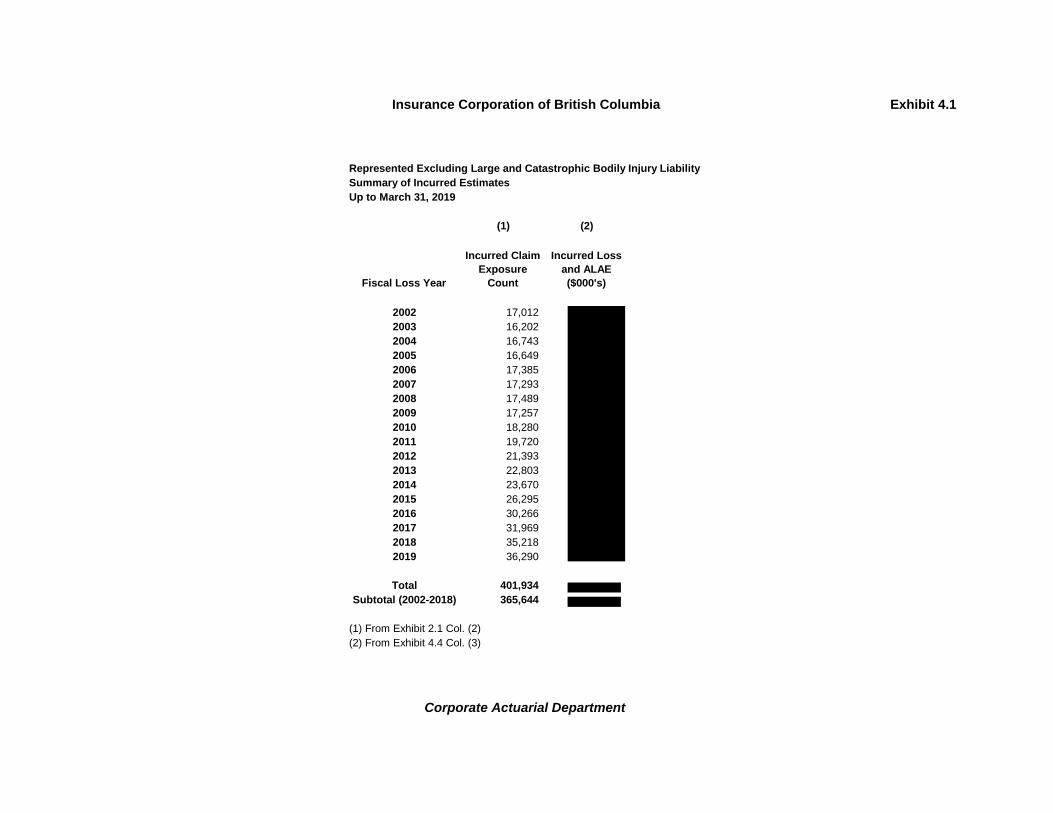
Insurance Corporation of British Columbia Exhibit 4.1
Represented Excluding Large and Catastrophic Bodily Injury Liability
Summary of Incurred Estimates
Up to March 31, 2019
(1) (2)
Fiscal Loss Year
Incurred Claim
Exposure
Count
Incurred Loss
and ALAE
($000's)
2002 17,012
2003 16,202
2004 16,743
2005 16,649
2006 17,385
2007 17,293
2008 17,489
2009 17,257
2010 18,280
2011 19,720
2012 21,393
2013 22,803
2014 23,670
2015 26,295
2016 30,266
2017 31,969
2018 35,218
2019 36,290
Total 401,934
Subtotal (2002-2018) 365,644
(1) From Exhibit 2.1 Col. (2)
(2) From Exhibit 4.4 Col. (3)
Corporate Actuarial Department

Insurance Corporation of British Columbia Exhibit 4.2
Represented Excluding Large and Catastrophic Bodily Injury Liability
CWA Claim Exposure Count Closure Pattern
(1) CWA Claim Exposure Count
Fiscal Loss
Year 12 24 36 48 60 72 84 96 108 120 132 144 156 168 180 192 204 216
2001 15,761 16,210 16,420 16,494 16,556 16,603 16,637 16,660 16,677 16,695 16,711 16,724 16,734
2002 15,077 16,091 16,506 16,684 16,781 16,836 16,874 16,917 16,944 16,956 16,974 16,982 16,994 17,007
2003 12,365 14,329 15,265 15,637 15,840 15,953 16,014 16,074 16,105 16,127 16,150 16,170 16,175 16,183 16,202
2004 9,370 12,846 14,873 15,822 16,207 16,383 16,457 16,535 16,594 16,635 16,663 16,688 16,701 16,716 16,725 16,743
2005 4,504 9,000 12,647 14,739 15,730 16,140 16,328 16,417 16,483 16,517 16,551 16,581 16,601 16,618 16,629 16,635 16,649
2006 859 4,648 9,416 13,134 15,455 16,457 16,847 17,039 17,160 17,227 17,275 17,304 17,329 17,347 17,360 17,368 17,374 17,385
2007 819 4,795 9,232 13,134 15,449 16,307 16,667 16,829 16,964 17,074 17,137 17,192 17,222 17,246 17,262 17,272 17,279 17,293
2008 917 4,832 9,257 13,405 15,595 16,458 16,849 17,077 17,201 17,308 17,355 17,388 17,422 17,444 17,459 17,469 17,476 17,489
2009 830 4,772 9,387 13,050 15,173 16,169 16,587 16,802 16,942 17,033 17,088 17,135 17,176 17,203 17,221 17,233 17,241 17,257
2010 868 5,105 9,702 13,466 15,948 17,099 17,576 17,847 17,953 18,043 18,108 18,156 18,198 18,225 18,243 18,256 18,264 18,280
2011 1,031 5,014 9,731 13,976 16,908 18,213 18,880 19,142 19,298 19,432 19,511 19,570 19,620 19,654 19,676 19,691 19,701 19,720
2012 819 5,508 11,277 15,625 18,409 19,907 20,480 20,779 20,952 21,092 21,175 21,236 21,288 21,323 21,347 21,362 21,373 21,393
2013 1,042 6,655 12,561 16,599 19,595 21,090 21,816 22,148 22,332 22,481 22,570 22,635 22,691 22,728 22,753 22,770 22,781 22,803
2014 1,182 6,703 12,263 16,991 20,119 21,814 22,582 22,948 23,151 23,316 23,413 23,485 23,547 23,588 23,615 23,633 23,646 23,670
2015 1,005 6,348 13,576 18,572 22,056 24,080 24,996 25,433 25,675 25,872 25,988 26,074 26,147 26,196 26,229 26,251 26,266 26,295
2016 1,137 8,320 16,154 21,069 25,403 27,724 28,776 29,277 29,555 29,781 29,914 30,012 30,097 30,153 30,191 30,216 30,232 30,266
2017 1,557 9,566 16,804 22,680 27,057 29,402 30,464 30,970 31,251 31,479 31,613 31,713 31,798 31,855 31,893 31,919 31,935 31,969
2018 1,989 8,406 17,722 24,501 29,551 32,256 33,482 34,066 34,389 34,653 34,807 34,922 35,021 35,086 35,130 35,159 35,179 35,218
2019 1,668 9,782 18,992 25,694 30,688 33,362 34,574 35,151 35,471 35,731 35,885 35,998 36,095 36,160 36,204 36,232 36,252 36,290
(2) Incremental CWA Claim Exposure Count
Fiscal Loss
Year 0 - 12 12 - 24 24 - 36 36 - 48 48 - 60 60 - 72 72 - 84 84 - 96 96 - 108 108 - 120 120 - 132 132 - 144 144 - 156 156 - 168 168 - 180 180 - 192 192 - 204 204 - 216
2001 449 210 74 62 47 34 23 17 18 16 13 10
2002 1,014 415 178 97 55 38 43 27 12 18 8 12 13
2003 1,964 936 372 203 113 61 60 31 22 23 20 5 8 19
2004 3,476 2,027 949 385 176 74 78 59 41 28 25 13 15 9 18
2005 4,496 3,647 2,092 991 410 188 89 66 34 34 30 20 17 10 7 14
2006 859 3,789 4,768 3,718 2,321 1,002 390 192 121 67 48 29 25 18 13 8 6 11
2007 819 3,976 4,437 3,902 2,315 858 360 162 135 110 63 55 30 24 16 11 7 14
2008 917 3,915 4,425 4,148 2,190 863 391 228 124 107 47 33 34 22 15 10 7 13
2009 830 3,942 4,615 3,663 2,123 996 418 215 140 91 55 47 41 27 18 12 8 16
2010 868 4,237 4,597 3,764 2,482 1,151 477 271 106 90 65 48 41 27 18 12 8 16
2011 1,031 3,983 4,717 4,245 2,932 1,305 667 262 156 134 79 58 50 33 22 15 10 20
2012 819 4,689 5,769 4,348 2,784 1,498 573 299 173 140 83 61 53 35 23 16 10 21
2013 1,042 5,613 5,906 4,038 2,996 1,496 725 332 184 150 88 65 56 37 25 17 11 22
2014 1,182 5,521 5,561 4,727 3,128 1,696 768 366 203 165 97 72 62 41 27 18 12 24
2015 1,005 5,343 7,228 4,996 3,484 2,023 917 437 242 197 116 86 74 49 33 22 15 29
2016 1,137 7,183 7,834 4,915 4,334 2,321 1,052 501 278 226 133 98 85 56 38 25 17 33
2017 1,557 8,008 7,238 5,876 4,378 2,345 1,062 506 281 228 134 99 85 57 38 25 17 34
2018 1,989 6,417 9,316 6,779 5,050 2,705 1,226 584 324 263 155 115 99 66 44 29 19 39
2019 1,668 8,114 9,211 6,702 4,993 2,674 1,212 577 320 260 153 113 97 65 43 29 19 38
(1 shaded area) = (1) prior column + (2)
For example FLY 2016 @ 60 months: 25,403 = 21,069 + 4,334
(2 lighter shaded area) Based on 2018 August YTD CWA claim exposure count, and the expectation for the remainder of the year
(2 darker shaded area) = Exhibit 4.3 (1) x (Exhibit 4.1 Col. (1) - (1) prior column)
For example FLY 2016 @ 48-60 months: 4,334 = 47.13% x (30,266 - 21,069)
Corporate Actuarial Department

Insurance Corporation of British Columbia Exhibit 4.3
Represented Excluding Large and Catastrophic Bodily Injury Liability
CWA Disposal Rate
(1) CWA Disposal Rate
Fiscal Loss Year 0 - 12 12 - 24 24 - 36 36 - 48 48 - 60 60 - 72 72 - 84 84 - 96 96 - 108 108 - 120 120 - 132 132 - 144 144 - 156 156 - 168 168 - 180 180 - 192 192 - 204 204 - 216
2002 52.40% 45.06% 35.17% 29.56% 23.80% 21.58% 31.14% 28.39% 17.62% 32.09% 21.00% 39.88% 69.53%
2003 51.19% 49.97% 39.70% 35.93% 31.22% 24.50% 31.91% 24.22% 22.68% 30.67% 38.46% 15.63% 28.50% 100.00%
2004 47.14% 52.01% 50.75% 41.80% 32.84% 20.56% 27.27% 28.37% 27.52% 25.93% 31.25% 23.64% 35.00% 33.33% 100.00%
2005 37.02% 47.68% 52.27% 51.88% 44.61% 36.94% 27.73% 28.45% 20.48% 25.76% 30.61% 29.41% 35.97% 33.33% 33.33% 100.00%
2006 4.94% 22.93% 37.43% 46.66% 54.60% 51.92% 42.03% 35.69% 34.98% 29.78% 30.39% 26.37% 30.88% 32.18% 33.33% 33.33% 33.33% 100.00%
2007 4.74% 24.13% 35.50% 48.40% 55.66% 46.52% 36.50% 25.87% 29.08% 33.41% 28.73% 35.20% 29.63% 33.33% 33.33% 33.33% 33.33% 100.00%
2008 5.24% 23.62% 34.96% 50.39% 53.63% 45.57% 37.93% 35.63% 30.11% 37.17% 25.98% 24.56% 33.33% 33.33% 33.33% 33.33% 33.33% 100.00%
2009 4.81% 24.00% 36.97% 46.55% 50.47% 47.80% 38.43% 32.10% 30.79% 28.91% 24.50% 27.97% 33.33% 33.33% 33.33% 33.33% 33.33% 100.00%
2010 4.75% 24.33% 34.89% 43.88% 51.56% 49.36% 40.39% 38.49% 24.48% 27.65% 27.40% 27.97% 33.33% 33.33% 33.33% 33.33% 33.33% 100.00%
2011 5.23% 21.31% 32.07% 42.49% 51.04% 46.40% 44.25% 31.17% 27.02% 31.78% 27.40% 27.97% 33.33% 33.33% 33.33% 33.33% 33.33% 100.00%
2012 3.83% 22.79% 36.32% 42.98% 48.26% 50.18% 38.55% 32.75% 28.10% 31.78% 27.40% 27.97% 33.33% 33.33% 33.33% 33.33% 33.33% 100.00%
2013 4.57% 25.79% 36.57% 39.43% 48.29% 46.62% 42.35% 33.63% 28.10% 31.78% 27.40% 27.97% 33.33% 33.33% 33.33% 33.33% 33.33% 100.00%
2014 4.99% 24.55% 32.77% 41.44% 46.83% 47.75% 41.38% 33.63% 28.10% 31.78% 27.40% 27.97% 33.33% 33.33% 33.33% 33.33% 33.33% 100.00%
2015 3.82% 21.13% 36.24% 39.28% 45.12% 47.74% 41.38% 33.63% 28.10% 31.78% 27.40% 27.97% 33.33% 33.33% 33.33% 33.33% 33.33% 100.00%
2016 3.76% 24.66% 35.70% 34.83% 47.13% 47.74% 41.38% 33.63% 28.10% 31.78% 27.40% 27.97% 33.33% 33.33% 33.33% 33.33% 33.33% 100.00%
2017 4.87% 26.33% 32.31% 38.74% 47.13% 47.74% 41.38% 33.63% 28.10% 31.78% 27.40% 27.97% 33.33% 33.33% 33.33% 33.33% 33.33% 100.00%
2018 5.65% 19.31% 34.75% 38.74% 47.13% 47.74% 41.38% 33.63% 28.10% 31.78% 27.40% 27.97% 33.33% 33.33% 33.33% 33.33% 33.33% 100.00%
2019 4.60% 23.44% 34.75% 38.74% 47.13% 47.74% 41.38% 33.63% 28.10% 31.78% 27.40% 27.97% 33.33% 33.33% 33.33% 33.33% 33.33% 100.00%
Baseline Factor
Avg 4 22.86% 34.25% 38.74% 47.13% 47.74% 41.38% 33.63% 28.10% 31.78% 27.40% 27.97% 29.26% 30.88% 32.54% 23.88% 34.19% 69.53%
Selected Assumption Avg 3 Avg 3 Avg 4 Avg 4 Avg 4 Avg 4 Avg 4 Avg 4 Avg 4 Avg 4 Avg 4 judg. 1/3 judg. 1/3 judg. 1/3 judg. 1/3 judg. 1/3 judg. 1
(a) Selected Factor 23.44% 34.75% 38.74% 47.13% 47.74% 41.38% 33.63% 28.10% 31.78% 27.40% 27.97% 33.33% 33.33% 33.33% 33.33% 33.33% 100.00%
(1 unshaded area) = Exhibit 4.2 (2) ÷ (Exhibit 4.1 Col. (1) - Exhibit 4.2 (1) prior column)
For example FLY 2016 @ 12-24 months: 24.66% = 7,183 ÷ (30,266 - 1,137)
(1 shaded area) = (a)
Corporate Actuarial Department

Insurance Corporation of British Columbia Exhibit 4.4
Represented Excluding Large and Catastrophic Bodily Injury Liability
Paid Loss and ALAE Development
(1) Paid Loss and ALAE ($000's)
Fiscal Loss
Year 12 24 36 48 60 72 84 96 108 120 132 144 156 168 180 192 204 216
(3) Incurred
Loss and
ALAE ($000's)
2001
2002
2003
2004
2005
2006
2007
2008
2009
2010
2011
2012
2013
2014
2015
2016
2017
2018
2019
(2) Incremental Paid Loss and ALAE ($000's)
Fiscal Loss
Year 0 - 12 12 - 24 24 - 36 36 - 48 48 - 60 60 - 72 72 - 84 84 - 96 96 - 108 108 - 120 120 - 132 132 - 144 144 - 156 156 - 168 168 - 180 180 - 192 192 - 204 204 - 216
2001
2002
2003
2004
2005
2006
2007
2008
2009
2010
2011
2012
2013
2014
2015
2016
2017
2018
2019
(1 shaded area) = (1) prior column + (2)
For example FLY 2016 @ 60 months:
(2 shaded area) = Exhibit 4.2 (2) x Exhibit 4.5 (1)
(3) From the last column of (1)
Corporate Actuarial Department

Insurance Corporation of British Columbia Exhibit 4.5
Represented Excluding Large and Catastrophic Bodily Injury Liability
Incremental Paid Severities
(1) Incremental Paid Severity per CWA ($)
Fiscal Loss
Year 0 - 12 12 - 24 24 - 36 36 - 48 48 - 60 60 - 72 72 - 84 84 - 96 96 - 108 108 - 120 120 - 132 132 - 144 144 - 156 156 - 168 168 - 180 180 - 192 192 - 204 204 - 216
2001
2002
2003
2004
2005
2006
2007
2008
2009
2010
2011
2012
2013
2014
2015
2016
2017
2018
2019
(1 lighter shaded area) Based on 2018 August YTD paid severities, and the expectation for the remainder of the year
(1 darker shaded area) Based on trend from Exhibit 4.6 Row (b) starting from Exhibit 4.6 Row (a)
Note: Same starting point used from 72 to 216 months
Note: Grey data points on graphs are actual incremental paid severities, and black data points are forecasted incremental paid severities
Fiscal Loss Year
0 - 12 Months
Fiscal Loss Year
12 - 24 Months
Fiscal Loss Year
24 - 36 Months
Fiscal Loss Year
36 - 48 Months
Fiscal Loss Year
48 - 60 Months
Fiscal Loss Year
60 - 72 Months
Fiscal Loss Year
72 - 84 Months
Corporate Actuarial Department
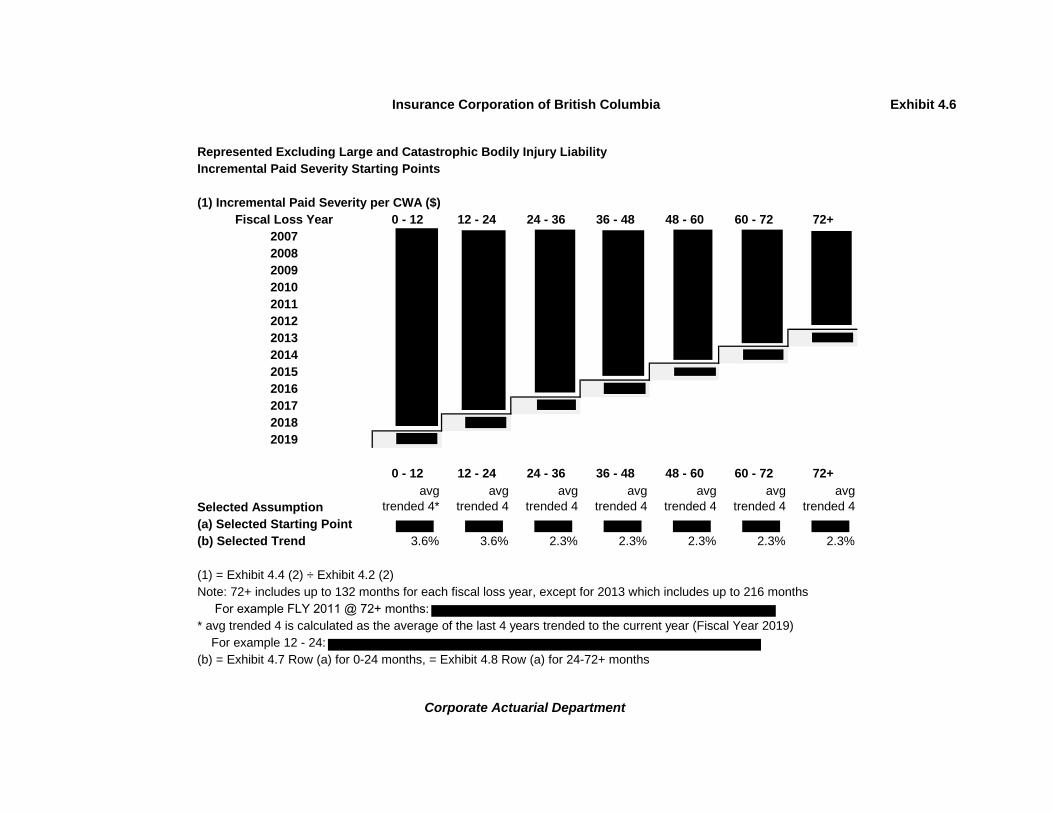
Insurance Corporation of British Columbia Exhibit 4.6
Represented Excluding Large and Catastrophic Bodily Injury Liability
Incremental Paid Severity Starting Points
(1) Incremental Paid Severity per CWA ($)
Fiscal Loss Year 0 - 12 12 - 24 24 - 36 36 - 48 48 - 60 60 - 72 72+
2007
2008
2009
2010
2011
2012
2013
2014
2015
2016
2017
2018
2019
0 - 12 12 - 24 24 - 36 36 - 48 48 - 60 60 - 72 72+
Selected Assumption
avg
trended 4*
avg
trended 4
avg
trended 4
avg
trended 4
avg
trended 4
avg
trended 4
avg
trended 4
(a) Selected Starting Point
(b) Selected Trend 3.6% 3.6% 2.3% 2.3% 2.3% 2.3% 2.3%
(1) = Exhibit 4.4 (2) ÷ Exhibit 4.2 (2)
Note: 72+ includes up to 132 months for each fiscal loss year, except for 2013 which includes up to 216 months
For example FLY 2011 @ 72+ months:
* avg trended 4 is calculated as the average of the last 4 years trended to the current year (Fiscal Year 2019)
For example 12 - 24:
(b) = Exhibit 4.7 Row (a) for 0-24 months, = Exhibit 4.8 Row (a) for 24-72+ months
Corporate Actuarial Department

Insurance Corporation of British Columbia Exhibit 4.7
Represented Excluding Large and Catastrophic Bodily Injury Liability
Fiscal Year Paid Severity Trend (0 to 24 months)
Up to March 31, 2019
(1) (2) (3)
(2) ÷ (1)
Fiscal Year
CWA Claim
Exposure Count
Paid Loss and
ALAE ($000's)
Paid Severity
($)
2010 4,810
2011 5,268
2012 4,802
2013 5,731
2014 6,795
2015 6,526
2016 6,480
2017 8,741
2018 9,997
2019 8,085
(a) Trend 3.6%
(1) Based on Exhibit 4.2 (2) up to 24 months
For example fiscal year 2017: 8,741 = 1,557 + 7,183
(2) Based on Exhibit 4.4 (2) up to 24 months
For example fiscal year 2017:
(a) Exponential trend of (3) over fiscal years 2010 to 2019
Corporate Actuarial Department
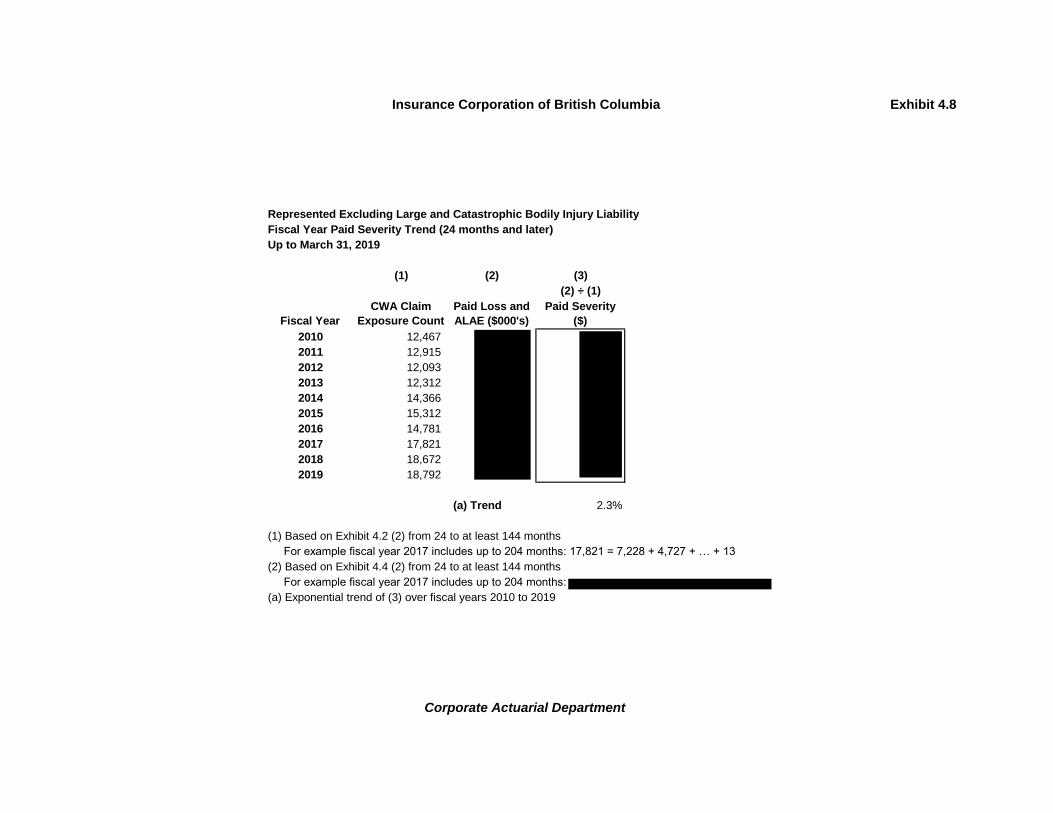
Insurance Corporation of British Columbia Exhibit 4.8
Represented Excluding Large and Catastrophic Bodily Injury Liability
Fiscal Year Paid Severity Trend (24 months and later)
Up to March 31, 2019
(1) (2) (3)
(2) ÷ (1)
Fiscal Year
CWA Claim
Exposure Count
Paid Loss and
ALAE ($000's)
Paid Severity
($)
2010 12,467
2011 12,915
2012 12,093
2013 12,312
2014 14,366
2015 15,312
2016 14,781
2017 17,821
2018 18,672
2019 18,792
(a) Trend 2.3%
(1) Based on Exhibit 4.2 (2) from 24 to at least 144 months
For example fiscal year 2017 includes up to 204 months: 17,821 = 7,228 + 4,727 + … + 13
(2) Based on Exhibit 4.4 (2) from 24 to at least 144 months
For example fiscal year 2017 includes up to 204 months:
(a) Exponential trend of (3) over fiscal years 2010 to 2019
Corporate Actuarial Department

Insurance Corporation of British Columbia Exhibit 4.9
Represented Excluding Large and Catastrophic Bodily Injury Liability
Open Claim Exposure Count
(1) Open Claim Exposure Count
Fiscal Loss
Year 12 24 36 48 60 72 84 96 108 120 132 144 156 168 180 192 204 216
2002 1,819 797 403 241 148 113 90 54 37 34 24 24 17 6
2003 3,751 1,809 852 483 293 191 136 99 72 60 45 29 25 19
2004 7,241 3,854 1,795 875 456 290 227 164 116 86 70 55 41 27
2005 10,475 7,536 3,971 1,834 830 425 250 181 134 112 84 60 44 31
2006 10,737 11,294 7,894 4,257 1,917 844 452 277 187 133 93 65 46 38
2007 10,928 11,132 7,997 4,197 1,766 861 533 372 262 173 129 84 64
2008 11,114 11,407 8,279 4,195 1,906 1,016 602 387 259 153 109 84
2009 11,431 11,507 8,092 4,412 2,212 1,117 678 449 292 196 147
2010 12,557 12,271 8,906 5,147 2,536 1,303 745 446 292 202
2011 13,631 13,572 10,459 6,240 3,182 1,663 875 538 377
2012 14,815 14,904 10,788 6,461 3,442 1,698 904 574
2013 16,096 15,408 11,072 7,120 3,838 1,854 961
2014 16,263 16,202 12,390 7,561 4,016 1,926
2015 17,785 18,958 13,414 8,123 4,467
2016 19,998 20,617 14,423 9,471
2017 21,833 21,108 15,457
2018 24,510 25,336
2019 27,148
Latest diagonal is based on 2018 August YTD open claim exposure count, and the expectation for the remainder of the year
Corporate Actuarial Department

Insurance Corporation of British Columbia Exhibit 5.1
Represented Large and Catastrophic Bodily Injury Liability
Summary of Incurred Estimates
Up to March 31, 2019
(1) (2)
Fiscal Loss Year
Incurred Claim
Exposure
Count
Incurred Loss
and ALAE
($000's)
2002 885
2003 938
2004 1,005
2005 1,073
2006 1,157
2007 1,165
2008 1,278
2009 1,388
2010 1,403
2011 1,585
2012 1,586
2013 1,842
2014 2,102
2015 2,219
2016 2,199
2017 2,281
2018 2,603
2019 2,918
Total 29,627
Subtotal (2002-2018) 26,708
(1) From Exhibit 5.2 Col. (4)
(2) From Exhibit 5.10 (3)
Corporate Actuarial Department

Insurance Corporation of British Columbia Exhibit 5.2
Represented Large and Catastrophic Bodily Injury Liability
Incurred Claim Exposure Count Summary
Up to March 31, 2019
(1) (2) (3) (4)
Fiscal Loss
Year
Development
Method
Bornhuetter-
Ferguson
Method
Hindsight
Method
Selected
Incurred Claim
Exposure Count
2002 885 885 885 885
2003 938 938 942 938
2004 1,005 1,005 998 1,005
2005 1,073 1,073 1,067 1,073
2006 1,157 1,157 1,162 1,157
2007 1,165 1,165 1,171 1,165
2008 1,278 1,278 1,276 1,278
2009 1,388 1,388 1,388 1,388
2010 1,403 1,403 1,430 1,403
2011 1,585 1,585 1,609 1,585
2012 1,586 1,586 1,641 1,586
2013 1,842 1,838 1,885 1,842
2014 2,102 2,078 2,113 2,102
2015 2,310 2,235 2,219 2,219
2016 2,525 2,353 2,199 2,199
2017 2,748 2,449 2,113 2,281
2018 3,120 2,568 2,603 2,603
2019 2,825 2,953 2,838 2,918
Total 30,934 29,936 29,541 29,627
(1) From Exhibit 5.3 Col. (4)
(2) From Exhibit 5.3 Col. (9)
(3) From Exhibit 5.5 Col. (4)
(4) = (1) for fiscal loss years 2002 to 2014
= (3) for fiscal loss years 2015, 2016 and 2018
= average [(2), (3)] for fiscal loss year 2017
= average [(3), 2,999] for fiscal loss year 2019
where 2,999 is the prior expected value
Corporate Actuarial Department

Insurance Corporation of British Columbia Exhibit 5.3
Represented Large and Catastrophic Bodily Injury Liability
Incurred Claim Exposure Count Development Method and Bornhuetter-Ferguson Method
Up to March 31, 2019
(1) (2) (3) (4) (5) (6) (7) (8) (9)
(1) x (3) (4) ÷ (5) 1 - 1 ÷ (3)
(1) + (5) x (7) x
(8)
Fiscal Loss
Year
Open and
CWA Claim
Exposure
Count
Age-to-Age
CDF
Age-to-
Ultimate
CDF
Incurred
Claim
Exposure
Count
(Development
Method)
Risk
Exposure
Indicated
Incurred
Frequency
Trended
Incurred
Frequency
Percentage
Unreported
Count
Incurred
Claim
Exposure
Count
(Bornhuetter-
Ferguson
Method)
2002 885 1.0000 1.0000 885 2,363,098 0.037% 0.038% 0.00% 885
2003 938 1.0000 1.0000 938 2,397,249 0.039% 0.039% 0.00% 938
2004 1,005 1.0000 1.0000 1,005 2,438,711 0.041% 0.041% 0.00% 1,005
2005 1,073 1.0000 1.0000 1,073 2,497,756 0.043% 0.042% 0.00% 1,073
2006 1,157 1.0000 1.0000 1,157 2,562,601 0.045% 0.044% 0.00% 1,157
2007 1,166 0.9994 0.9994 1,165 2,634,785 0.044% 0.046% -0.06% 1,165
2008 1,278 1.0005 0.9999 1,278 2,709,074 0.047% 0.048% -0.01% 1,278
2009 1,386 1.0015 1.0015 1,388 2,760,413 0.050% 0.050% 0.15% 1,388
2010 1,401 0.9999 1.0014 1,403 2,785,866 0.050% 0.052% 0.14% 1,403
2011 1,579 1.0025 1.0039 1,585 2,827,554 0.056% 0.054% 0.39% 1,585
2012 1,567 1.0084 1.0124 1,586 2,862,519 0.055% 0.056% 1.22% 1,586
2013 1,787 1.0181 1.0307 1,842 2,902,524 0.063% 0.059% 2.98% 1,838
2014 1,935 1.0542 1.0865 2,102 2,950,153 0.071% 0.061% 7.96% 2,078
2015 1,873 1.1353 1.2336 2,310 3,008,066 0.077% 0.064% 18.93% 2,235
2016 1,625 1.2593 1.5534 2,525 3,091,385 0.082% 0.066% 35.63% 2,353
2017 1,299 1.3611 2.1143 2,748 3,169,735 0.087% 0.069% 52.70% 2,449
2018 937 1.5749 3.3299 3,120 3,252,816 0.096% 0.072% 69.97% 2,568
2019 404 2.1005 6.9945 2,825 3,317,036 0.085% 0.075% 85.70% 2,953
Total 23,294 30,934 29,936
(1) From Exhibit 5.4
(2) From Exhibit 5.4
(3) From Exhibit 5.4
(5) From internal ICBC database; estimated for fiscal loss year 2019
(7) Exponential trend of (6) over fiscal loss years 2002 to 2011
(9) Uses an expected frequency of 0.0897% instead of 0.075% from (7) for FLY 2019
Corporate Actuarial Department

Insurance Corporation of British Columbia Exhibit 5.4
Represented Large and Catastrophic Bodily Injury Liability
Incurred Claim Exposure Count Development Method
(1) Open and CWA Claim Exposure Count
Fiscal Loss Year 12 24 36 48 60 72 84 96 108 120 132 144 156 168 180 192 204 216
2002 850 901 906 893 891 891 886 888 885 886 884 885 884 885
2003 832 921 959 942 938 945 947 940 941 942 938 938 938 938
2004 676 847 951 962 998 1,007 1,010 1,004 1,002 1,002 1,003 1,002 1,006 1,005
2005 488 722 916 998 1,041 1,056 1,057 1,055 1,059 1,063 1,065 1,069 1,072 1,073
2006 284 547 776 936 1,024 1,121 1,138 1,156 1,157 1,158 1,158 1,160 1,159 1,157
2007 262 496 692 868 1,037 1,102 1,137 1,154 1,158 1,164 1,162 1,164 1,166
2008 278 505 747 975 1,098 1,173 1,221 1,250 1,264 1,266 1,275 1,278
2009 256 503 741 951 1,129 1,247 1,316 1,338 1,365 1,379 1,386
2010 232 494 690 882 1,094 1,222 1,314 1,355 1,394 1,401
2011 198 402 623 833 1,113 1,330 1,466 1,558 1,579
2012 183 342 508 741 1,024 1,279 1,503 1,567
2013 195 394 558 755 1,121 1,603 1,787
2014 199 403 612 860 1,509 1,935
2015 231 491 825 1,496 1,873
2016 264 513 1,100 1,625
2017 255 638 1,299
2018 306 937
2019 404
Development Factors
Fiscal Loss Year 12 to 24 24 to 36 36 to 48 48 to 60 60 to 72 72 to 84 84 to 96 96 to 108 108 to 120 120 to 132 132 to 144 144 to 156 156 to 168 168 to 180 180 to 192 192 to 204 204 to 216
2002 1.0600 1.0055 0.9857 0.9978 1.0000 0.9944 1.0023 0.9966 1.0011 0.9977 1.0011 0.9989 1.0011
2003 1.1070 1.0413 0.9823 0.9958 1.0075 1.0021 0.9926 1.0011 1.0011 0.9958 1.0000 1.0000 1.0000
2004 1.2530 1.1228 1.0116 1.0374 1.0090 1.0030 0.9941 0.9980 1.0000 1.0010 0.9990 1.0040 0.9990
2005 1.4795 1.2687 1.0895 1.0431 1.0144 1.0009 0.9981 1.0038 1.0038 1.0019 1.0038 1.0028 1.0009
2006 1.9261 1.4186 1.2062 1.0940 1.0947 1.0152 1.0158 1.0009 1.0009 1.0000 1.0017 0.9991 0.9984
2007 1.8931 1.3952 1.2543 1.1947 1.0627 1.0318 1.0150 1.0035 1.0052 0.9983 1.0017 1.0015
2008 1.8165 1.4792 1.3052 1.1262 1.0683 1.0409 1.0238 1.0112 1.0016 1.0071 1.0020
2009 1.9648 1.4732 1.2834 1.1872 1.1045 1.0553 1.0167 1.0202 1.0103 1.0052
2010 2.1293 1.3968 1.2783 1.2404 1.1170 1.0753 1.0312 1.0288 1.0050
2011 2.0303 1.5498 1.3371 1.3361 1.1950 1.1023 1.0628 1.0134
2012 1.8689 1.4854 1.4587 1.3819 1.2490 1.1751 1.0423
2013 2.0205 1.4162 1.3530 1.4848 1.4300 1.1147
2014 2.0251 1.5186 1.4052 1.7547 1.2821
2015 2.1255 1.6802 1.8133 1.2519
2016 1.9432 2.1442 1.4774
2017 2.5020 2.0368
2018 3.0616
Baseline Factor
avg 6 2.2797 1.7136 1.4741 1.4083 1.2296 1.0939 1.0319 1.0130 1.0044 1.0021 1.0014 1.0005 0.9994 1.0007 1.0000 0.9994 1.0011
Selected Assumption avg all avg all avg all avg all avg all avg all avg all avg all avg all avg all avg all avg all avg all one one one one one
Selected Factor 2.1005 1.5749 1.3611 1.2593 1.1353 1.0542 1.0181 1.0084 1.0025 0.9999 1.0015 1.0005 0.9994 1.0000 1.0000 1.0000 1.0000 1.0000
Age-to-Ultimate Factor 6.9945 3.3299 2.1143 1.5534 1.2336 1.0865 1.0307 1.0124 1.0039 1.0014 1.0015 0.9999 0.9994 1.0000 1.0000 1.0000 1.0000 1.0000
(1 grey shaded area) Based on 2018 August YTD open and CWA claim exposure count, and the expectation for the remainder of the year
Corporate Actuarial Department

Insurance Corporation of British Columbia Exhibit 5.5
Represented Large and Catastrophic Bodily Injury Liability
Incurred Claim Exposure Count Hindsight Method
Up to March 31, 2019
(1) (2) (3) (4)
(1) x (3)
Fiscal Loss
Year
Open and CWA
Claim Exposure
Count*
Age-to-Age
CDF
Age-to-Ultimate
CDF
Incurred Claim
Exposure
Count
2002 885 1.0000 1.0000 885
2003 941 1.0011 1.0011 942
2004 998 0.9994 1.0006 998
2005 1,067 1.0000 1.0006 1,067
2006 1,161 1.0007 1.0013 1,162
2007 1,170 0.9994 1.0007 1,171
2008 1,275 1.0005 1.0012 1,276
2009 1,385 1.0014 1.0026 1,388
2010 1,424 1.0021 1.0047 1,430
2011 1,595 1.0044 1.0091 1,609
2012 1,618 1.0053 1.0144 1,641
2013 1,843 1.0078 1.0224 1,885
2014 2,021 1.0229 1.0457 2,113
2015 2,000 1.0608 1.1093 2,219
2016 1,752 1.1316 1.2553 2,199
2017 1,334 1.2618 1.5839 2,113
2018 1,134 1.4491 2.2953 2,603
2019 651 1.9001 4.3615 2,838
Total 24,252 29,541
(1) From Exhibit 5.6
(2) From Exhibit 5.6
(3) From Exhibit 5.6
* Restated to reflect the selected ratios of open represented large and catastrophic
claim exposure counts to open represented claim exposure counts.
Selected ratios are shown in Exhibit 5.7, row (a)
Corporate Actuarial Department

Insurance Corporation of British Columbia Exhibit 5.6
Represented Large and Catastrophic Bodily Injury Liability
Incurred Claim Exposure Count Hindsight Method
(1) Open and CWA Claim Exposure Count with Restated Open in FY 2019 Diagonal
Fiscal Loss Year 12 24 36 48 60 72 84 96 108 120 132 144 156 168 180 192 204 216
2002 850 901 906 893 891 891 886 888 885 886 884 885 884 885
2003 832 921 959 942 938 945 947 940 941 942 938 938 938 941
2004 676 847 951 962 998 1,007 1,010 1,004 1,002 1,002 1,003 1,002 1,006 998
2005 488 722 916 998 1,041 1,056 1,057 1,055 1,059 1,063 1,065 1,069 1,072 1,067
2006 284 547 776 936 1,024 1,121 1,138 1,156 1,157 1,158 1,158 1,160 1,159 1,161
2007 262 496 692 868 1,037 1,102 1,137 1,154 1,158 1,164 1,162 1,164 1,170
2008 278 505 747 975 1,098 1,173 1,221 1,250 1,264 1,266 1,275 1,275
2009 256 503 741 951 1,129 1,247 1,316 1,338 1,365 1,379 1,385
2010 232 494 690 882 1,094 1,222 1,314 1,355 1,394 1,424
2011 198 402 623 833 1,113 1,330 1,466 1,558 1,595
2012 183 342 508 741 1,024 1,279 1,503 1,618
2013 195 394 558 755 1,121 1,603 1,843
2014 199 403 612 860 1,509 2,021
2015 231 491 825 1,496 2,000
2016 264 513 1,100 1,752
2017 255 638 1,334
2018 306 1,134
2019 651
Development Factors
Fiscal Loss Year 12 to 24 24 to 36 36 to 48 48 to 60 60 to 72 72 to 84 84 to 96 96 to 108 108 to 120 120 to 132 132 to 144 144 to 156 156 to 168 168 to 180 180 to 192 192 to 204 204 to 216
2002 1.0600 1.0055 0.9857 0.9978 1.0000 0.9944 1.0023 0.9966 1.0011 0.9977 1.0011 0.9989 1.0011
2003 1.1070 1.0413 0.9823 0.9958 1.0075 1.0021 0.9926 1.0011 1.0011 0.9958 1.0000 1.0000 1.0034
2004 1.2530 1.1228 1.0116 1.0374 1.0090 1.0030 0.9941 0.9980 1.0000 1.0010 0.9990 1.0040 0.9919
2005 1.4795 1.2687 1.0895 1.0431 1.0144 1.0009 0.9981 1.0038 1.0038 1.0019 1.0038 1.0028 0.9952
2006 1.9261 1.4186 1.2062 1.0940 1.0947 1.0152 1.0158 1.0009 1.0009 1.0000 1.0017 0.9991 1.0017
2007 1.8931 1.3952 1.2543 1.1947 1.0627 1.0318 1.0150 1.0035 1.0052 0.9983 1.0017 1.0053
2008 1.8165 1.4792 1.3052 1.1262 1.0683 1.0409 1.0238 1.0112 1.0016 1.0071 0.9997
2009 1.9648 1.4732 1.2834 1.1872 1.1045 1.0553 1.0167 1.0202 1.0103 1.0042
2010 2.1293 1.3968 1.2783 1.2404 1.1170 1.0753 1.0312 1.0288 1.0212
2011 2.0303 1.5498 1.3371 1.3361 1.1950 1.1023 1.0628 1.0237
2012 1.8689 1.4854 1.4587 1.3819 1.2490 1.1751 1.0765
2013 2.0205 1.4162 1.3530 1.4848 1.4300 1.1500
2014 2.0251 1.5186 1.4052 1.7547 1.3391
2015 2.1255 1.6802 1.8133 1.3370
2016 1.9432 2.1442 1.5925
2017 2.5020 2.0907
2018 3.7057
Baseline Factor
avg 6* 2.2797 1.7136 1.4741 1.4083 1.2296 1.0939 1.0319 1.0130 1.0044 1.0021 1.0014 1.0005 0.9994 1.0007 1.0000 0.9994 1.0011
Selected Assumption
avg 4
offset 9
avg 5
offset 8
avg 6
offset 7
avg 7
offset 6
avg 8
offset 5
avg 8
offset 4
avg 8
offset 3
avg 8
offset 2 avg 6* avg 6* avg 6* avg 6* avg 5* avg 4* avg 3* avg 2* avg 1 one
Selected Factor 1.9001 1.4491 1.2618 1.1316 1.0608 1.0229 1.0078 1.0053 1.0044 1.0021 1.0014 1.0005 0.9994 1.0007 1.0000 0.9994 1.0011 1.0000
Age-to-Ultimate Factor 4.3615 2.2953 1.5839 1.2553 1.1093 1.0457 1.0224 1.0144 1.0091 1.0047 1.0026 1.0012 1.0007 1.0013 1.0006 1.0006 1.0011 1.0000
(1 grey shaded area) from [Exhibit 5.7 (a) x {Exhibit 5.7(1) + Exhibit 4.9 (1)}] + [Exhibit 5.4 (1) - Exhibit 5.7 (1)]
* the baseline development factors shown are calculated excluding the effect of restatement in the latest diagonal.
Corporate Actuarial Department
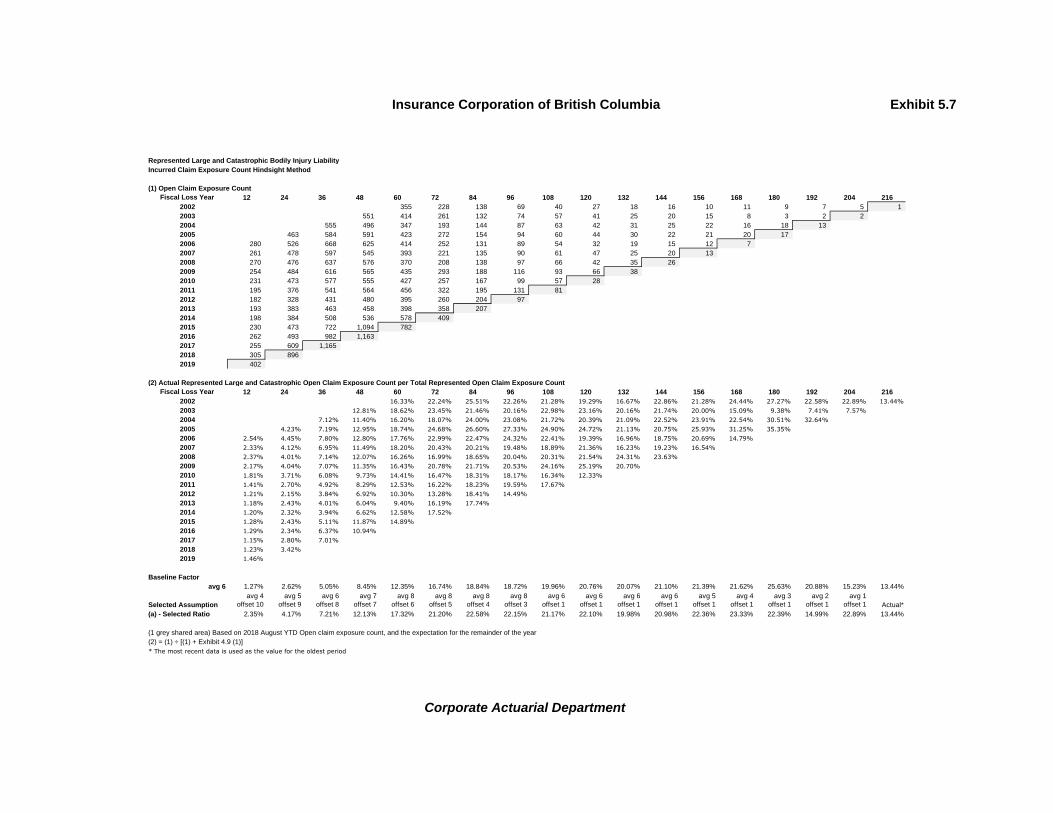
Insurance Corporation of British Columbia Exhibit 5.7
Represented Large and Catastrophic Bodily Injury Liability
Incurred Claim Exposure Count Hindsight Method
(1) Open Claim Exposure Count
Fiscal Loss Year 12 24 36 48 60 72 84 96 108 120 132 144 156 168 180 192 204 216
2002 355 228 138 69 40 27 18 16 10 11 9 7 5 1
2003 551 414 261 132 74 57 41 25 20 15 8 3 2 2
2004 555 496 347 193 144 87 63 42 31 25 22 16 18 13
2005 463 584 591 423 272 154 94 60 44 30 22 21 20 17
2006 280 526 668 625 414 252 131 89 54 32 19 15 12 7
2007 261 478 597 545 393 221 135 90 61 47 25 20 13
2008 270 476 637 576 370 208 138 97 66 42 35 26
2009 254 484 616 565 435 293 188 116 93 66 38
2010 231 473 577 555 427 257 167 99 57 28
2011 195 376 541 564 456 322 195 131 81
2012 182 328 431 480 395 260 204 97
2013 193 383 463 458 398 358 207
2014 198 384 508 536 578 409
2015 230 473 722 1,094 782
2016 262 493 982 1,163
2017 255 609 1,165
2018 305 896
2019 402
(2) Actual Represented Large and Catastrophic Open Claim Exposure Count per Total Represented Open Claim Exposure Count
Fiscal Loss Year 12 24 36 48 60 72 84 96 108 120 132 144 156 168 180 192 204 216
2002 16.33% 22.24% 25.51% 22.26% 21.28% 19.29% 16.67% 22.86% 21.28% 24.44% 27.27% 22.58% 22.89% 13.44%
2003 12.81% 18.62% 23.45% 21.46% 20.16% 22.98% 23.16% 20.16% 21.74% 20.00% 15.09% 9.38% 7.41% 7.57%
2004 7.12% 11.40% 16.20% 18.07% 24.00% 23.08% 21.72% 20.39% 21.09% 22.52% 23.91% 22.54% 30.51% 32.64%
2005 4.23% 7.19% 12.95% 18.74% 24.68% 26.60% 27.33% 24.90% 24.72% 21.13% 20.75% 25.93% 31.25% 35.35%
2006 2.54% 4.45% 7.80% 12.80% 17.76% 22.99% 22.47% 24.32% 22.41% 19.39% 16.96% 18.75% 20.69% 14.79%
2007 2.33% 4.12% 6.95% 11.49% 18.20% 20.43% 20.21% 19.48% 18.89% 21.36% 16.23% 19.23% 16.54%
2008 2.37% 4.01% 7.14% 12.07% 16.26% 16.99% 18.65% 20.04% 20.31% 21.54% 24.31% 23.63%
2009 2.17% 4.04% 7.07% 11.35% 16.43% 20.78% 21.71% 20.53% 24.16% 25.19% 20.70%
2010 1.81% 3.71% 6.08% 9.73% 14.41% 16.47% 18.31% 18.17% 16.34% 12.33%
2011 1.41% 2.70% 4.92% 8.29% 12.53% 16.22% 18.23% 19.59% 17.67%
2012 1.21% 2.15% 3.84% 6.92% 10.30% 13.28% 18.41% 14.49%
2013 1.18% 2.43% 4.01% 6.04% 9.40% 16.19% 17.74%
2014 1.20% 2.32% 3.94% 6.62% 12.58% 17.52%
2015 1.28% 2.43% 5.11% 11.87% 14.89%
2016 1.29% 2.34% 6.37% 10.94%
2017 1.15% 2.80% 7.01%
2018 1.23% 3.42%
2019 1.46%
Baseline Factor
avg 6 1.27% 2.62% 5.05% 8.45% 12.35% 16.74% 18.84% 18.72% 19.96% 20.76% 20.07% 21.10% 21.39% 21.62% 25.63% 20.88% 15.23% 13.44%
Selected Assumption
avg 4
offset 10
avg 5
offset 9
avg 6
offset 8
avg 7
offset 7
avg 8
offset 6
avg 8
offset 5
avg 8
offset 4
avg 8
offset 3
avg 6
offset 1
avg 6
offset 1
avg 6
offset 1
avg 6
offset 1
avg 5
offset 1
avg 4
offset 1
avg 3
offset 1
avg 2
offset 1
avg 1
offset 1 Actual*
(a) - Selected Ratio 2.35% 4.17% 7.21% 12.13% 17.32% 21.20% 22.58% 22.15% 21.17% 22.10% 19.98% 20.98% 22.36% 23.33% 22.39% 14.99% 22.89% 13.44%
(1 grey shared area) Based on 2018 August YTD Open claim exposure count, and the expectation for the remainder of the year
(2) = (1) ÷ [(1) + Exhibit 4.9 (1)]
* The most recent data is used as the value for the oldest period
Corporate Actuarial Department

Insurance Corporation of British Columbia Exhibit 5.8
Represented Large and Catastrophic Bodily Injury Liability
CWA Claim Exposure Count Closure Pattern
(1) CWA Claim Exposure Count
Fiscal Loss
Year 12 24 36 48 60 72 84 96 108 120 132 144 156 168 180 192 204 216
2001 597 692 757 785 803 822 830 836 837 838 841 843 843
2002 495 673 768 824 851 864 868 872 875 875 875 878 879 884
2003 281 507 698 810 864 888 906 915 921 927 930 935 936 936 938
2004 121 351 604 769 854 920 947 962 971 977 981 986 988 992 996 1,005
2005 25 138 325 575 769 902 963 995 1,015 1,033 1,043 1,048 1,052 1,056 1,062 1,066 1,073
2006 4 21 108 311 610 869 1,007 1,067 1,103 1,126 1,139 1,145 1,147 1,151 1,153 1,154 1,155 1,157
2007 1 18 95 323 644 881 1,002 1,064 1,097 1,117 1,137 1,144 1,153 1,157 1,160 1,162 1,163 1,165
2008 8 29 110 399 728 965 1,083 1,153 1,198 1,224 1,240 1,252 1,260 1,266 1,270 1,272 1,274 1,278
2009 2 19 125 386 694 954 1,128 1,222 1,272 1,313 1,348 1,361 1,370 1,376 1,380 1,383 1,385 1,388
2010 1 21 113 327 667 965 1,147 1,256 1,337 1,372 1,383 1,389 1,394 1,397 1,399 1,400 1,401 1,403
2011 3 26 82 269 657 1,008 1,271 1,427 1,498 1,527 1,546 1,559 1,568 1,574 1,577 1,580 1,582 1,585
2012 1 14 77 261 629 1,019 1,299 1,469 1,508 1,534 1,551 1,563 1,571 1,576 1,579 1,581 1,583 1,586
2013 2 11 95 297 723 1,245 1,580 1,723 1,762 1,789 1,806 1,818 1,826 1,831 1,835 1,837 1,839 1,842
2014 1 19 104 324 931 1,526 1,830 1,978 2,019 2,047 2,065 2,078 2,086 2,091 2,095 2,097 2,099 2,102
2015 1 18 103 402 1,091 1,640 1,945 2,094 2,136 2,163 2,182 2,194 2,202 2,208 2,211 2,214 2,216 2,219
2016 2 20 118 462 1,088 1,629 1,930 2,076 2,117 2,145 2,163 2,175 2,183 2,188 2,192 2,194 2,196 2,199
2017 29 135 464 1,119 1,685 1,999 2,153 2,196 2,224 2,243 2,256 2,264 2,270 2,274 2,276 2,278 2,281
2018 1 40 158 533 1,279 1,924 2,282 2,457 2,506 2,538 2,560 2,574 2,584 2,590 2,594 2,597 2,599 2,603
2019 2 43 175 596 1,433 2,156 2,558 2,755 2,809 2,846 2,870 2,886 2,897 2,904 2,909 2,912 2,914 2,918
(2) Incremental CWA Claim Exposure Count
Fiscal Loss
Year 0 - 12 12 - 24 24 - 36 36 - 48 48 - 60 60 - 72 72 - 84 84 - 96 96 - 108 108 - 120 120 - 132 132 - 144 144 - 156 156 - 168 168 - 180 180 - 192 192 - 204 204 - 216
2001 95 65 28 18 19 8 6 1 1 3 2
2002 178 95 56 27 13 4 4 3 3 1 5
2003 226 191 112 54 24 18 9 6 6 3 5 1 0 2
2004 230 253 165 85 66 27 15 9 6 4 5 2 4 4 9
2005 113 187 250 194 133 61 32 20 18 10 5 4 4 6 4 7
2006 4 17 87 203 299 259 138 60 36 23 13 6 2 4 2 1 1 2
2007 1 17 77 228 321 237 121 62 33 20 20 7 9 4 3 2 1 2
2008 8 21 81 289 329 237 118 70 45 26 16 12 9 6 4 3 2 3
2009 2 17 106 261 308 260 174 94 50 41 35 13 9 6 4 3 2 4
2010 1 20 92 214 340 298 182 109 81 35 10 7 5 3 2 1 1 2
2011 3 23 56 187 388 351 263 156 71 29 19 13 9 6 4 3 2 3
2012 1 13 63 184 368 390 280 170 39 26 17 12 8 5 3 2 2 3
2013 2 9 84 202 426 522 335 143 40 26 18 12 8 5 3 2 2 3
2014 1 18 85 220 607 595 304 149 41 28 18 12 8 5 4 2 2 3
2015 1 17 85 299 689 549 305 149 41 28 18 12 8 5 4 2 2 3
2016 2 18 98 344 626 541 300 147 41 27 18 12 8 5 4 2 2 3
2017 29 106 329 655 566 314 154 43 28 19 13 8 6 4 3 2 3
2018 1 39 118 375 746 645 358 175 49 32 22 14 10 6 4 3 2 4
2019 2 41 132 421 837 724 402 196 55 36 24 16 11 7 5 3 2 4
(1) Grey shaded area = (1) prior column + (2)
For example FLY 2016 @ 60 months: 1,088 = 462 + 626
(2 lighter shaded area) Based on 2018 August YTD CWA claim exposure count, and the expectation for the remainder of the year
(2 darker shaded area) = Exhibit 5.9 (1) x (Exhibit 5.2 Col. (4) - (1) prior column)
For example FLY 2016 @ 48-60 months: 626 = 36.04% x (2,199 - 462)
Corporate Actuarial Department
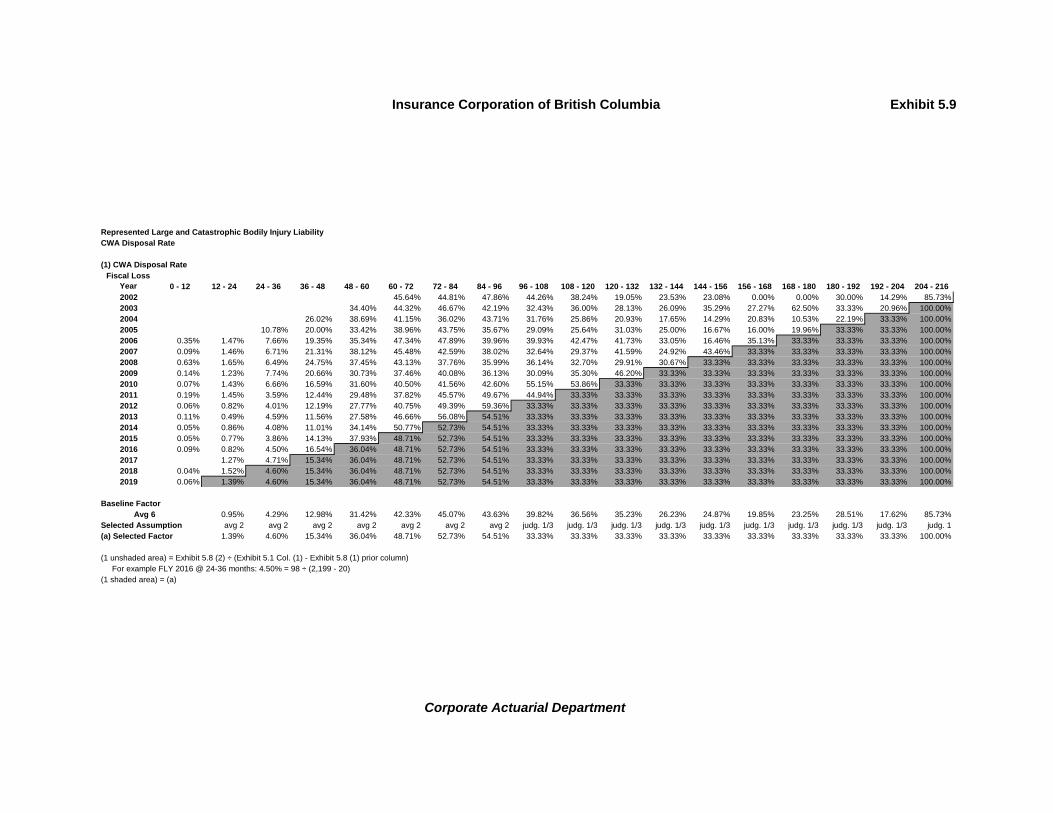
Insurance Corporation of British Columbia Exhibit 5.9
Represented Large and Catastrophic Bodily Injury Liability
CWA Disposal Rate
(1) CWA Disposal Rate
Fiscal Loss
Year 0 - 12 12 - 24 24 - 36 36 - 48 48 - 60 60 - 72 72 - 84 84 - 96 96 - 108 108 - 120 120 - 132 132 - 144 144 - 156 156 - 168 168 - 180 180 - 192 192 - 204 204 - 216
2002 45.64% 44.81% 47.86% 44.26% 38.24% 19.05% 23.53% 23.08% 0.00% 0.00% 30.00% 14.29% 85.73%
2003 34.40% 44.32% 46.67% 42.19% 32.43% 36.00% 28.13% 26.09% 35.29% 27.27% 62.50% 33.33% 20.96% 100.00%
2004 26.02% 38.69% 41.15% 36.02% 43.71% 31.76% 25.86% 20.93% 17.65% 14.29% 20.83% 10.53% 22.19% 33.33% 100.00%
2005 10.78% 20.00% 33.42% 38.96% 43.75% 35.67% 29.09% 25.64% 31.03% 25.00% 16.67% 16.00% 19.96% 33.33% 33.33% 100.00%
2006 0.35% 1.47% 7.66% 19.35% 35.34% 47.34% 47.89% 39.96% 39.93% 42.47% 41.73% 33.05% 16.46% 35.13% 33.33% 33.33% 33.33% 100.00%
2007 0.09% 1.46% 6.71% 21.31% 38.12% 45.48% 42.59% 38.02% 32.64% 29.37% 41.59% 24.92% 43.46% 33.33% 33.33% 33.33% 33.33% 100.00%
2008 0.63% 1.65% 6.49% 24.75% 37.45% 43.13% 37.76% 35.99% 36.14% 32.70% 29.91% 30.67% 33.33% 33.33% 33.33% 33.33% 33.33% 100.00%
2009 0.14% 1.23% 7.74% 20.66% 30.73% 37.46% 40.08% 36.13% 30.09% 35.30% 46.20% 33.33% 33.33% 33.33% 33.33% 33.33% 33.33% 100.00%
2010 0.07% 1.43% 6.66% 16.59% 31.60% 40.50% 41.56% 42.60% 55.15% 53.86% 33.33% 33.33% 33.33% 33.33% 33.33% 33.33% 33.33% 100.00%
2011 0.19% 1.45% 3.59% 12.44% 29.48% 37.82% 45.57% 49.67% 44.94% 33.33% 33.33% 33.33% 33.33% 33.33% 33.33% 33.33% 33.33% 100.00%
2012 0.06% 0.82% 4.01% 12.19% 27.77% 40.75% 49.39% 59.36% 33.33% 33.33% 33.33% 33.33% 33.33% 33.33% 33.33% 33.33% 33.33% 100.00%
2013 0.11% 0.49% 4.59% 11.56% 27.58% 46.66% 56.08% 54.51% 33.33% 33.33% 33.33% 33.33% 33.33% 33.33% 33.33% 33.33% 33.33% 100.00%
2014 0.05% 0.86% 4.08% 11.01% 34.14% 50.77% 52.73% 54.51% 33.33% 33.33% 33.33% 33.33% 33.33% 33.33% 33.33% 33.33% 33.33% 100.00%
2015 0.05% 0.77% 3.86% 14.13% 37.93% 48.71% 52.73% 54.51% 33.33% 33.33% 33.33% 33.33% 33.33% 33.33% 33.33% 33.33% 33.33% 100.00%
2016 0.09% 0.82% 4.50% 16.54% 36.04% 48.71% 52.73% 54.51% 33.33% 33.33% 33.33% 33.33% 33.33% 33.33% 33.33% 33.33% 33.33% 100.00%
2017 1.27% 4.71% 15.34% 36.04% 48.71% 52.73% 54.51% 33.33% 33.33% 33.33% 33.33% 33.33% 33.33% 33.33% 33.33% 33.33% 100.00%
2018 0.04% 1.52% 4.60% 15.34% 36.04% 48.71% 52.73% 54.51% 33.33% 33.33% 33.33% 33.33% 33.33% 33.33% 33.33% 33.33% 33.33% 100.00%
2019 0.06% 1.39% 4.60% 15.34% 36.04% 48.71% 52.73% 54.51% 33.33% 33.33% 33.33% 33.33% 33.33% 33.33% 33.33% 33.33% 33.33% 100.00%
Baseline Factor
Avg 6 0.95% 4.29% 12.98% 31.42% 42.33% 45.07% 43.63% 39.82% 36.56% 35.23% 26.23% 24.87% 19.85% 23.25% 28.51% 17.62% 85.73%
Selected Assumption avg 2 avg 2 avg 2 avg 2 avg 2 avg 2 avg 2 judg. 1/3 judg. 1/3 judg. 1/3 judg. 1/3 judg. 1/3 judg. 1/3 judg. 1/3 judg. 1/3 judg. 1/3 judg. 1
(a) Selected Factor 1.39% 4.60% 15.34% 36.04% 48.71% 52.73% 54.51% 33.33% 33.33% 33.33% 33.33% 33.33% 33.33% 33.33% 33.33% 33.33% 100.00%
(1 unshaded area) = Exhibit 5.8 (2) ÷ (Exhibit 5.1 Col. (1) - Exhibit 5.8 (1) prior column)
For example FLY 2016 @ 24-36 months: 4.50% = 98 ÷ (2,199 - 20)
(1 shaded area) = (a)
Corporate Actuarial Department

Insurance Corporation of British Columbia Exhibit 5.10
Represented Large and Catastrophic Bodily Injury Liability
Paid Loss and ALAE Development
(1) Paid Loss and ALAE ($000's)
Fiscal Loss
Year 12 24 36 48 60 72 84 96 108 120 132 144 156 168 180 192 204 216
(3) Incurred
Loss and
ALAE ($000's)
2001
2002
2003
2004
2005
2006
2007
2008
2009
2010
2011
2012
2013
2014
2015
2016
2017
2018
2019
(2) Incremental Paid Loss and ALAE ($000's)
Fiscal Loss
Year 0 - 12 12 - 24 24 - 36 36 - 48 48 - 60 60 - 72 72 - 84 84 - 96 96 - 108 108 - 120 120 - 132 132 - 144 144 - 156 156 - 168 168 - 180 180 - 192 192 - 204 204 - 216
2001
2002
2003
2004
2005
2006
2007
2008
2009
2010
2011
2012
2013
2014
2015
2016
2017
2018
2019
(1 shaded area) = (1) prior column + (2)
For example FLY 2016 @ 60 months:
(2 shaded area) = Exhibit 5.8 (2) x Exhibit 5.11 (1)
(3) From the last column of (1)
Corporate Actuarial Department

Insurance Corporation of British Columbia Exhibit 5.11
Represented Large and Catastrophic Bodily Injury Liability
Incremental Paid Severities
(1) Incremental Paid Severity per CWA ($)
Fiscal Loss
Year 0 - 12 12 - 24 24 - 36 36 - 48 48 - 60 60 - 72 72 - 84 84 - 96 96 - 108 108 - 120 120 - 132 132 - 144 144 - 156 156 - 168 168 - 180 180 - 192 192 - 204 204 - 216
2001
2002
2003
2004
2005
2006
2007
2008
2009
2010
2011
2012
2013
2014
2015
2016
2017
2018
2019
(1 lighter shaded area) Based on 2018 August YTD paid severities, and the expectation for the remainder of the year
(1 darker shaded area) Based on trend from Exhibit 5.12 Row (b) starting from Exhibit 5.12 Row (a)
Note: Same starting point used from 72 to 216 months
Note: Grey data points on graphs are actual incremental paid severities, and black data points are forecasted incremental paid severities
Fiscal Loss Year
0 - 12 Months
Fiscal Loss Year
12 - 24 Months
Fiscal Loss Year
24 - 36 Months
Fiscal Loss Year
36 - 48 Months
Fiscal Loss Year
48 - 60 Months
Fiscal Loss Year
60 - 72 Months
Fiscal Loss Year
72 - 84 Months
Corporate Actuarial Department

Insurance Corporation of British Columbia Exhibit 5.12
Represented Large and Catastrophic Bodily Injury Liability
Incremental Paid Severity Starting Points
(1) Incremental Paid Severity per CWA ($)
Fiscal Loss Year 0 - 12 12 - 24 24 - 36 36 - 48 48 - 60 60 - 72 72+
2007
2008
2009
2010
2011
2012
2013
2014
2015
2016
2017
2018
2019
0 - 12 12 - 24 24 - 36 36 - 48 48 - 60 60 - 72 72+
Selected Assumption avg 6 avg 6 avg 6 avg 6 avg 6 avg 6 avg 6
(a) Selected Starting Point
(b) Selected Trend 1.5% 1.5% 1.5% 1.5% 1.5% 1.5% 1.5%
(1) = Exhibit 5.10 (2) ÷ Exhibit 5.8 (2). 72+ is from 72 to 132 months, except for 2013 which includes up to 216 months
(b) From Exhibit 5.13 Row (a)
Corporate Actuarial Department

Insurance Corporation of British Columbia Exhibit 5.13
Represented Large and Catastrophic Bodily Injury Liability
Fiscal Year Paid Severity Trend
Up to March 31, 2019
(1) (2) (3)
(2) ÷ (1)
Fiscal Year
CWA Claim
Exposure Count
Paid Loss and
ALAE ($000's)
Paid Severity
($)
2010 1,031
2011 1,261
2012 1,199
2013 1,077
2014 1,115
2015 1,304
2016 1,399
2017 1,633
2018 2,147
2019 2,459
(a) Trend 1.5%
(1) Based on Exhibit 5.8 (2) up to at least 144 months
For example fiscal year 2017 includes up to 204 months: 1,633 = 0 + 18 + … + 2
(2) Based on Exhibit 5.10 (2) up to at least 144 months
For example fiscal year 2017 includes up to 204 months:
(a) Exponential trend of (3) over fiscal years 2010 to 2019
Corporate Actuarial Department