8 45 am amr research alison smith - sapfm.sap.com/pdf/8182/03_smith.pdf · manufacturing philosophy...
TRANSCRIPT
Global Manufacturing Trends and Challenges Driving IT Investments in Supply Network Operations: 2006 and Beyond
September 28 2006
Alison J. SmithSr. Research AnalystAMR Research
AMR Research 2006
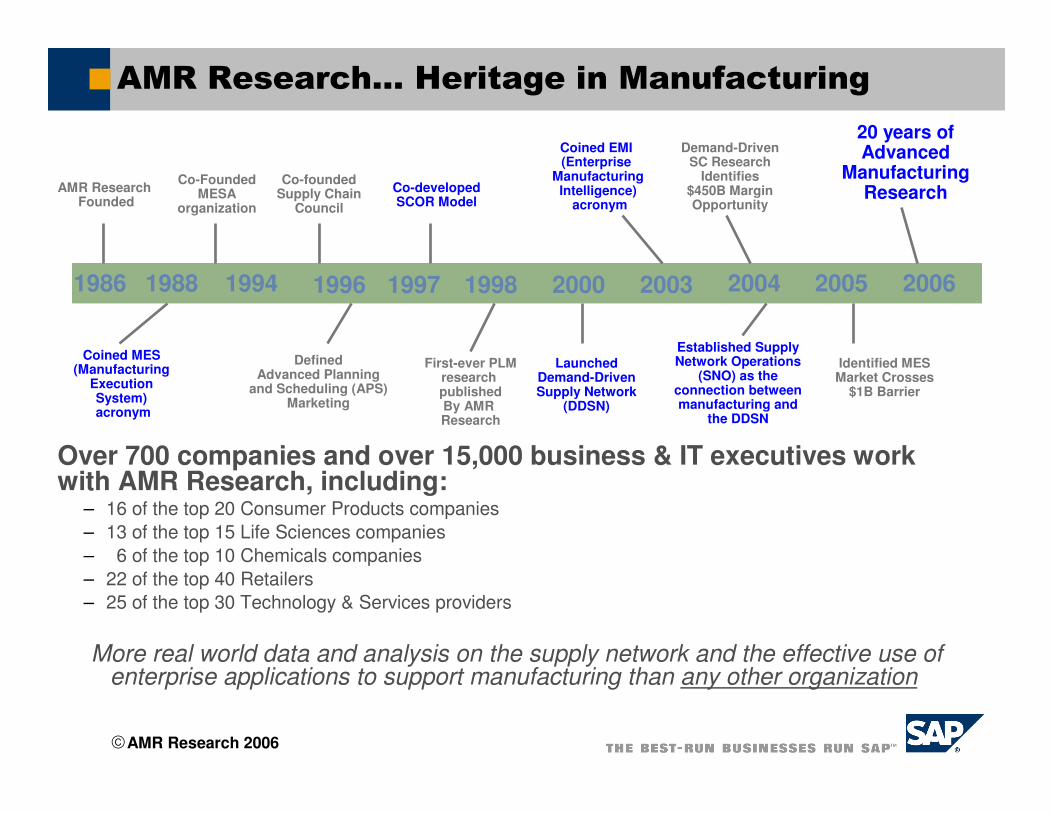
AMR Research… Heritage in Manufacturing
Over 700 companies and over 15,000 business & IT executives workwith AMR Research, including:
– 16 of the top 20 Consumer Products companies
– 13 of the top 15 Life Sciences companies
– 6 of the top 10 Chemicals companies
– 22 of the top 40 Retailers
– 25 of the top 30 Technology & Services providers
More real world data and analysis on the supply network and the effective use of enterprise applications to support manufacturing than any other organization
1986AMR Research Founded
Co-foundedSupply Chain
Council
Coined MES(Manufacturing
ExecutionSystem)acronym
LaunchedDemand-DrivenSupply Network
(DDSN)
Co-FoundedMESA
organization
Defined Advanced Planning
and Scheduling (APS)Marketing
Demand-DrivenSC Research
Identifies$450B Margin Opportunity
1986 1994 1996 1997 1998 2000 2003
Co-developedSCOR Model
Coined EMI (Enterprise
ManufacturingIntelligence)
acronym
First-ever PLMresearch publishedBy AMR Research
1988 2004 2005
Identified MES Market Crosses
$1B Barrier
Established Supply Network Operations
(SNO) as the connection between manufacturing and
the DDSN
2006
20 years of Advanced
Manufacturing Research
AMR Research 2006
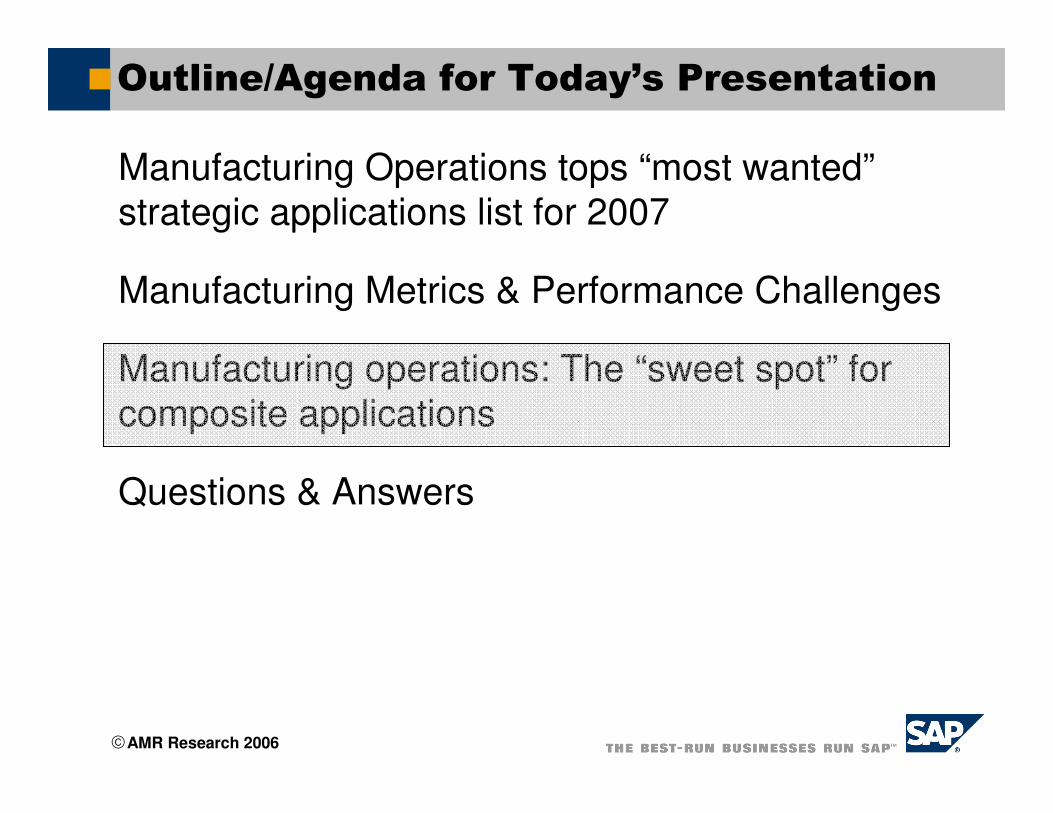
Outline/Agenda for Today’s Presentation
Trends: Manufacturing Operations tops “most
wanted” strategic applications list for 2007
Manufacturing Metrics & Performance Challenges
Manufacturing operations: The “sweet spot” for
composite applications
Questions & Answers

AMR Research 2006
Evolving Global Manufacturing Environment –the Drivers
� More Product Variants
� Shorter New Product Development & Launch
� Regulatory Compliance
� Cost Reduction
� Better Short Term Demand Visibility
� More Dynamic Supply Networks
Demand Supply
Product
Supply Network Operations:
The synchronized execution of compliant manufacturing and logistics processes across a dynamically reconfigurable supply network,
to profitably meet demand.
AMR Research 2006
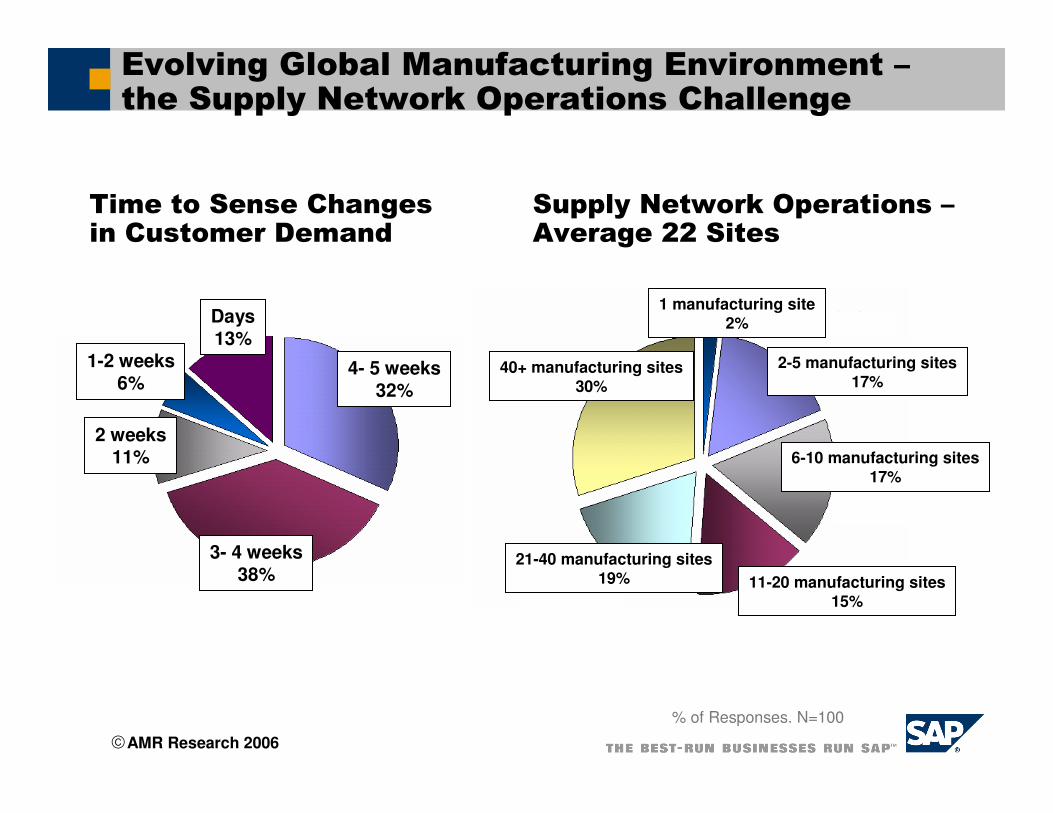
% of Responses. N=100
2 weeks11%
Days13%
1-2 weeks6%
3- 4 weeks38%
4- 5 weeks32%
Time to Sense Changes in Customer Demand
Supply Network Operations –Average 22 Sites
40+ manufacturing sites30%
11-20 manufacturing sites15%
2-5 manufacturing sites17%
6-10 manufacturing sites17%
21-40 manufacturing sites19%
1 manufacturing site2%
Evolving Global Manufacturing Environment –the Supply Network Operations Challenge
AMR Research 2006
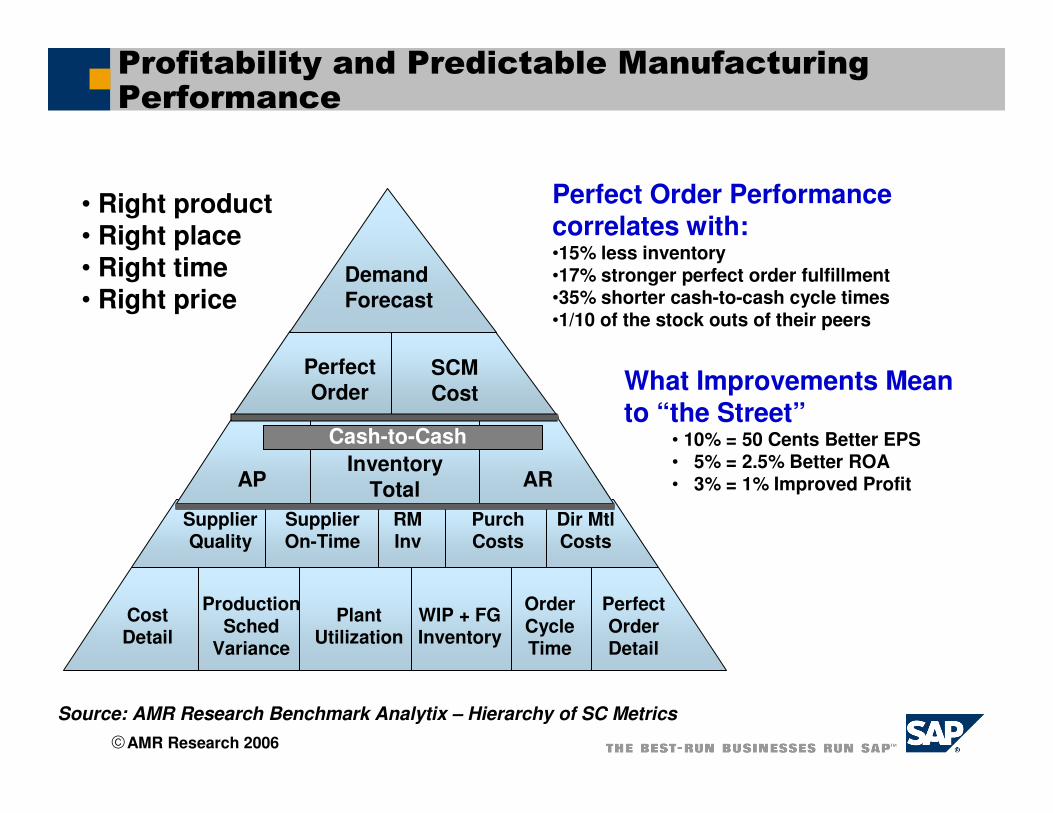
Profitability and Predictable Manufacturing Performance
Supplier Quality
Supplier On-Time
PurchCosts
Dir MtlCosts
RM Inv
Cost Detail
Production Sched
Variance
Plant Utilization
WIP + FG Inventory
Order Cycle Time
Perfect Order Detail
AP ARInventory
Total
Cash-to-Cash
Perfect Order
SCM Cost
Demand Forecast
Source: AMR Research Benchmark Analytix – Hierarchy of SC Metrics
• Right product• Right place• Right time• Right price
Perfect Order Performance correlates with:•15% less inventory•17% stronger perfect order fulfillment•35% shorter cash-to-cash cycle times•1/10 of the stock outs of their peers
What Improvements Meanto “the Street”
• 10% = 50 Cents Better EPS• 5% = 2.5% Better ROA• 3% = 1% Improved Profit
AMR Research 2006
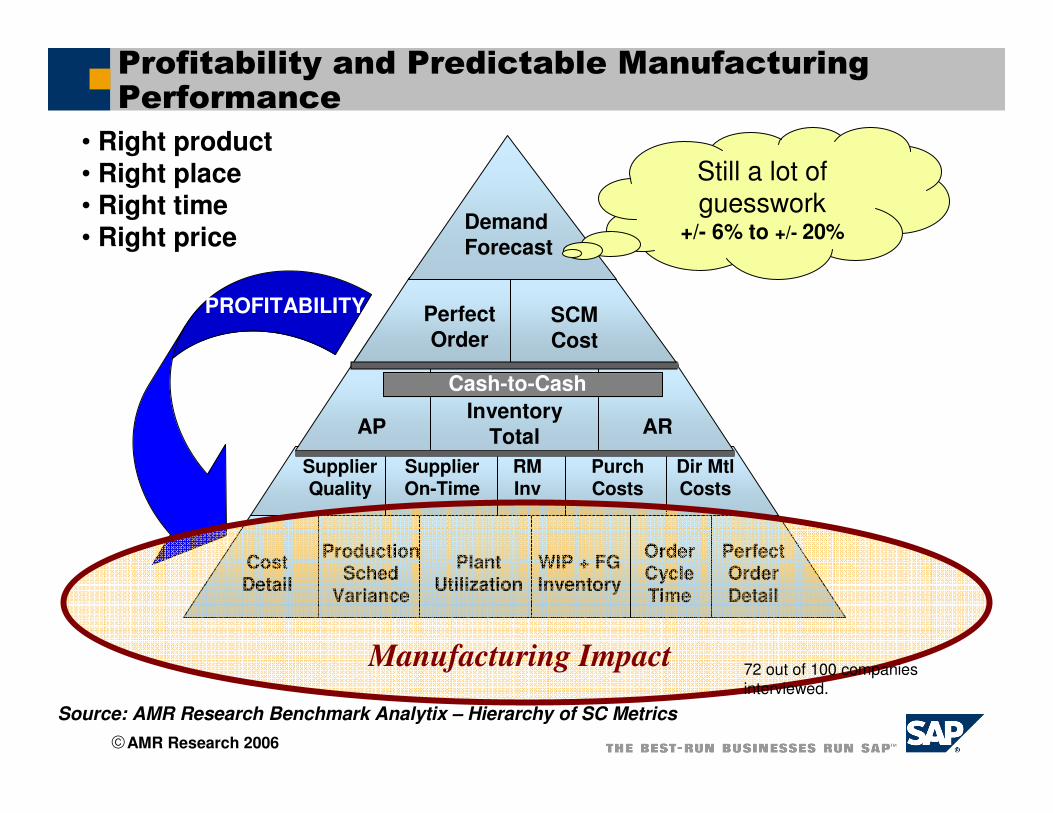
Profitability and Predictable Manufacturing Performance
Supplier Quality
Supplier On-Time
PurchCosts
Dir MtlCosts
RM Inv
Cost Detail
Production Sched
Variance
Plant Utilization
WIP + FG Inventory
Order Cycle Time
Perfect Order Detail
AP ARInventory
Total
Cash-to-Cash
Perfect Order
SCM Cost
Demand Forecast
Source: AMR Research Benchmark Analytix – Hierarchy of SC Metrics
• Right product• Right place• Right time• Right price
PROFITABILITY
Still a lot of guesswork
+/- 6% to +/- 20%
Manufacturing Impact 72 out of 100 companies
interviewed.
AMR Research 2006
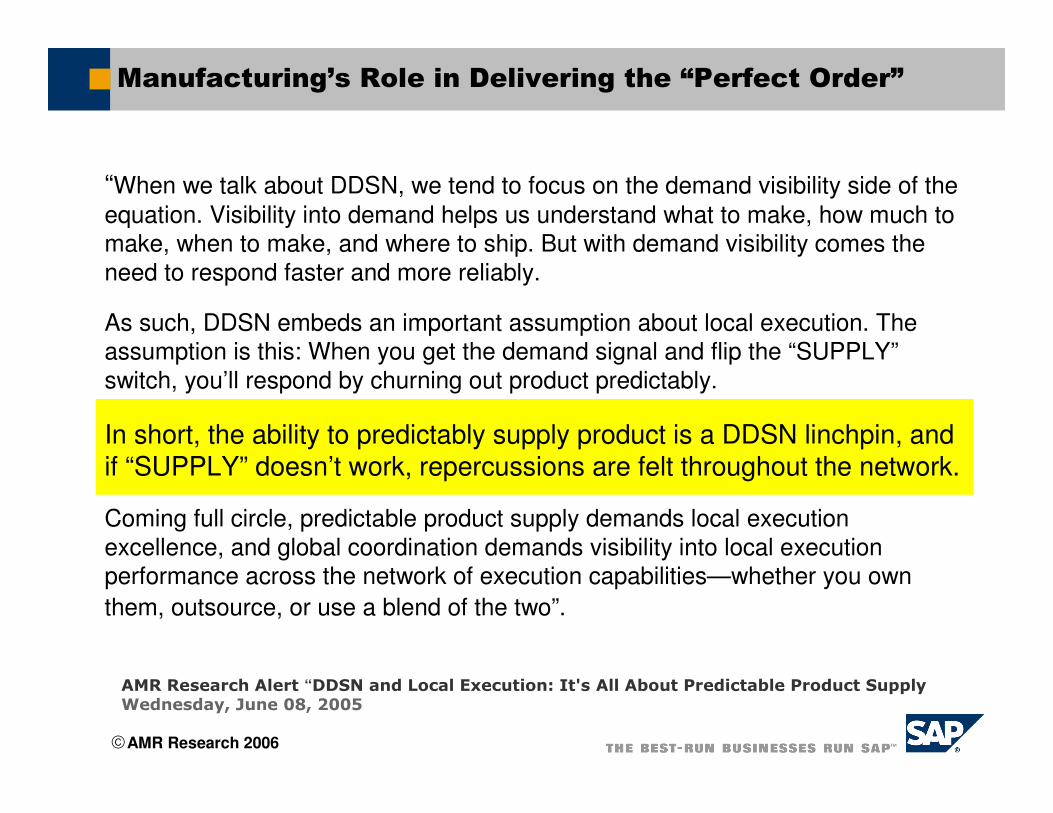
Manufacturing’s Role in Delivering the “Perfect Order”
AMR Research Alert “DDSN and Local Execution: It's All About Predictable Product SupplyWednesday, June 08, 2005
“When we talk about DDSN, we tend to focus on the demand visibility side of the
equation. Visibility into demand helps us understand what to make, how much to
make, when to make, and where to ship. But with demand visibility comes the
need to respond faster and more reliably.
As such, DDSN embeds an important assumption about local execution. The
assumption is this: When you get the demand signal and flip the “SUPPLY”
switch, you’ll respond by churning out product predictably.
In short, the ability to predictably supply product is a DDSN linchpin, and if “SUPPLY” doesn’t work, repercussions are felt throughout the network.
Coming full circle, predictable product supply demands local execution
excellence, and global coordination demands visibility into local execution
performance across the network of execution capabilities—whether you own
them, outsource, or use a blend of the two”.

AMR Research 2006
Manufacturing Architecture Integrated and Governed With Enterprise Systems
Multiple Point Solutions Autonomously Deployed
IT Strategy
VP Supply Network Operations, Plant ManagerVP Manufacturing, Plant ManagerManagement
Capability, Profitable To PromiseInventory, Available To PromiseOrder Promising
High Volume, High MixHigh Volume, Low MixProduct Flexibility
Profit Velocity Material & Capacity Utilization Driver
VMI, SMI, CPFR - Networked and Real Time SMI - Slow Collaboration
Real Time WIP, Schedules, Costs and Capability
Completed Orders, FG Inventory
Manufacturing Visibility
Event Driven S&OP, Closed Loop Scheduling
Master Production Scheduling
Planning
In-house/Outsourced, DynamicIn-houseCapacity
Dynamic Re-sequencing CampaignsOrder Execution
Pull, Lean ReplenishmentPush, RM/FG Buffer Inventories
Inventory Philosophy
Rapid, In-house/Contracted R&D, Time To ValueInfrequent, In-house R&DNPD&L
Supply & DemandSupplyManaged Variability
ETO, MTO, ATO, CTO, Outsourced/ContractedMTSManufacturing Philosophy
Demand Driven ManufacturingTraditional Manufacturing Characteristics
Evolution of Demand Driven Manufacturing
AMR Research 2006
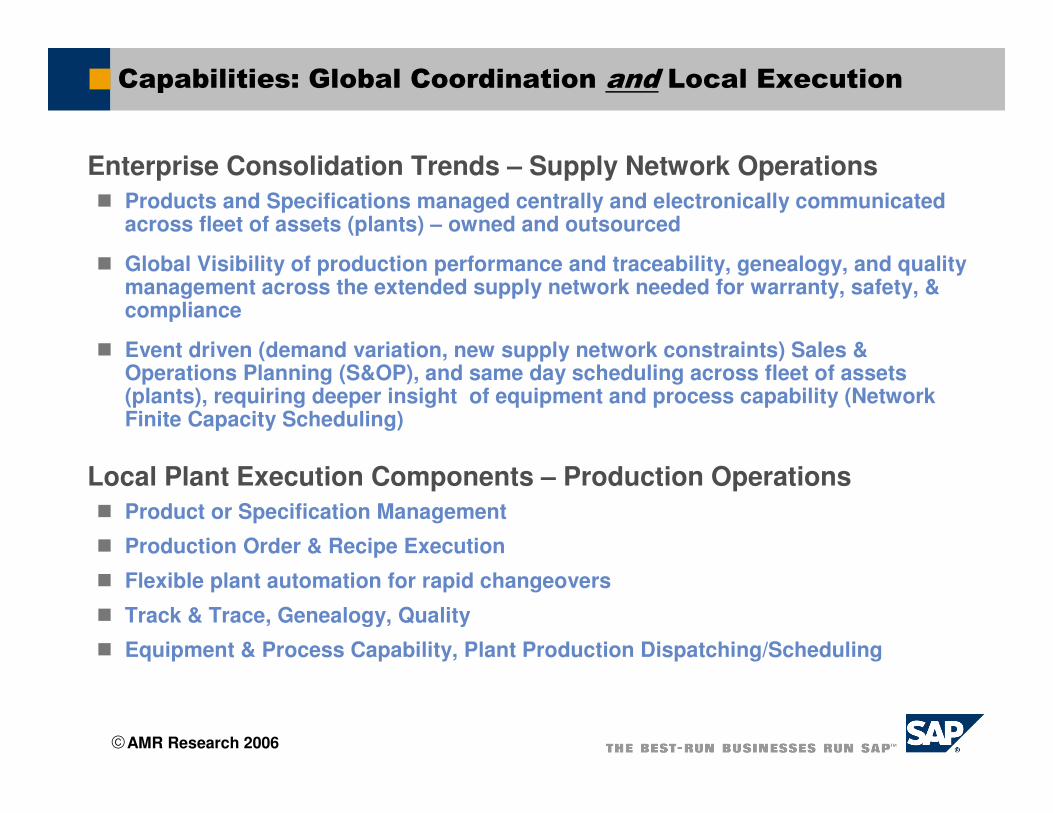
Capabilities: Global Coordination and Local Execution
Enterprise Consolidation Trends – Supply Network Operations
� Products and Specifications managed centrally and electronically communicated across fleet of assets (plants) – owned and outsourced
� Global Visibility of production performance and traceability, genealogy, and quality management across the extended supply network needed for warranty, safety, & compliance
� Event driven (demand variation, new supply network constraints) Sales & Operations Planning (S&OP), and same day scheduling across fleet of assets (plants), requiring deeper insight of equipment and process capability (Network Finite Capacity Scheduling)
Local Plant Execution Components – Production Operations
� Product or Specification Management
� Production Order & Recipe Execution
� Flexible plant automation for rapid changeovers
� Track & Trace, Genealogy, Quality
� Equipment & Process Capability, Plant Production Dispatching/Scheduling
AMR Research 2006
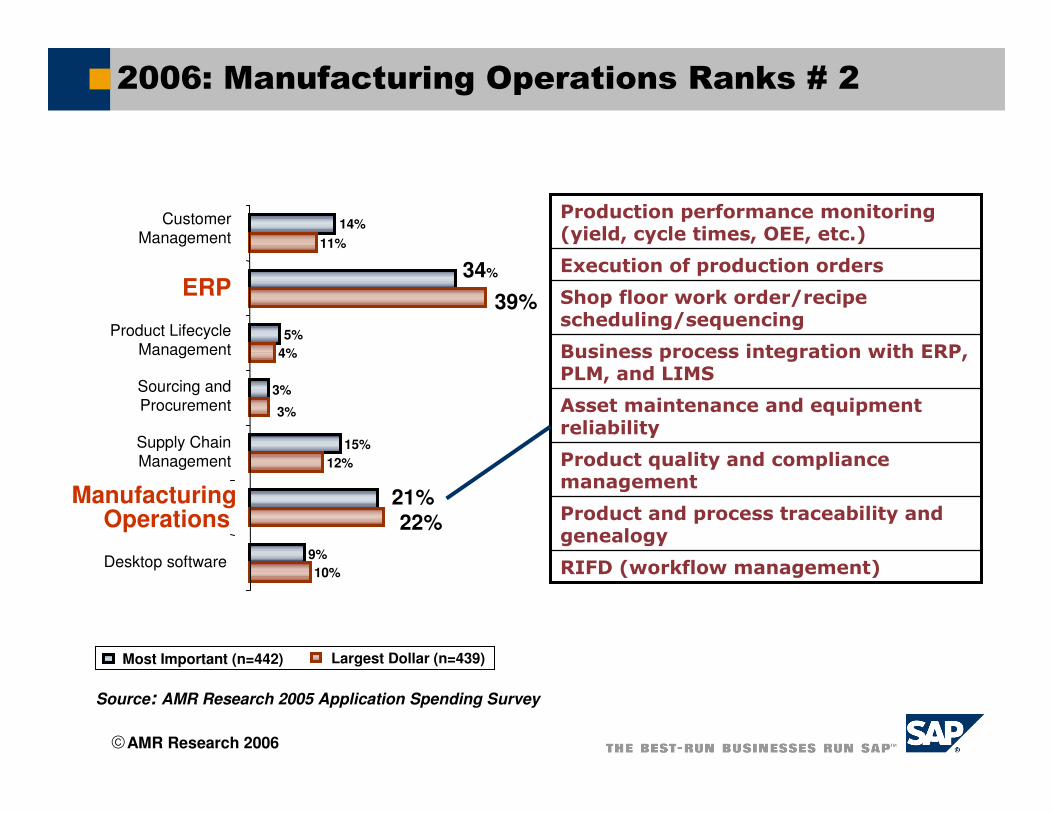
2006: Manufacturing Operations Ranks # 2
5%
3%
15%
21%
9%
11%
39%
4%
12%
22%
10%
14%
34%
3%
Customer Management
Product Lifecycle Management
Sourcing and Procurement
Supply Chain Management
ManufacturingOperations
Desktop software
ERP
RIFD (workflow management)
Product and process traceability and genealogy
Product quality and compliance management
Asset maintenance and equipment reliability
Business process integration with ERP, PLM, and LIMS
Shop floor work order/recipe scheduling/sequencing
Execution of production orders
Production performance monitoring(yield, cycle times, OEE, etc.)
Largest Dollar (n=439)Most Important (n=442)
Source: AMR Research 2005 Application Spending Survey
AMR Research 2006
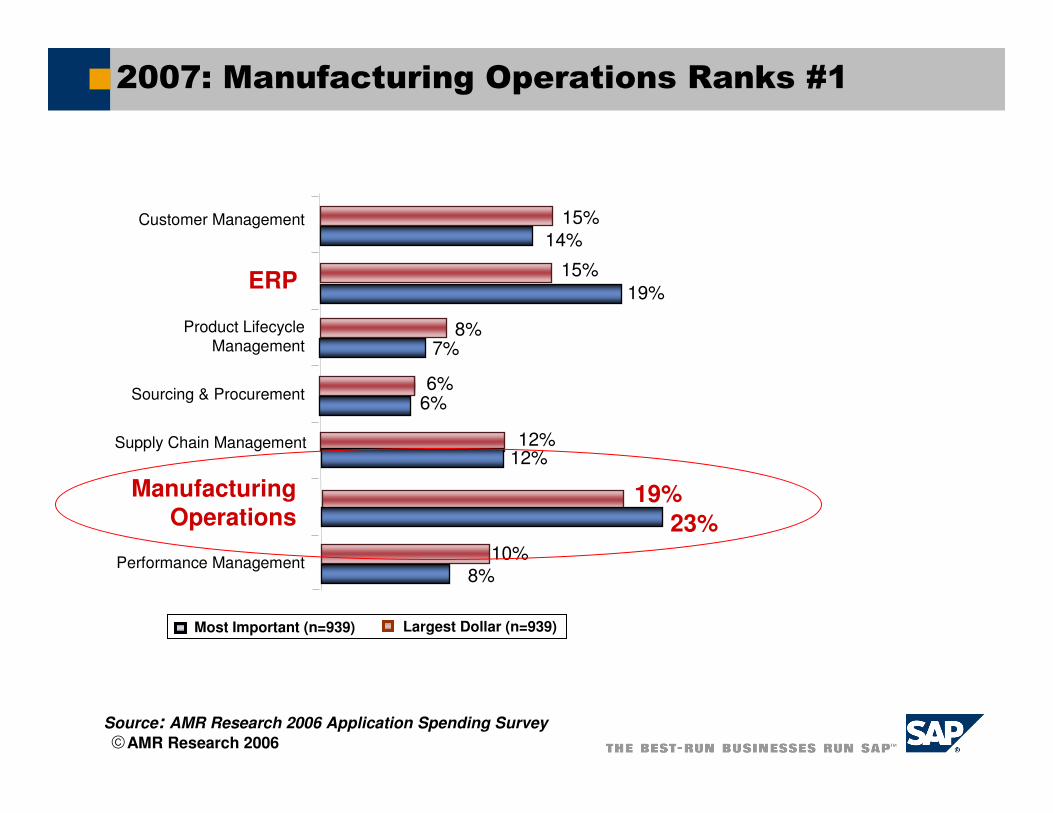
15%
15%
8%
14%
19%
7%
Customer Management
ManufacturingOperations
Sourcing & Procurement
ERP
12%12%
23%
19%
8%
6%6%
10%
Supply Chain Management
Product Lifecycle
Management
Performance Management
2007: Manufacturing Operations Ranks #1
Source: AMR Research 2006 Application Spending Survey
Largest Dollar (n=939)Most Important (n=939)
AMR Research 2006
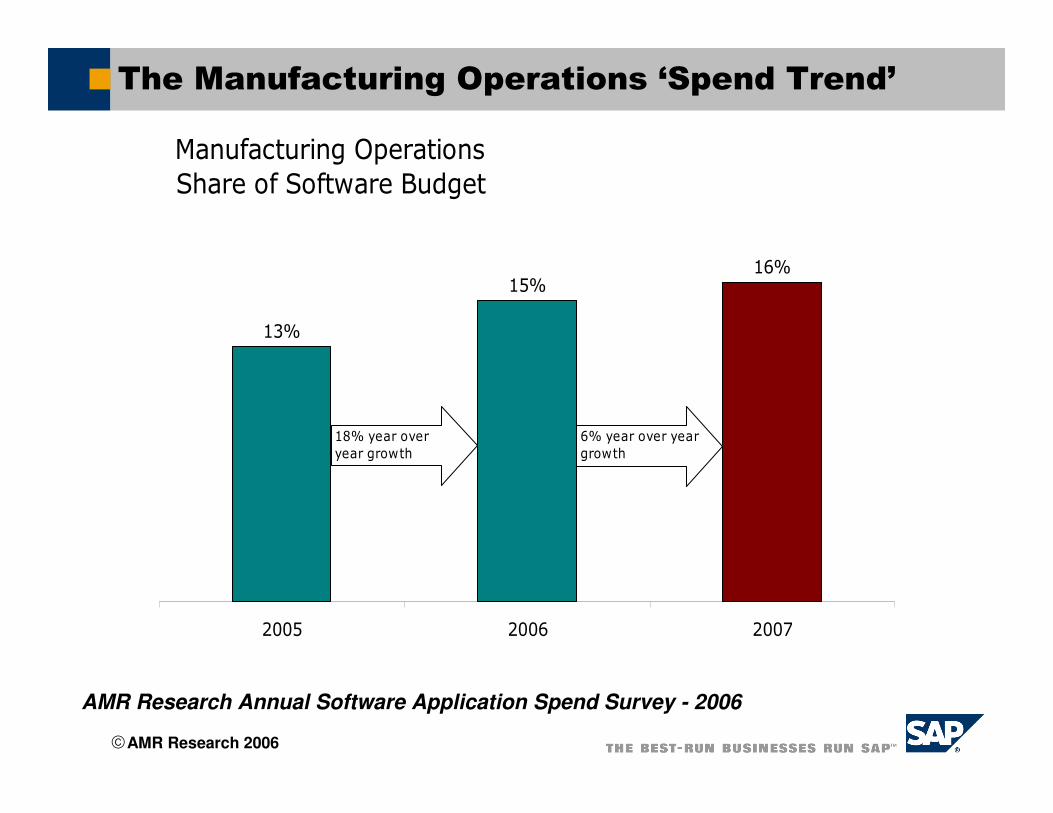
The Manufacturing Operations ‘Spend Trend’
Manufacturing Operations
Share of Software Budget
13%
15%16%
2005 2006 2007
18% year over
year growth
6% year over year
growth
AMR Research Annual Software Application Spend Survey - 2006
AMR Research 2006
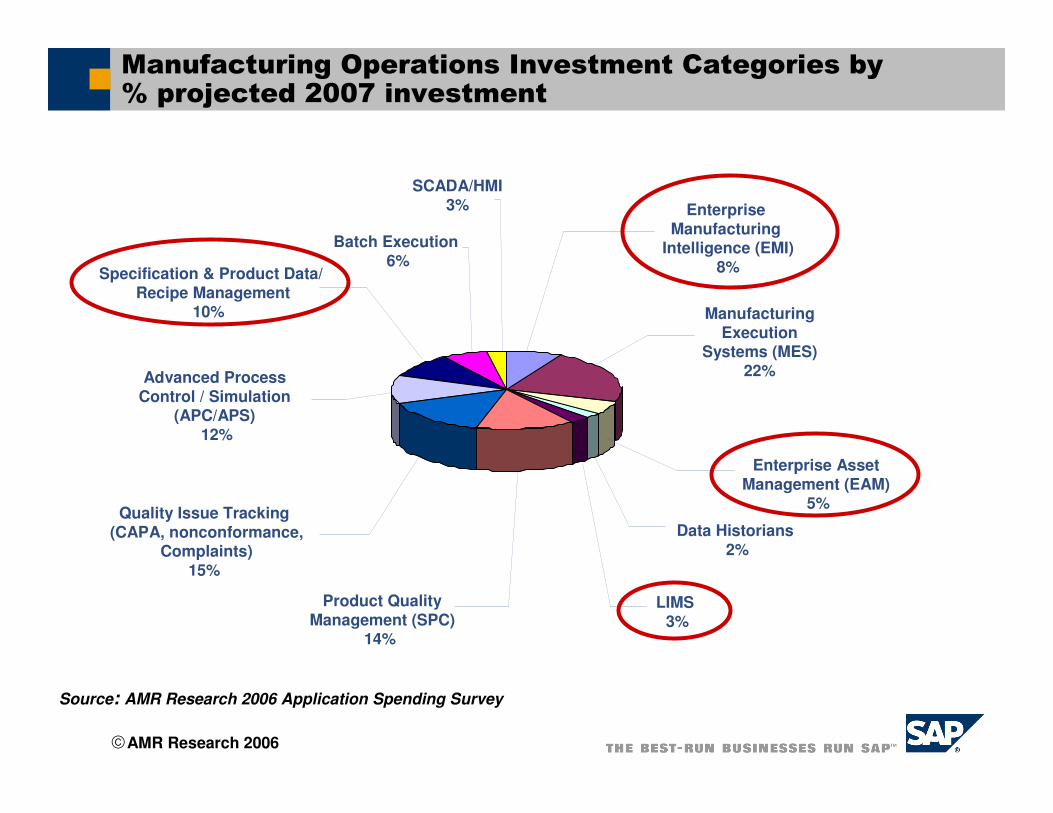
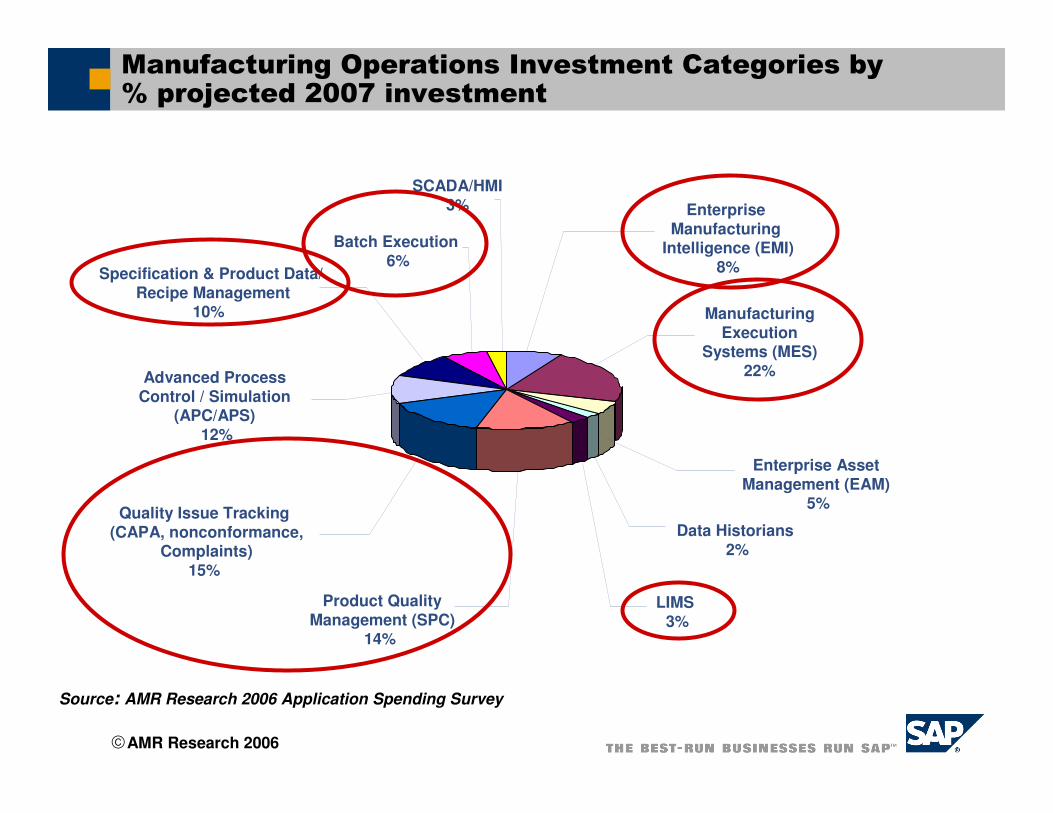
Manufacturing Execution
Systems (MES) 22%
Enterprise Asset Management (EAM)
5%
Data Historians 2%
LIMS3%
Product QualityManagement (SPC)
14%
Quality Issue Tracking (CAPA, nonconformance,
Complaints)15%
Advanced Process Control / Simulation
(APC/APS) 12%
Batch Execution 6%
SCADA/HMI3%
Specification & Product Data/ Recipe Management
10%
Enterprise Manufacturing
Intelligence (EMI)8%
Source: AMR Research 2006 Application Spending Survey
Manufacturing Operations Investment Categories by % projected 2007 investment
AMR Research 2006
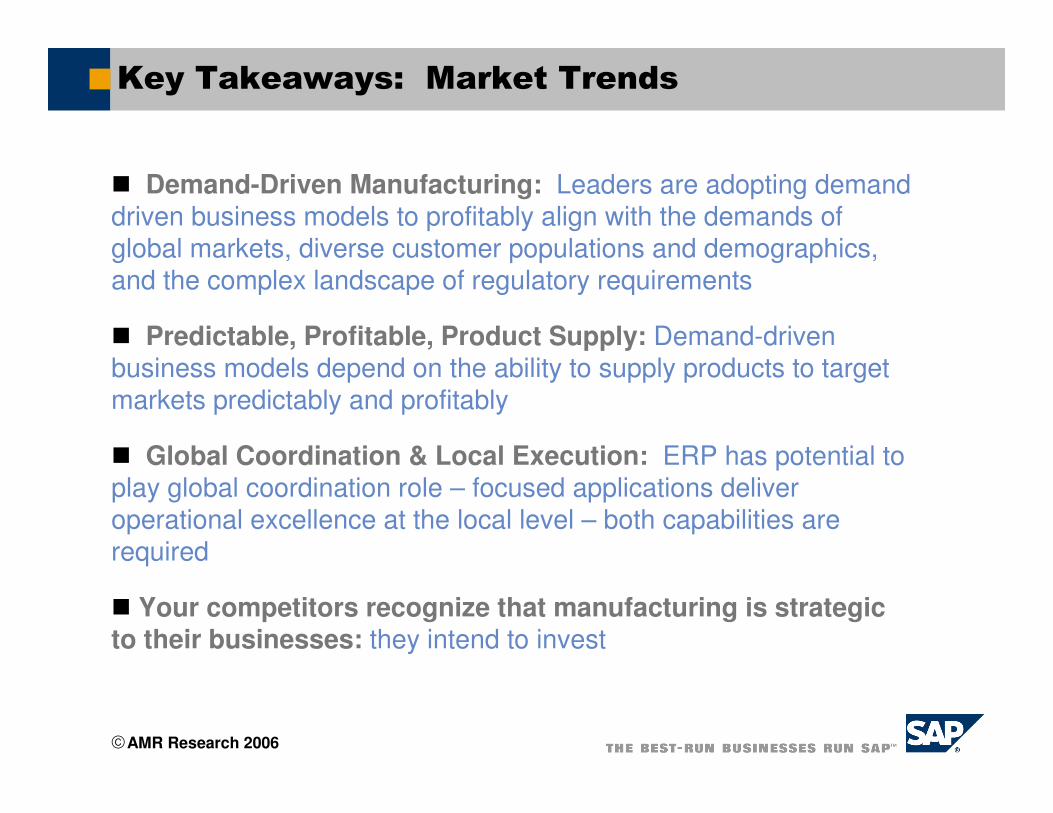
Key Takeaways: Market Trends
� Demand-Driven Manufacturing: Leaders are adopting demand driven business models to profitably align with the demands of global markets, diverse customer populations and demographics, and the complex landscape of regulatory requirements
� Predictable, Profitable, Product Supply: Demand-driven business models depend on the ability to supply products to target markets predictably and profitably
� Global Coordination & Local Execution: ERP has potential to play global coordination role – focused applications deliver operational excellence at the local level – both capabilities are required
� Your competitors recognize that manufacturing is strategic to their businesses: they intend to invest

AMR Research 2006
Outline/Agenda for Today’s Presentation
Manufacturing Operations tops “most wanted”
strategic applications list for 2007
Manufacturing Metrics & Performance Challenges
Manufacturing operations: The “sweet spot” for
composite applications
Questions & Answers
AMR Research 2006
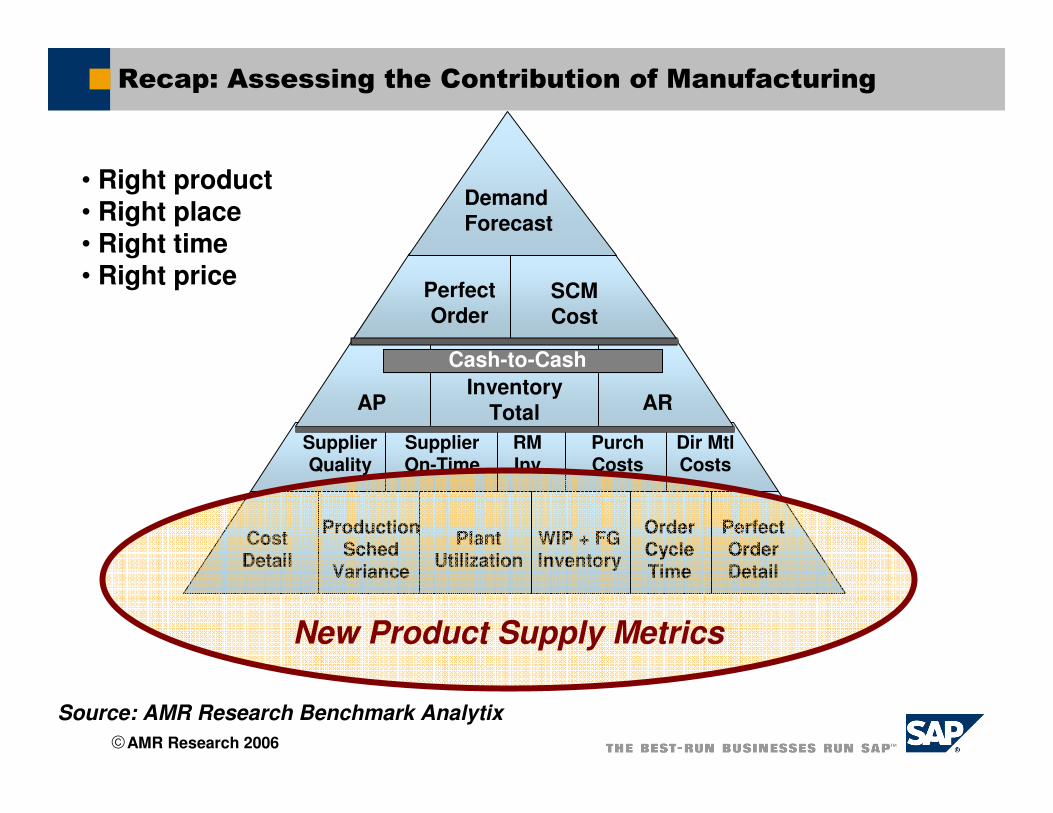
Recap: Assessing the Contribution of Manufacturing
Supplier Quality
Supplier On-Time
PurchCosts
Dir MtlCosts
RM Inv
Cost Detail
Production Sched
Variance
Plant Utilization
WIP + FG Inventory
Order Cycle Time
Perfect Order Detail
AP ARInventory
Total
Cash-to-Cash
Perfect Order
SCM Cost
Demand Forecast
Source: AMR Research Benchmark Analytix
• Right product• Right place• Right time• Right price
New Product Supply Metrics
AMR Research 2006
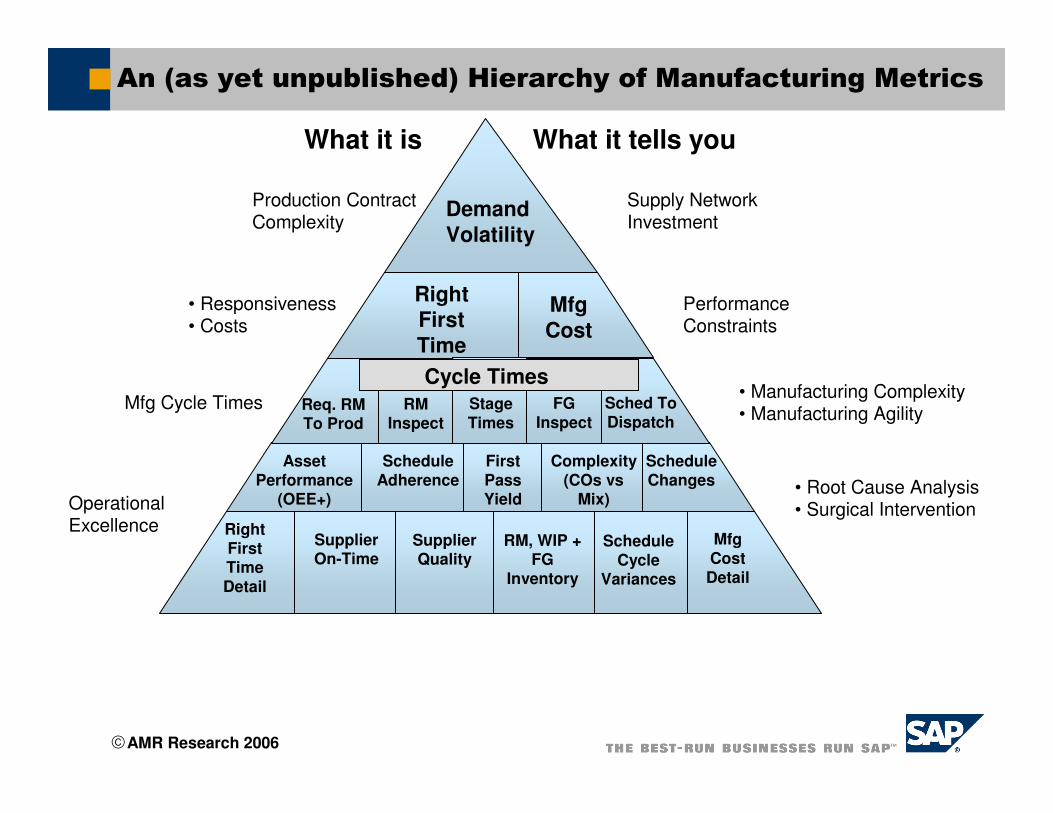
An (as yet unpublished) Hierarchy of Manufacturing Metrics
What it is What it tells you
OperationalExcellence
Demand Volatility
RightFirstTime
Mfg Cost
RM, WIP + FG
Inventory
RightFirstTimeDetail
MfgCost Detail
SupplierQuality
SupplierOn-Time
ScheduleCycle
Variances
AssetPerformance
(OEE+)
ScheduleAdherence
Complexity(COs vs
Mix)
ScheduleChanges
FirstPass Yield
Req. RMTo Prod
Cycle TimesRM
InspectStageTimes
FGInspect
Sched ToDispatch
Production ContractComplexity
Supply NetworkInvestment
• Responsiveness• Costs
PerformanceConstraints
Mfg Cycle Times• Manufacturing Complexity• Manufacturing Agility
• Root Cause Analysis• Surgical Intervention
AMR Research 2006
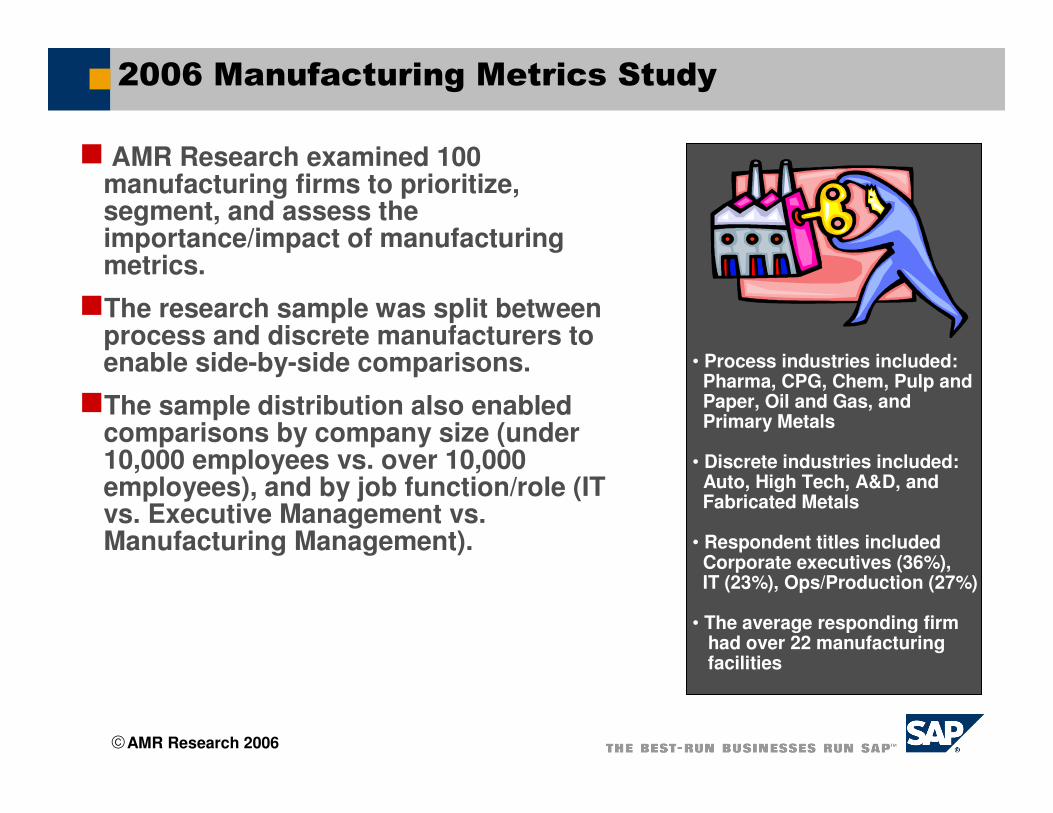
2006 Manufacturing Metrics Study
� AMR Research examined 100 manufacturing firms to prioritize, segment, and assess the importance/impact of manufacturing metrics.
�The research sample was split between process and discrete manufacturers to enable side-by-side comparisons.
�The sample distribution also enabled comparisons by company size (under 10,000 employees vs. over 10,000 employees), and by job function/role (IT vs. Executive Management vs. Manufacturing Management).
• Process industries included: Pharma, CPG, Chem, Pulp andPaper, Oil and Gas, and Primary Metals
• Discrete industries included:Auto, High Tech, A&D, andFabricated Metals
• Respondent titles includedCorporate executives (36%),IT (23%), Ops/Production (27%)
• The average responding firmhad over 22 manufacturingfacilities
AMR Research 2006
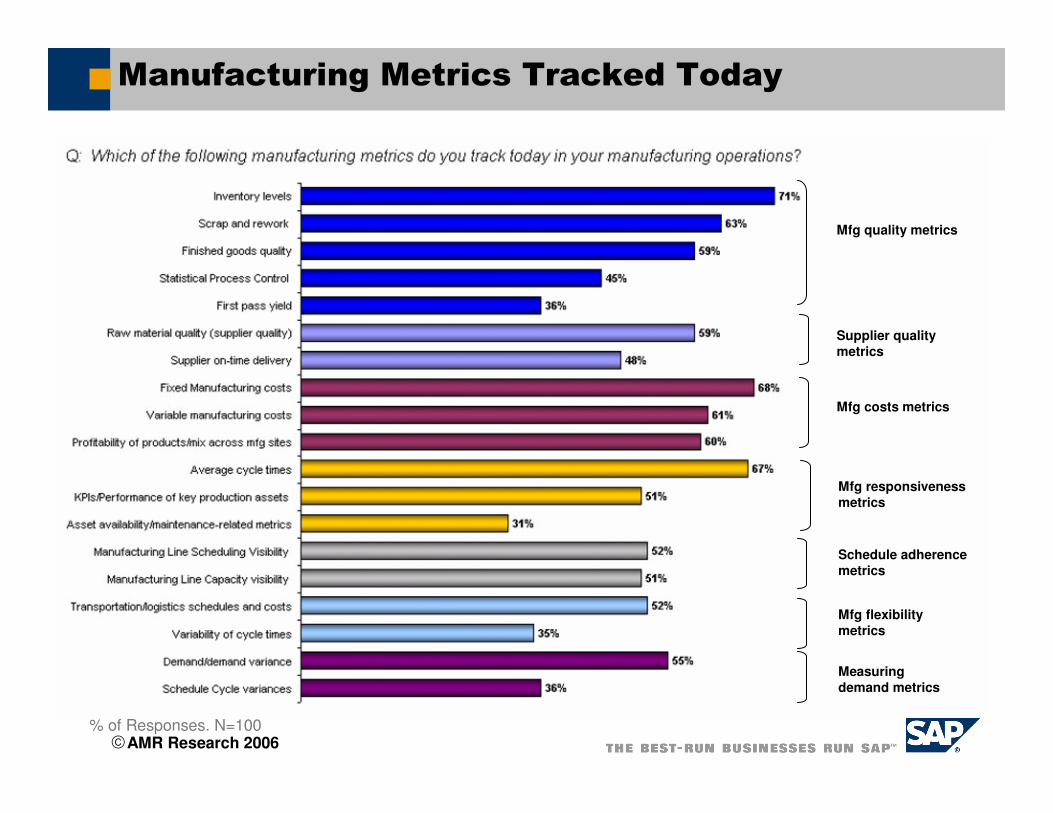
Manufacturing Metrics Tracked Today
% of Responses. N=100
Mfg quality metrics
Supplier quality metrics
Mfg costs metrics
Mfg responsiveness metrics
Schedule adherence metrics
Mfg flexibility metrics
Measuring demand metrics
AMR Research 2006
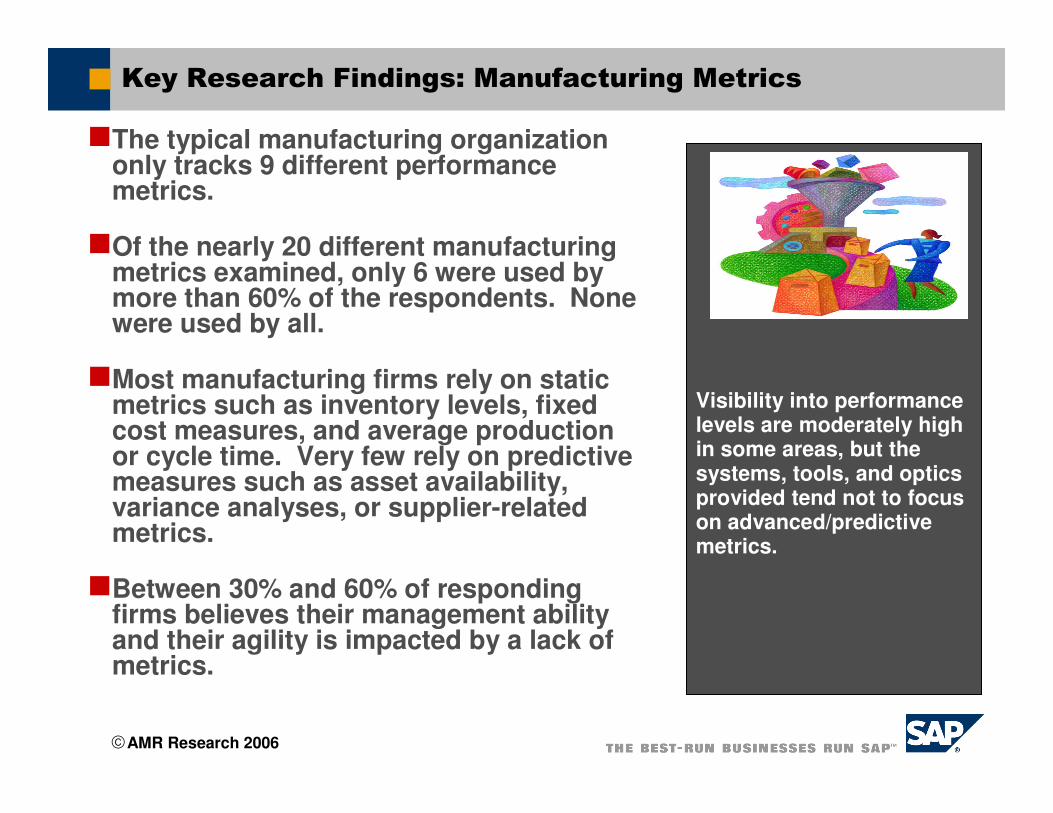
Key Research Findings: Manufacturing Metrics
�The typical manufacturing organization only tracks 9 different performance metrics.
�Of the nearly 20 different manufacturing metrics examined, only 6 were used by more than 60% of the respondents. None were used by all.
�Most manufacturing firms rely on static metrics such as inventory levels, fixed cost measures, and average production or cycle time. Very few rely on predictive measures such as asset availability, variance analyses, or supplier-related metrics.
�Between 30% and 60% of responding firms believes their management ability and their agility is impacted by a lack of metrics.
Visibility into performance levels are moderately high in some areas, but the systems, tools, and optics provided tend not to focus on advanced/predictive metrics.
AMR Research 2006
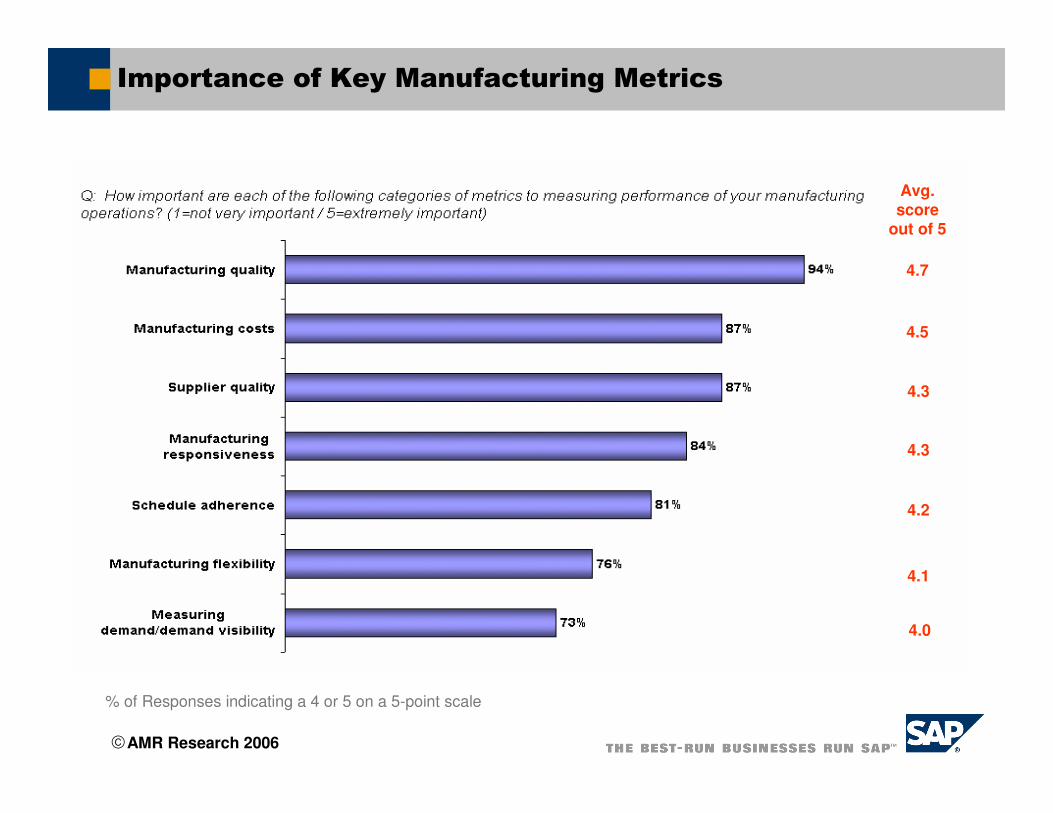
Importance of Key Manufacturing Metrics
% of Responses indicating a 4 or 5 on a 5-point scale
Avg. score
out of 5
4.7
4.5
4.3
4.3
4.2
4.1
4.0
AMR Research 2006
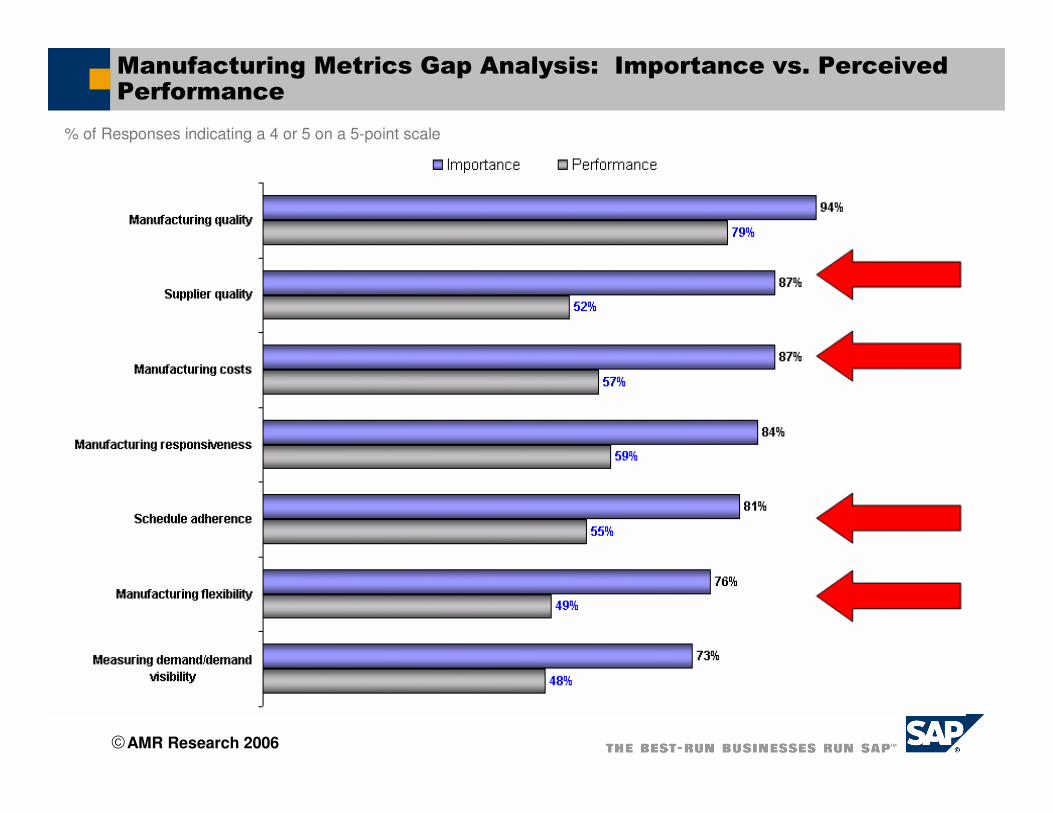
Manufacturing Metrics Gap Analysis: Importance vs. Perceived Performance
% of Responses indicating a 4 or 5 on a 5-point scale
AMR Research 2006
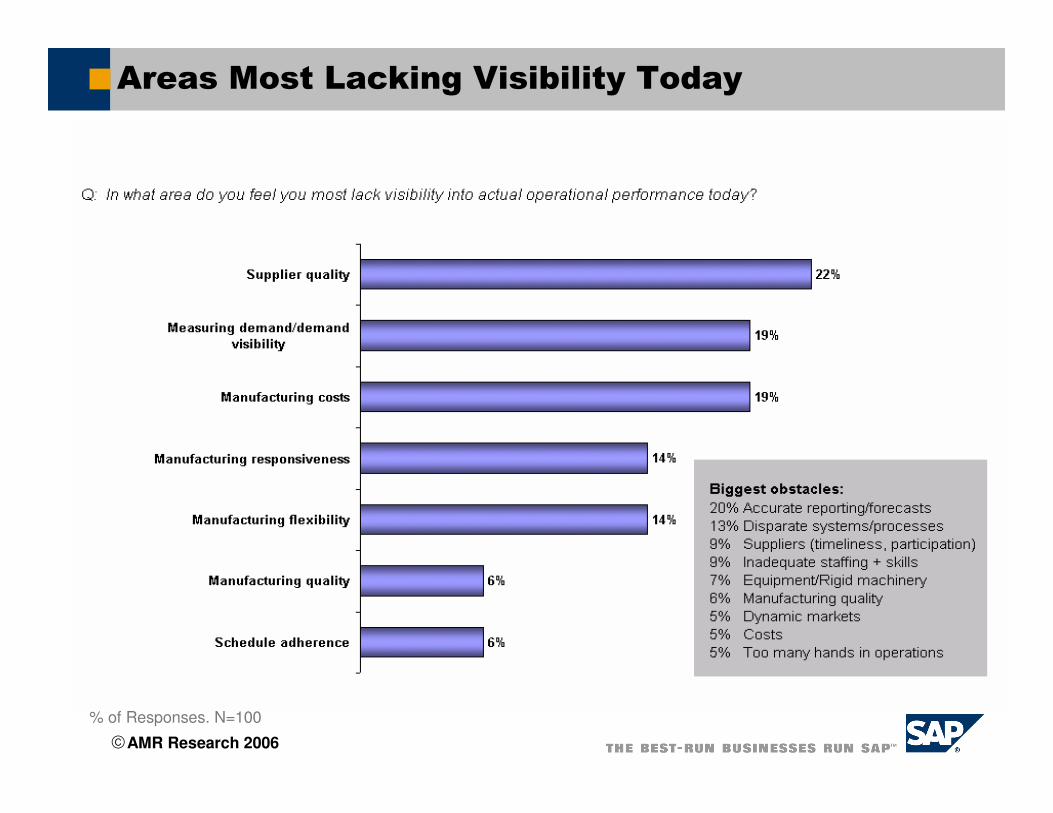
Areas Most Lacking Visibility Today
% of Responses. N=100

AMR Research 2006
Obstacles Preventing Metrics-Based Decisions
%of Respondents. N=100
AMR Research 2006
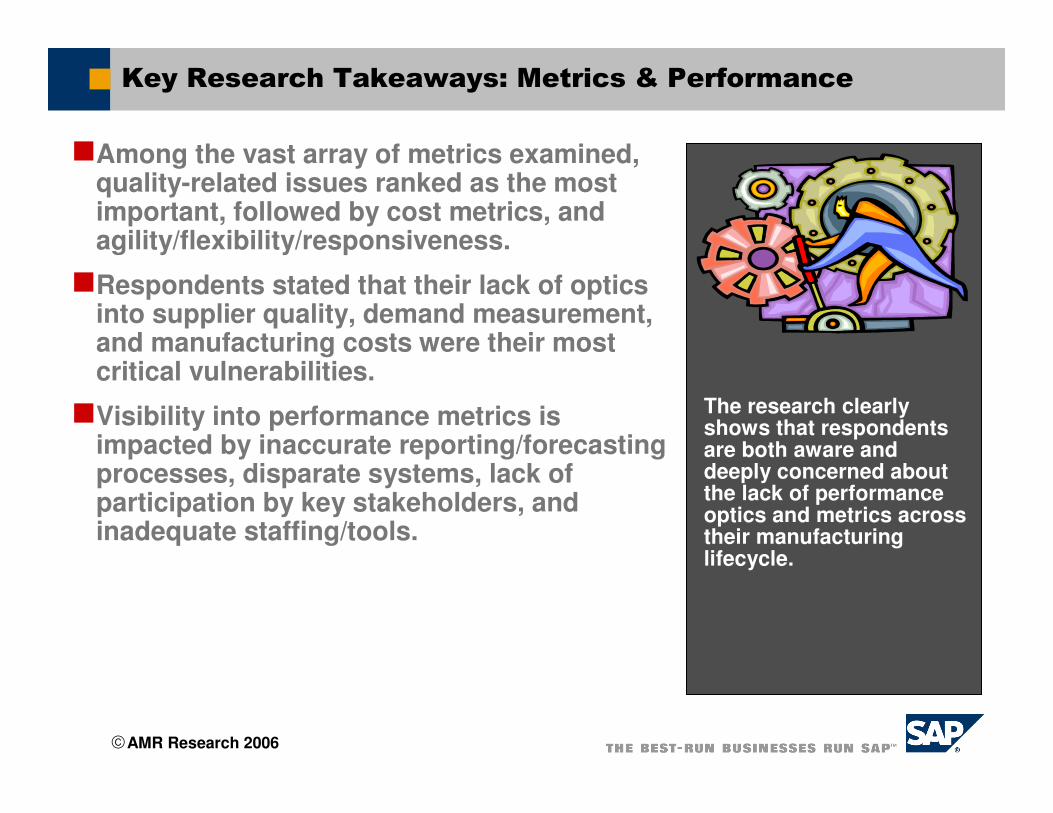
Key Research Takeaways: Metrics & Performance
�Among the vast array of metrics examined, quality-related issues ranked as the most important, followed by cost metrics, and agility/flexibility/responsiveness.
�Respondents stated that their lack of optics into supplier quality, demand measurement, and manufacturing costs were their most critical vulnerabilities.
�Visibility into performance metrics is impacted by inaccurate reporting/forecasting processes, disparate systems, lack of participation by key stakeholders, and inadequate staffing/tools.
The research clearly shows that respondents are both aware and deeply concerned about the lack of performance optics and metrics across their manufacturing lifecycle.
AMR Research 2006
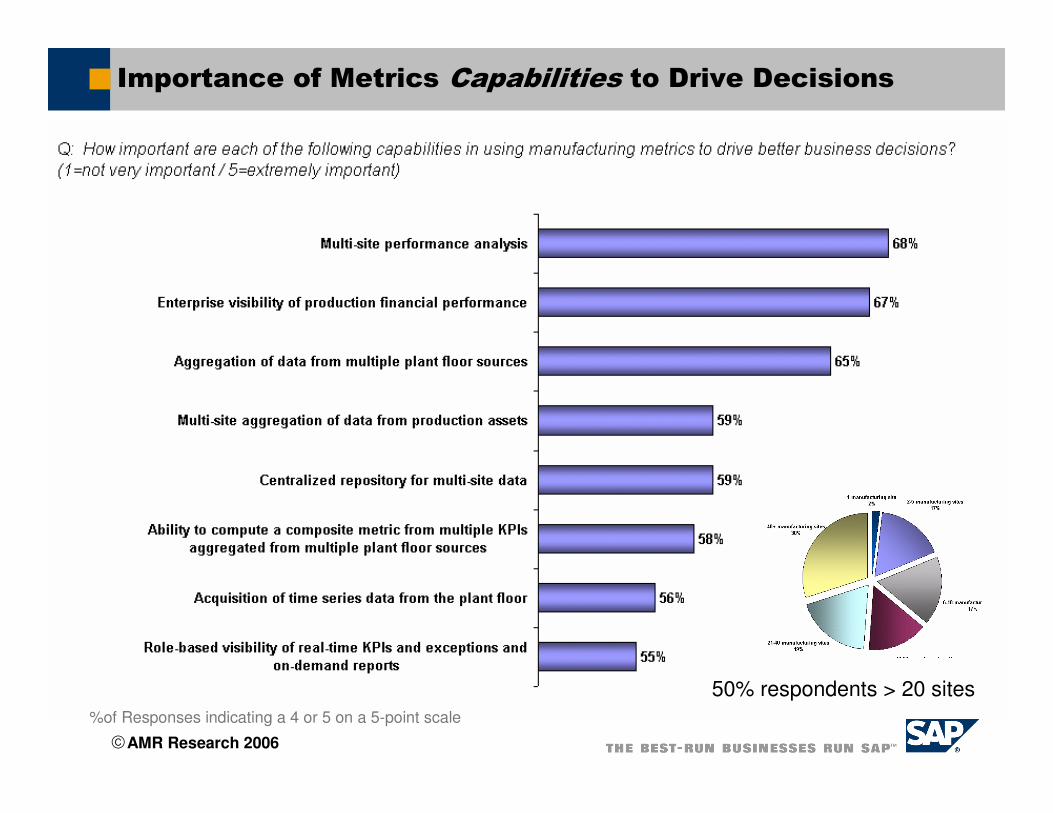
Importance of Metrics Capabilities to Drive Decisions
%of Responses indicating a 4 or 5 on a 5-point scale
50% respondents > 20 sites
AMR Research 2006
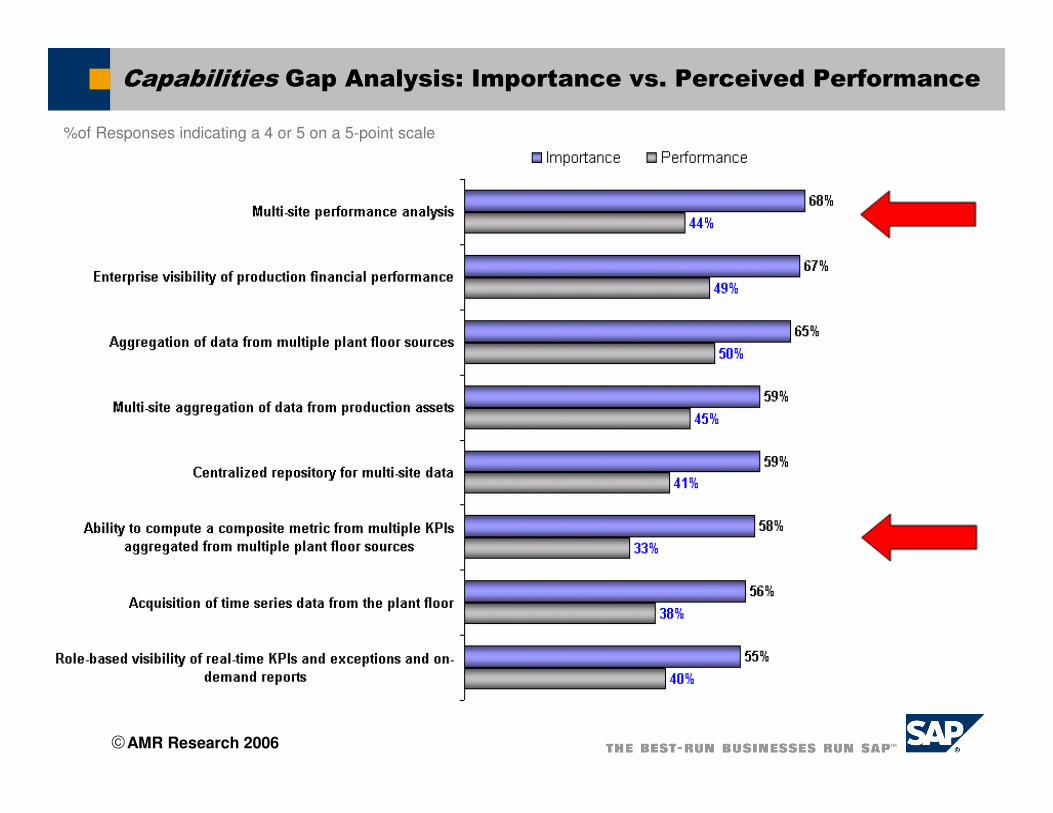
Capabilities Gap Analysis: Importance vs. Perceived Performance
%of Responses indicating a 4 or 5 on a 5-point scale
AMR Research 2006
Key Research Findings: Supporting Capabilities
�A multi-site view of performance is perceived as important; respondents are beginning to connect core capabilities with that desired outcome.
�Composite metrics are desired, but remain elusive.
�Establishing relationships between key performance indicators and key performance drivers is the next challenge that manufacturers will focus on.
A multi-site, multi-environment, and multi-geography focus are increasingly important to major manufacturers.
Mature manufacturers are focused on assembling capabilities that will support performance visibility on this scale.

AMR Research 2006
Responsibility for Manufacturing Metrics
%of Respondents. N=100
AMR Research 2006
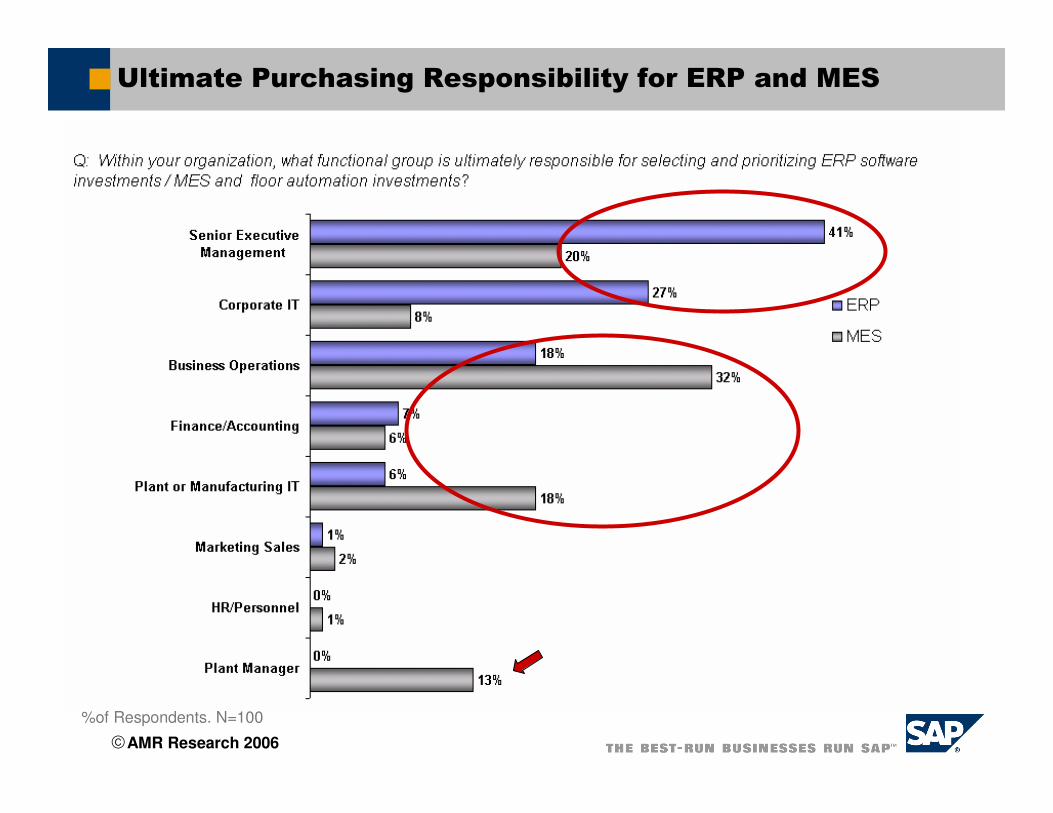
Ultimate Purchasing Responsibility for ERP and MES
%of Respondents. N=100

AMR Research 2006
Key Research Findings: Responsibilities
�The gap in decision making between ERP and MES (read “plant floor systems”) is fairly broad with senior management and IT dominating ERP decisions and business operations, plant-level IT and plant management dominating MES.
�Effective metrics solutions need to address the specific needs of each constituency.
�Financial and executive management is the leading influencer in determining which metrics are captured and used, but plant management and plant-level IT are also highly involved.
�Among the primary decision drivers will be TCO, reliability, ease of use, functionality, and ease of implementation.
For application providers, a multi-site, multi-environment, and multi-geography focus are seen as key strengths.
Cost, ease of use, and speed of payback are key attributes.
Applications must have a value proposition for both corporate level and plant level constituents.
AMR Research 2006
Outline/Agenda for Today’s Presentation
Manufacturing Operations tops “most wanted”
strategic applications list for 2007
Manufacturing Metrics & Performance Challenges
Manufacturing operations: The “sweet spot” for
composite applications
Questions & Answers

AMR Research 2006
Enterprise Manufacturing Intelligence
Enterprise Visibility of Manufacturing Performance: a Strategic Capability
Supplier Quality
Supplier On-Time
PurchCosts
Dir MtlCosts
RM Inv
Cost Detail
Production Sched
Variance
Plant Utilization
WIP + FG Inventory
Order Cycle Time
Perfect Order Detail
Source: AMR Research Benchmark Analytix
• Right product• Right place• Right time• Right price
Perfect Order
SCM Cost
Demand Forecast
AP ARInventory
Total
Cash-to-Cash
Getting visibility
is the first step!
AMR Research 2006
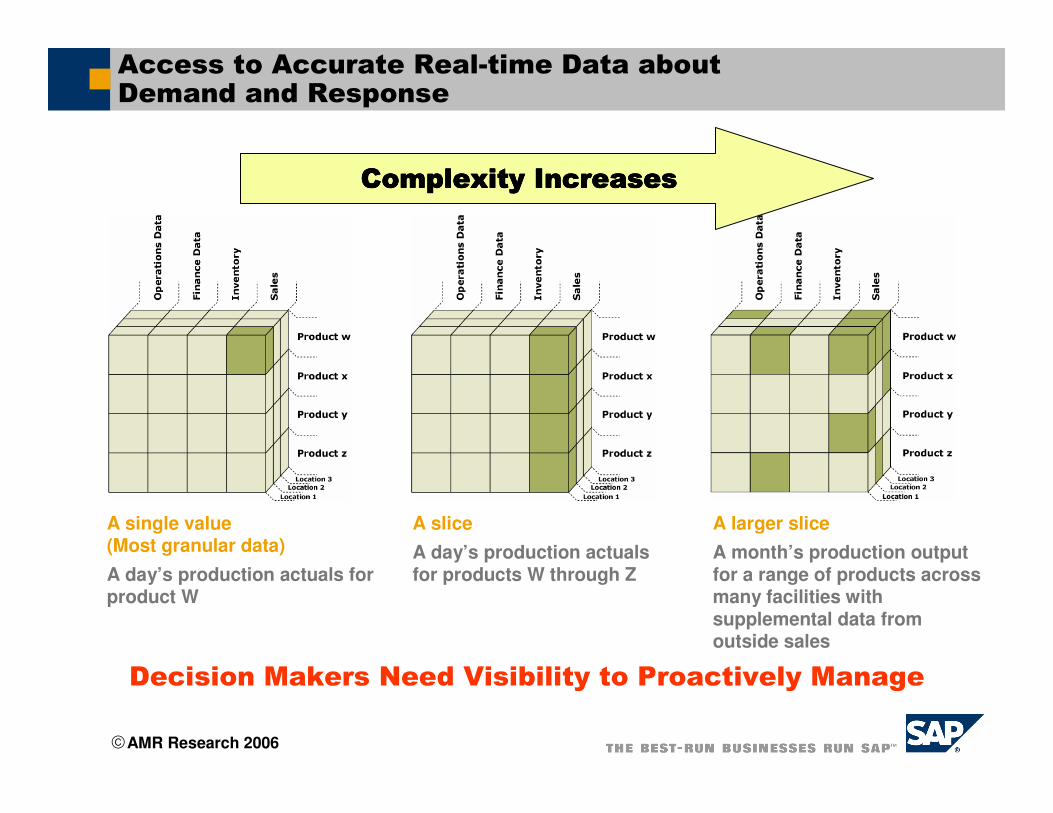
A larger slice
A month’s production output for a range of products across many facilities with supplemental data from outside sales
Access to Accurate Real-time Data about Demand and Response
A single value (Most granular data)
A day’s production actuals for product W
A slice
A day’s production actualsfor products W through Z
Decision Makers Need Visibility to Proactively Manage
Complexity IncreasesComplexity IncreasesComplexity IncreasesComplexity Increases
AMR Research 2006
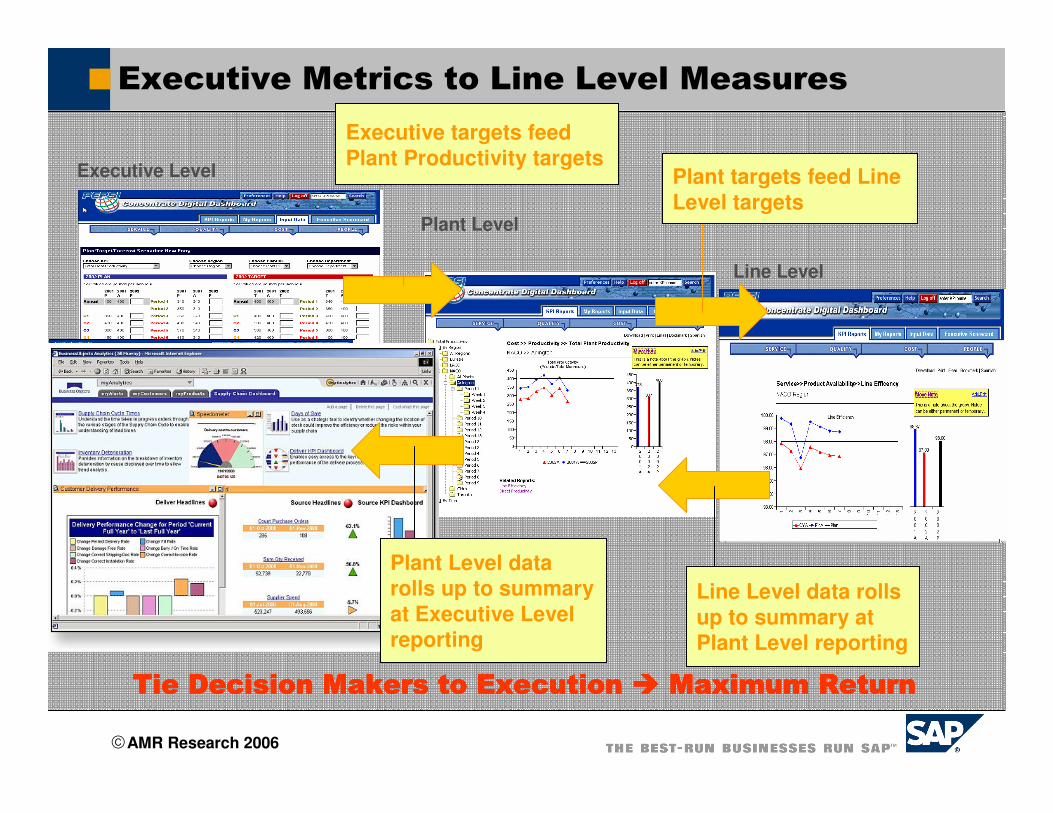
Executive Metrics to Line Level Measures
Executive Level
Plant Level
Line Level
Tie Decision Makers to Execution Tie Decision Makers to Execution Tie Decision Makers to Execution Tie Decision Makers to Execution ���� Maximum ReturnMaximum ReturnMaximum ReturnMaximum Return
Line Level data rolls up to summary at Plant Level reporting
Executive targets feed Plant Productivity targets
Plant Level data rolls up to summary at Executive Level reporting
Plant targets feed Line Level targets
AMR Research 2006
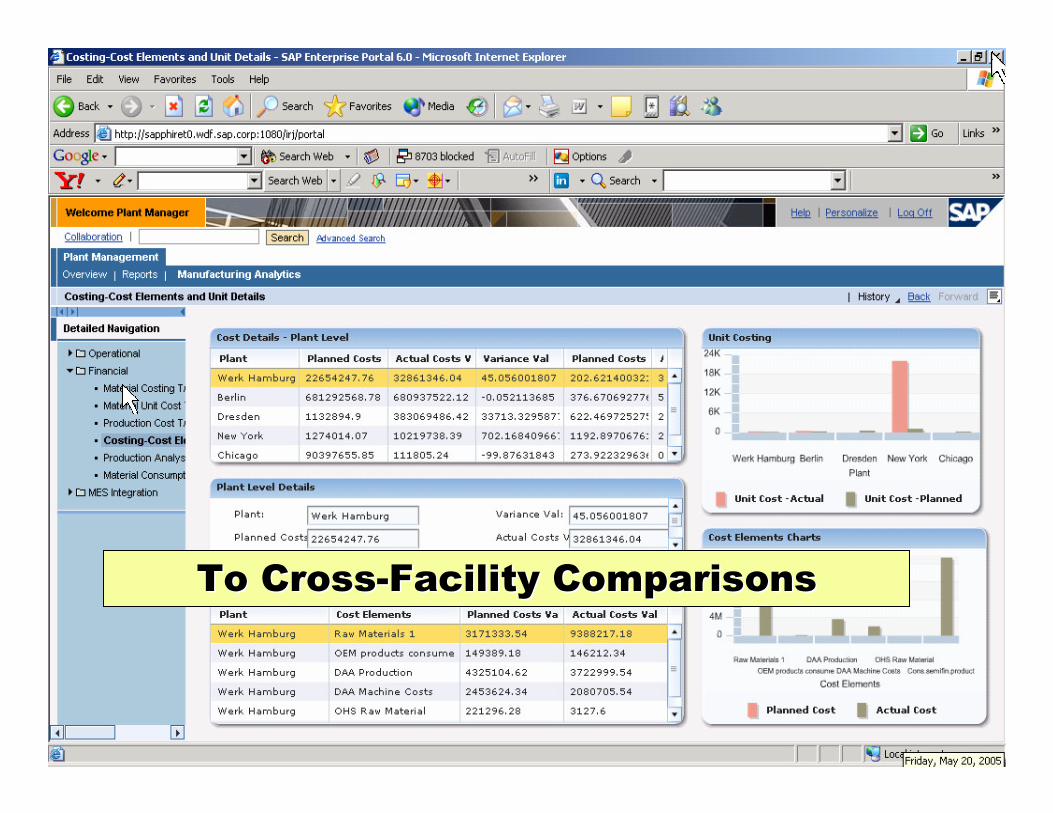
To CrossTo Cross--Facility ComparisonsFacility Comparisons
AMR Research 2006
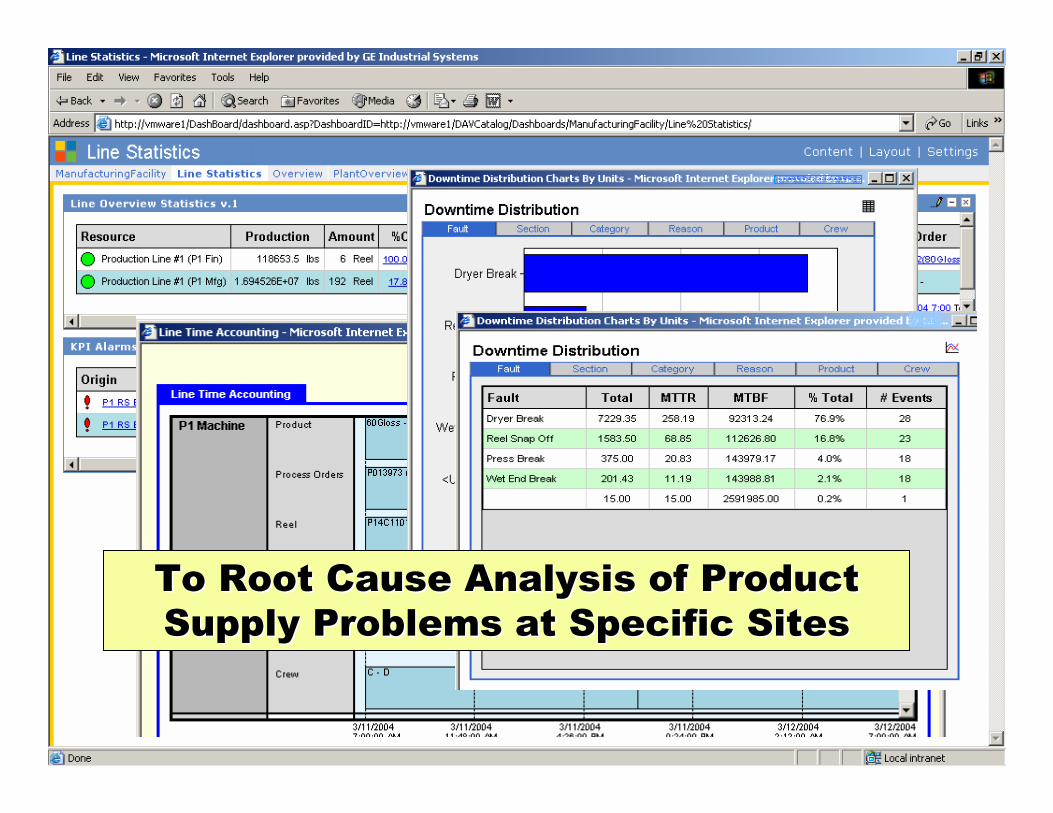
To Root Cause Analysis of Product To Root Cause Analysis of Product
Supply Problems at Specific SitesSupply Problems at Specific Sites

AMR Research 2006
Enterprise Manufacturing Intelligence is an Architecture, not an Application
VISUALIZECONTEXTUALIZEe.g. Capable/Profitable to Promise
ANALYZE
DEVICE I/O
TAGS
EQUIPMENT
& ASSET
ORDERS
SPECIFICATIONS
INSTRUMENT
BUSINESS
RULES
MATERIAL
& PRODUCT
FLOWS
PRODUCTION MODELS,
RECIPES/ BOMS
& ROUTES
COST-BASED
MODELS
Large volumes of extremely detailed production data from multiple back-end
data sources.
Operating data transformed into asset performance KPIs
Correlations between equipment data and product data
Overall process performance metrics
Performance to schedule
PerformTo Demand
AMR Research 2006
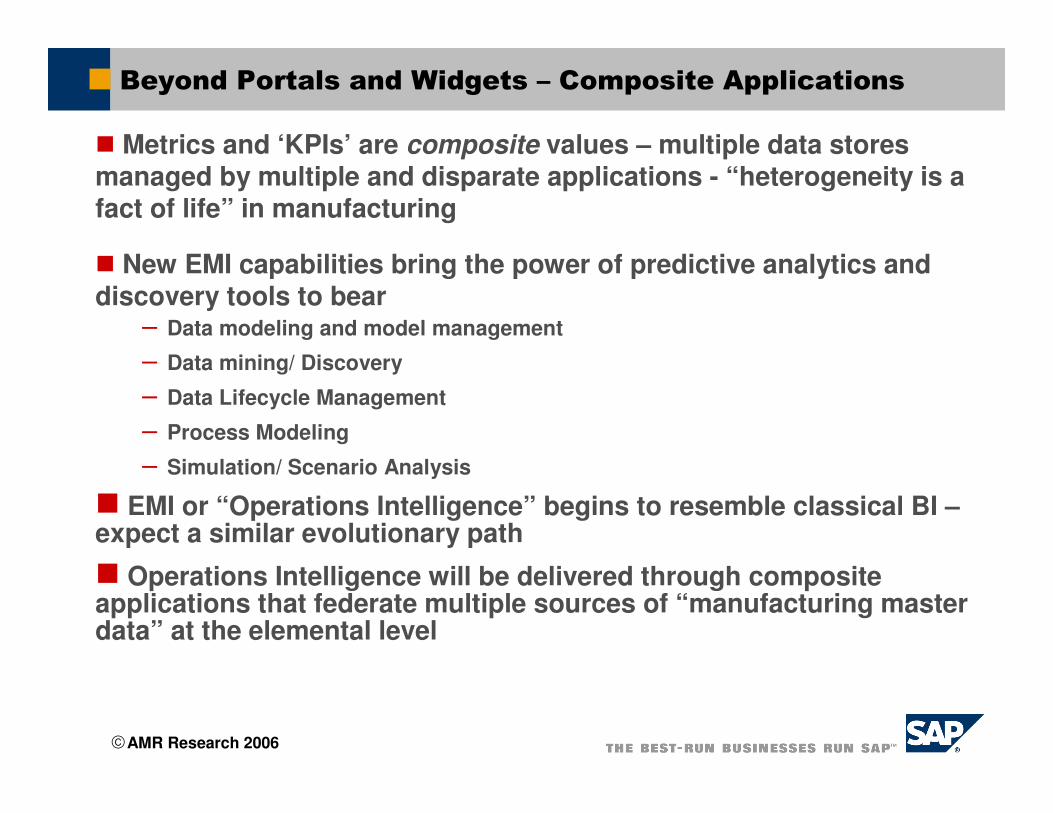
Beyond Portals and Widgets – Composite Applications
� Metrics and ‘KPIs’ are composite values – multiple data stores managed by multiple and disparate applications - “heterogeneity is a fact of life” in manufacturing
� New EMI capabilities bring the power of predictive analytics and discovery tools to bear
– Data modeling and model management
– Data mining/ Discovery
– Data Lifecycle Management
– Process Modeling
– Simulation/ Scenario Analysis
� EMI or “Operations Intelligence” begins to resemble classical BI –expect a similar evolutionary path
� Operations Intelligence will be delivered through composite applications that federate multiple sources of “manufacturing master data” at the elemental level
AMR Research 2006
Manufacturing Execution
Systems (MES) 22%
Enterprise Asset Management (EAM)
5%
Data Historians 2%
LIMS3%
Product QualityManagement (SPC)
14%
Quality Issue Tracking (CAPA, nonconformance,
Complaints)15%
Advanced Process Control / Simulation
(APC/APS) 12%
Batch Execution 6%
SCADA/HMI3%
Specification & Product Data/ Recipe Management
10%
Enterprise Manufacturing
Intelligence (EMI)8%
Source: AMR Research 2006 Application Spending Survey
Manufacturing Operations Investment Categories by % projected 2007 investment
AMR Research 2006
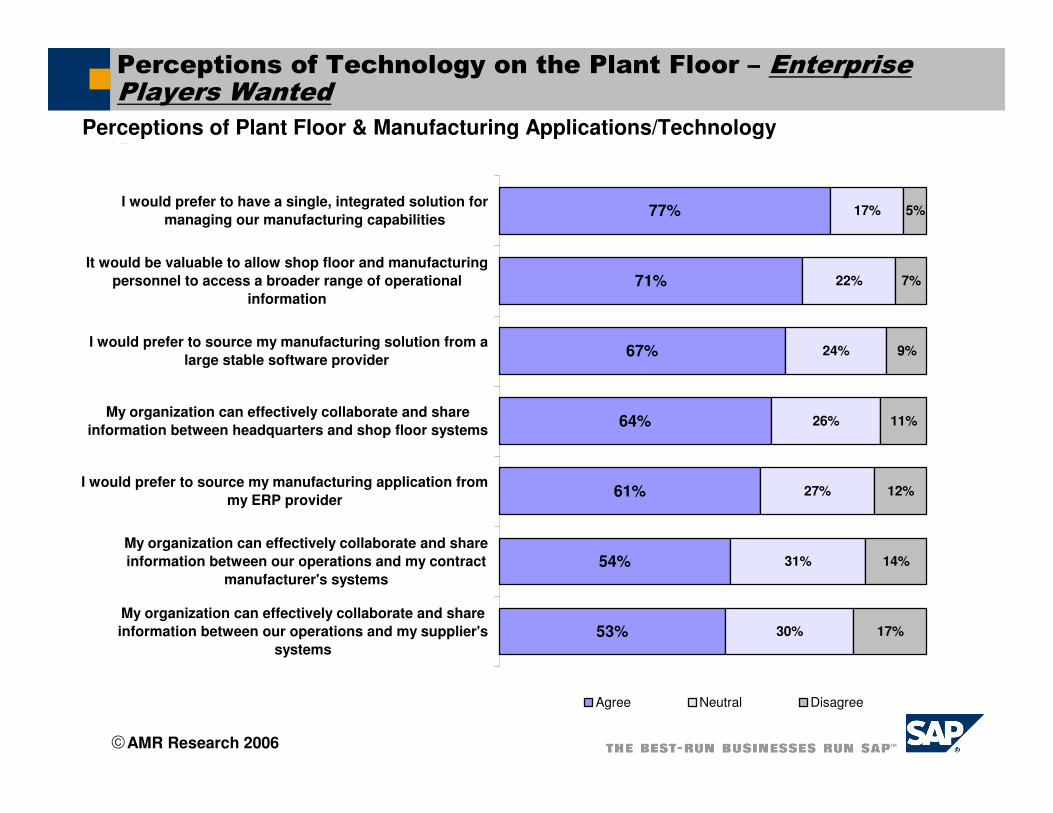
Perceptions of Technology on the Plant Floor – Enterprise Players Wanted
Perceptions of Plant Floor & Manufacturing Applications/Technology % of Responses
77%
71%
67%
64%
61%
54%
53%
17%
22%
24%
26%
27%
31%
30%
5%
7%
9%
11%
12%
14%
17%
I would prefer to have a single, integrated solution for
managing our manufacturing capabilities
It would be valuable to allow shop floor and manufacturing
personnel to access a broader range of operational
information
I would prefer to source my manufacturing solution from a
large stable software provider
My organization can effectively collaborate and share
information between headquarters and shop floor systems
I would prefer to source my manufacturing application from
my ERP provider
My organization can effectively collaborate and share
information between our operations and my contract
manufacturer's systems
My organization can effectively collaborate and share
information between our operations and my supplier's
systems
Agree Neutral Disagree
AMR Research 2006
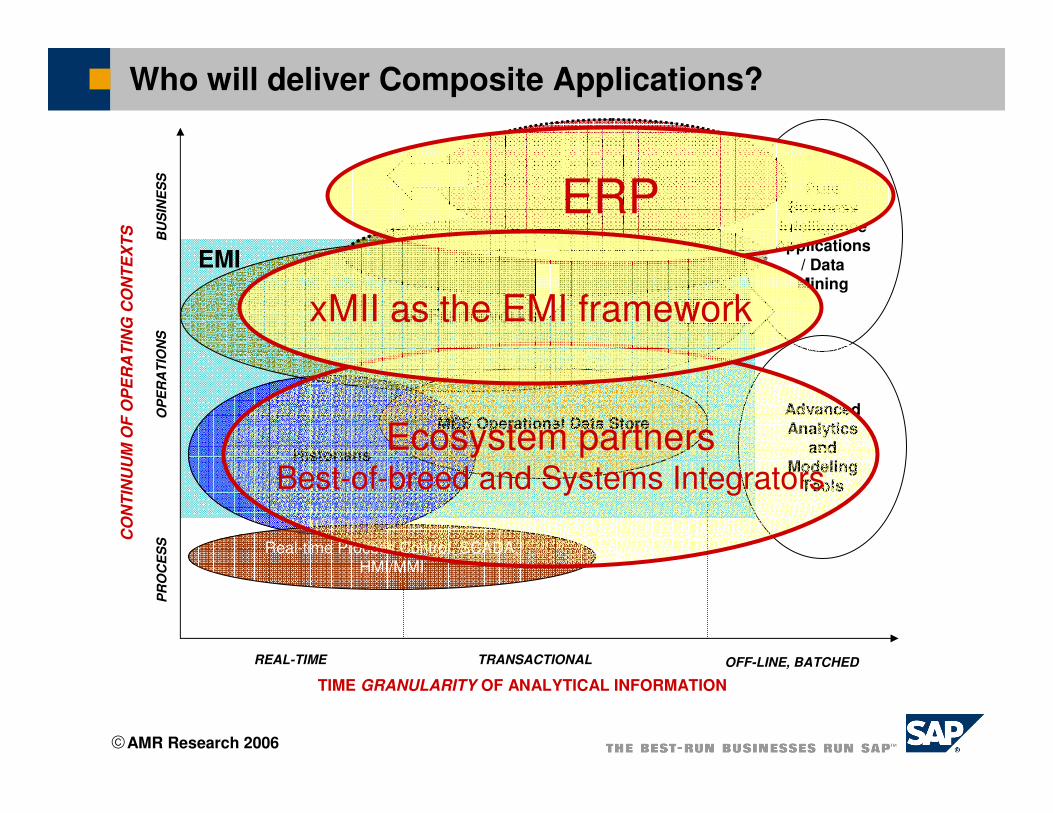
REAL-TIME OFF-LINE, BATCHEDTRANSACTIONAL
Historians
EMI Frameworks
Real-time Process Control, SCADA, HMI/MMI
OP
ER
AT
ION
SP
RO
CE
SS
BU
SIN
ES
S
MES Operational Data Store
Interfaces to ERP/EAM
Pure Business
Intelligence Applications
/ Data Mining
Who will deliver Composite Applications?
Enterprise Resource Planning,
Supply Chain Management, Enterprise Asset Management,
Advanced Planning and
Scheduling
AdvancedAnalytics
and Modeling
Tools
EMI
TIME GRANULARITY OF ANALYTICAL INFORMATION
CO
NT
INU
UM
OF
OP
ER
AT
ING
CO
NT
EX
TS
ERP
Ecosystem partnersBest-of-breed and Systems Integrators
xMII as the EMI framework
AMR Research 2006
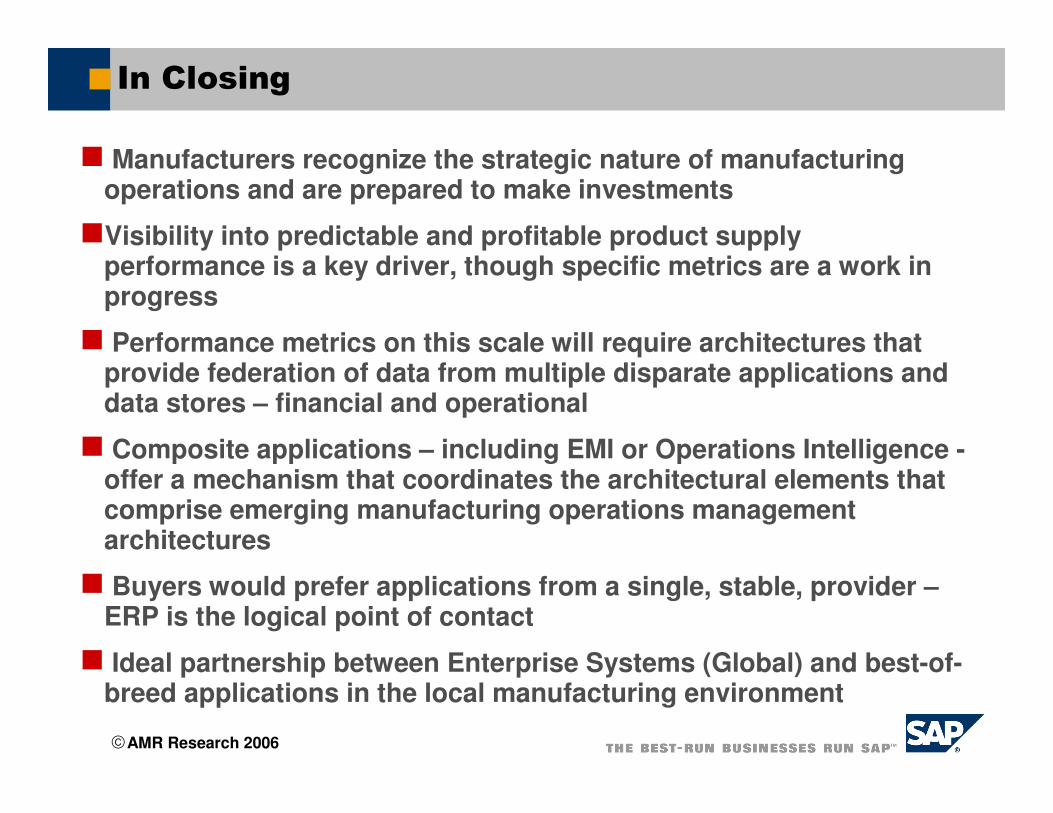
In Closing
� Manufacturers recognize the strategic nature of manufacturing operations and are prepared to make investments
�Visibility into predictable and profitable product supply performance is a key driver, though specific metrics are a work in progress
� Performance metrics on this scale will require architectures that provide federation of data from multiple disparate applications and data stores – financial and operational
� Composite applications – including EMI or Operations Intelligence -offer a mechanism that coordinates the architectural elements that comprise emerging manufacturing operations management architectures
� Buyers would prefer applications from a single, stable, provider –ERP is the logical point of contact
� Ideal partnership between Enterprise Systems (Global) and best-of-breed applications in the local manufacturing environment
AMR Research 2006
Q&A
Thank you for your time today.
Alison J. SmithSr. Analyst – Manufacturing & Production OperationsAMR [email protected]
SAP Adaptive Manufacturing Summit 2006
Colorado Convention Center
Denver, Colorado
September 27-28, 2006