8 february 2018 joint treasury management … · 2018-03-15 · underpins the tmss. 10.3 babergh...
TRANSCRIPT
BABERGH DISTRICT COUNCIL and MID SUFFOLK DISTRICT COUNCIL
From: Cabinet Members for Finance Report Number: MCa/17/41
To: Mid Suffolk Cabinet Babergh Cabinet
Date of meeting: 5 February 2018 8 February 2018
JOINT TREASURY MANAGEMENT STRATEGY 2018/19 1. Purpose of Report
1.1 This report presents the proposed Treasury Management Strategy Statement (which includes the Annual Investment Strategy for managing surplus funds and borrowing strategy). These are in accordance with the CIPFA Treasury Management Code. The Prudential Indicators and Minimum Revenue Provision (MRP) Statement are linked to the Budget report that will be presented to Cabinet and the full Council meetings in February 2018.
1.2 The Code of Practice recommends that the strategy is subject to scrutiny before it is presented to Council, which falls within the remit of the Joint Audit and Standards Committee.
2. Recommendations to both Councils
2.1 That the following be approved:
(a) The Treasury Management Strategy for 2018/19, including the Annual Investment Strategy as set out in Appendix A.
(b) The Treasury Management Policy Statement set out in Appendix B.
(c) The Treasury Management Indicators set out in Appendix E.
(d) The Prudential Indicators and Minimum Revenue Provision Statement set out in Appendices F and G.
2.2 That the key factors and information relating to and affecting treasury management activities set out in Appendices C, D and H be noted.
3. Financial Implications
3.1 As outlined in this report.
4. Legal Implications
4.1 Section 15 of the Local Government Act 2003 obliges the Councils to approve a Treasury Management Strategy.

5. Risk Management
5.1 This report is not directly linked with any of the Councils’ Corporate / Significant Business Risks, but it should be noted that changes in funding requirements, interest rates and other external factors can impact on the Medium Term Financial Strategy and future budgets (Risk 5f – failure of the Councils to become financially sustainable in response to funding changes). Key risks around treasury management, however, are set out below:
6. Consultations
6.1 Regular meetings have taken place with our Treasury advisors, Arlingclose, who also provide important updates on treasury management issues as they arise.
Risk description
Likelihood
Impact
Mitigation measures
If the Councils lose the investment this will impact on their ability to deliver services.
Highly
Unlikely (1)
Bad
(3)
Strict lending criteria for high credit rated institutions.
If the Councils receive a poor return on investments, there will be fewer resources available to deliver services.
Highly Probable (4)
Noticeable (2)
Focus is on security and liquidity, therefore, careful cashflow management in accordance with the Treasury Management Strategy is undertaken throughout the year.
If the Councils have liquidity problems, they will be unable to meet their short-term liabilities.
Unlikely (2) Noticeable (2)
As above.
If the Councils incur higher than expected borrowing costs, there will be fewer resources available to deliver services.
Unlikely (2) Noticeable (2)
Benchmark is to borrow from the Public Works Loan Board whose rates are very low and can be on a fixed or variable basis. Research lowest rates available within borrowing boundaries and use other sources of funding and internal surplus funds temporarily.
7. Equality Analysis
7.1 There are no equality and diversity implications, as the contents and recommendations of this report do not impact on those with protected characteristics.
8. Shared Service / Partnership Implications
8.1 This is a joint report for both Councils on the proposed Treasury Management Strategy for 2018/19, although its application will differ due to the different financial position of each Council.
8.2 The in-house finance team handle both Councils’ treasury management strategy
and operations. 9. Links to Joint Strategic Plan
9.1 Ensuring that the Council has the resources available is what underpins the ability to achieve the priorities set out in the Joint Strategic Plan.
10. Key Information
10.1 The Chartered Institute of Public Finance and Accountancy’s Code of Practice for Treasury Management in Public Services (the CIPFA TM Code) and the Prudential Code require local authorities to determine their Treasury Management Strategy Statement (TMSS) and Prudential Indicators on an annual basis before the start of each financial year. The TMSS also includes the Annual Investment Strategy (AIS).
10.2 The CIPFA Treasury Management and Prudential Codes have been adopted by both Councils. There is also a Treasury Management Policy Statement, which underpins the TMSS.
10.3 Babergh and Mid Suffolk invest surplus funds and both Councils borrow to fund capital investment and manage cash flows. Both Councils are therefore exposed to financial risks including the loss of invested funds and the revenue effect of interest rate changes.
10.4 The identification, monitoring and control of risk are central to the treasury management strategy.
10.5 In addition, treasury activities need to comply with relevant statutes, guidance and accounting standards.
Borrowing and Investments
10.6 The underlying need to borrow for capital purposes is measured by the Capital Financing Requirement (CFR). The CFR, together with usable reserves, is one of the core drivers of both Councils’ treasury management activities.

10.7 Councils are able to borrow funds up to their CFR to finance capital expenditure. Both Councils will not borrow more than or in advance of their needs purely in order to profit from the investment of the extra sums borrowed. These needs are determined by the CFR. Any decision to borrow in advance will be considered carefully to ensure value for money can be demonstrated and that the Councils can ensure the security of such funds.
10.8 The forecast movement in the CFR in coming years is one of the Prudential Indicators. The movement in actual external debt and usable reserves combine to identify the Councils’ borrowing requirement and potential investment strategy in the current and future years.
10.9 As indicated in the tables in Appendix A, paragraph 3.1, Babergh has a maximum borrowing requirement of around £50.44million for 2018/19 rising to £58.88million by 2020/21 to fund the indicative capital programme. Mid Suffolk has a maximum borrowing requirement of around £80.52million for 2018/19 rising to £86.06million by 2020/21 to fund the indicative capital programme.
10.10 The current level of debt and investments for Babergh and Mid Suffolk is set out in Appendix C.
The 2018/19 Strategy
10.11 The Prudential Indicators (to be presented with the Budget and Capital Programme to Cabinet in February 2018) illustrate the affordability and impact of capital expenditure decisions and set out both Councils overall capital and treasury framework.
10.12 Effective management and decisions on funding ensure both Councils comply with the provisions of Section 32 of the Local Government Finance Act 1992 to set a balanced budget. Using borrowing powers to undertake investment in line with the Joint Strategic Plan priority outcomes and generate a rate of return to produce additional income is a key part of the Medium Term Financial Strategy (MTFS) in order to address the funding gaps that both Councils face over the next 4 years.
10.13 Key documents relating to treasury management operations in terms of the annual investment and borrowing strategy proposed for 2018/19 are set out in the supporting appendices. Factors affecting the strategy are detailed in the Treasury Management Strategy for the year (Appendix A), the Treasury Management Policy Statement (Appendix B) and the Economic Outlook (Appendix D).
10.14 The proposed investment strategy for 2018/19 continues to focus primarily on the effective management and control of risk, giving priority to security and liquidity when investing funds. Investment returns remain an important but secondary consideration.
10.15 The minimum proposed investment criteria for UK counterparties in the 2018/19 Strategy remains at A-. (Note: This would be the lowest credit rating determined by credit rating agencies Moody’s, Fitch and Standard & Poors).
10.16 In line with advice received from Arlingclose (the Councils’ treasury advisors) the maximum investment limit per institution is £2m for unsecured specified investments for both Councils. The limit for pooled funds is £5m. Investments with the UK Government (including the Government’s Debt Management Agency Deposit Facility (DMADF) and Treasury Bills (T-Bills)), have no limit on the amount invested.
10.17 A list of the banks and building societies that both Councils can lend to (based on information on credit risk and credit ratings as at November 2017) is provided in Appendix H. This will be continuously monitored as the position changes throughout the year as credit ratings are reviewed and additional market information is evaluated.
10.18 The Councils will continue to:
• Make use of call accounts, if necessary
• Use the strongest/lowest risk non-credit rated building societies
• Use covered bonds (secured against assets) for longer term investments
• Consider longer term investments in property or other funds.
10.19 The period for which a ‘specified’ investment is made will continue to be a key aspect of the investment strategy. The criterion for this is set out in Appendix A. The maximum period of any investment will be on the advice of Arlingclose. Investments in excess of 364 days are classified as ‘non-specified’ investments and will only be undertaken with the prior approval of the S151 Officer.
10.20 In terms of borrowing, consideration will be given to all forms of borrowing/financing in relation to any future capital investment plans. This is most likely to be via the Public Works Loan Board (PWLB) but consideration will also be given to borrowing from other sources such as other local authorities, commercial banks, the European Investment Bank (EIB), money markets, capital markets (stock issues, commercial paper and bills) and leasing.
10.21 In conjunction with advice from Arlingclose, both Councils will keep these sources of finance under review.
10.22 After using surplus internal funds temporarily, the PWLB remains the most likely source of new external long term borrowing whilst short or longer-term borrowing would be from money market institutions and other local authorities. The Councils will receive the “certainty rate” discount of 0.2% on PWLB loans.

10.23 Officers will take advice on the optimum time to undertake additional borrowing and will adopt a flexible approach in consultation with their treasury advisors, after consideration of the following:
Affordability
Maturity profile of existing debt
Interest rate and refinancing risks
Borrowing source.
As clearly highlighted by the Prudential Indicators, the level and ratio of General Fund borrowing costs will increase over the next few years to finance the potential capital programme. The Councils revenue budgets will be reviewed as part of the ongoing budget monitoring process against the Medium Term Financial Strategy.
10.24 The revenue cost of borrowing in 2018/19 and subsequent years in relation to the capital programme will be minimised by borrowing on the most beneficial basis at the most appropriate time of the year, based on advice from our treasury advisors, Arlingclose.
10.25 The General Fund revenue budget for 2018/19 will include provision for interest payments relating to external borrowing and the statutory Minimum Revenue Provision (MRP) to ensure the principal is repaid. Different arrangements apply to the Housing Revenue Account (Council Housing) in that there is no MRP. The strategy and activities are affected by a number of factors, including the regulatory framework, economic conditions, best practice and interest rate/liquidity risk. The attached appendices summarise the regulatory framework, economic background and information on key activities for the year.
10.26 In accordance with the Department for Communities and Local Government (CLG) Guidance, the Councils will be asked to approve a revised Treasury Management Strategy Statement if the assumptions on which this report is based change significantly. Such circumstances would include, for example, a large unexpected change in interest rates, or in the Councils capital programmes or in the level of investment balances.
10.27 This Treasury Management Strategy does not include the proposed changes to the Prudential Code upon which both CIPFA and CLG consulted on in November and December, nor to any possible changes to MRP Guidance. Arlingclose’s advice is to continue to follow existing processes until the new codes and guidance are published.
Appendices
Title Location
A: Treasury Management Strategy Statement 2018/19 Attached
B: Treasury Management Policy Statement Attached
C: Existing Investment and Debt Portfolio Position Attached
D: Economic Outlook and Interest Rate Forecast Attached
E: Treasury Management Indicators Attached
F: Prudential Indicators Attached
G: Annual MRP Statement 2018/19 Attached
H: Institutions meeting high credit ratings criteria
(as at end of November 2017)
Attached
I: Glossary of Terms Attached
Background Documents
CIPFA Treasury Management in the Public Services – 2011
The Prudential Code for Capital Finance in Local Authorities – 2011
Authorship: Name: Katherine Steel Tel: (01449) 724806 Position: Assistant Director – Corporate Resources
E-mail: [email protected]
Name: Melissa Evans Tel: (01473) 296320 Position: Corporate Manager - Financial Services
E-mail: [email protected]
Name: Sue Palmer Tel: (01473) 296313 Position: Senior Financial Services Officer
E-mail: [email protected]
Appendix A Revised TREASURY MANAGEMENT STRATEGY STATEMENT 2018/19
1. Introduction and Background
1.1 The Councils adopted the Chartered Institute of Public Finance and Accountancy’s Treasury Management in the Public Services: Code of Practice 2011 Edition (the CIPFA Code) which requires the Councils to approve a Treasury Management Strategy before the start of each financial year. CIPFA consulted on changes to the Code in 2017, but has yet to publish a revised Code.
1.2 In addition, the Department for Communities and Local Government (CLG) issued revised Guidance on Local Authority Investments in March 2010 that requires the Councils to approve an Investment Strategy before the start of each financial year.
1.3 This report fulfils the Councils legal obligations under the Local Government Act 2003 to have regard to both the CIPFA Code and the CLG Guidance.
1.4 Effective management and decisions on funding ensure the Councils comply with the provisions of Section 32 of the Local Government Finance Act 1992 to set a balanced budget.
1.5 The Councils borrowed and invested substantial sums of money and are therefore exposed to financial risks including the loss of invested funds and the revenue effect of changing interest rates. The successful identification, monitoring and control of risk are therefore central to the Councils treasury management strategy.
1.6 In accordance with the CLG Guidance, the Councils will be asked to approve a revised Treasury Management Strategy Statement should the assumptions on which this report is based change significantly. Such circumstances would include, a large unexpected change in interest rates, changes to the Councils capital programmes or level of their investment balances as well as evolving economic or political events.
2. External Context
Economic background
2.1. The major external influence on the Councils Treasury Management Strategy for 2018/19 will be the UK’s progress in negotiating its exit from the European Union and agreeing future trading arrangements. The domestic economy has remained relatively robust since the surprise outcome of the 2016 referendum, but there are indications that uncertainty over the future is now weighing on growth. Transitional arrangements may prevent a cliff-edge, but will also extend the period of uncertainty for several years. Economic growth is therefore forecast to remain sluggish throughout 2018/19.
2.2 Consumer price inflation reached 3.0% in September 2017 as the post-referendum devaluation of sterling continued to feed through to imports. However, this effect is expected to fall out of year-on-year inflation measures during 2018, removing pressure on the Bank of England to raise interest rates.

Appendix A Revised
2.3 In contrast, the US economy is performing well, and the Federal Reserve is raising interest rates in regular steps to remove some of the emergency monetary stimulus it has provided for the past decade. The European Central Bank is yet to raise rates, but has started to taper its quantitative easing programme, signalling some confidence in the Eurozone economy.
Credit outlook
2.4 High profile bank failures in Italy and Portugal have reinforced concerns over the health of the European banking sector. Sluggish economies and fines for pre-crisis behaviour continue to weigh on bank profits, and any future economic slowdown will exacerbate concerns in this regard.
2.5 Bail-in legislation, which ensures that large investors including local authorities will rescue failing banks instead of taxpayers in the future, has now been fully implemented in the European Union, Switzerland and USA, while Australia and Canada are progressing with their own plans. In addition, the largest UK banks will ringfence their retail banking functions into separate legal entities during 2018. There remains some uncertainty over how these changes will impact upon the credit strength of the residual legal entities.
2.6 The credit risk associated with making unsecured bank deposits has therefore increased relative to the risk of other investment options available to the Councils; returns from cash deposits however remain very low.
Interest rate forecast
2.7 At its meeting on 1 November 2017, the Monetary Policy Committee (MPC) voted by a majority of 7-2 to increase Bank Rate by 0.25% to 0.5%. This was the first increase since August 2016. In the MPC’s central forecast, it implies a gently rising bank rate.
2.8 Longer-term interest rates have risen in the past year, reflecting the possibility of increasing short-term rates. Arlingclose forecasts these to remain broadly constant during 2018/19, but with some volatility as interest rate expectations wax and wane with press reports on the progress of EU exit negotiations.
2.9 A more detailed economic and interest rate forecast provided by Arlingclose is attached at Appendix D.
Appendix A Revised
3. Local Context
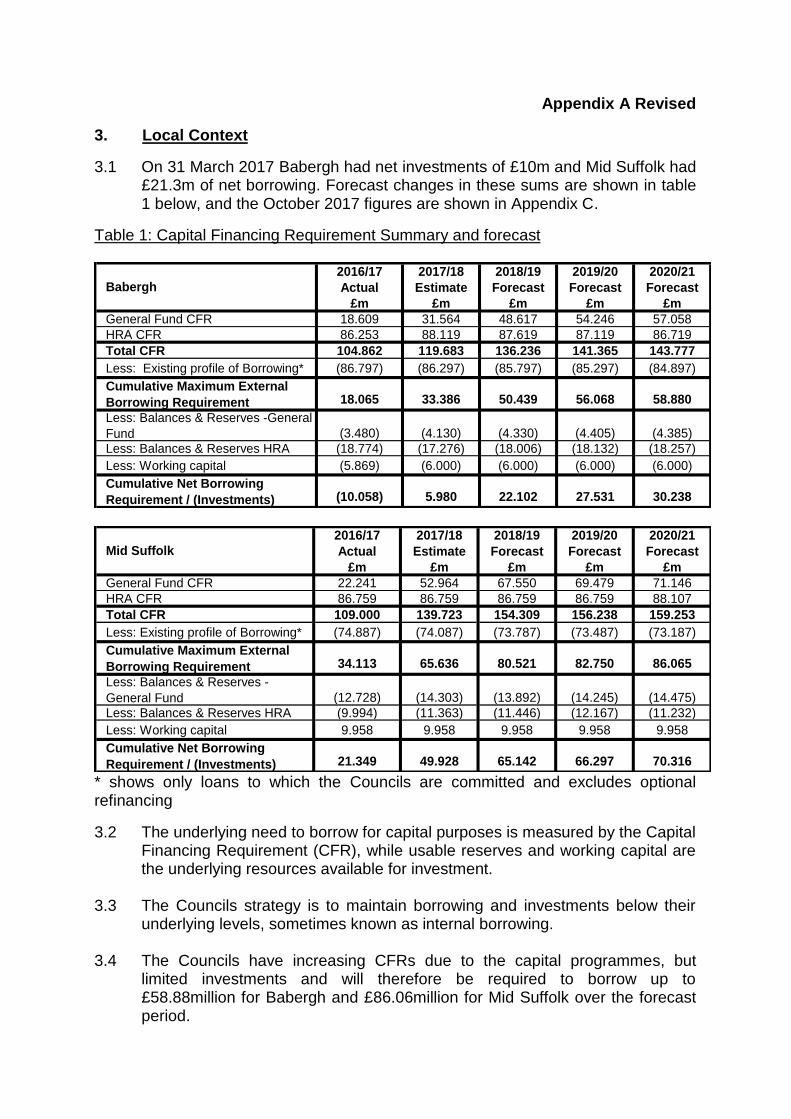
3.1 On 31 March 2017 Babergh had net investments of £10m and Mid Suffolk had £21.3m of net borrowing. Forecast changes in these sums are shown in table 1 below, and the October 2017 figures are shown in Appendix C.
Table 1: Capital Financing Requirement Summary and forecast
2016/17 2017/18 2018/19 2019/20 2020/21
Actual Estimate Forecast Forecast Forecast
£m £m £m £m £m
General Fund CFR 18.609 31.564 48.617 54.246 57.058
HRA CFR 86.253 88.119 87.619 87.119 86.719
Total CFR 104.862 119.683 136.236 141.365 143.777
Less: Existing profile of Borrowing* (86.797) (86.297) (85.797) (85.297) (84.897)
Cumulative Maximum External
Borrowing Requirement 18.065 33.386 50.439 56.068 58.880
Less: Balances & Reserves -General
Fund (3.480) (4.130) (4.330) (4.405) (4.385)
Less: Balances & Reserves HRA (18.774) (17.276) (18.006) (18.132) (18.257)
Less: Working capital (5.869) (6.000) (6.000) (6.000) (6.000)
Cumulative Net Borrowing
Requirement / (Investments) (10.058) 5.980 22.102 27.531 30.238
Babergh
2016/17 2017/18 2018/19 2019/20 2020/21
Actual Estimate Forecast Forecast Forecast
£m £m £m £m £m
General Fund CFR 22.241 52.964 67.550 69.479 71.146
HRA CFR 86.759 86.759 86.759 86.759 88.107
Total CFR 109.000 139.723 154.309 156.238 159.253
Less: Existing profile of Borrowing* (74.887) (74.087) (73.787) (73.487) (73.187)
Cumulative Maximum External
Borrowing Requirement 34.113 65.636 80.521 82.750 86.065
Less: Balances & Reserves -
General Fund (12.728) (14.303) (13.892) (14.245) (14.475)
Less: Balances & Reserves HRA (9.994) (11.363) (11.446) (12.167) (11.232)
Less: Working capital 9.958 9.958 9.958 9.958 9.958
Cumulative Net Borrowing
Requirement / (Investments) 21.349 49.928 65.142 66.297 70.316
Mid Suffolk
* shows only loans to which the Councils are committed and excludes optional refinancing
3.2 The underlying need to borrow for capital purposes is measured by the Capital Financing Requirement (CFR), while usable reserves and working capital are the underlying resources available for investment.
3.3 The Councils strategy is to maintain borrowing and investments below their underlying levels, sometimes known as internal borrowing.
3.4 The Councils have increasing CFRs due to the capital programmes, but
limited investments and will therefore be required to borrow up to £58.88million for Babergh and £86.06million for Mid Suffolk over the forecast period.
Appendix A Revised
3.5 CIPFA’s Prudential Code for Capital Finance in Local Authorities recommends that both Councils’ total debt should be lower than their highest forecast CFR over the next three years. Table 1 shows that the Councils expect to comply with this recommendation during 2018/19.
4. Borrowing Strategy Overview
4.1 At 31 October 2017 Babergh held loans of £86.5million, and Mid Suffolk £88.2million. These have decreased by £6.25million for Babergh and £9.15million for Mid Suffolk on the previous year, as part of the strategy for funding the previous years’ capital programmes. The capital financing requirement forecasts in table 1 (paragraph 3.1 above) show that Babergh expects to borrow up to £17.05million and Mid Suffolk £14.89million in 2018/19. The Councils cannot exceed the Authorised Limit (as shown in Appendix F, paragraph 6.2) for borrowing of £148million for Babergh and £166million for Mid Suffolk.
Objectives
4.2 The chief objective of both Councils when borrowing money is to strike an appropriately low risk balance between securing low interest costs and achieving certainty of those costs over the period for which funds are required. The flexibility to renegotiate loans should the Councils long-term plans change is a secondary objective.
Strategy
4.3. Given the significant cuts to public expenditure and in particular to local government funding, the borrowing strategy of the Councils continues to address the key issue of affordability without compromising the longer-term stability of the debt portfolio. With short-term interest rates currently much lower than long-term rates, it is likely to be more cost effective in the short-term to either use internal resources, or to borrow short-term loans instead. This position will be monitored and evaluated on an ongoing basis to ensure both Councils achieve value for money.
4.4 By doing so, the Councils are able to reduce net borrowing costs (despite foregone investment income) and reduce overall treasury risk. The benefits of internal and short-term borrowing will be monitored regularly against the potential for incurring additional costs by deferring borrowing into future years when long-term borrowing rates are forecast to rise modestly. Arlingclose will assist the Councils with this ‘cost of carry’ (the excess of interest payable on monies borrowed over interest received when the monies are invested) and breakeven analysis. Its output may determine whether the Councils borrow additional sums at long-term fixed rates in 2018/19 with a view to keeping future interest costs low, even if this causes additional cost in the short-term.

Appendix A Revised
4.5 Alternatively, the Councils may arrange forward starting loans during 2018/19, where the interest rate is fixed in advance, but the cash is received in later years. This would enable certainty of cost to be achieved without suffering a cost of carry in the intervening period.
4.6 In addition, the Councils may borrow short-term loans to cover unexpected cash flow shortages.
Sources of borrowing
4.7 The approved sources of long-term and short-term borrowing are:
• Public Works Loan Board (PWLB) and any successor body • any institutions approved for investments (see paragraph 5.5 below) • any other bank or building society authorised to operate in the UK • UK public and private sector pension funds (except Suffolk County Council
Pension Fund) • capital market bond investors • UK Municipal Bonds Agency plc and other special purpose companies
created to enable local authority bond issues
Other sources of debt finance
4.8 In addition, capital finance may be raised by the following methods that are not borrowing, but may be classed as other debt liabilities:
• operating and finance leases • hire purchase • Private Finance Initiative • sale and leaseback
4.9 The Councils have previously raised the majority of their long-term borrowing
from the PWLB, but it continues to investigate other sources of finance, such as local authority loans and bank loans, that may be available at more favourable rates.
Municipal Bonds Agency
4.10 UK Municipal Bonds Agency plc was established in 2014 by the Local Government Association as an alternative to the PWLB. It plans to issue bonds on the capital markets and lend the proceeds to local authorities. This will be a more complicated source of finance than the PWLB for two reasons:
borrowing authorities will be required to provide bond investors with a joint and several guarantee to refund their investment in the event that the agency is unable to for any reason;
there will be a lead time of several months between committing to borrow and knowing the interest rate payable. Any decision to borrow from the Agency will therefore be the subject of a separate report to full Council.

Appendix A Revised
LOBOs
4.11 Mid Suffolk holds £4m of LOBO (Lender’s Option Borrower’s Option) loans where the lender has the option to propose an increase in the interest rate at set dates, following which the Council has the option to either accept the new rate or to repay the loan at no additional cost. £4m of these LOBOS have options during 2018/19, and although the Council understands that lenders are unlikely to exercise their options in the current low interest rate environment, there remains an element of refinancing risk. Mid Suffolk will take the option to repay LOBO loans at no cost if it has opportunity to do so. Total borrowing via LOBO loans will be limited to £4m.
Short-term and variable rate loans
4.12 These loans leave the Councils exposed to the risk of short-term interest rate rises and are therefore subject to the limit on the net exposure to variable interest rates in the treasury management indicators as shown in Appendix E, paragraph 2.1.
Debt rescheduling
4.13 The PWLB allows councils to repay loans before maturity and either pay a premium or receive a discount according to a set formula based on current interest rates. Other lenders may also be prepared to negotiate premature redemption terms. The Councils may take advantage of this and replace some loans with new loans, or repay loans without replacement, where this is expected to lead to an overall cost saving or a reduction in risk.
4.14 Borrowing and any rescheduling activity will be reported to the Joint Audit &
Standards Committee as part of the mid-year and annual treasury management reports.
5. Annual Investment Strategy
5.1 The Councils hold significant invested funds, representing income received in advance of expenditure plus balances and reserves held. In the past twelve months, Babergh’s investment balances have ranged between £12.46m and £22.01m and those of Mid Suffolk between £8.37m and £22.56m, similar levels are expected to be maintained in the forthcoming year.
Objectives
5.2 Both the CIPFA Code and the CLG Guidance require the Councils to invest their funds prudently, and to have regard to the security and liquidity of their investments before seeking the highest rate of return, or yield. The Councils objectives when investing money is to strike an appropriate balance between risk and return, minimising the risk of incurring losses from defaults and the risk of receiving unsuitably low investment income. Where balances are expected to be invested for more than one year, both Councils will aim to achieve a total return that is equal or higher than the prevailing rate of inflation, in order to maintain the spending power of the sum invested.

Appendix A Revised
Negative interest rates
5.3 If the UK enters into a recession in 2018/19, there is a small chance that the Bank of England could set its Bank Rate at or below zero, which is likely to feed through to negative interest rates on all low risk, short-term investment options. This situation already exists in many other European countries. In this event, security will be measured as receiving the contractually agreed amount at maturity, even though this may be less than the amount originally invested.
Strategy
5.4 Given the increasing risk and very low returns from short-term unsecured bank investments, both Councils have diversified into higher yielding asset classes during 2017/18. This diversification will represent a continuation of the new strategy adopted in 2015/16.
Approved counterparties
5.5 The Councils may invest their surplus funds with any of the counterparty types in table 2 below, subject to the cash limits (per counterparty) and the time limits shown. The differing cash limits result in a similar spread of risk across the different counterparty types.
Table 2: Approved investment counterparties and limits for Babergh and Mid Suffolk
Credit Rating
Banks Unsecured
Banks Secured
Government Corporates Registered Providers
UK Govt n/a n/a £ Unlimited 50 years
n/a n/a
AAA £2m 5 years
£2m 20 years
£2m 50 years
£1m 20 years
£1m 20 years
AA+ £2m 5 years
£2m 10 years
£2m 25 years
£1m 10 years
£1m 10 years
AA £2 m 4 years
£2m 5 years
£2m 15 years
£1m 5 years
£1m 10 years
AA- £2m 3 years
£2m 4 years
£2m 10 years
£1m 4 years
£1m 10 years
A+ £2m 2 years
£2m 3 years
£2m 5 years
£1m 3 years
£1m 5 years
A £2 m 13 months
£2m 2 years
£2m 5 years
£1 m 2 years
£1m 5 years
A- £2m 6 months
£2m 13
months
£2m 5 years
£1m 13 months
£1m 5 years
None £1m 6 months
n/a £1m 25 years
£50,000 5 years
£1m 5 years
Pooled funds
£5m per fund
This table should be read in conjunction with the following notes:
Appendix A Revised
Credit rating
5.6 Investment limits are set by reference to the lowest published long-term credit rating from Fitch, Moody’s or Standard & Poor’s. Where available, the credit rating relevant to the specific investment or class of investment is used, otherwise the counterparty credit rating is used. However, investment decisions are never made solely based on credit ratings, and all other relevant factors including external advice will be taken into account.
Banks unsecured
5.7 Accounts, deposits, certificates of deposit and senior unsecured bonds with banks and building societies, other than multilateral development banks. These investments are subject to the risk of credit loss via a bail-in should the regulator determine that the bank is failing or likely to fail. See below for arrangements relating to operational bank accounts.
Banks secured
5.8 Covered bonds, reverse repurchase agreements and other collateralised arrangements with banks and building societies. These investments are secured on the bank’s assets, which limits the potential losses in the unlikely event of insolvency, and means that they are exempt from bail-in. Where there is no investment specific credit rating, but the collateral upon which the investment is secured has a credit rating, the higher of the collateral credit rating and the counterparty credit rating will be used to determine cash and time limits. The combined secured and unsecured investments in any one bank will not exceed the cash limit for secured investments.
Government
5.9 Loans, bonds and bills issued or guaranteed by national governments, regional and local authorities and multilateral development banks. These investments are not subject to bail-in, and there is an insignificant risk of insolvency. Investments with the UK Central Government may be made in unlimited amounts for up to 50 years.
Corporates
5.10 Loans, bonds and commercial paper issued by companies other than banks and registered providers. These investments are not subject to bail-in, but are exposed to the risk of the company going insolvent. Loans to unrated companies will only be made either following an external credit assessment or to a maximum of £50,000 per company as part of a diversified pool in order to spread the risk widely.

Appendix A Revised
Registered providers
5.11 Loans and bonds issued by, guaranteed by or secured on the assets of Registered Providers of Social Housing, formerly known as Housing Associations. These bodies are tightly regulated by the Homes and Communities Agency and, as providers of public services, they retain the likelihood of receiving government support if needed.
Pooled funds
5.12 Shares in diversified investment vehicles consisting of any of the above investment types, plus equity shares and property. These funds have the advantage of providing wide diversification of investment risks, coupled with the services of a professional fund manager in return for a fee. Short-term Money Market Funds that offer same-day liquidity and very low or no volatility will be used as an alternative to instant access bank accounts, while pooled funds whose value changes with market prices and/or have a notice period will be used for longer investment periods.
5.13 Bond, equity and property funds offer enhanced returns over the longer term, but are more volatile in the short term. These allow councils to diversify into asset classes other than cash without the need to own and manage the underlying investments. Because these funds have no defined maturity date, but are available for withdrawal after a notice period, their performance and continued suitability in meeting both Councils’ investment objectives will be monitored regularly.
5.14 If the risks or returns of pooled funds change significantly enough over a period of time that they no longer meet the Councils’ objectives, then funds will be withdrawn at the earliest opportunity. No new or re-investments will be made into those funds and alternatives will be considered. This will be applied to Funding Circle in 2018/19.
Operational bank accounts
5.15 The Councils may incur operational exposures, for example through current accounts, collection accounts and merchant acquiring services, to any UK bank with credit ratings no lower than BBB- and with assets greater than £25 billion. These are not classed as investments, but are still subject to the risk of a bank bail-in, and balances will therefore be kept below £2 million per bank. The Bank of England has stated that in the event of failure, banks with assets greater than £25 billion are more likely to be bailed-in than made insolvent, increasing the chance of the Councils maintaining operational continuity.
Risk assessment and credit ratings
5.16 Credit ratings are obtained and monitored by the Councils’ treasury advisors, who will notify changes in ratings as they occur. Where an entity has its credit rating downgraded so that it fails to meet the approved investment criteria then:

Appendix A Revised
no new investments will be made,
any existing investments that can be recalled or sold at no cost will be, and
full consideration will be given to the recall or sale of all other existing investments with the affected counterparty.
5.17 Where a credit rating agency announces that a credit rating is on review for possible downgrade (also known as “rating watch negative” or “credit watch negative”) so that it may fall below the approved rating criteria, then only investments that can be withdrawn on the next working day will be made with that organisation until the outcome of the review is announced. This policy will not apply to negative outlooks, which indicate a long-term direction of travel rather than an imminent change of rating.
See the table in Appendix H for an explanation of the credit ratings issued by the main credit ratings agencies.
Other information on the security of investments
5.18 The Councils understand that credit ratings are good, but not perfect, predictors of investment default. Full regard will therefore be given to other available information on the credit quality of the organisations in which they invest, including credit default swap prices, financial statements, information on potential government support and reports in the quality financial press. No investments will be made with an organisation if there are substantive doubts about its credit quality, even though it may meet the credit rating criteria.
5.19 When deteriorating financial market conditions affect the creditworthiness of all organisations, as happened in 2008 and 2011, this is not generally reflected in credit ratings, but can be seen in other market measures. In these circumstances, the Councils will restrict their investments to those organisations of higher credit quality and reduce the maximum duration of their investments to maintain the required level of security. The extent of these restrictions will be in line with prevailing financial market conditions.
5.20 If these restrictions mean that insufficient commercial organisations of high credit quality are available to invest the Councils’ cash balances, then the surplus will be deposited with the UK Government, via the Debt Management Office (DMADF) or invested in government treasury bills (T-Bills) for example, or with other local authorities. This will cause a reduction in the level of investment income earned, but will protect the principal sum invested.
Specified investments
5.21 The CLG Guidance defines specified investments as those:
• denominated in pound sterling, • due to be repaid within 12 months of arrangement, • not defined as capital expenditure by legislation, and • invested with one of:
o the UK Government, o a UK local authority, parish council or community council, or o a body or investment scheme of “high credit quality”.
Appendix A Revised
Both Councils define “high credit quality” organisations and securities as those having a credit rating of A- or A3 for UK banks and building societies, or a foreign country with a sovereign rating of AA+ or higher. For money market funds and other pooled funds “high credit quality” is defined as those having a credit rating of A- or higher.
Non-specified investments
5.22 Any investment not meeting the definition of a specified investment is classed as non-specified. The Councils do not intend to make any investments:
• denominated in foreign currencies, or • defined as capital expenditure
5.23 Non-specified investments will therefore be limited to long-term investments,
(those that are due to mature 12 months or longer from the date of arrangement), which are considered less liquid as the cash is not quickly realisable, to investments in unrated building societies, and investments with bodies and schemes not meeting the definition on high credit quality.
5.24 Investments of 12 months or over (longer than 364 days) are subject to the prior approval of the S151 officer.
5.25 Any institution can be suspended or removed from the list should any of the factors identified above give rise to concern. The institutions that currently meet the criteria for term deposits, Certificates of Deposit (CDs) and call accounts are shown in Appendix H.
5.26 It remains the Councils’ policies to make exceptions to counterparty policy established around credit ratings, but this is conditional and directional. Therefore, an institution that meets the criteria may be suspended, but institutions not meeting criteria will not be added.
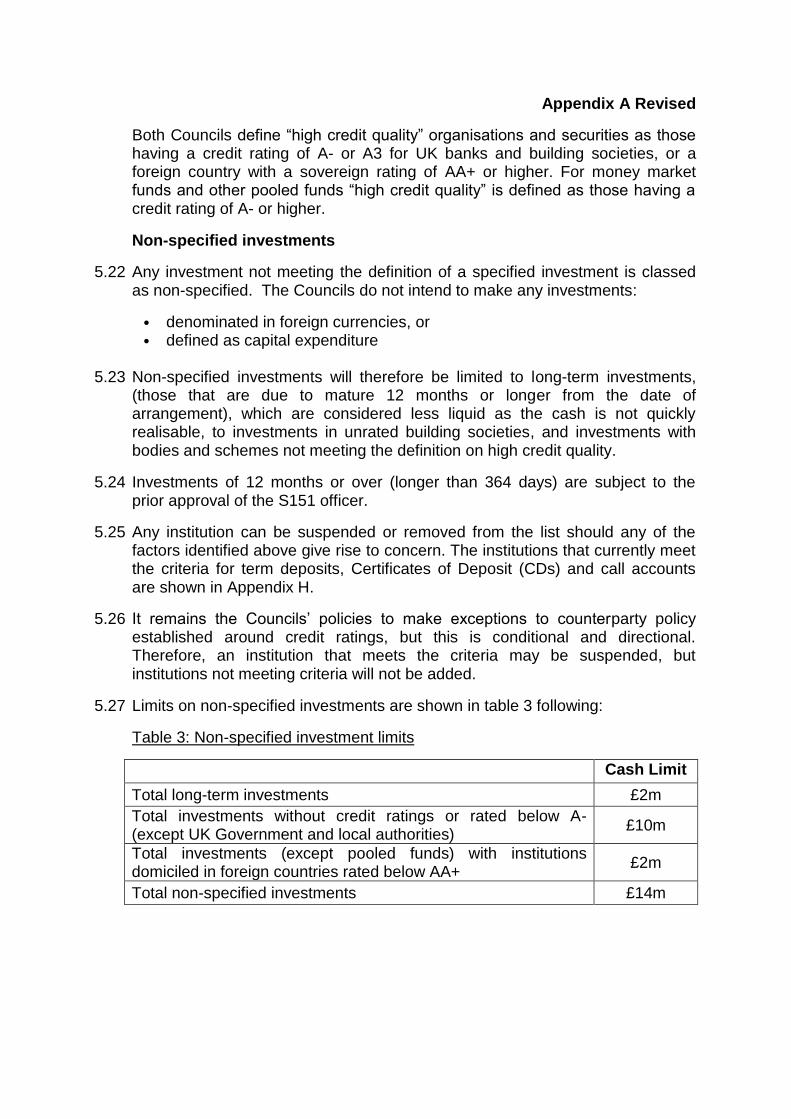
5.27 Limits on non-specified investments are shown in table 3 following:
Table 3: Non-specified investment limits
Cash Limit
Total long-term investments £2m
Total investments without credit ratings or rated below A- (except UK Government and local authorities)
£10m
Total investments (except pooled funds) with institutions domiciled in foreign countries rated below AA+
£2m
Total non-specified investments £14m

Appendix A Revised
The Councils Banker
5.28 Both Councils bank with Lloyds Bank plc which currently has a credit rating of A+.
Investment limits
5.29 The Councils’ revenue reserves available to cover investment losses are forecast to be £3.4million for Babergh and £14.3million for Mid Suffolk on 31 March 2018. In order to minimise the available reserves that would be put at risk in the case of a single default, the maximum that will be lent to any one organisation (other than the UK Government) will be £5m. A group of banks under the same ownership will be treated as a single organisation for limit purposes. Limits will also be placed on fund managers, investments in brokers’ nominee accounts, foreign countries and industry sectors as stated in table 4 following. Investments in pooled funds and multilateral development banks do not count against the limit for any single foreign country, since the risk is diversified over many countries.
Table 4: Investment limits for Babergh and Mid Suffolk
Investment Limits
Babergh Mid Suffolk
Any single organisation, except the UK Central Government
£2m each £2m each
UK Central Government Unlimited Unlimited
Any group of organisations under the same ownership
£1m per group £1m per group
Any group of pooled funds under the same management
£5m per manager £5m per manager
Negotiable instruments held in a broker’s nominee account
£10m per broker £10m per broker
Foreign countries £2m per country £2m per country
Registered Providers £5m in total £5m in total
Unsecured investments with building societies
£2m in total £2m in total
Loans to unrated corporates £1m in total £1m in total
Money Market Funds 50% total
Investments 50% total
Investments
Appendix A Revised
Liquidity management
5.30 The Councils use cash flow forecasts to determine the maximum period for which funds may prudently be committed. The forecasts are compiled on a prudent basis to minimise the risk of the Councils being forced to borrow on unfavourable terms to meet their financial commitments. Limits on long-term investments are set by reference to the Councils Medium Term Financial Strategy and cash flow forecasts.
6. Non-Treasury Investments
6.1 Although not classed as treasury management activities and therefore not covered by the CIPFA Code or the CLG Guidance, the Councils may also purchase property for investment purposes and may also make loans and investments for service purposes, for example as equity investments and loans to the Councils’ subsidiaries.
6.2 Such loans and investments will be subject to the Councils’ normal approval processes for revenue and capital expenditure.
6.3 The Councils existing non-treasury investments are listed in Appendix C.
7. Other Items
There are a number of additional items that the Councils are obliged by CIPFA or CLG to include in their Treasury Management Strategy.
Policy on the use of financial derivatives
7.1 Some local authorities have previously made use of financial derivatives embedded into loans and investments both to reduce interest rate risk (e.g. interest rate collars and forward deals) and to reduce costs or increase income at the expense of greater risk (e.g. LOBO loans and callable deposits). The general power of competence in Section 1 of the Localism Act 2011 removes much of the uncertainty over local authorities’ use of standalone financial derivatives (i.e. those that are not embedded into a loan or investment).
7.2 The Councils will only use standalone financial derivatives (such as swaps, forwards, futures and options) where they can be clearly demonstrated to reduce the overall level of the financial risks that the Councils are exposed to. Additional risks presented, such as credit exposure to derivative counterparties, will be taken into account when determining the overall level of risk. Embedded derivatives, including those present in pooled funds and forward starting transactions, will not be subject to this policy, although the risks they present will be managed in line with the overall treasury risk management strategy.
7.3 Financial derivative transactions may be arranged with any organisation that meets the approved investment criteria (See Appendix H). The current value of any amount due from a derivative counterparty will count against the counterparty credit limit and the relevant foreign country limit.
Appendix A Revised
7.4 The Councils will only use derivatives after seeking advice from their treasury advisors, a legal opinion and ensuring officers have the appropriate training for their use.
Policy on apportioning interest to the HRA
7.5 On 1st April 2012, the Councils notionally split each of their existing long-term loans into General Fund and HRA pools. In the future, new long-term loans borrowed will be assigned in their entirety to one pool or the other. Interest payable and other costs/income arising from long-term loans (e.g. premiums and discounts on early redemption) will be charged / credited to the respective revenue account.
7.6 Differences between the value of the HRA loans pool and the HRA’s underlying need to borrow (adjusted for HRA balance sheet resources available for investment) will result in a notional cash balance which may be positive or negative. This balance will be measured annually, and interest transferred between the General Fund and HRA at each Councils average interest rate on investments, adjusted for credit risk.
Investment training
7.7 The needs of the Councils treasury management staff for training in investment management are assessed regularly as part of the staff appraisal process, and additionally when the responsibilities of individual members of staff change.
7.8 Staff regularly attend training courses, seminars and conferences provided by Arlingclose and CIPFA and other appropriate organisations.
Investment advisors
7.9 The Councils appointed Arlingclose Limited as treasury management advisors and receive specific advice and support on
investment,
debt management
capital finance issues
counterparty creditworthiness (credit ratings)
economic updates and
interest rates.
7.10 The treasury management advisory service is subject to regular review to ensure compliance with the requirements of the Treasury Management Strategy and the Treasury Management Practices (TMP’s) Use of External Service Providers.
7.11 The Councils maintain the quality of the service with their advisors by holding
regular meetings. Whilst the advisors provide support to the treasury function, under current market rules and the CIPFA Code of Practice, the final decision on treasury matters remains with the Councils.

Appendix A Revised
7.12 The Councils have regard to the requirements of the Bribery Act 2011 in their dealings with external advisors.
Investment of money borrowed in advance of need
7.13 The Councils may, from time to time, borrow in advance of need, where this is expected to provide the best long-term value for money. Since amounts borrowed will be invested until spent, the Councils are aware that they will be exposed to the risk of loss of the borrowed sums, and the risk that investment and borrowing interest rates may change in the intervening period. These risks will be managed as part of the Councils overall management of treasury risks.
7.14 The total amount borrowed will not exceed the authorised borrowing limit of £148million for Babergh and £166million for Mid Suffolk in 2018/19. (See Appendix F, paragraph 6.2). The maximum period between borrowing and expenditure is expected to be two years, although the Councils are not required to link particular loans with particular items of expenditure.
Financial Implications
7.15 The budget for investment income in 2018/19 is £1.5million for Babergh and £2.1million for Mid Suffolk, based on an average investment portfolio of £40.6million for Babergh and £57.2million for Mid Suffolk at an average interest rate of 3.7% for each Council.
7.16 The budget for debt interest paid in 2018/19 is £3.44million for Babergh and £3.82million for Mid Suffolk, based on an average debt portfolio of £119.8million for Babergh and £132.3million for Mid Suffolk at an average interest rate of 3% for each Council.
7.17 If actual levels of investments and borrowing, and actual interest rates differ from those forecast, performance against budget will be correspondingly different.
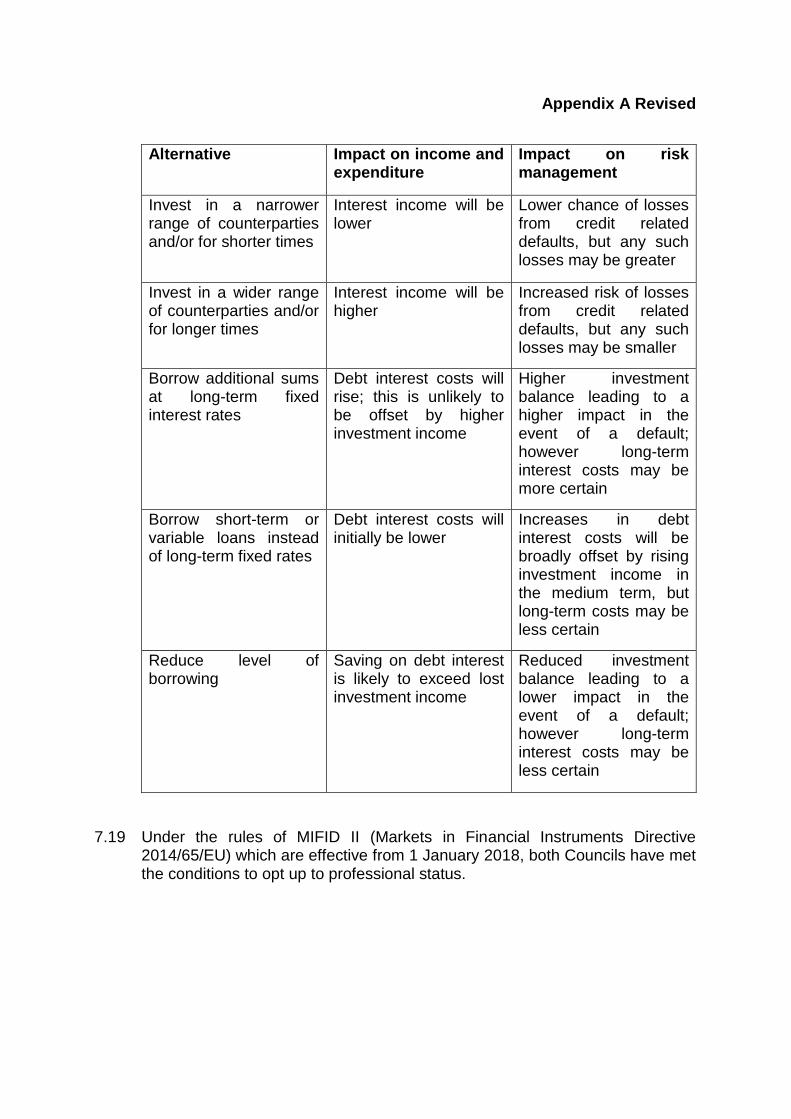
Other Options Considered
7.18 The CLG Guidance and the CIPFA Code do not prescribe any particular treasury management strategy for local authorities to adopt. The S151 Officer, believes that the above strategy represents an appropriate balance between risk management and cost effectiveness. Some alternative strategies, with their financial and risk management implications, are listed in the following table:
Appendix A Revised
Alternative Impact on income and expenditure
Impact on risk management
Invest in a narrower range of counterparties and/or for shorter times
Interest income will be lower
Lower chance of losses from credit related defaults, but any such losses may be greater
Invest in a wider range of counterparties and/or for longer times
Interest income will be higher
Increased risk of losses from credit related defaults, but any such losses may be smaller
Borrow additional sums at long-term fixed interest rates
Debt interest costs will rise; this is unlikely to be offset by higher investment income
Higher investment balance leading to a higher impact in the event of a default; however long-term interest costs may be more certain
Borrow short-term or variable loans instead of long-term fixed rates
Debt interest costs will initially be lower
Increases in debt interest costs will be broadly offset by rising investment income in the medium term, but long-term costs may be less certain
Reduce level of borrowing
Saving on debt interest is likely to exceed lost investment income
Reduced investment balance leading to a lower impact in the event of a default; however long-term interest costs may be less certain
7.19 Under the rules of MIFID II (Markets in Financial Instruments Directive 2014/65/EU) which are effective from 1 January 2018, both Councils have met the conditions to opt up to professional status.
Appendix B
TREASURY MANAGEMENT POLICY STATEMENT 1. Introduction and Background 1.1 The Councils adopt the key recommendations of the CIPFA Code of Practice
on Treasury Management in Public Services 2011 Edition (the Code) as described in Section 5 of the Code.
1.2 In addition, the Department for Communities and Local Government (CLG) issued revised guidance on Local Authority Investments in March 2010 that requires councils to approve an investment strategy before the start of each financial year.
1.3 Accordingly, the Councils will create and maintain the following as the cornerstones for effective treasury management:
• A treasury management policy statement, stating the policies, objectives
and approach to risk management of its treasury management activities. • Suitable treasury management practices (TMPs), setting out the manner in
which the Councils will seek to achieve those policies and objectives, and prescribing how they will manage and control those activities.
1.4 The full Council meeting for Babergh and Mid Suffolk will receive
recommendations from Cabinet on their treasury management policies, practices and activities including, as a minimum, an annual strategy and plan in advance of the year, a mid-year review and an annual report after its close.
1.5 The Councils delegate responsibility for the implementation of its treasury management policies and practices to the Cabinet, monitoring to the Joint Audit and Standards Committee and the execution and administration of treasury management decisions to the Section 151 Officer and/or Corporate Manager - Financial Services, who will act in accordance with the Councils policy statement, the TMPs and CIPFA’s Standard of Professional Practice on Treasury Management.
1.6 The Joint Audit and Standards Committee is responsible for ensuring effective scrutiny of the treasury management strategy and policies.
2. Policies and Objectives of Treasury Management Activities
2.1 The Councils define their treasury management activities in line with the
CIPFA code definition as: “the management of the organisation’s investments and cash flows, it’s banking, money market and capital market transactions; the effective control of the risks associated with those activities; and the pursuit of optimum performance associated with those risks.”

Appendix B
2.2 The Councils regard the successful identification, monitoring and control of risk to be the prime criteria by which the effectiveness of its treasury management activities will be measured. Accordingly, the analysis and reporting of treasury management activities will focus on the risk implications for the Councils.
2.3 The Councils recognise that effective treasury management will provide support towards the achievement of their business and service objectives. They are therefore committed to the principles of achieving value for money in treasury management, and to employing suitable performance measurement techniques within the context of effective risk management.
2.4 Both Councils borrowing will be affordable, sustainable and prudent and consideration will be given to the management of interest rate risk and refinancing risk. The source from which the borrowing is taken and the type of borrowing should allow the Councils transparency and control over their debt.
2.5 Both Councils primary objectives in relation to investments remain the security
of capital. The liquidity or accessibility of the Councils investments followed by the yield earned on investments remain important but are secondary considerations.

Appendix C Revised
EXISTING INVESTMENT & DEBT PORTFOLIO POSITION
31.10.17
Babergh Actual Average
Portfolio Rate
£m %
External Borrowing
Public Works Loan Board 86.547 3.00%
Total External borrowing 86.547 3.00%
Treasury Investments
Banks & Building Societies 1.262 0.14%
Money Market Funds 6.500 0.17%
Other Pooled Funds 9.638 5.91%
Total Treasury Investments 17.400 3.28%
Net Debt 69.147
Non-treasury Investments:
Investment property 3.560
Loans to subsidiaries 0.030
Total Non-treasury Investments 3.590
Total Investments 20.990
Banks & Building Societies
7%
Money Market Funds
37%
Other Pooled Funds56%
Babergh Treasury Investment
Portfolio at 31 October 2017

Appendix C Revised
31.10.17
Mid Suffolk Actual Average
Portfolio Rate
£m %
External Borrowing
Public Works Loan Board 70.237 4.15%
Local Authorities 14.000 0.31%
LOBO loans from banks 4.000 4.21%
Total external borrowing 88.237 3.03%
Treasury Investments
Banks & Building Societies 0.785 0.12%
Money Market Funds 5.000 0.21%
Other Pooled Funds 9.642 5.96%
Total Treasury Investments 15.427 3.32%
Net Debt 72.810
Non-treasury Investments:
Loans to subsidiaries 0.030
Total Non-treasury Investments 0.030
Total Investments 15.457
Public Works Loan Board
80%
Local Authorities
16%
LOBO loans from banks
4%
Mid Suffolk External Borrowing
Portfolio at 31 October 2017

Appendix C Revised
Banks & Building Societies
5%
Money Market Funds
32%
Other Pooled Funds63%
Mid Suffolk Treasury Investment
Portfolio at 31 October 2017

Appendix D
ECONOMIC & INTEREST RATE FORECAST
1 Underlying assumptions 1.1 In a 7-2 vote at its meeting in November, the MPC increased Bank Rate in line
with market expectations to 0.5%. Dovish accompanying rhetoric prompted investors to lower the expected future path for interest rates. The minutes re-emphasised that any prospective increases in Bank Rate would be expected to be at a gradual pace and to a limited extent.
1.2 Further potential movement in Bank Rate is reliant on economic data and the likely outcome of the EU negotiations. Policymakers have downwardly assessed the supply capacity of the UK economy, suggesting inflationary growth is more likely. However, the MPC will be wary of raising rates much further amid low business and household confidence.
1.3 The UK economy faces a challenging outlook as the minority government continues to negotiate the country's exit from the European Union. While recent economic data has improved, it has done so from a low base: UK Quarter 3 2017 GDP growth was 0.4%, after a 0.3% expansion in Quarter 2. The initial expenditure breakdown showed weakness in consumption, business investment and net trade. Both consumer and business confidence remain subdued.
1.4 Household consumption growth, the driver of recent UK GDP growth, has softened following a contraction in real wages, despite both saving rates and credit consumer volumes indicating that some households continue to spend in the absence of wage growth. Policymakers have expressed concern about the continued expansion of consumer credit; any action taken will further dampen household spending.
1.5 Some data has held up better than expected, with unemployment continuing to decline and house prices remaining relatively resilient. However, both factors can also be seen in a negative light, displaying the structural lack of investment in the UK economy post financial crisis. Weaker long-term growth may prompt deterioration in the UK’s fiscal position.
1.6 The depreciation in sterling may assist the economy to rebalance away from spending. Export volumes will increase, helped by a stronger Eurozone economic expansion.
1.7 Near-term global growth prospects have continued to improve and broaden, and expectations of inflation are subdued. Central banks are moving to reduce the level of monetary stimulus.
1.8 Geo-political risks remain elevated and helps to anchor safe-haven flows into the UK government bond (gilt) market.
Appendix D
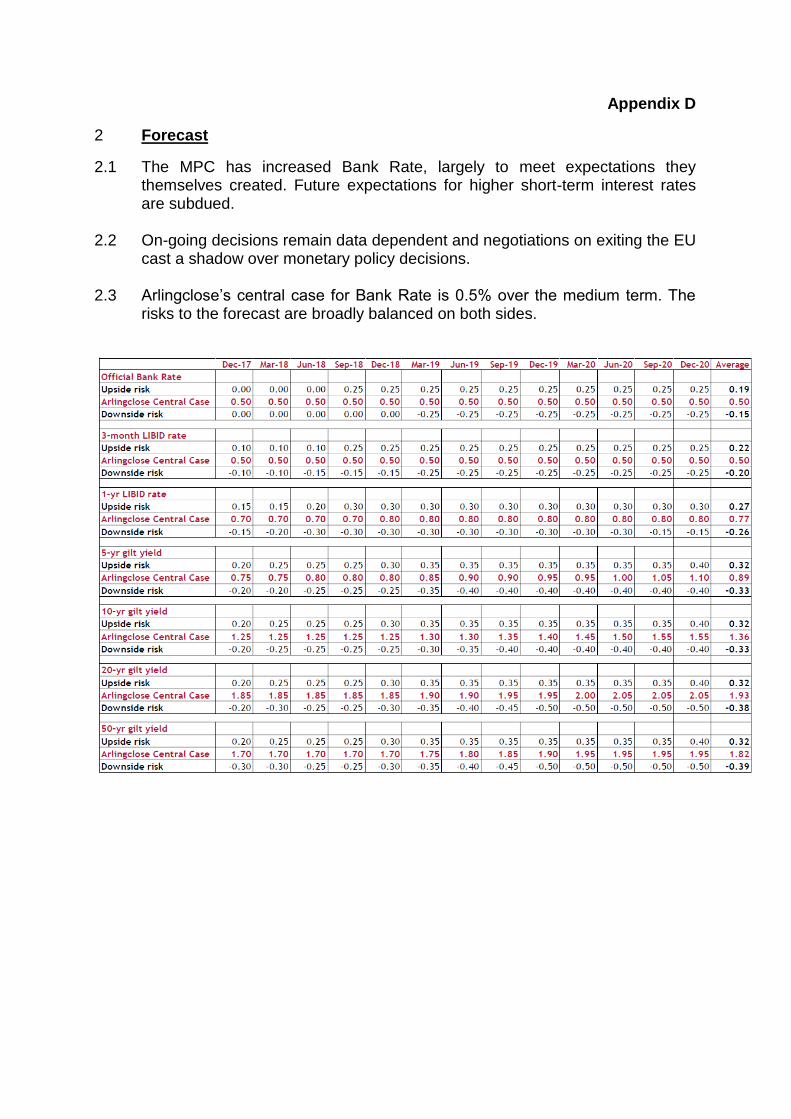
2 Forecast
2.1 The MPC has increased Bank Rate, largely to meet expectations they themselves created. Future expectations for higher short-term interest rates are subdued.
2.2 On-going decisions remain data dependent and negotiations on exiting the EU cast a shadow over monetary policy decisions.
2.3 Arlingclose’s central case for Bank Rate is 0.5% over the medium term. The risks to the forecast are broadly balanced on both sides.

Appendix E Revised
TREASURY MANAGEMENT INDICATORS
The Councils measure and manage their exposure to treasury management risks using the following indicators:
1. Security
1.1 The Councils have adopted a voluntary measure of their exposure to credit risk by monitoring the value-weighted average credit score of their investment portfolios. This is calculated by applying a score to each investment (AAA=1, AA+=2, etc.) and taking the arithmetic average, weighted by the size of each investment. Unrated investments are assigned a score based on their perceived risk.
Target
Portfolio average credit score 7.0
2. Interest rate exposures
2.1 This indicator is set to control the Councils exposure to interest rate risk. The upper limits on fixed and variable rate interest rate exposures, expressed as a proportion of net principal borrowed is shown in the following tables:
2018/19 2019/20 2020/21
Forecast Forecast Forecast
£m £m £m
Upper limit on fixed interest rate
exposure136 141 144
Upper limit on variable interest rate
exposure35 35 35
Babergh
2018/19 2019/20 2020/21
Forecast Forecast Forecast
£m £m £m
Upper limit on fixed interest rate
exposure154 156 159
Upper limit on variable interest rate
exposure40 40 40
Mid Suffolk
2.2 Fixed rate investments and borrowings are those where the rate of interest is fixed for at least 12 months, measured from the start of the financial year, or the transaction date, if later. All other instruments are classed as variable rate.
Appendix E Revised
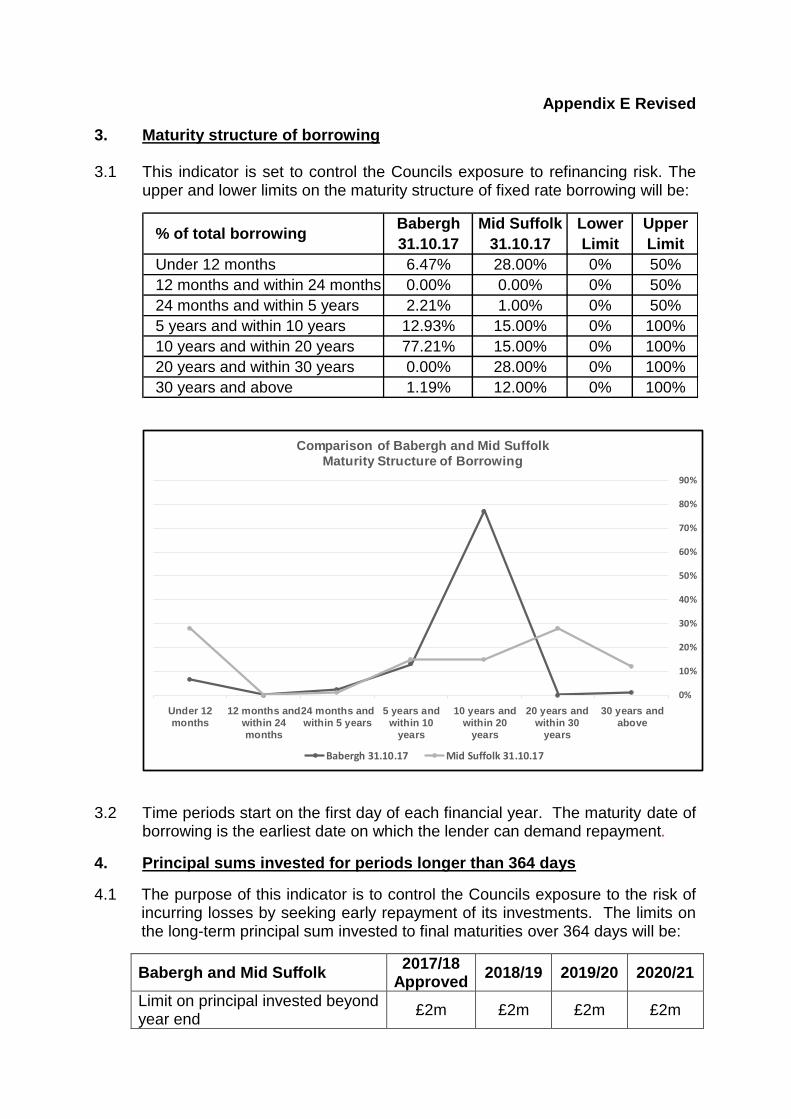
3. Maturity structure of borrowing
3.1 This indicator is set to control the Councils exposure to refinancing risk. The upper and lower limits on the maturity structure of fixed rate borrowing will be:
Babergh Mid Suffolk Lower Upper
31.10.17 31.10.17 Limit Limit
Under 12 months 6.47% 28.00% 0% 50%
12 months and within 24 months 0.00% 0.00% 0% 50%
24 months and within 5 years 2.21% 1.00% 0% 50%
5 years and within 10 years 12.93% 15.00% 0% 100%
10 years and within 20 years 77.21% 15.00% 0% 100%
20 years and within 30 years 0.00% 28.00% 0% 100%
30 years and above 1.19% 12.00% 0% 100%
% of total borrowing
0%
10%
20%
30%
40%
50%
60%
70%
80%
90%
Under 12months
12 months andwithin 24months
24 months andwithin 5 years
5 years andwithin 10
years
10 years andwithin 20
years
20 years andwithin 30
years
30 years andabove
Comparison of Babergh and Mid Suffolk
Maturity Structure of Borrowing
Babergh 31.10.17 Mid Suffolk 31.10.17
3.2 Time periods start on the first day of each financial year. The maturity date of borrowing is the earliest date on which the lender can demand repayment.
4. Principal sums invested for periods longer than 364 days
4.1 The purpose of this indicator is to control the Councils exposure to the risk of incurring losses by seeking early repayment of its investments. The limits on the long-term principal sum invested to final maturities over 364 days will be:
Babergh and Mid Suffolk 2017/18
Approved 2018/19 2019/20 2020/21
Limit on principal invested beyond year end
£2m £2m £2m £2m

Appendix F Revised
PRUDENTIAL INDICATORS 2017/18 – 2020/21
1. Background 1.1 The Local Government Act 2003 requires the Councils to have regard to
CIPFA’s Prudential Code for Capital Finance in Local Authorities (the “Prudential Code”) when determining how much money they can afford to borrow.
1.2 The objectives of the Prudential Code are to ensure, within a clear framework, that the capital investment plans of local authorities are affordable, prudent and sustainable, and that treasury management decisions are taken in accordance with good professional practice.
1.3 To demonstrate that both Councils have fulfilled these objectives, the Prudential Code sets out the following indicators that must be set and monitored each year.
2. Estimates of Capital Expenditure 2.4 The Councils planned capital expenditure and financing is summarised in the
following table.
Babergh 2017/18 2018/19 2019/20 2020/21
Capital Expenditure Revised Estimate Estimate Estimate
£m £m £m £m
General Fund 14.450 18.395 7.148 4.482
HRA 13.046 8.575 9.045 9.599
Total Expenditure 27.496 26.970 16.193 14.081
Babergh 2017/18 2018/19 2019/20 2020/21
Capital Financing – Revised Estimate Estimate Estimate
General Fund £m £m £m £m
Capital Receipts 0.280 0.000 0.000 0.000
Government Grants 0.300 0.409 0.409 0.409
Revenue Contributions & Reserves 0.000 0.000 0.000 0.000
Total Financing 0.580 0.409 0.409 0.409
Unsupported Borrowing 13.870 17.986 6.739 4.073
Total Financing & Funding 14.450 18.395 7.148 4.482
Babergh 2017/18 2018/19 2019/20 2020/21
Capital Financing – HRA Revised Estimate Estimate Estimate
£m £m £m £m
Capital Receipts 3.474 0.722 0.674 0.675
External Grant & Contributions 0.066 0.000 0.000 0.000
Major Repairs
Allowance/Depreciation 2.735 2.721 1.439 1.321
Revenue Contributions & Reserves 4.405 5.132 6.932 7.603
Total Financing 10.680 8.575 9.045 9.599
Unsupported Borrowing 2.366 0.000 0.000 0.000
Total Financing & Funding 13.046 8.575 9.045 9.599

Appendix F Revised
Mid Suffolk 2017/18 2018/19 2019/20 2020/21
Capital Expenditure Revised Estimate Estimate Estimate
£m £m £m £m
General Fund 31.873 19.367 3.739 3.643
HRA 7.751 9.037 8.291 11.487
Total Expenditure 39.624 28.404 12.030 15.130
Mid Suffolk 2017/18 2018/19 2019/20 2020/21
Capital Financing – Revised Estimate Estimate Estimate
General Fund £m £m £m £m
Capital Receipts 0.073 0.024 0.023 0.023
Government Grants 0.376 0.772 0.376 0.376
Revenue Contributions & Reserves 0.044 2.775 0.000 0.000
Total Financing 0.493 3.571 0.399 0.399
Unsupported Borrowing 31.380 15.796 3.340 3.244
Total Financing & Funding 31.873 19.367 3.739 3.643
Mid Suffolk 2017/18 2018/19 2019/20 2020/21
Capital Financing – HRA Revised Estimate Estimate Estimate
£m £m £m £m
Capital Receipts 1.929 2.498 2.103 3.061
External Grant & Contributions 0.030 0.000 0.000 0.000
Major Repairs
Allowance/Depreciation 2.762 3.146 3.361 3.473
Revenue Contributions & Reserves 3.030 3.393 2.827 3.605
Total Financing 7.751 9.037 8.291 10.139
Unsupported Borrowing 0.000 0.000 0.000 1.348
Total Financing & Funding 7.751 9.037 8.291 11.487
3. Estimates of Capital Financing Requirement 3.1 The Capital Financing Requirement (CFR) measures the Councils underlying
need to borrow for a capital purpose. The calculation of the CFR is taken from the amounts held on the Balance Sheet relating to capital expenditure and it’s financing.
Babergh 2017/18 2018/19 2019/20 2020/21
Capital Financing Requirement Revised Estimate Estimate Estimate
£m £m £m £m
General Fund 31.564 48.617 54.246 57.058
HRA 88.119 87.619 87.119 86.719
Total CFR 119.683 136.236 141.365 143.777
Mid Suffolk 2017/18 2018/19 2019/20 2020/21
Capital Financing Requirement Revised Estimate Estimate Estimate
£m £m £m £m
General Fund 52.964 67.550 69.479 71.146
HRA 86.759 86.759 86.759 88.107
Total CFR 139.723 154.309 156.238 159.253
Appendix F Revised
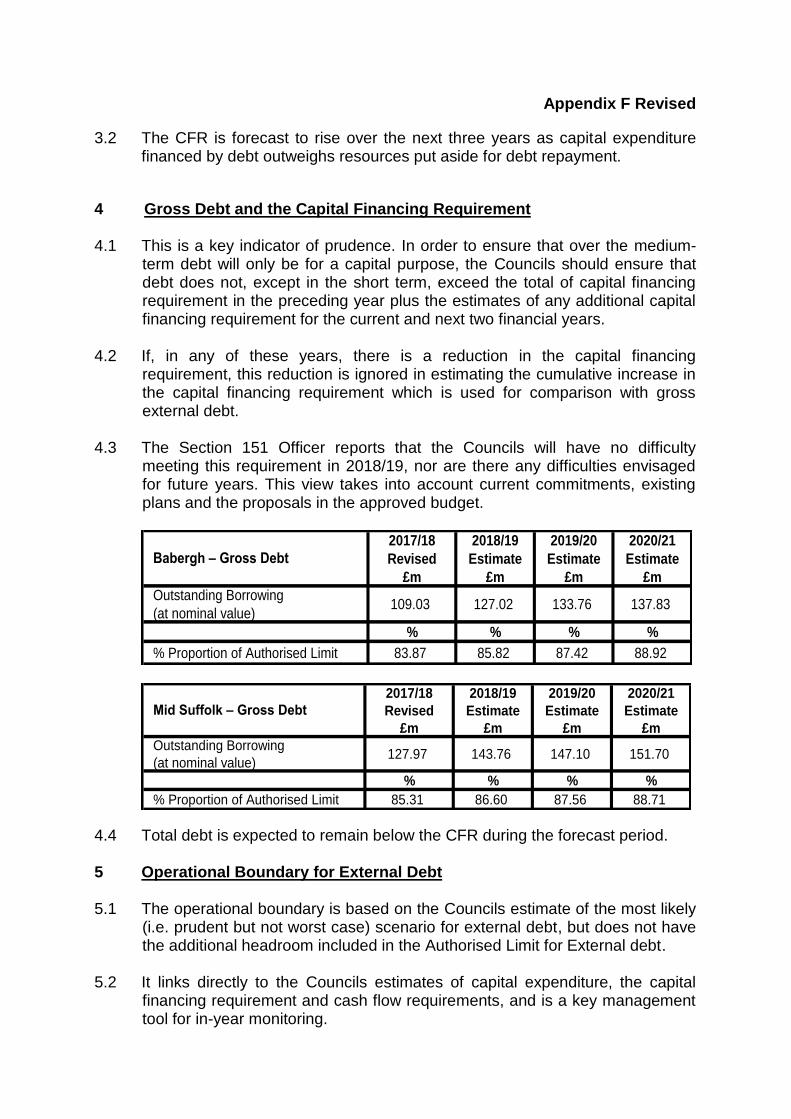
3.2 The CFR is forecast to rise over the next three years as capital expenditure financed by debt outweighs resources put aside for debt repayment.
4 Gross Debt and the Capital Financing Requirement
4.1 This is a key indicator of prudence. In order to ensure that over the medium-term debt will only be for a capital purpose, the Councils should ensure that debt does not, except in the short term, exceed the total of capital financing requirement in the preceding year plus the estimates of any additional capital financing requirement for the current and next two financial years.
4.2 If, in any of these years, there is a reduction in the capital financing requirement, this reduction is ignored in estimating the cumulative increase in the capital financing requirement which is used for comparison with gross external debt.
4.3 The Section 151 Officer reports that the Councils will have no difficulty
meeting this requirement in 2018/19, nor are there any difficulties envisaged for future years. This view takes into account current commitments, existing plans and the proposals in the approved budget.
2017/18 2018/19 2019/20 2020/21
Revised Estimate Estimate Estimate
£m £m £m £m
Outstanding Borrowing
(at nominal value)109.03 127.02 133.76 137.83
% % % %
% Proportion of Authorised Limit 83.87 85.82 87.42 88.92
Babergh – Gross Debt
2017/18 2018/19 2019/20 2020/21
Revised Estimate Estimate Estimate
£m £m £m £m
Outstanding Borrowing
(at nominal value)127.97 143.76 147.10 151.70
% % % %
% Proportion of Authorised Limit 85.31 86.60 87.56 88.71
Mid Suffolk – Gross Debt
4.4 Total debt is expected to remain below the CFR during the forecast period.
5 Operational Boundary for External Debt
5.1 The operational boundary is based on the Councils estimate of the most likely (i.e. prudent but not worst case) scenario for external debt, but does not have the additional headroom included in the Authorised Limit for External debt.
5.2 It links directly to the Councils estimates of capital expenditure, the capital
financing requirement and cash flow requirements, and is a key management tool for in-year monitoring.
Appendix F Revised
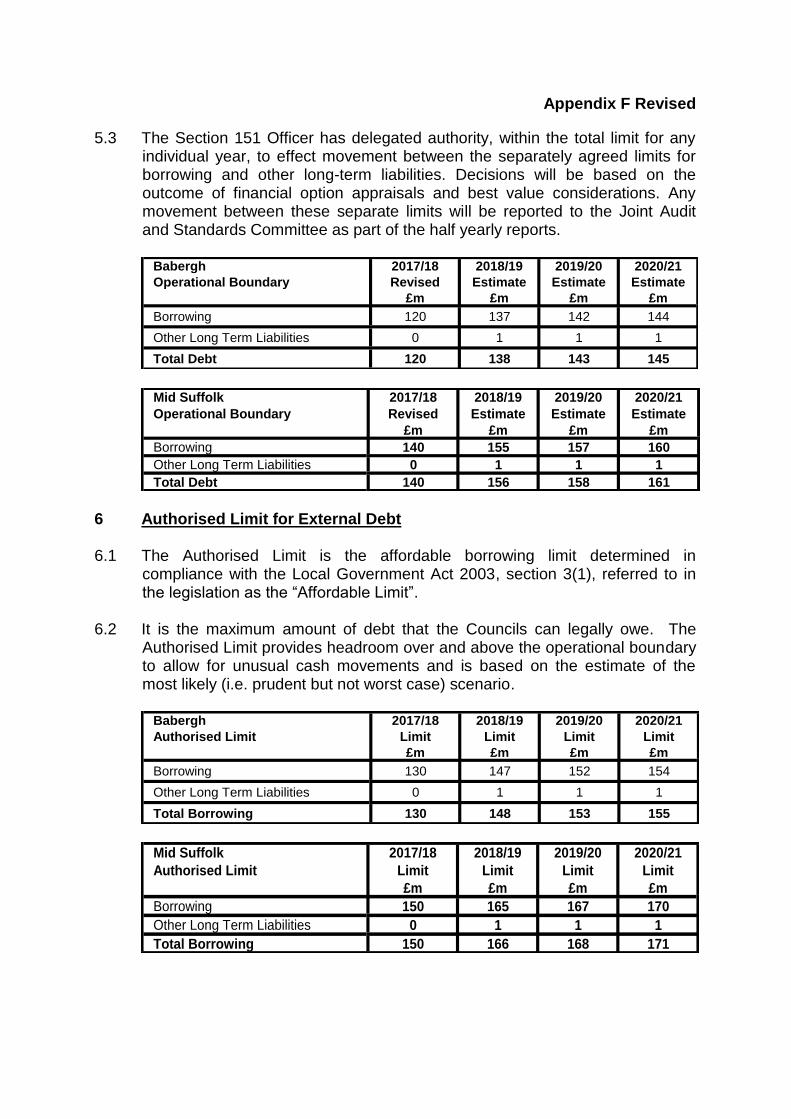
5.3 The Section 151 Officer has delegated authority, within the total limit for any individual year, to effect movement between the separately agreed limits for borrowing and other long-term liabilities. Decisions will be based on the outcome of financial option appraisals and best value considerations. Any movement between these separate limits will be reported to the Joint Audit and Standards Committee as part of the half yearly reports.
Babergh 2017/18 2018/19 2019/20 2020/21
Operational Boundary Revised Estimate Estimate Estimate
£m £m £m £m
Borrowing 120 137 142 144
Other Long Term Liabilities 0 1 1 1
Total Debt 120 138 143 145
Mid Suffolk 2017/18 2018/19 2019/20 2020/21
Operational Boundary Revised Estimate Estimate Estimate
£m £m £m £m
Borrowing 140 155 157 160
Other Long Term Liabilities 0 1 1 1
Total Debt 140 156 158 161
6 Authorised Limit for External Debt
6.1 The Authorised Limit is the affordable borrowing limit determined in
compliance with the Local Government Act 2003, section 3(1), referred to in the legislation as the “Affordable Limit”.
6.2 It is the maximum amount of debt that the Councils can legally owe. The
Authorised Limit provides headroom over and above the operational boundary to allow for unusual cash movements and is based on the estimate of the most likely (i.e. prudent but not worst case) scenario.
Babergh 2017/18 2018/19 2019/20 2020/21
Authorised Limit Limit Limit Limit Limit
£m £m £m £m
Borrowing 130 147 152 154
Other Long Term Liabilities 0 1 1 1
Total Borrowing 130 148 153 155
Mid Suffolk 2017/18 2018/19 2019/20 2020/21
Authorised Limit Limit Limit Limit Limit
£m £m £m £m
Borrowing 150 165 167 170
Other Long Term Liabilities 0 1 1 1
Total Borrowing 150 166 168 171
Appendix F Revised
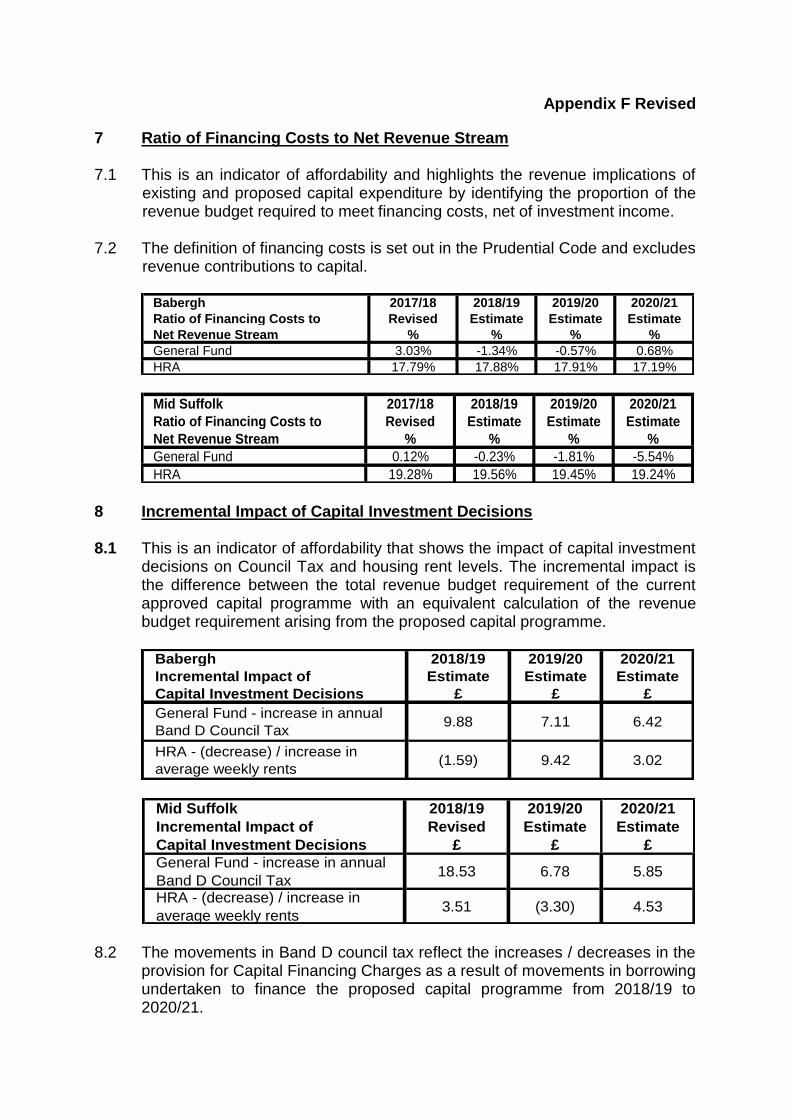
7 Ratio of Financing Costs to Net Revenue Stream
7.1 This is an indicator of affordability and highlights the revenue implications of existing and proposed capital expenditure by identifying the proportion of the revenue budget required to meet financing costs, net of investment income.
7.2 The definition of financing costs is set out in the Prudential Code and excludes revenue contributions to capital.
Babergh 2017/18 2018/19 2019/20 2020/21
Ratio of Financing Costs to Revised Estimate Estimate Estimate
Net Revenue Stream % % % %
General Fund 3.03% -1.34% -0.57% 0.68%
HRA 17.79% 17.88% 17.91% 17.19%
Mid Suffolk 2017/18 2018/19 2019/20 2020/21
Ratio of Financing Costs to Revised Estimate Estimate Estimate
Net Revenue Stream % % % %
General Fund 0.12% -0.23% -1.81% -5.54%
HRA 19.28% 19.56% 19.45% 19.24% 8 Incremental Impact of Capital Investment Decisions 8.1 This is an indicator of affordability that shows the impact of capital investment
decisions on Council Tax and housing rent levels. The incremental impact is the difference between the total revenue budget requirement of the current approved capital programme with an equivalent calculation of the revenue budget requirement arising from the proposed capital programme.
Babergh 2018/19 2019/20 2020/21
Incremental Impact of Estimate Estimate Estimate
Capital Investment Decisions £ £ £
General Fund - increase in annual
Band D Council Tax9.88 7.11 6.42
HRA - (decrease) / increase in
average weekly rents(1.59) 9.42 3.02
Mid Suffolk 2018/19 2019/20 2020/21
Incremental Impact of Revised Estimate Estimate
Capital Investment Decisions £ £ £
General Fund - increase in annual
Band D Council Tax18.53 6.78 5.85
HRA - (decrease) / increase in
average weekly rents3.51 (3.30) 4.53
8.2 The movements in Band D council tax reflect the increases / decreases in the provision for Capital Financing Charges as a result of movements in borrowing undertaken to finance the proposed capital programme from 2018/19 to 2020/21.

Appendix F Revised
9 Adoption of the CIPFA Treasury Management Code 9.1 The Councils adopted the CIPFA Treasury Management in the Public
Services, Code of Practice 2011 (the “Treasury Management Code”) in November 2011.
Appendix G Revised
ANNUAL MINIMUM REVENUE PROVISION (MRP) STATEMENT 2018/19 1.1 Where the Councils finance their capital expenditure by debt, they must put
aside resources to repay that debt in later years. The amount charged to the revenue budget for the repayment of debt is known as Minimum Revenue Provision (MRP), although there has been no statutory minimum since 2008. The Local Government Act 2003 requires the Councils to have regard to the Department for Communities and Local Government’s Guidance on Minimum Revenue Provision (the CLG Guidance) most recently issued in 2012.
1.2 The broad aim of the CLG Guidance is to ensure that debt is repaid over a
period that is either reasonably commensurate with that over which the capital expenditure provides benefits, or, in the case of borrowing supported by Government Revenue Support Grant, reasonably commensurate with the period implicit in the determination of that grant.
1.3 The CLG Guidance requires the Councils to approve an Annual MRP Statement each year, and recommends a number of options for calculating a prudent amount of MRP. The following paragraph lists the options recommended in the Guidance.
1.4 The four MRP options available are:
Option 1: Regulatory Method
Option 2: CFR Method
Option 3: Asset Life Method
Option 4: Depreciation Method 1.5 For capital expenditure incurred before 1st April 2008, MRP will be determined
in accordance with the former regulations that applied on 31st March 2008, incorporating an “Adjustment A” of £2.4m for Mid Suffolk (Option 1). Babergh does not have any capital expenditure incurred before 1st April 2008 on which to charge MRP.
1.6 For capital expenditure incurred after 31st March 2008, MRP will be determined by charging the expenditure over the expected useful life of the relevant asset on an annuity basis using an interest rate equivalent to the average PWLB annuity rate for the year of expenditure. MRP charges start in the year after the asset becomes operational. MRP on purchases of freehold land will be charged over 50 years. MRP on expenditure not related to fixed assets but which has been capitalised by regulation or direction will be charged over 20 years. (Option 3).
1.7 Where investments are made in the Councils’ subsidiaries for the purpose of the companies purchasing land and buildings, MRP will be charged over 40 years.

Appendix G Revised
1.8 For capital expenditure loans to third parties that are repaid in annual or more frequent instalments of principal, the Councils will make no MRP charge, but will instead apply the capital receipts arising from principal repayments to reduce the capital financing requirement. In years where there is no principal repayment, MRP will be charged in accordance with the MRP policy for the assets funded by the loan, including where appropriate, delaying MRP until the year after the assets become operational.
1.9 No MRP will be charged in respect of assets held within the Housing Revenue Account. However, voluntary MRP contributions from the HRA may be made.
1.10 Capital expenditure incurred during 2017/18 will not be subject to an MRP charge until 2018/19 and capital expenditure incurred during 2018/19 will not be subject to an MRP charge until 2019/20.
1.11 If it is ever proposed to vary the terms of the original MRP Statement during the year, a revised statement will be put to full Councils at that time.
1.12 Based on the Councils latest estimate of their Capital Financing Requirement on 31st March 2018, the budget for MRP has been set as follows:
31/03/2018
Estimated
CFR
2018/19
Estimated
MRP
£m £m
20.17 0.933
11.39 0.000
31.56 0.933
2.37 0.000
85.75 0.000
88.12 0.000
119.68 0.933
Babergh
Assets in the Housing Revenue Account
HRA subsidy reform payment
Total Housing Revenue Account
Total
Unsupported capital expenditure after 31/3/2008
Loans to other bodies repaid in instalments
Total General Fund
31/03/18
Estimated
CFR
2018/19
Estimated
MRP
£m £m
8.36 0.071
24.70 1.140
19.90 0.000
52.96 1.211
29.55 0.000
57.21 0.000
86.76 0.000
139.72 1.211
Assets in the Housing Revenue Account
HRA subsidy reform payment
Total Housing Revenue Account
Total
Unsupported capital expenditure after 31/03/2008
Loans to other bodies repaid in instalments
Total General Fund
Capital expenditure before 01/04/2008
Mid Suffolk
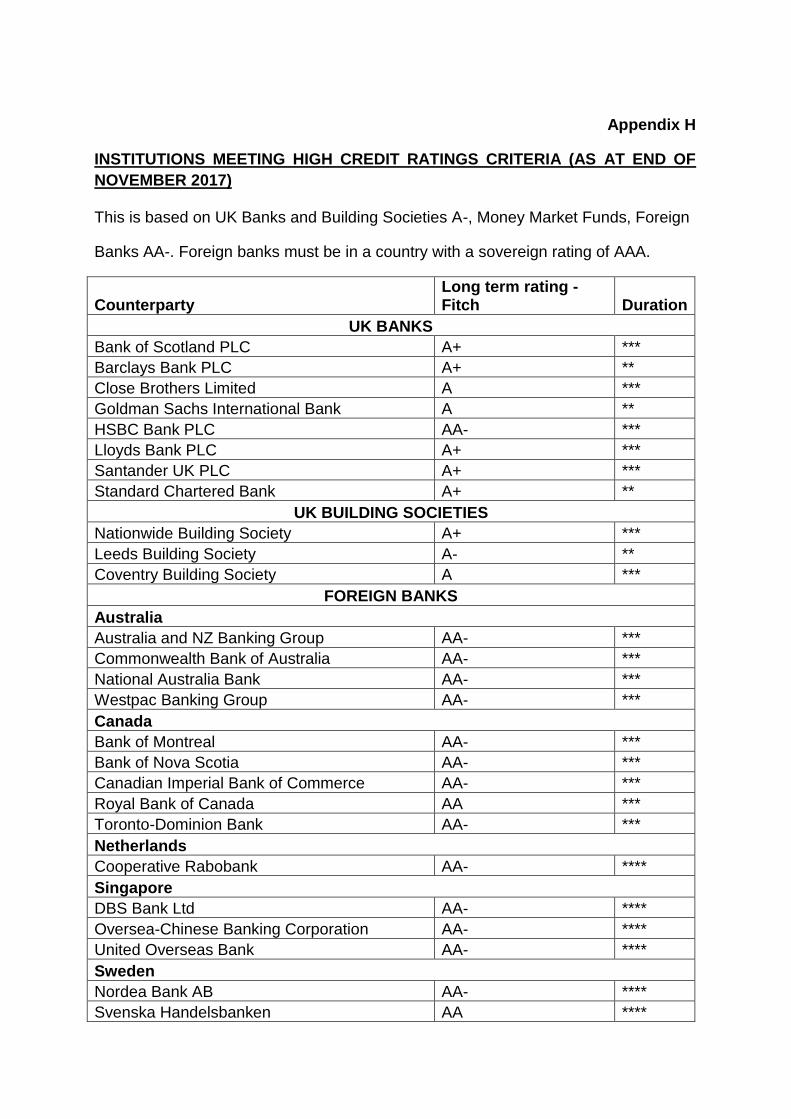
Appendix H
INSTITUTIONS MEETING HIGH CREDIT RATINGS CRITERIA (AS AT END OF
NOVEMBER 2017)
This is based on UK Banks and Building Societies A-, Money Market Funds, Foreign
Banks AA-. Foreign banks must be in a country with a sovereign rating of AAA.
Counterparty Long term rating - Fitch Duration
UK BANKS
Bank of Scotland PLC A+ ***
Barclays Bank PLC A+ **
Close Brothers Limited A ***
Goldman Sachs International Bank A **
HSBC Bank PLC AA- ***
Lloyds Bank PLC A+ ***
Santander UK PLC A+ ***
Standard Chartered Bank A+ **
UK BUILDING SOCIETIES
Nationwide Building Society A+ ***
Leeds Building Society A- **
Coventry Building Society A ***
FOREIGN BANKS
Australia
Australia and NZ Banking Group AA- ***
Commonwealth Bank of Australia AA- ***
National Australia Bank AA- ***
Westpac Banking Group AA- ***
Canada
Bank of Montreal AA- ***
Bank of Nova Scotia AA- ***
Canadian Imperial Bank of Commerce AA- ***
Royal Bank of Canada AA ***
Toronto-Dominion Bank AA- ***
Netherlands
Cooperative Rabobank AA- ****
Singapore
DBS Bank Ltd AA- ****
Oversea-Chinese Banking Corporation AA- ****
United Overseas Bank AA- ****
Sweden
Nordea Bank AB AA- ****
Svenska Handelsbanken AA ****

Appendix H
Counterparty Long term rating - Fitch Duration
MONEY MARKET FUNDS (MMF)
Standard life Investments Sterling Liquidity Fund AAAmmf *
Goldman Sterling Liquid Reserves Fund AAAmmf *
Insight Sterling Liquidity Fund AAAmmf *
Federated Investors (UK) Sterling Liquidity Fund AAAmmf *
Invesco AIM STUC Sterling Liquidity Portfolio AAAmmf *
Blackrock Institutional Sterling Liquidity Fund *1 *
* Overnight Limit
** Maximum limit to maturity 100 days
*** Maximum limit to maturity 6 months
**** Maximum limit to maturity 13 months
***** Maximum exposure limit 10% of total investments per fund
*1 Blackrock has withdrawn from Fitch Rating
MMFs – Federated is domiciled in the UK for tax and administration purposes, Standard Life, Goldman Sachs, BlackRock, Invesco and Insight are domiciled in Ireland for tax and administration purposes.
Long Term Investments Grades
Rating Definition
AAA
Highest credit quality – ‘AAA’ ratings denote the lowest expectation
of credit risk. They are assigned only in case of exceptionally strong
capacity for payment of financial commitments. This capacity is
highly unlikely to be adversely affected by foreseeable events.
Very high credit quality ‘AA’ ratings denote expectations of very low
credit risk. They indicate very strong capacity for payment of
financial commitments. This capacity is not significantly vulnerable to
foreseeable events.
High credit quality – ‘A’ ratings denote expectations of low credit
risk. The capacity for payment of financial commitments is
considered strong. This capacity may, nevertheless, be more
vulnerable to changes in circumstances or in economic conditions
than is the case for higher ratings.
AA
A
Agency - Fitch

Appendix H
Long Term Investment Grades
Rating Definition
AaaObligations rated Aaa are judged to be of the highest quality, with
minimal credit risk.
Aa1
Aa2
Aa3
A1
A2
A3
Obligations rated A are considered upper-medium grade and are
subject to low credit risk.
Obligations rated Aa are judged to be of high quality and are subject
to very low credit risk.
Agency - Moody’s
Rating Definition
AAA
An obligator rated ‘AAA’ has extremely strong capacity to meet its
financial commitments. ‘AAA’ is the highest issuer credit rating
assigned by Standard & Poor’s.
An obligator rated ‘AA’ has very strong capacity to meet its financial
commitments. It differs from the highest rated obligators only to a
small degree.
An obligator rated ‘A’ has strong capacity to meet its financial
commitments but is somewhat more susceptible to the adverse
effects of changes in circumstances and economic conditions than
obligators in higher rated categories.
A
Agency - Standard & Poor’s
AA

Appendix I Revised Glossary of Terms
CCLA Churches, Charities and Local Authority Property Fund
CFR Capital Financing Requirement. The underlying need to borrow to finance capital expenditure.
CIPFA The Chartered Institute of Public Finance and Accountancy. This is the leading professional accountancy body for public services.
CLG Department for Communities and Local Government. This is a ministerial department.
DMADF Debt Management Account Deposit Facility.
Funding Circle Accounts set up to lend money to local and national businesses at competitive rates
GDP Gross Domestic Product. This is the market value of all officially recognised goods and services produced within a country in a given period of time.
HRA Housing Revenue Account. The statutory account to which are charged the revenue costs of providing, maintaining and managing Council dwellings. These costs are financed by tenants’ rents.
LOBO Lender’s Option Borrower’s Option. This is a loan where the lender has certain dates when they can increase the interest rate payable and, if they do, the Council has the option of accepting the new rate or repaying the loan.
MIFID II Markets in Financial Instruments Directive 2014/65/EU. Effective from 1 January 2018. The Councils have met the conditions to opt up to professional status. The Councils will continue to have access to products including money market funds, pooled funds, treasury bills, bonds, shares and to financial advice.
MPC Monetary Policy Committee – A committee of the Bank of England which meets each month to decide the official interest in the UK. It is also responsible for other aspects of the Government’s monetary policy framework such as quantitative easing and forward guidance.
MRP Minimum Revenue Provision. Local authorities are required to make a prudent provision for debt redemption on General Fund borrowing.

Appendix I Revised
PWLB Public Works Loan Board - offers loans to local authorities below market rates.
QE Quantitative Easing. The purchase of Government bonds by the Bank of England to boost the money supply.
T Bills Treasury Bill. A short-term Government Bond.
UBS UBS Multi Asset Income Fund (UK) - a pooled fund