8-self consolidating concrete - michigan local technical...
TRANSCRIPT

1
SELF CONSOLIDATING CONCRETE
Effect of Mix Design on Design and Performance of Precast/Prestressed Girders
Rigoberto Burgueño, Ph.D.Assistant Professor of Structural Engineering
Department of Civil and Environmental EngineeringMichigan State University
BACKGROUND & MOTIVATION
Self-Consolidating Concrete (SCC): a specially proportioned concrete that can flow easily into forms and around steel reinforcement without segregation.
The benefits of SCC in reduced labor needs, increased rate of production and safety, and lower noise levels have generated great interest from the precast concrete industry.
Considerable development in SCC technology has been made through the past decades particularly in Japan, Canada, and Europe, and its applications have become wide spread.
SCC FRESH PROPERTY BEHAVIOR

2
BACKGROUND & MOTIVATION
Self-Consolidating Concrete (SCC): a specially proportioned concrete that can flow easily into forms and around steel reinforcement without segregation.
The benefits of SCC in reduced labor needs, increased rate of production and safety, and lower noise levels have generated great interest from the precast concrete industry.
Considerable development in SCC technology has been made through the past decades particularly in Japan, Canada, and Europe, and its applications have become wide spread.
SCC BENEFITS
BACKGROUND & MOTIVATION
Use of SCC in the US has been limited because of concerns about design and construction issues that are perceived to influence the structural integrity.
In spite of the rapid developments in SCC technology, most of the work has focused on mix design development, rheologycharacterization, mechanical properties, and in-situ verification.
Very limited information exists on issues related to structural design and performance.

3
A. Increase paste deformability* use of HRWR* balanced w/c ratio
B. Reduce inter-particle friction* low coarse aggregate volume* use cont. graded powder
Fluidity/Deformability
A. Increase paste deformability* use of HRWR* balanced w/c ratio
B. Reduce inter-particle friction* low coarse aggregate volume* use cont. graded powder
Fluidity/Deformability
A. Reduce solids separation* limit aggregate content* reduce max. size aggregate* increase cohesion & viscosity
- low w/c ratio- use of VMA
B. Minimize bleeding* low w/c ratio* use of high-area powder* increase VMA
Homogeneity/Stability
A. Reduce solids separation* limit aggregate content* reduce max. size aggregate* increase cohesion & viscosity
- low w/c ratio- use of VMA
B. Minimize bleeding* low w/c ratio* use of high-area powder* increase VMA
Homogeneity/Stability
A. Enhance cohesiveness* low w/c ratio* use of VMA
B. Compatible flow space andaggregate size* low coarse aggregate volume* low max. size aggregate
Easy Flow/Low BlockageA. Enhance cohesiveness
* low w/c ratio* use of VMA
B. Compatible flow space andaggregate size* low coarse aggregate volume* low max. size aggregate
Easy Flow/Low Blockage
Viscosity
Def
orm
abili
ty
High Viscosity,Low Fluidity
Low Viscosity,High Fluidity
Fluidity/StabilityTrade-off
Viscosity
Def
orm
abili
ty
High Viscosity,Low Fluidity
Low Viscosity,High Fluidity
Fluidity/StabilityTrade-off
SCC PROPORTIONING & BEHAVIOR
SCC MIX DESIGN DEVELOPMENT
No commonly accepted procedure to proportion SCC.
Methods are bounded by two approaches:1) High w/c ratios (e.g., 0.45) and use of HRWR and VMA.2) Lower w/c ratios (e.g. 0.33), high use of HRWR and no VMA
Approach: Develop characteristic bounding SCC mix designs.
Mix Design w/c HRWR VMA CAC S/Pt EA SCC-1 0.35 + – less more + SCC-2 0.40 + +/– + SCC-3 0.45 + + + NCC 0.40 + – more less +
PCI Daniel P. Jenny Research Fellowship on “Structural Performance of PC/PS Girder Bridges using SCC”
Objective:To investigate the transfer and flexural bond length performance of prestressing strands in pc/ps bridge girders built using SCC to provide guidance on the construction and design of these elements with SCC.
MSU SCC RESEARCH – Part 1

4
MIX DESIGNS – PCI Project
Constituents (lbs)
666.6906.14DELVO® StabilizerSet Retardant0913.940Rheomac® VMA 358 VMA2878.496.29Glenium® 3200 HESHRWR19.080.50.210.5MB-AETM 90Air Entraining
Admixtures (oz/cwt)0.40.450.40.40.35w/c Ratio6%6%6%6%6%(design)Air280315280280245Water158014351380138013806 AAGravel121612751426142615192 NSSand700700700700700Type-IIICement
NCCBSCC3SCC2BSCC2ASCC1Type
Inverted Slump Flow and VSI Test
127"SCC3
0*24.5"SCC2b
0.525"SCC2a
027"SCC1
Visual Stability
Index
Slump Spread Flow
* Concrete had very low flowability
FRESH PROPERTIES – PCI Project
FRESH PROPERTIES – PCI Project
41.28SCC3
naSCC2b
23.81SCC2a
1.59SCC1
J-RingValue
J-Ring Test

5
2, 9*0.69*SCC3
na0.76SCC2b
1, 20.86SCC2a
1, 20.80SCC1
t1, t2(sec.)
BlockingRatio
* Test was done too late
FRESH PROPERTIES – PCI Project
L-Box Test
CONSTITUTIVE PROPERTIES – f’c
Age Of Concrete (days)0 20 40 60 80 100 120 140
Com
pres
sive
Str
engt
h (p
si)
4500
5000
5500
6000
6500
7000
7500
8000
8500
9000
9500
10000
Com
pres
sive
Str
engt
h (M
Pa)
30333639424548515457606366
NCCBSCC1SCC2ASCC2BSCC3
CONSTITUTIVE PROPERTIES – fct
Age Of Concrete (days)0 20 40 60 80 100 120 140
Split
Ten
sile
Str
engt
h (p
si)
400
450
500
550
600
650
700
Split
Ten
sile
Str
engt
h (M
Pa)
3.00
3.25
3.50
3.75
4.00
4.25
4.50
4.75
NCCBSCC1SCC2ASCC2BSCC3
6
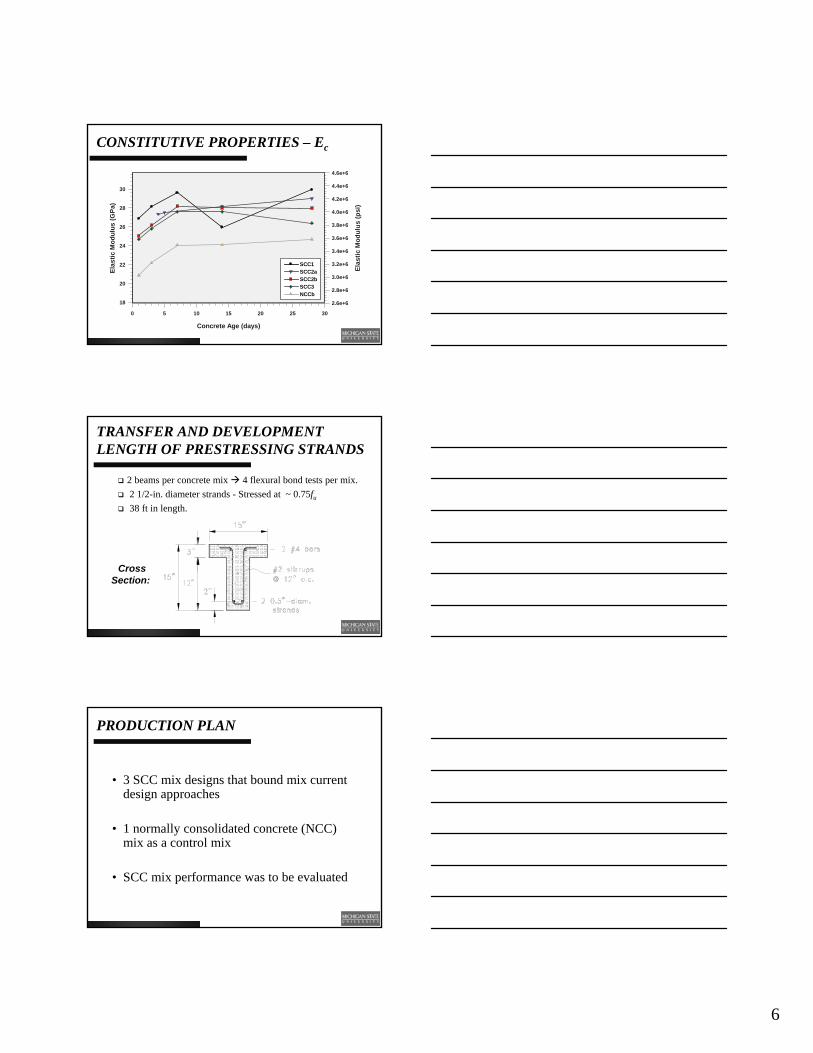
CONSTITUTIVE PROPERTIES – Ec
Concrete Age (days)
0 5 10 15 20 25 30
Elas
tic M
odul
us (p
si)
2.6e+6
2.8e+6
3.0e+6
3.2e+6
3.4e+6
3.6e+6
3.8e+6
4.0e+6
4.2e+6
4.4e+6
4.6e+6
Elas
tic M
odul
us (G
Pa)
18
20
22
24
26
28
30
SCC1SCC2aSCC2b SCC3NCCb
TRANSFER AND DEVELOPMENT LENGTH OF PRESTRESSING STRANDS
2 beams per concrete mix 4 flexural bond tests per mix.2 1/2-in. diameter strands - Stressed at ~ 0.75fu
38 ft in length.
CrossSection:
• 3 SCC mix designs that bound mix current design approaches
• 1 normally consolidated concrete (NCC) mix as a control mix
• SCC mix performance was to be evaluated
PRODUCTION PLAN
7
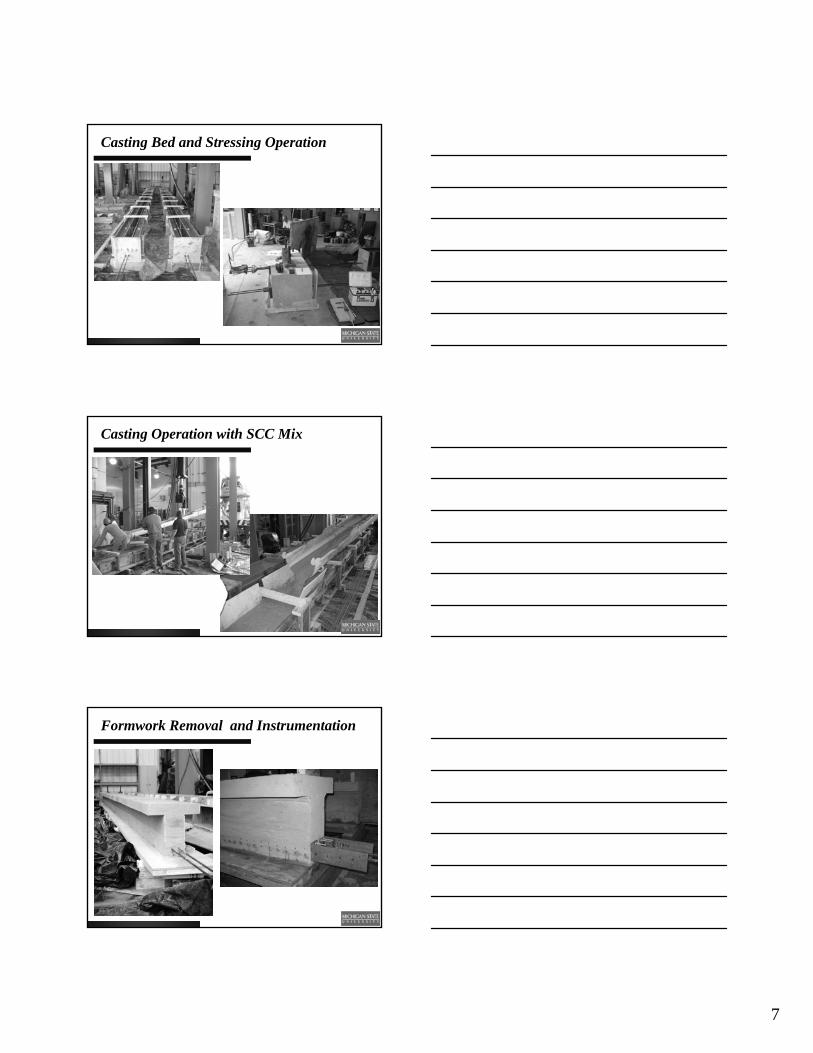
Casting Bed and Stressing Operation
Casting Operation with SCC Mix
Formwork Removal and Instrumentation

8
Prestress Release Operation
TRANSFER LENGTH EVALUATION
Strand Pull-In Concrete Strain Profile
MIX TYPE
NCCB SCC1 SCC2A SCC2B SCC3
Stra
nd D
raw
- in
(in.
)
0.00
0.02
0.04
0.06
0.08
0.10
0.12
0.14
0.16
Stra
nd D
raw
- in
(mm
)
0.0
0.5
1.0
1.5
2.0
2.5
3.0
3.5
4.0
Strand Draw-in Measurements

9
Average Strain Profile for SCC1 BeamsDistance Along Beam (in.)
0 10 20 30 40 50 60 70 80 90 100
Con
cret
e St
rain
0
1e-4
2e-4
3e-4
4e-4
5e-4
Distance Along Beam (mm)0 250 500 750 1000 1250 1500 1750 2000 2250 2500
Lt = 719 mm (28.3 in.)
95% AMS
SCC1
Transfer Length Evaluation – PCI Phase 1
MIX TYPENCCB SCC1 SCC2A SCC2B SCC3
Tran
sfer
leng
th (i
n.)
0
5
10
15
20
25
30
35
40
45
Tran
sfer
leng
th (m
m)
0
100
200
300
400
500
600
700
800
900
1000
1100 Concrete StrainsStrand Draw-inACI / AASHTO
Transfer Length Evaluation – PCI Phase 2
MIX TYPENCC SCC1 SCC2 SCC3
Tran
sfer
leng
th (i
n.)
0
5
10
15
20
25
30
35
40
45
Tran
sfer
leng
th (m
m)
0
100
200
300
400
500
600
700
800
900
1000
1100 Concrete StrainsStrand Draw-inACI / AASHTO

10
Transfer Length Evaluation – Summary
MIX TYPENCC SCC1 SCC2 SCC3
Tran
sfer
leng
th (i
n.)
0
5
10
15
20
25
30
35
40
45
Tran
sfer
leng
th (m
m)
0
100
200
300
400
500
600
700
800
900
1000
1100 Phase1Phase2
Average ACI Lt = 760.98 mm (29.96 in.)
MIX TYPENCC SCC1 SCC2 SCC3
Tran
sfer
leng
th (i
n.)
0
5
10
15
20
25
30
35
40
45
Tran
sfer
leng
th (m
m)
0
100
200
300
400
500
600
700
800
900
1000
1100 Phase1Phase2
Average ACI Lt = 760.98 mm (29.96 in.)
DEVELOPMENT LENGTH EVALUATION
Development Length Test Setup

11
Failure Modes
Flexure Failure Bond-Slip/Shear Failure
Typical Response with Flexure/Bond FailureDisplacement at the section (in.)
0 1 2 3 4 5 6 7 8 9 10 11
Mom
ent (
kip-
ft)
0
10
20
30
40
50
60
70
80
90
Displacement at the section (mm)0 25 50 75 100 125 150 175 200 225 250 275
Mom
ent (
KN
-m)
0102030405060708090
100110120
SCC3-2BLda = 103.0 in.
Mn = 116.87 kN-m (86.20 k-ft)
Slip OnsetSlip @ Mn = 3.500 mm (0.137 in.)
Displacement at the section (in.)0 1 2 3 4 5 6 7 8 9 10 11
Mom
ent (
kip-
ft)
0
10
20
30
40
50
60
70
80
90
Displacement at the section (mm)0 25 50 75 100 125 150 175 200 225 250 275
Mom
ent (
KN
-m)
0102030405060708090
100110120
SCC3-2BLda = 103.0 in.
Mn = 116.87 kN-m (86.20 k-ft)
Slip OnsetSlip @ Mn = 3.500 mm (0.137 in.)
Development Length Test Results – Phase 1
ACI - 318
test
n ACI
MM −
d test
d ACI
LL
−
−
.d expt
d ACI
LL
−
−
SCC1 1.06 1.07 1.03 SCC2A 1.11 1.09 1.04 SCC2B 1.01 1.21 1.17 SCC3 1.09 1.79 1.42 NCCB 1.04 1.06 0.97

12
Development Length Test Results – Phase 2
ACI - 318
test
n ACI
MM −
d test
d ACI
LL
−
−
.d expt
d ACI
LL
−
−
SCC1 1.06 1.10 1.05 SCC2 1.02 1.04 1.03 SCC3 1.05 0.93 0.84 NCC 1.11 1.06 0.96
CONCLUSIONS – Part 1: PCI Project
The presented studies are serving as an evaluation of SCC mix designs on the structural performance of precast SCC elements.
SCC mix designs with moderate w/c ratios and moderate use of HRWR and VMA behave closer to NCC mixes without any chemical admixtures.
Transfer lengths determined by draw-in and concrete strain measurements indicate that the ACI equation applies to SCC.
Results from flexural tests indicate that development lengths for SCC mixes were slightly longer than code predicted values.
CONCLUSIONS – Part 1: PCI Project
The much longer development lengths found for SCC during the PCI Phase-1 project were verified to be due to poor strand quality.
Development length tests using a pre-qualified strand, known to have very good properties, indicated that SCC mix designs do affect the flexural bond mechanism of prestressing strands but in a slight manner. A more definite position by the research team is under consideration.
SCC mix proportioning seems to have different effects on the associated bond mechanisms controlling transfer and flexural bond length.
13
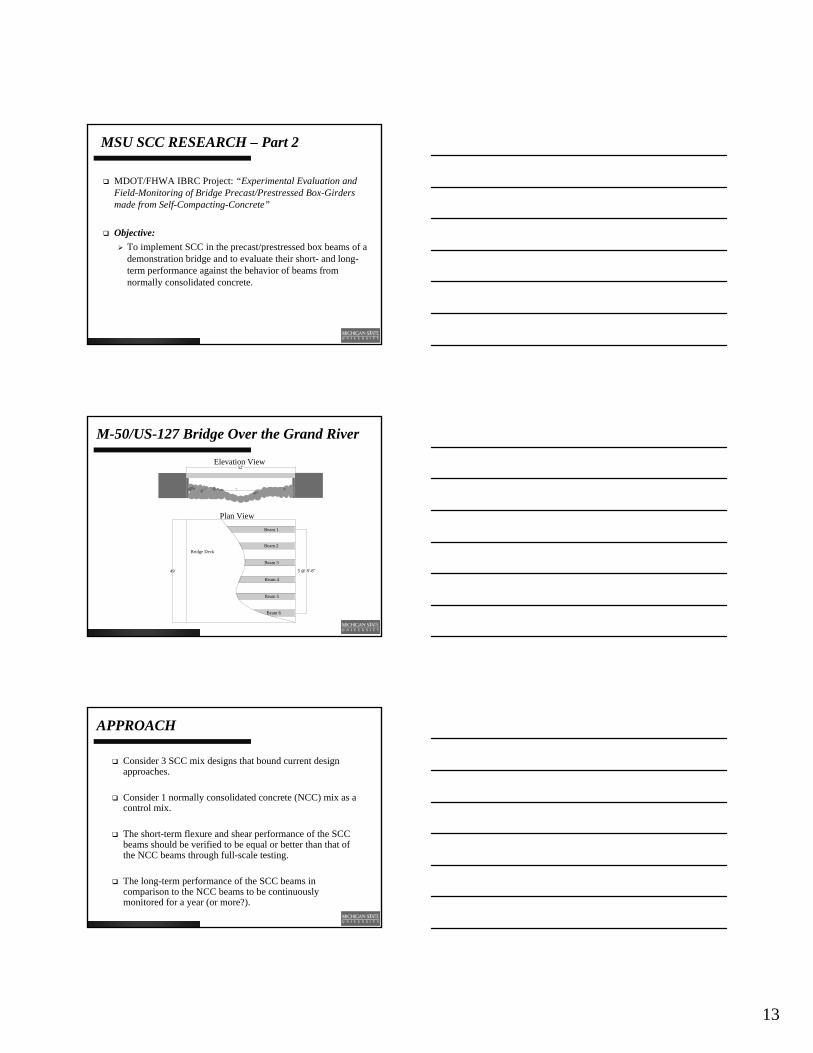
MDOT/FHWA IBRC Project: “Experimental Evaluation and Field-Monitoring of Bridge Precast/Prestressed Box-Girders made from Self-Compacting-Concrete”
Objective:To implement SCC in the precast/prestressed box beams of a demonstration bridge and to evaluate their short- and long-term performance against the behavior of beams from normally consolidated concrete.
MSU SCC RESEARCH – Part 2
Bridge Deck
Beam 1
Beam 2
Beam 3
Beam 4
Beam 5
Beam 6
5 @ 8'-8"49'
52'Elevation View
Plan View
M-50/US-127 Bridge Over the Grand River
Consider 3 SCC mix designs that bound current design approaches.
Consider 1 normally consolidated concrete (NCC) mix as a control mix.
The short-term flexure and shear performance of the SCC beams should be verified to be equal or better than that of the NCC beams through full-scale testing.
The long-term performance of the SCC beams in comparison to the NCC beams to be continuously monitored for a year (or more?).
APPROACH

14
3 NCC and 3 SCC (one for each mix design) beams for demonstration bridge
2 NCC and 6 SCC (two of each mix design) for experimental evaluation
3 reserve NCC beams for bridge placement in case of unsatisfactory SCC performance
Total: 17 Beams, 8 NCC and 9 SCC
BEAM PRODUCTION
44.447.752.954.1S/A Ratio (%)
Constituents (lbs)
0621Rheomac® VMAVMA810.71215Glenium® 3400HRWR1111MBAE90Air Entraining
Admixtures (oz/cwt)
0.400.460.410.37w/c Ratio6%6%6%6%(design)Air280320285256Water
1,6001,4501,3501,3506 AAGravel1,2771,3201,5131,5912 NSSand700700700700Type-IIICement
NCCSCC3SCC2SCC1Type
MIX DESIGNS – IBRC Project
Strand Bond Evaluation Mock-up Production
Fresh Property Evaluation
MIX DESIGN EVALUATION

15
27"
36"
16 Prestressing Strands 0.6" diameter
5 #4 Bars spaced at 6"
4.5"
4.5"
5"
BEAM CROSS SECTION
NCC Beam ProductionCast in two operations
Increased labor and time
BEAM PRODUCTION
SCC Beam ProductionCast in one operation
Reduced labor and time
EXPERIMENTAL EVALUATION

16
• Experimental evaluation was conducted at MSU’s Civil Infrastructure Laboratory
• Two test beams were cast for each concrete– One was to be evaluated for flexural response
• Four total tests– One was to be evaluated for shear response
• Four total tests
EXPERIMENTAL APPROACH
FLEXURAL EVALUATION
Test Beam
Actuator
Reaction Floor Support Block
8’50’52’
21’
Reaction Frame
FLEXURAL TEST SETUP

17
FLEXURAL FAILURE MODE
Displacement (in.)
0 1 2 3 4 5 6 7 8 9 10
Load
(kip
)
0
10
20
30
40
50
60
70
80
Design-Full*Design-Reduced*
*Nominal-AASHTO 17th Ed.
NCC SCC 1 SCC 2 SCC 3
P P
δ
P P
δ
FLEXURE TEST RESULTS
Curvature (1/in.)
0.0000 0.0001 0.0002 0.0003 0.0004
Mom
ent (
kip-
ft)
0
200
400
600
800
1000
1200
1400
1600
1800
Design-Full*Design-Reduced*
*Nominal-AASHTO 17th
Ed.
NCCSCC 1SCC 2SCC 3
P P
M
δ
P P
M
δ
FLEXURE TEST RESULTS

18
ACHIEVED FLEXURAL CAPACITIES
Maximum Total Moment
(kip-ft)
Design Moment [AASHTO]
(kip-ft)
Actual to DesignRatio
NCC 1,649 1,499 1.10
SCC1 1,628 1,499 1.09
SCC2 1,593 1,499 1.06
SCC3 1,590 1,499 1.06
* According to AASHTO Standard Specifications – 17th Ed.
*
SHEAR EVALUATION
SHEAR TEST SETUP
Reaction Frame
Actuator
Shear Deformation PanelTest Beam
Support Block Reaction Floor
Lv22’-Lv 8’52’
NCC: Lv = 11 ftSCC: Lv = 9 ft

19
SHEAR FAILURE MODE
Displacement (in.)
0.0 0.5 1.0 1.5 2.0 2.5 3.0 3.5 4.0
Load
(kip
)
0
20
40
60
80
100
120
140
160
180
200For all SCC Beams: Lv= 9 ftFor NCC Beam: Lv= 11 ft
AASHTO LRFD 2nd Ed.Design Nominal Capacity[Lv=9 ft]
AASHTO LRFD 2nd Ed.Design Nominal Capacity[Lv=11 ft]
Note: AASHTO 17th Ed.:176 kipDesign Nominal Capacity
NCCSCC 1SCC 2SCC 3
Lv
P P
Shear SectionLv
P P
Shear Section
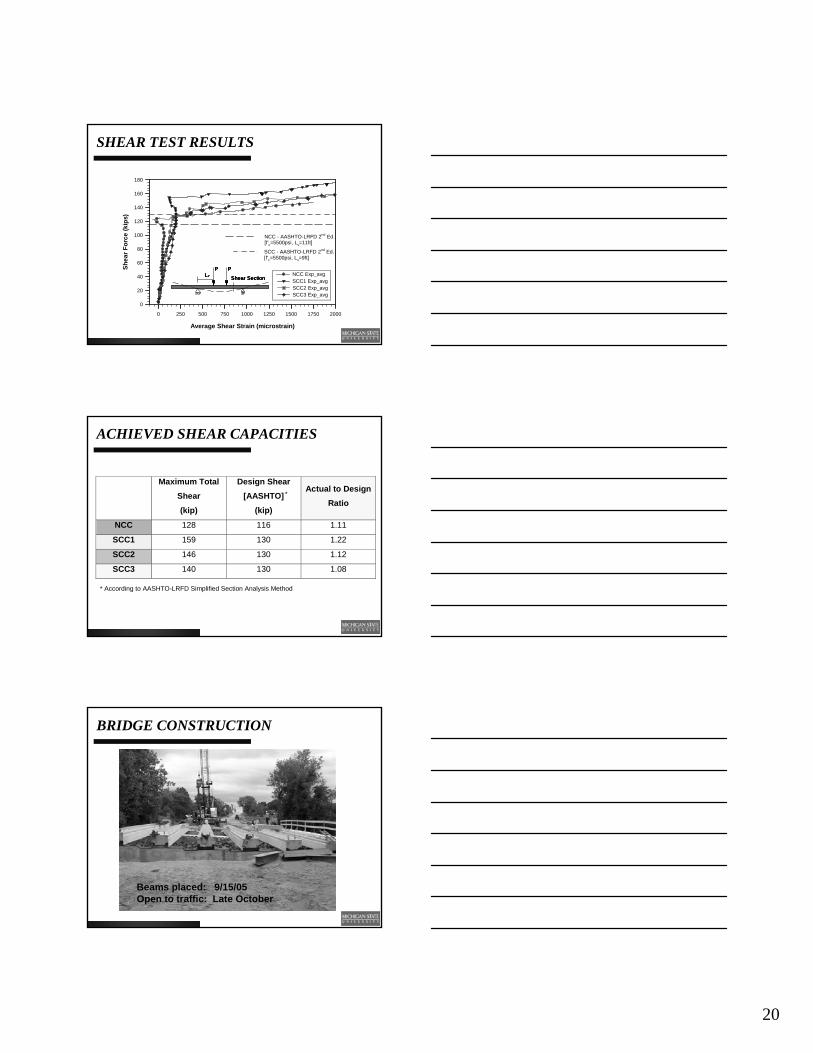
SHEAR TEST RESULTS
Curvature (1/in.)
0.00000 0.00005 0.00010 0.00015 0.00020
Mom
ent (
kip-
ft)
0
100
200
300
400
500
600
700
800
900
1000
1100
1200
1300
AASHTO LRFD 2nd Ed.Design Nominal Capacity[Lv=11 ft]
AASHTO LRFD 2nd Ed.Design Nominal Capacity[Lv=9 ft]
Note: Design Nominal Capacity: 1546 kip-ft [AASTHO 17th Ed.]
For all SCC Beams: Lv=9 ftFor NCC Beam: Lv=11 ft
NCCSCC 1SCC 2SCC 3
Lv
P P
Shear Section
.89 MM
SHEAR TEST RESULTS
20
Average Shear Strain (microstrain)
0 250 500 750 1000 1250 1500 1750 2000
Shea
r For
ce (k
ips)
0
20
40
60
80
100
120
140
160
180
SCC1 Exp_avgNCC Exp_avg
SCC2 Exp_avg
NCC - AASHTO-LRFD 2nd Ed.[f'c=5500psi, Lv=11ft]
SCC3 Exp_avg
SCC - AASHTO-LRFD 2nd Ed.[f'c=5500psi, Lv=9ft]
Lv
P P
Shear SectionLv
P P
Shear SectionLv
P P
Shear SectionLv
P P
Shear Section
SHEAR TEST RESULTS
ACHIEVED SHEAR CAPACITIES
Maximum Total
Shear (kip)
Design Shear [AASHTO]
(kip)
Actual to DesignRatio
NCC 128 116 1.11
SCC1 159 130 1.22
SCC2 146 130 1.12
SCC3 140 130 1.08
* According to AASHTO-LRFD Simplified Section Analysis Method
*
Beams placed: 9/15/05Open to traffic: Late October
BRIDGE CONSTRUCTION
21
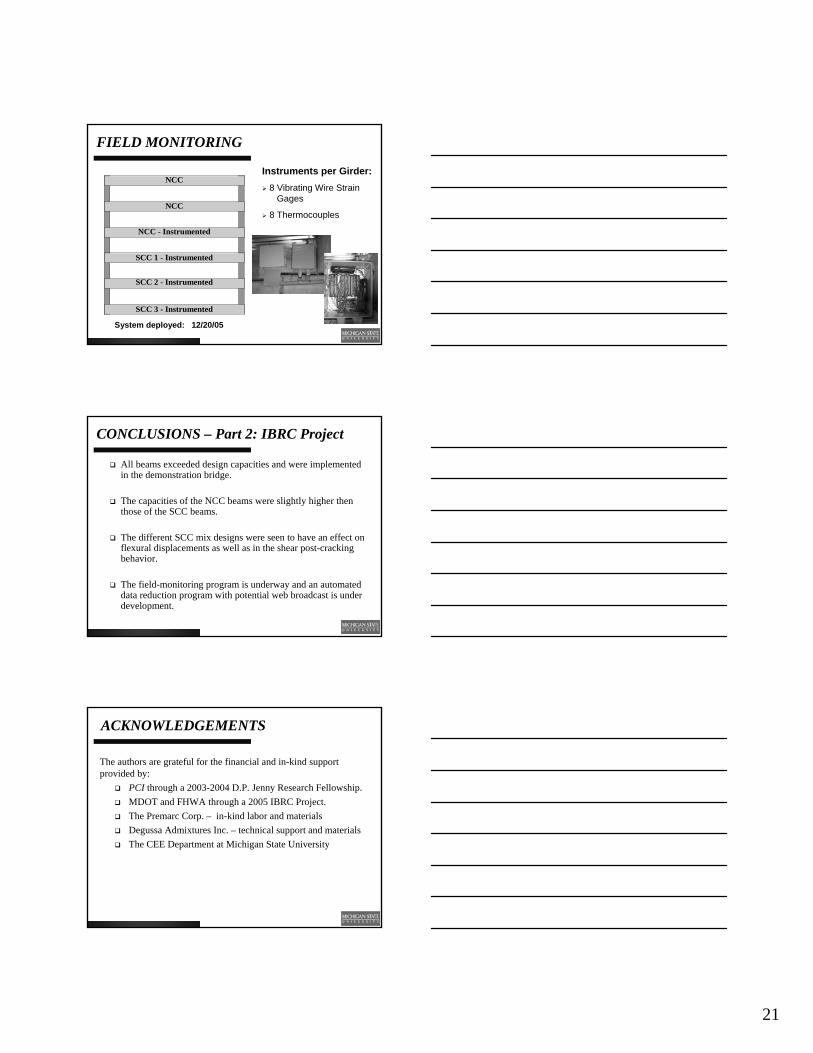
SCC 3 - Instrumented
SCC 2 - Instrumented
SCC 1 - Instrumented
NCC - Instrumented
NCC
NCC Instruments per Girder:
8 Vibrating Wire Strain Gages
8 Thermocouples
FIELD MONITORING
System deployed: 12/20/05
All beams exceeded design capacities and were implemented in the demonstration bridge.
The capacities of the NCC beams were slightly higher then those of the SCC beams.
The different SCC mix designs were seen to have an effect on flexural displacements as well as in the shear post-cracking behavior.
The field-monitoring program is underway and an automated data reduction program with potential web broadcast is under development.
CONCLUSIONS – Part 2: IBRC Project
ACKNOWLEDGEMENTS
The authors are grateful for the financial and in-kind support provided by:
PCI through a 2003-2004 D.P. Jenny Research Fellowship.MDOT and FHWA through a 2005 IBRC Project.The Premarc Corp. – in-kind labor and materialsDegussa Admixtures Inc. – technical support and materialsThe CEE Department at Michigan State University

22
ACKNOWLEDGEMENTS
The authors also gratefully acknowledge the collaborating effort and many fruitful discussions with:
Mr. Armand Atienza (Formerly with Degussa)Mr. Doug Burnett (Formerly with Degussa)Mr. Tom Grumbine (Premarc)Mr. Don Logan (Stresscon)Mr. Horacio Lopez (Premarc)Dr. Charles Nmai (Degussa)Mr. Fernando Roldan (Premarc)Mr. Roger Till (MDOT)Mr. Chad Woodward (Degussa)
ACKNOWLEDGEMENTS
The experimental work for the presented projects was conducted at MSU’s Civil Infrastructure Laboratory. The work could not have been possible with the aide and assistance of it’s staff and student researchers, including:
Mr. David Bendert Mr. James BrentonMr. Steven FranckowiakMr. Mahmoodul HaqMr. Siavosh Ravanbakhsh