8. t h op eterogeneity management d t … · this empirical study uses a panel smooth transition...
TRANSCRIPT
Romanian Journal of Economic Forecasting – XVIII (1) 2015 129
TOP MANAGEMENT TEAM HETEROGENEITY, DIVERSIFICATION, AND CORPORATE PERFORMANCE: A PANEL SMOOTH TRANSITION
REGRESSION MODEL1
Weining LI2 Sen ZHANG3 Jing ZHANG4
Abstract
This empirical study uses a panel smooth transition regression (PSTR) model to investigate the nonlinear relationship between top management team (TMT) heterogeneity and corporate performance based on a sample of 117 publicly traded companies in China from 2000-2012. The results show that there is a nonlinear relationship between TMT heterogeneity and corporate performance that depends on the company’s degree of diversification. Specifically, when the degree of diversification is lower than the threshold of 0.5647 (i.e., when a company uses a single business or dominant business strategy), heterogeneity in education level and educational background is negatively correlated with corporate performance. When the degree of diversification is higher than the threshold of 0.5647 (i.e., when a company uses a related or unrelated diversification strategy), education-level heterogeneity and corporate performance are positively correlated, whereas age heterogeneity and corporate performance are negatively correlated. Keywords: heterogeneity, diversification, corporate performance, panel smooth
transition regression model, nonlinear JEL Classification: G34, M54 1 This study was presented at 2014 Global Economy & Governance Conference, September
2014, Romania. 2 School of Business Administration, South China University of Technology Guangzhou, China.
Email: [email protected]. 3 School of Business Administration, South China University of Technology Guangzhou, China.
Email: [email protected]. 4 Library, South China University of Technology Guangzhou, China. Email:
8.
Institute for Economic Forecasting
Romanian Journal of Economic Forecasting –XVIII (1) 2015 130
1. Introduction
After Hambrick and Mason (1984) proposed the upper echelons theory in 1984, the focus of strategic leadership research gradually shifted from the individual level to the entire top management team (hereafter, TMT). The TMT comprises the highest ranking executives of a firm, i.e., executives at the vice president level or higher. TMT members are responsible for the most important strategic decisions of the organization, such as the formulation and implementation of corporate goals and policies (Hambrick et al., 1996). The upper echelons theory is the theoretical basis for TMT research. Demographic variables, including gender, age, tenure, educational background and professional experience, among others, are important variables in TMT research because there is a close relationship between these variables and a TMT’s values and cognitive abilities (Hambrick et al., 1996). According to Carpenter (2002), the variances in demographic variables among TMT members – as opposed to the variables’ average levels – can effectively indicate the TMT’s communication and collaboration capabilities. Such variances can also directly or indirectly reflect a TMT’s ability to acquire and filter market information (Finkelstein and Hambrick, 1996) and thus impact the strategy selection and execution capabilities of the TMT. TMT heterogeneity has two dimensions. The first dimension comprises differences in the TMT’s demographic characteristics (e.g., gender, age, tenure and educational background). The second dimension encompasses differences in socio-psychological characteristics, including cognitive functions, values and experiences (Blau, 1977; Jackson et al., 1991). The existing literature suggests that demographic characteristics are indicative of socio-psychological characteristics. For example, an individual’s age reflects his or her social experiences and resources, and educational background reflects an individual’s cognitive and professional capabilities. Accordingly, demographic characteristics have been used in the research of TMTs’ socio-psychological characteristics. For example, Carpenter and Fredricksen used education-level heterogeneity to measure heterogeneity in cognitive processes in their study of the relationship between TMT characteristics and global strategic postures (Carpenter and Fredrichson, 2001). The core issue of TMT heterogeneity is its relationship to corporate performance; however, a consistent conclusion about this relationship has yet to be drawn in the research. The resource-based view suggests that a firm is a collection of resources that can be transformed into unique capabilities; when effectively utilized, a firm’s resources are the key ingredient in a company’s competitiveness (Wernerfelt, 1984). Because TMT capability is the core resource of a firm, it has a direct impact on a firm’s competitiveness. When TMT heterogeneity is high, i.e., there are vast difference among TMT members’ background experiences, cognitive abilities and values, TMT members are more complementary to one another in terms of resources and capabilities. This complementary effect further enhances the firm’s core resources and capabilities and thereby promotes the performance of both the TMT and the firm. Theories on information and decision making suggests that the quality of decision making depends on the quantity and quality of information available at the time the decision is made; more and better information leads to better decisions. TMT heterogeneity in areas such as educational background and tenure reflects differences
Top Management Team Heterogeneity, Diversification
Romanian Journal of Economic Forecasting – XVIII (1) 2015 131
in TMT members’ knowledge, experience and capabilities, as well as differences in their perceptions and understandings of the firm’s internal and external environments (Katz, 1982). In addition, there are differences in the relationship networks and methods of information acquisition among TMT members. Differences among TMT members can provide more diversified information for TMT decision making and improve the firm’s knowledge utilization capabilities. Therefore, according to the information and decision-making theory, TMT heterogeneity enhances the TMT’s capability to screen and understand information (Zhang Ping, 2006) and thereby promotes organizational improvement and development (Cox, 1994). However, the social identity theory suggests that team members tend to show in-group favoritism (that is, they give preferential treatment to individuals they perceive to be in the same social group) to satisfy their need for positive distinctiveness (Tajfel, 1981). According to the social identity theory, TMT members of homogeneous backgrounds and experiences tend to have better cooperation among them. Close similarities in values and cognition models among homogeneous TMT members enable the TMT to make quick and effective decisions, thereby enhancing corporate performance. On the contrary, TMT members of heterogeneous backgrounds have cognitive variances among them and tend to disagree about interpretations of and responses to strategic issues. Heterogeneous TMT members tend to form different social groups within the TMT and to develop prejudices against the other TMT groups of which they are not members, which decreases the cooperation effectiveness of the TMT. Thus, contradictions are apparent among the different theories of the relationship between TMT heterogeneity and corporate performance, and a consensus has yet to emerge in the empirical research. On the one hand, Kathleen and Schoonhoven (1990) studied semi-conductor companies in the United States and found that TMT heterogeneity and corporate growth are positively correlated. Similarly, Nielsen’s (Nielsen B.B. and Nielsen S., 2011) research indicated that a heterogeneous TMT possesses extensive knowledge and abilities that enable the firm to respond rationally to various challenges and to move effectively towards globalization. On the other hand, Knight’s (1999) study of 76 high-tech corporations in the United States and Ireland found that heterogeneity in educational background and age is not conducive to the formation of strategic consensus and has a negative impact on decision-making efficiency and corporate performance. In addition, Velinov and Kubicek (2013) studied a sample of 37 IPOs in Europe between 2008 and 2012 and found no correlation between corporate performance and heterogeneity in age and tenure. Based on these inconsistent conclusions, Carpenter (2002) suggested that the impact of some important moderator or mediating variables should be considered. Such variables come primarily from the social environment in which the organization is based. Furthermore, Hambrick and Mason (1984) noted that industry characteristics should be considered in TMT research because the relationship between corporate performance and the professional experience and tenure of TMT members is different for different industry environments. The latest research shows that TMT heterogeneity impacts corporate performance differently depending on the degree of diversification because diversification affects the specific resources and abilities required by the firm (He and Yang, 2010). In a diversified business environment, companies face competitive pressures from various types of businesses. The members of a TMT with
Institute for Economic Forecasting
Romanian Journal of Economic Forecasting –XVIII (1) 2015 132
high heterogeneity in background and experience possess different cognitive styles and abilities; hence, they are capable of providing a variety of perspectives and can develop a greater variety of options to respond to competitive challenges. Consequently, the effective knowledge-utilization capabilities of a heterogeneous TMT enable the firm to secure a competitive edge in a dynamic environment. However, cognitive diversity in a heterogeneous group can lead to disagreements among TMT members. If these disagreements become emotional conflicts, productive arguments can degenerate into endless dysfunctional in-fighting and the firm will suffer as a result of missed opportunities in the ever-changing competitive environment. On the contrary, similar values and cognitive styles among homogeneous TMT members enhance mutual trust, resulting in a cohesive team (Lu et al., 2013). Cohesion among TMT members is conducive to quick and unanimous decision making in a diversified business environment, which enables the company to grasp fleeting market opportunities. However, excessive homogeneity is likely to increase members’ rejection of external forces, which will counteract TMT brainstorming and inhibit acceptance of new ideas. A diversified firm is essentially a nonlinear feedback system because there is no fixed proportion or cause-and-effect relationship among the business units. Individual business units use this nonlinear feedback to adjust their respective business strategies in order to achieve sustained corporate growth and development (Zhang Ping, 2008). In a diversified operational environment, the relationship between TMT heterogeneity and firm performance does not remain constant but changes as the degree of diversification changes. Moreover, although the relationship between TMT heterogeneity and corporate performance should be characterized as nonlinear processes, previous research has been based on a linear relationship between them. This may explain the inconsistent findings of previous studies. This study supplements previous research on TMT heterogeneity using data on TMT members’ differences in education level, educational background, age and tenure at 117 publicly traded companies in Shanghai and Shenzhen between 2000 and 2012. This study uses the recently developed panel smooth transition regression (PSTR) model of Gonzales et al. (2005) to analyze the nonlinear relationship between TMT heterogeneity and corporate performance in a diversified operational environment. The PSTR model not only effectively portrays the cross-sectional change of heterogeneity in the panel data but also allows model parameters to change in a smooth, nonlinear manner as the transition variables change. Hence, it is possible to determine whether the relationship between TMT heterogeneity and corporate performance changes in a nonlinear manner when the degree of diversification changes.
2. The Panel Smooth Transition Regression Model
This study uses the PSTR model of Gonzales et al. (2005) to explore whether the relationship between TMT heterogeneity and corporate performance exhibits nonlinear changes in response to changes in the degree of diversification. The PSTR model not only effectively portrays the cross-sectional change of heterogeneity in the panel data

Top Management Team Heterogeneity, Diversification
Romanian Journal of Economic Forecasting – XVIII (1) 2015 133
but also allows model parameters to change in a smooth, nonlinear manner as the transition variables change. A PSTR model with a transition variable is defined as follows:
for i=1, 2...N, and t=1, 2...T, where N and T represent the cross-section and time dimensions of the panel, respectively. Dependent variable yit is a scalar; explanatory variable xit is a k-dimensional column vector; μi is the fixed effect; and εit is the residual. The transition function g(qit;γ,c) is the continuous function of the transition variable qit and is normalized to be bounded between 0 and 1. The logistic specification is:
where: γ>0 and c1≤c2≤…≤cm. Slope parameter γ determines the smoothness of the transitions; c is the location parameter; and m generally equals 1 or 2. When m=1, the transition function ; ,itg q c is logistic, and it increases with the
transition variable qit. When =0, the corresponding model (1) is called the low regime; when =1, it is called the high regime. As the value of the transition function changes smoothly between 0 and 1, the model (1) changes smoothly between the high and low regimes at transition point c. The corresponding explanatory variable coefficient also changes between β0 and β0+β1 as qit increases, where the change is centered at c. When m=2, the transition function is indexical. Model (1) is divided into two outer regimes and one middle regime, and the transition function has its smallest value at (c1+c2)/2. When =1, the model is in the outer regime. When =0, the model is in the middle regime. Before making estimations with a PSTR model, a homogeneity test must be conducted to determine whether the correlation among the variables is linear. If homogeneity is rejected, the PSTR model can be used for estimation; if homogeneity is not rejected, a linear model should be used. Although a homogeneity test is usually performed using the null hypothesis H0:γ=0 or H0:β1=0, the PSTR model contains unidentified nuisance parameters under both of these hypotheses. Therefore, this study follows Luukkonen et al. to solve the identification problem. Specifically, the transition function is replaced by its first-order Taylor expression around γ=0, which leads to the following auxiliary regression after reparameterization:
Consequently, testing H0:γ=0 is equivalent to testing H0: = =0. A rejection of the null hypothesis indicates that the model is a PSTR model with at least one transition function (Luukkonen et al., 1988).
Institute for Economic Forecasting
Romanian Journal of Economic Forecasting –XVIII (1) 2015 134
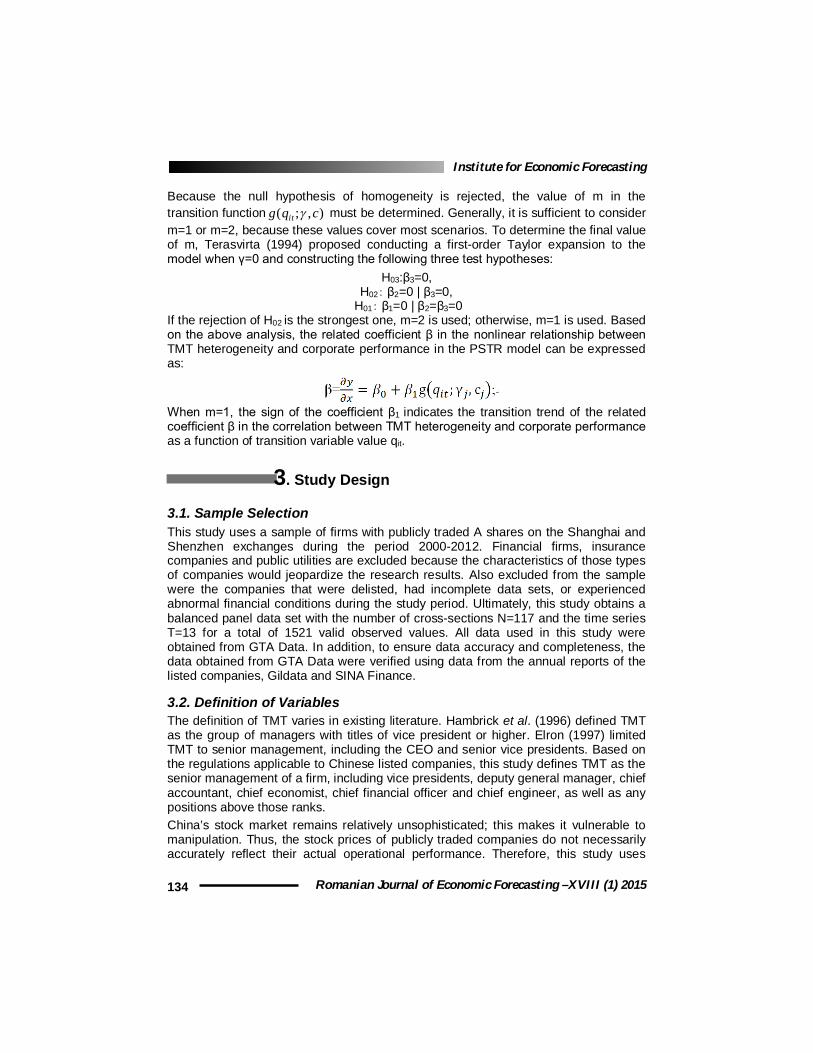
Because the null hypothesis of homogeneity is rejected, the value of m in the transition function ),;( cqg it must be determined. Generally, it is sufficient to consider m=1 or m=2, because these values cover most scenarios. To determine the final value of m, Terasvirta (1994) proposed conducting a first-order Taylor expansion to the model when γ=0 and constructing the following three test hypotheses:
H03:β3=0, H02: β2=0 | β3=0,
H01: β1=0 | β2=β3=0 If the rejection of H02 is the strongest one, m=2 is used; otherwise, m=1 is used. Based on the above analysis, the related coefficient β in the nonlinear relationship between TMT heterogeneity and corporate performance in the PSTR model can be expressed as:
When m=1, the sign of the coefficient β1 indicates the transition trend of the related coefficient β in the correlation between TMT heterogeneity and corporate performance as a function of transition variable value qit.
3. Study Design
3.1. Sample Selection This study uses a sample of firms with publicly traded A shares on the Shanghai and Shenzhen exchanges during the period 2000-2012. Financial firms, insurance companies and public utilities are excluded because the characteristics of those types of companies would jeopardize the research results. Also excluded from the sample were the companies that were delisted, had incomplete data sets, or experienced abnormal financial conditions during the study period. Ultimately, this study obtains a balanced panel data set with the number of cross-sections N=117 and the time series T=13 for a total of 1521 valid observed values. All data used in this study were obtained from GTA Data. In addition, to ensure data accuracy and completeness, the data obtained from GTA Data were verified using data from the annual reports of the listed companies, Gildata and SINA Finance.
3.2. Definition of Variables The definition of TMT varies in existing literature. Hambrick et al. (1996) defined TMT as the group of managers with titles of vice president or higher. Elron (1997) limited TMT to senior management, including the CEO and senior vice presidents. Based on the regulations applicable to Chinese listed companies, this study defines TMT as the senior management of a firm, including vice presidents, deputy general manager, chief accountant, chief economist, chief financial officer and chief engineer, as well as any positions above those ranks. China’s stock market remains relatively unsophisticated; this makes it vulnerable to manipulation. Thus, the stock prices of publicly traded companies do not necessarily accurately reflect their actual operational performance. Therefore, this study uses
Top Management Team Heterogeneity, Diversification
Romanian Journal of Economic Forecasting – XVIII (1) 2015 135
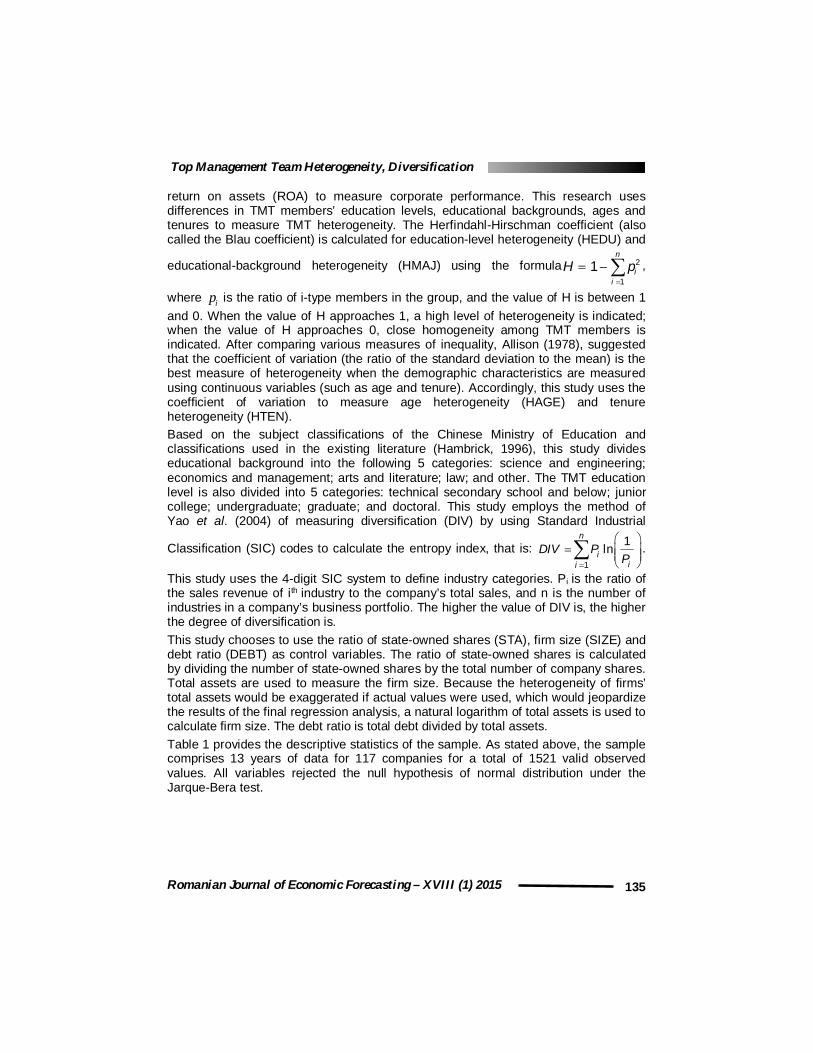
return on assets (ROA) to measure corporate performance. This research uses differences in TMT members’ education levels, educational backgrounds, ages and tenures to measure TMT heterogeneity. The Herfindahl-Hirschman coefficient (also called the Blau coefficient) is calculated for education-level heterogeneity (HEDU) and
educational-background heterogeneity (HMAJ) using the formula
n
iipH
1
21 ,
where ip is the ratio of i-type members in the group, and the value of H is between 1 and 0. When the value of H approaches 1, a high level of heterogeneity is indicated; when the value of H approaches 0, close homogeneity among TMT members is indicated. After comparing various measures of inequality, Allison (1978), suggested that the coefficient of variation (the ratio of the standard deviation to the mean) is the best measure of heterogeneity when the demographic characteristics are measured using continuous variables (such as age and tenure). Accordingly, this study uses the coefficient of variation to measure age heterogeneity (HAGE) and tenure heterogeneity (HTEN). Based on the subject classifications of the Chinese Ministry of Education and classifications used in the existing literature (Hambrick, 1996), this study divides educational background into the following 5 categories: science and engineering; economics and management; arts and literature; law; and other. The TMT education level is also divided into 5 categories: technical secondary school and below; junior college; undergraduate; graduate; and doctoral. This study employs the method of Yao et al. (2004) of measuring diversification (DIV) by using Standard Industrial
Classification (SIC) codes to calculate the entropy index, that is:
1
1lnn
iii
DIV PP
.
This study uses the 4-digit SIC system to define industry categories. Pi is the ratio of the sales revenue of ith industry to the company’s total sales, and n is the number of industries in a company’s business portfolio. The higher the value of DIV is, the higher the degree of diversification is. This study chooses to use the ratio of state-owned shares (STA), firm size (SIZE) and debt ratio (DEBT) as control variables. The ratio of state-owned shares is calculated by dividing the number of state-owned shares by the total number of company shares. Total assets are used to measure the firm size. Because the heterogeneity of firms’ total assets would be exaggerated if actual values were used, which would jeopardize the results of the final regression analysis, a natural logarithm of total assets is used to calculate firm size. The debt ratio is total debt divided by total assets. Table 1 provides the descriptive statistics of the sample. As stated above, the sample comprises 13 years of data for 117 companies for a total of 1521 valid observed values. All variables rejected the null hypothesis of normal distribution under the Jarque-Bera test.
Institute for Economic Forecasting
Romanian Journal of Economic Forecasting –XVIII (1) 2015 136
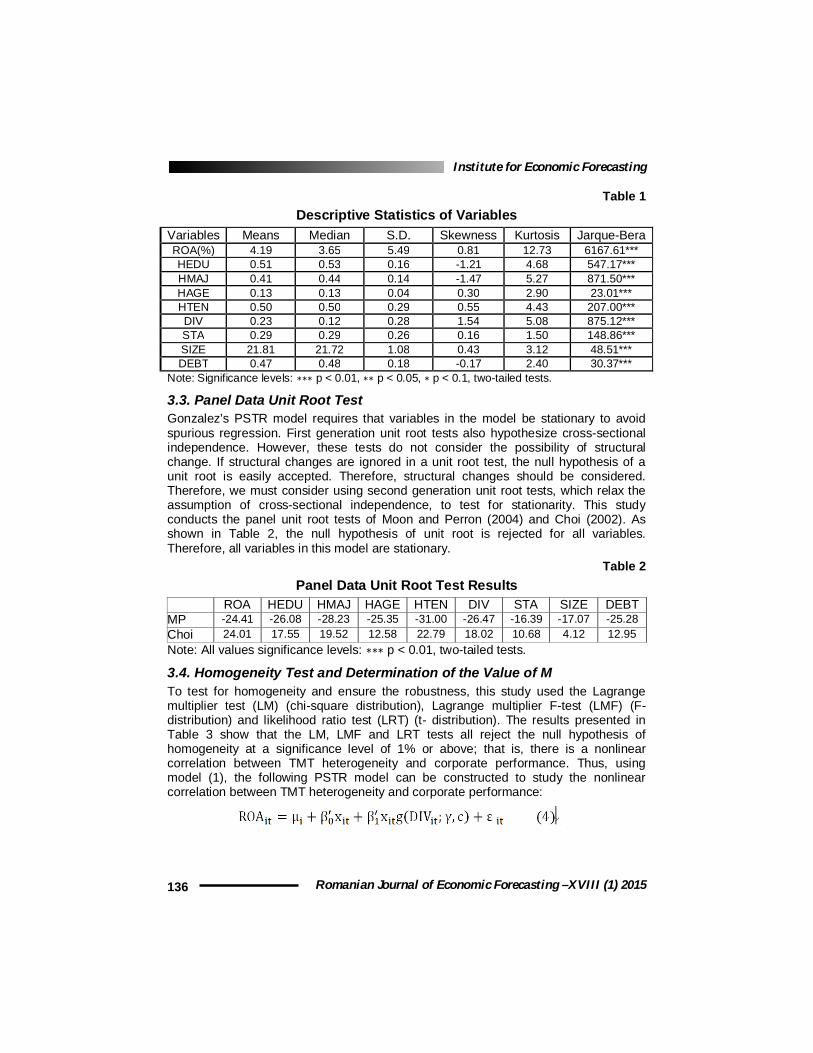
Table 1 Descriptive Statistics of Variables
Variables Means Median S.D. Skewness Kurtosis Jarque-Bera ROA(%) 4.19 3.65 5.49 0.81 12.73 6167.61*** HEDU 0.51 0.53 0.16 -1.21 4.68 547.17*** HMAJ 0.41 0.44 0.14 -1.47 5.27 871.50*** HAGE 0.13 0.13 0.04 0.30 2.90 23.01*** HTEN 0.50 0.50 0.29 0.55 4.43 207.00*** DIV 0.23 0.12 0.28 1.54 5.08 875.12*** STA 0.29 0.29 0.26 0.16 1.50 148.86*** SIZE 21.81 21.72 1.08 0.43 3.12 48.51*** DEBT 0.47 0.48 0.18 -0.17 2.40 30.37***
Note: Significance levels: ∗∗∗ p < 0.01, ∗∗ p < 0.05, ∗ p < 0.1, two-tailed tests.
3.3. Panel Data Unit Root Test Gonzalez’s PSTR model requires that variables in the model be stationary to avoid spurious regression. First generation unit root tests also hypothesize cross-sectional independence. However, these tests do not consider the possibility of structural change. If structural changes are ignored in a unit root test, the null hypothesis of a unit root is easily accepted. Therefore, structural changes should be considered. Therefore, we must consider using second generation unit root tests, which relax the assumption of cross-sectional independence, to test for stationarity. This study conducts the panel unit root tests of Moon and Perron (2004) and Choi (2002). As shown in Table 2, the null hypothesis of unit root is rejected for all variables. Therefore, all variables in this model are stationary.
Table 2 Panel Data Unit Root Test Results
ROA HEDU HMAJ HAGE HTEN DIV STA SIZE DEBT MP -24.41 -26.08 -28.23 -25.35 -31.00 -26.47 -16.39 -17.07 -25.28 Choi 24.01 17.55 19.52 12.58 22.79 18.02 10.68 4.12 12.95 Note: All values significance levels: ∗∗∗ p < 0.01, two-tailed tests.
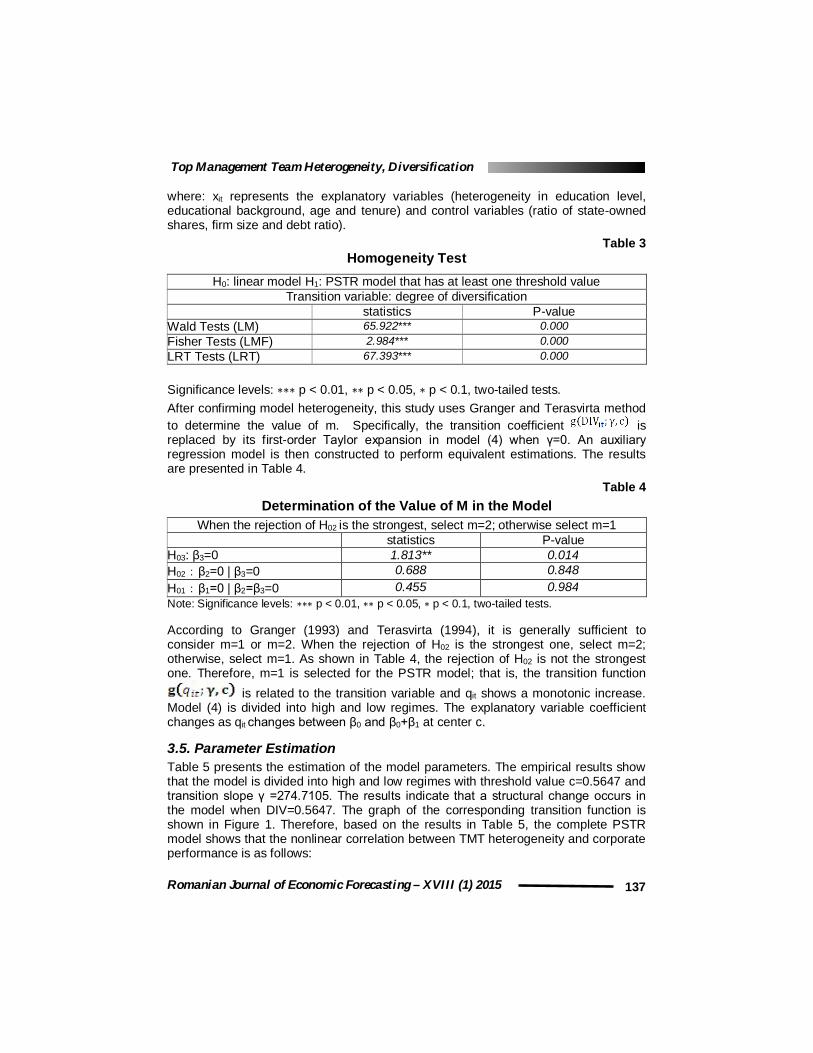
3.4. Homogeneity Test and Determination of the Value of M To test for homogeneity and ensure the robustness, this study used the Lagrange multiplier test (LM) (chi-square distribution), Lagrange multiplier F-test (LMF) (F-distribution) and likelihood ratio test (LRT) (t- distribution). The results presented in Table 3 show that the LM, LMF and LRT tests all reject the null hypothesis of homogeneity at a significance level of 1% or above; that is, there is a nonlinear correlation between TMT heterogeneity and corporate performance. Thus, using model (1), the following PSTR model can be constructed to study the nonlinear correlation between TMT heterogeneity and corporate performance:
Top Management Team Heterogeneity, Diversification
Romanian Journal of Economic Forecasting – XVIII (1) 2015 137
where: xit represents the explanatory variables (heterogeneity in education level, educational background, age and tenure) and control variables (ratio of state-owned shares, firm size and debt ratio).
Table 3 Homogeneity Test
H0: linear model H1: PSTR model that has at least one threshold value Transition variable: degree of diversification
statistics P-value Wald Tests (LM) 65.922*** 0.000 Fisher Tests (LMF) 2.984*** 0.000 LRT Tests (LRT) 67.393*** 0.000 Significance levels: ∗∗∗ p < 0.01, ∗∗ p < 0.05, ∗ p < 0.1, two-tailed tests. After confirming model heterogeneity, this study uses Granger and Terasvirta method to determine the value of m. Specifically, the transition coefficient is replaced by its first-order Taylor expansion in model (4) when γ=0. An auxiliary regression model is then constructed to perform equivalent estimations. The results are presented in Table 4.
Table 4 Determination of the Value of M in the Model
When the rejection of H02 is the strongest, select m=2; otherwise select m=1 statistics P-value H03: β3=0 1.813** 0.014 H02:β2=0 | β3=0 0.688 0.848 H01:β1=0 | β2=β3=0 0.455 0.984 Note: Significance levels: ∗∗∗ p < 0.01, ∗∗ p < 0.05, ∗ p < 0.1, two-tailed tests. According to Granger (1993) and Terasvirta (1994), it is generally sufficient to consider m=1 or m=2. When the rejection of H02 is the strongest one, select m=2; otherwise, select m=1. As shown in Table 4, the rejection of H02 is not the strongest one. Therefore, m=1 is selected for the PSTR model; that is, the transition function is related to the transition variable and qit shows a monotonic increase. Model (4) is divided into high and low regimes. The explanatory variable coefficient changes as qit changes between β0 and β0+β1 at center c.
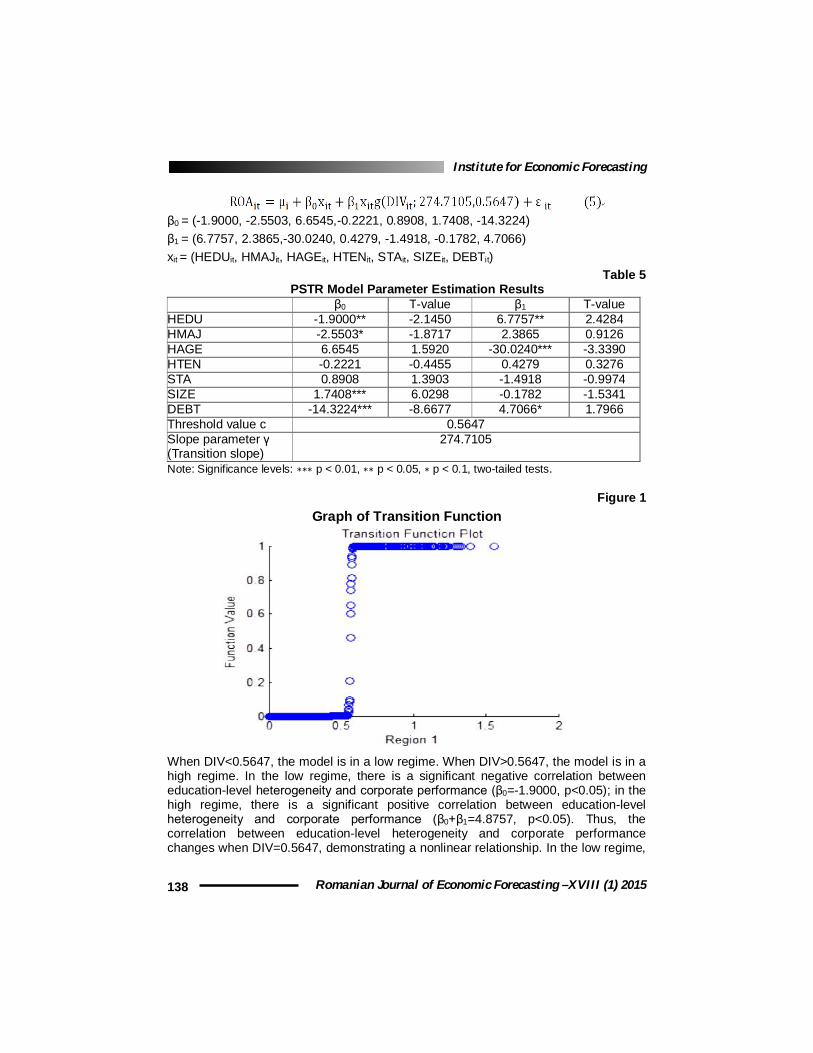
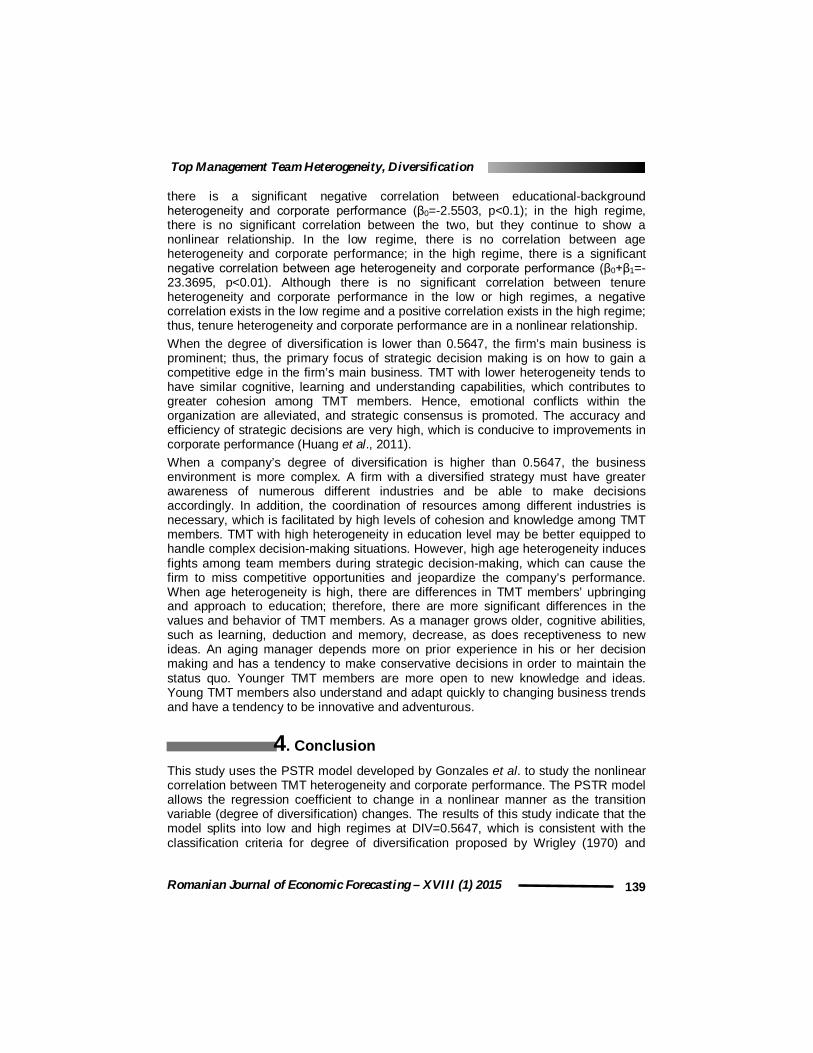
3.5. Parameter Estimation Table 5 presents the estimation of the model parameters. The empirical results show that the model is divided into high and low regimes with threshold value c=0.5647 and transition slope γ =274.7105. The results indicate that a structural change occurs in the model when DIV=0.5647. The graph of the corresponding transition function is shown in Figure 1. Therefore, based on the results in Table 5, the complete PSTR model shows that the nonlinear correlation between TMT heterogeneity and corporate performance is as follows:
Institute for Economic Forecasting
Romanian Journal of Economic Forecasting –XVIII (1) 2015 138
β0 = (-1.9000, -2.5503, 6.6545,-0.2221, 0.8908, 1.7408, -14.3224) β1 = (6.7757, 2.3865,-30.0240, 0.4279, -1.4918, -0.1782, 4.7066) xit = (HEDUit, HMAJit, HAGEit, HTENit, STAit, SIZEit, DEBTit)
Table 5 PSTR Model Parameter Estimation Results β0 T-value β1 T-value HEDU -1.9000** -2.1450 6.7757** 2.4284 HMAJ -2.5503* -1.8717 2.3865 0.9126 HAGE 6.6545 1.5920 -30.0240*** -3.3390 HTEN -0.2221 -0.4455 0.4279 0.3276 STA 0.8908 1.3903 -1.4918 -0.9974 SIZE 1.7408*** 6.0298 -0.1782 -1.5341 DEBT -14.3224*** -8.6677 4.7066* 1.7966 Threshold value c 0.5647 Slope parameter γ (Transition slope)
274.7105
Note: Significance levels: ∗∗∗ p < 0.01, ∗∗ p < 0.05, ∗ p < 0.1, two-tailed tests.
Figure 1 Graph of Transition Function
When DIV<0.5647, the model is in a low regime. When DIV>0.5647, the model is in a high regime. In the low regime, there is a significant negative correlation between education-level heterogeneity and corporate performance (β0=-1.9000, p<0.05); in the high regime, there is a significant positive correlation between education-level heterogeneity and corporate performance (β0+β1=4.8757, p<0.05). Thus, the correlation between education-level heterogeneity and corporate performance changes when DIV=0.5647, demonstrating a nonlinear relationship. In the low regime,
Top Management Team Heterogeneity, Diversification
Romanian Journal of Economic Forecasting – XVIII (1) 2015 139
there is a significant negative correlation between educational-background heterogeneity and corporate performance (β0=-2.5503, p<0.1); in the high regime, there is no significant correlation between the two, but they continue to show a nonlinear relationship. In the low regime, there is no correlation between age heterogeneity and corporate performance; in the high regime, there is a significant negative correlation between age heterogeneity and corporate performance (β0+β1=-23.3695, p<0.01). Although there is no significant correlation between tenure heterogeneity and corporate performance in the low or high regimes, a negative correlation exists in the low regime and a positive correlation exists in the high regime; thus, tenure heterogeneity and corporate performance are in a nonlinear relationship. When the degree of diversification is lower than 0.5647, the firm’s main business is prominent; thus, the primary focus of strategic decision making is on how to gain a competitive edge in the firm’s main business. TMT with lower heterogeneity tends to have similar cognitive, learning and understanding capabilities, which contributes to greater cohesion among TMT members. Hence, emotional conflicts within the organization are alleviated, and strategic consensus is promoted. The accuracy and efficiency of strategic decisions are very high, which is conducive to improvements in corporate performance (Huang et al., 2011). When a company’s degree of diversification is higher than 0.5647, the business environment is more complex. A firm with a diversified strategy must have greater awareness of numerous different industries and be able to make decisions accordingly. In addition, the coordination of resources among different industries is necessary, which is facilitated by high levels of cohesion and knowledge among TMT members. TMT with high heterogeneity in education level may be better equipped to handle complex decision-making situations. However, high age heterogeneity induces fights among team members during strategic decision-making, which can cause the firm to miss competitive opportunities and jeopardize the company’s performance. When age heterogeneity is high, there are differences in TMT members’ upbringing and approach to education; therefore, there are more significant differences in the values and behavior of TMT members. As a manager grows older, cognitive abilities, such as learning, deduction and memory, decrease, as does receptiveness to new ideas. An aging manager depends more on prior experience in his or her decision making and has a tendency to make conservative decisions in order to maintain the status quo. Younger TMT members are more open to new knowledge and ideas. Young TMT members also understand and adapt quickly to changing business trends and have a tendency to be innovative and adventurous.
4. Conclusion
This study uses the PSTR model developed by Gonzales et al. to study the nonlinear correlation between TMT heterogeneity and corporate performance. The PSTR model allows the regression coefficient to change in a nonlinear manner as the transition variable (degree of diversification) changes. The results of this study indicate that the model splits into low and high regimes at DIV=0.5647, which is consistent with the classification criteria for degree of diversification proposed by Wrigley (1970) and
Institute for Economic Forecasting
Romanian Journal of Economic Forecasting –XVIII (1) 2015 140
Rumelt (1974). When DIV<0.5647, the model is in a low regime (the share of total income represented by the company’s primary business is greater than 70%; i.e., the company has a single-business or dominant business strategy). When DIV>0.5647, model is in a high regime (the share of total income represented by the company’s primary business is less than 70%, which is consistent with the related and unrelated diversification strategies proposed by Wrigley and Rumelt). In both low and high regimes, the type and number of industries in a company’s business portfolio are different; therefore, the impact of TMT heterogeneity on corporate performance exhibits nonlinear changes. Based on findings from our research, in a diversified operational environment, the relationship between TMT heterogeneity and firm performance does not remain constant but changes as the degree of diversification changes. Moreover, although the relationship between TMT heterogeneity and corporate performance should be characterized as nonlinear processes, previous research has been based on a linear relationship between them. This study uses the panel data of 117 publicly traded companies in Shanghai and Shenzhen over a period of 13 years and applies a PSTR model to investigate the nonlinear correlation between TMT heterogeneity and performance. This study not only provides a new perspective to TMT research, both theoretically and methodologically, supplements and enriches existing TMT research, and reveals the relationships among TMT heterogeneity, diversification and company performance, but also provides practical guidance to companies that seek to select TMT members who can adapt to diversified strategies. However, this study has some limitations. The first limitation is that the use of TMT members’ duration in their current positions to measure tenure does not accurately reflect the TMT’s tenure characteristics. A TMT member may have had other senior positions in the company before assuming his or her current position. Therefore, measuring tenure based on a TMT member’s duration in a current position does not accurately reflect the cooperation and cohesiveness among TMT members. Future research might consider total time at the company or total time at the decision-making level to measure tenure. The second limitation is that this study uses degree of diversification as the transition variable without including other variables. In reality, there are other factors that affect the correlation between TMT heterogeneity and corporate performance, including variances in the characteristics of the company’s business environment or the external environment.
Acknowledgment
The authors would like to thank Professor Corina Saman, Professor Tsangyao Chang and the anonymous referees for their highly constructive comments. We acknowledge the financial support from National Natural Science Foundation of China (Grant No. 71172073; 71402022). These all make this paper more valuable and readable. Any errors that remain are our own.
Top Management Team Heterogeneity, Diversification
Romanian Journal of Economic Forecasting – XVIII (1) 2015 141
References
Allison, P., 1978. Measures of inequality. American Sociological Review, 43(4), pp. 865-880.
Blau, P.M, 1977.Inequality and Heterogeneity: A Primitive Theory of Social Structure. New York: Free Press.
Carpenter, M.A. and Fredrichson, J.W., 2001. Top management Teams, Global strategic Posture, and the Moderating Role of Uncertainty. Academy of Management Journal, 44, pp. 533-545.
Carpenter, M.A. Geletkanycz, M.A. and Sanders, W.G., 2002. Upper Echelons Research Revisited: Antecedents, Elements and Consequences of Top Management Team Composition. Journal of Management, 30(6), pp.749 -778.
Choi, I., 2002. Combination unit root tests for cross-sectionally correlated panels, Mimeo, Hong Kong University of Science and Technology.
Cox T., 1994. Cultural diversity in organizations: theory, research and practice. San Francisco: Berrett-Koehler Publishers.
Elron, E., 1997. Top Management Teams within Multi-national Corporations: Effects of Cultural Heterogeneity. Leadership Quarterly, 8(4), pp.393-412.
Velinov, E. and Kubicek, A., 2013. The Role of top Management Teams Heterogeneity in the IPO Process. European Conference on Management, Leadership & Governance, pp.325-331.
Finkelstein, S. and Hambrick, D.C., 1996. Strategic Leadership. Minneapolis /St Paul, MN: West Publishing.
Gonzalez, A. Terasvirta, T. and van Dijk, D., 2005. Panel Smooth Transition Regression Models, Quantitative Finance Research Centre, Research paper , 165, pp.1441-8010.
Hambrick, D.C. and Mason, P.A., 1984. Upper echelons: Organization as reflection of its managers. Academy Management Review, 9, pp. 193-206.
Hambrick, D.C. Cho, T.S. and Chen, M.J., 1996. The Influence of Top Management Team Heterogeneity on Firms Competitive Moves. Administrative Science Quarterly, 41(4), pp.659-684.
He, Y.Q. Yang, W., 2010., A Meta-analysis on the Relationship between Top Management Team Characteristics and Diversification Strategy. Chinese Journal of Management, 7(1), pp.91-97.
Huang, Y. Yang, N.D. and Zhang, C.L., 2011. Influence of the Top Management Team Heterogeneity and the Firm Performance: To Focus on Ownership Concentration. Management Review, 23(11), pp.120-125.
Jackson, S.E. et al., 1991. Some differences make a difference: individual dissimilarity and group heterogeneity as correlates of recruitment, promotions and turnover. Journal of Applied Psychology, 76, pp. 675-689.
Kathleen, M.E. Schoonhoven, C.B., 1990. Organizational growth: Linking founding team, strategy, environment, and growth among U.S. semiconductor ventures. Administrative Science Quarterly, (5), pp. 504-529.
Katz R., 1982. The effects of group on gevity on project communication and performance. Administrative Science Quarterly , 27(5), pp. 548-570.
Institute for Economic Forecasting
Romanian Journal of Economic Forecasting –XVIII (1) 2015 142
Knight, D. Pearce, C.L. and Smith K.G., 1999. Top Management Team Diversity, Group Process, and Strategic Consensus. Strategic Management Journal, 20(5), pp.445-465.
Lu, J. Xie, X.J. and Wu, M.Y., 2013. Research on Social Capital and Conflict Management Mechanism of Family Business’s Top Management Team. Asian Social Science, 9(11), pp.70-74.
Moon, H.R. and Perron, B., 2004. Testing for A Unit Root in Panels with Dynamic Factors. Journal of Econometrics, 122(1), pp. 81-126.
Luukkonen, R. Saikkonen , P. and Timoterasvirta, 1988b. Testing linearity against smooth transition autoregressive models. Oxford Journals, 75(3), pp. 491-499.
Rumelt, R.P., 1974. Strategy, Structure and Economic Performance. Boston: Harvard University Press, pp. 9-11.
Nielsen, B.B. and Nielsen, S., 2011. The role of top management team international orientation in international strategic decision making: The choice of foreign entry mode. Journal of World Business, 46(2), pp. 185-193.
Tajfel, H., 1981. Human groups and social categories. Cambridge: Cambridge University Press.
Terasvita, T., 1994. Specification, estimation and evaluation of smooth transition autoregressive models. Journal of the American Statistical Association, 89(425), pp. 208-218.
Wernerfelt, B., 1984. A Resourced-based View of the Firm. Strategic Management Journal, 5(2), pp. 171-180.
Wrigley , L.,1970. Divisional autonomy and diversification. Doctoral Dissertation: Harvard Business School.
Yao, J. Lu, Y. and Lan, H.L., 2004. An Empirical Study of the Relationship between Diversification and Economic Performance of Listed Companies of China. Management World, (11), pp. 119-135.
Zhang, P., 2006. Research on Relationship between Top Management Team Heterogeneity and Firm Performance in the Dynamic Competitive Environment. Science and Technology Management Research, (9), pp.167-170.
Zhang, P., 2008. Research on Relationship between Top Management Team Heterogeneity and Firm Performance in Diversification Context. Science of Science and Management of S&T, (2), pp.114-118.