8/25/20152 ” وهو الذى أرسل الرياح بشراً بين يدى رحمته ،...
TRANSCRIPT


04/19/2304/19/23 22
وهو الذى أرسل الرياح بشرا� وهو الذى أرسل الرياح بشرا� ” ”بين يدى رحمته ، وأنزلنا من بين يدى رحمته ، وأنزلنا من
السماء ماء� طهورا� ” الفرقان - السماء ماء� طهورا� ” الفرقان - 4848
And He it is Who sends the winds as heralds of glad tidings, going before His mercy, and We send down pure water from the sky,
04/19/2304/19/23 33
Wind Resource Wind Resource Assessment ProgramAssessment Program
Prepared byPrepared byEng. Ashour Abdelsalam MoussaEng. Ashour Abdelsalam Moussa
Wind Energy Dep.,Wind Energy Dep., New & Renewable Energy Authority New & Renewable Energy Authority
(NREA)(NREA)

04/19/2304/19/23 44
The World’s Energy The World’s Energy Resources Are Limited!Resources Are Limited!
04/19/2304/19/23 55
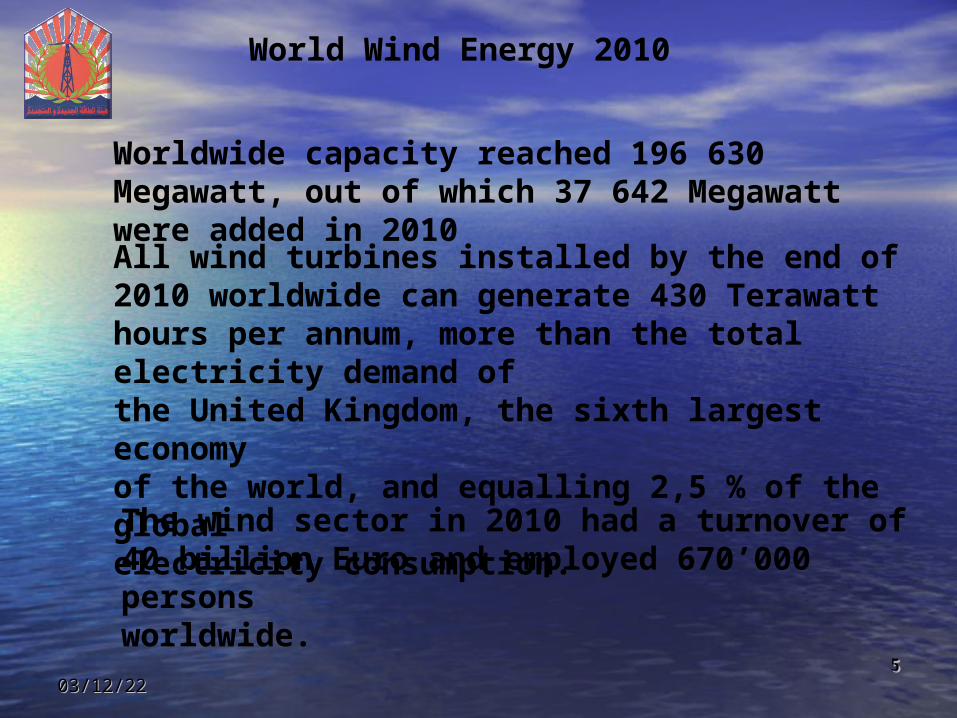
World Wind Energy 2010
Worldwide capacity reached 196 630 Megawatt, out of which 37 642 Megawatt were added in 2010All wind turbines installed by the end of 2010 worldwide can generate 430 Terawatt hours per annum, more than the total electricity demand ofthe United Kingdom, the sixth largest economyof the world, and equalling 2,5 % of the globalelectricity consumption.The wind sector in 2010 had a turnover of 40 billion Euro and employed 670’000 personsworldwide.

04/19/2304/19/23 66World Market Update 2009 March 2010 - Page 6
China became number one in total installed capacity and the center of the international wind industry, and added 18 928 Megawatt within one year, accounting for more than 50 % of the world market for new wind turbines.Germany keeps its number one position in Europe with 27 215 Megawatt, followed by Spain with 20 676 MW.

04/19/2304/19/23 77World Market Update 2009 March 2010 - Page 7

04/19/2304/19/23 88
Top-10 Suppliers in 2009
ENERCON (GE) 8.5%
GOLDWIND (PRC) 7.2%
DONGFANG (PRC) 6.5%
Others 18.5%
REPOWER (GE) 3.4%
SIEMENS (DK) 5.9%
SUZLON (IND) 6.4%
GAMESA (ES) 6.7%
VESTAS (DK) 12.5%
GE WIND (US) 12.4%
SINOVEL (PRC) 9.2%
Source: BTM Consult ApS - March 2010
% of the total market 38,103MW

04/19/2304/19/23 99
Wind

04/19/2304/19/23 1010
Why assess wind Why assess wind resourceresource
1.The Power in the wind is proportional to Cube 1.The Power in the wind is proportional to Cube of the wind speed (10% difference in wind of the wind speed (10% difference in wind speed makes about 33% change in wind speed makes about 33% change in wind power). This is the primary reason for wind power). This is the primary reason for wind resource assessment. resource assessment.
2.2.Wind speed, wind shear*, turbulence** and Wind speed, wind shear*, turbulence** and gust intensity all need to be specified when gust intensity all need to be specified when procuring a wind turbine and designing its procuring a wind turbine and designing its foundation….etc. foundation….etc.
*Wind shears (large differences in the mean wind speed over the rotor) give large fluctuating loads and consequently fatigue on the wind turbine blades, because the blades move through areas of varying wind speed.
**Turbulence causes dynamic loads on wind turbines. The strength of the turbulence varies from place to place. Over land the turbulence is
more intense than over the sea

04/19/2304/19/23 1111
3.3.Turbine manufacturers concerns max. Turbine manufacturers concerns max. turbulence intensity (16%), max. wind turbulence intensity (16%), max. wind shear acting on blade area (0.2) and shear acting on blade area (0.2) and max. one second gust used for max. one second gust used for foundation designfoundation design
Wind Resources assessments are the cornerstone of identifying and mitigating risks and for realizing the potential rewards from a project.
04/19/2304/19/23 1212
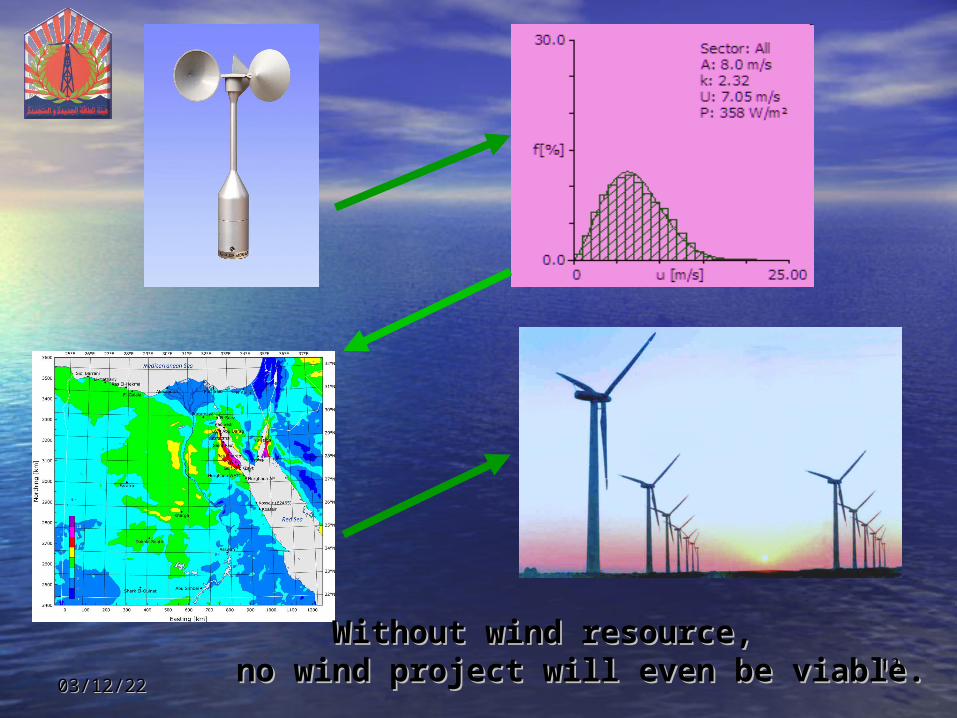
Without wind resource, Without wind resource, no wind project will even be viable.no wind project will even be viable.
04/19/2304/19/23 1313

04/19/2304/19/23 1414
04/19/2304/19/23 1515
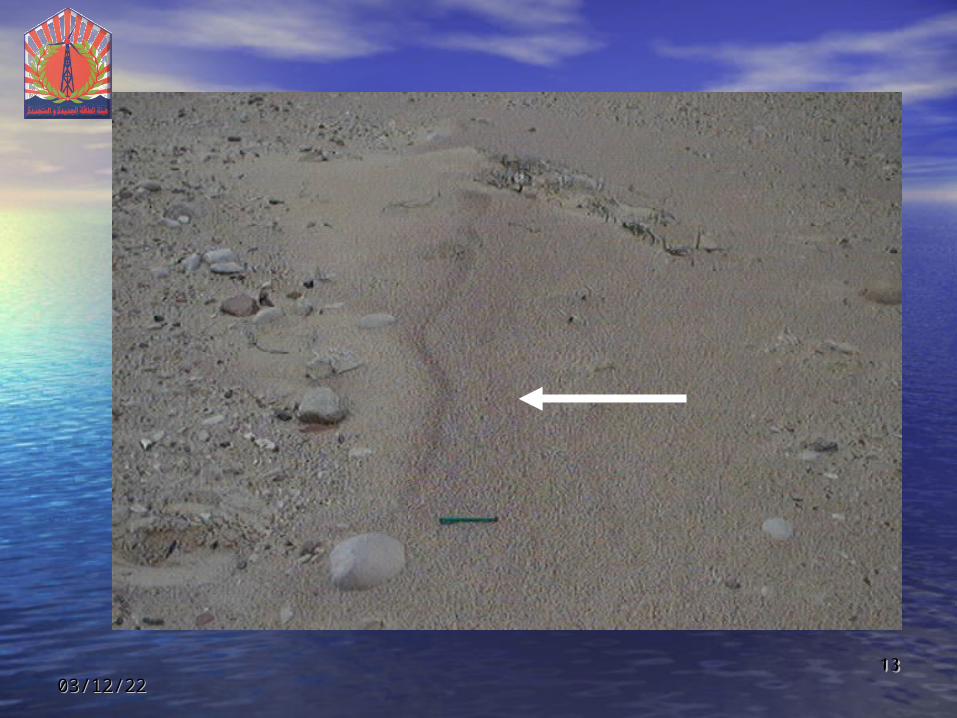
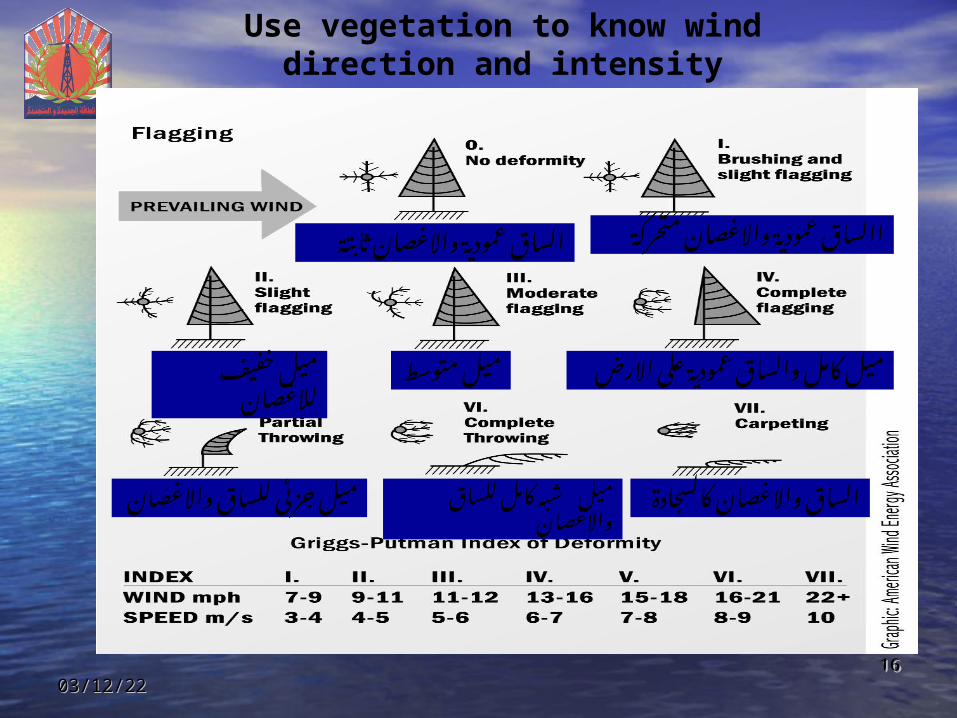
This index is based on the permanent tree deformation caused by wind and is useful for estimating the average wind speed in an area.
Griggs – Putman Wind Index
04/19/2304/19/23 1616
Use vegetation to know wind direction and intensity
خفيف ميللالغصان
ميل متوسط
على عمودية والساق كامل ميلاالرض
واالغصان عمودية الساقثابتة
واالغصان عمودية االساقمتحركة
للساق جزئى ميلواالغصان
للساق ميل كامل شبهواالغصان
واالغصان الساقكالسجادة

04/19/2304/19/23 1717
Prevailing Wind DirectionPrevailing Wind Direction
Important to check direction Important to check direction when setting up instrumentwhen setting up instrument

04/19/2304/19/23 1818
Information in the resource Information in the resource assessment will include :-assessment will include :-
• Daily average wind speedsDaily average wind speeds
• Monthly average wind Monthly average wind speedsspeeds• Annual Average wind speedsAnnual Average wind speeds
• Frequency distributionFrequency distribution
• Wind RoseWind Rose
• Wind power Wind power densitydensity• Turbulence intensityTurbulence intensity

04/19/2304/19/23 1919
The wind speed are binned, meaning that speed between 0 and 1 m/s are binned as 1 m/s, wind speeds between 1 and 2 m/s are binned as 2 m/s, and so on.
Frequency distribution
•The basic tool for estimate energy production.
•It shows the % of time that the
wind blowing at certain speed.

04/19/2304/19/23 2020
Frequency distribution Power Curve
Energy Production
+
To assess a site’s wind power production potential, the wind speed frequency distribution must be multiplied by a representative wind turbine power curve.
04/19/2304/19/23 2121
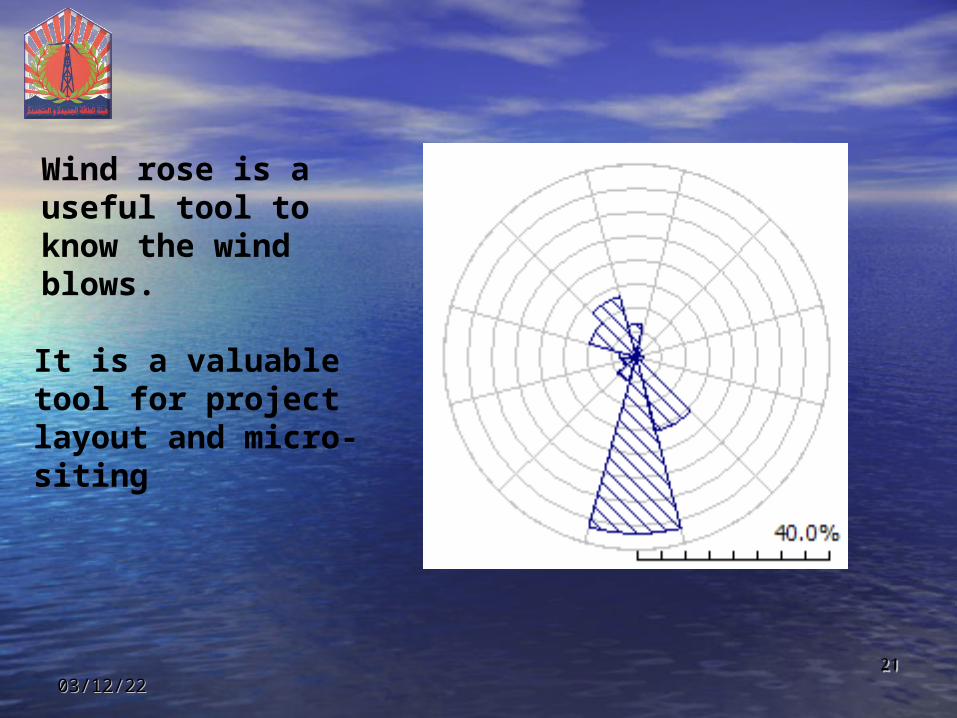
Wind rose is a useful tool to know the wind blows.
It is a valuable tool for project layout and micro-siting
04/19/2304/19/23 2222
Wind Power density (W/mWind Power density (W/m22))
• It is defined as the wind power available per It is defined as the wind power available per unit area swept by the turbine blades.unit area swept by the turbine blades.
• It is a true indication of wind energy It is a true indication of wind energy potential in the site than wind speed alone.potential in the site than wind speed alone.
• Its value combines wind speed distribution Its value combines wind speed distribution and air density.and air density.

04/19/2304/19/23 2323
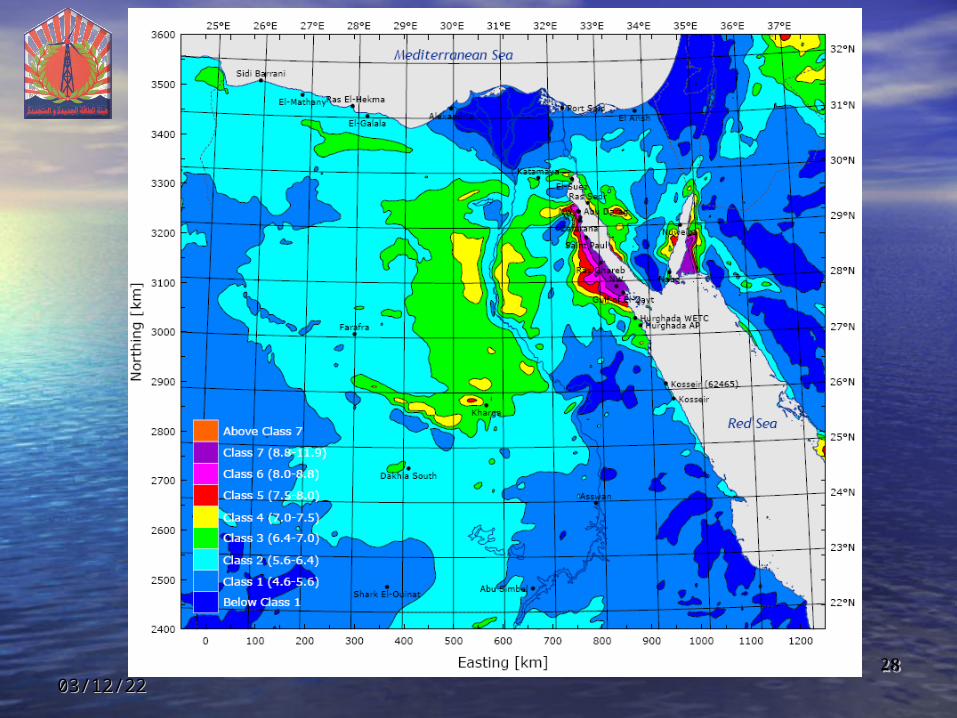
ClassClass ResourcePotential
Wind Power Wind Power density density w/m2w/m2
Wind Wind speed m/sspeed m/s
11 PoorPoor < 200< 200 < 5.6< 5.6
22 MarginalMarginal 200 – 300200 – 300 5.6 – 6.45.6 – 6.4
33 ModerateModerate 300 – 400300 – 400 6.7 – 76.7 – 7
44 GoodGood 400 – 500400 – 500 7 – 7.57 – 7.5
55 Very GoodVery Good 500 – 600500 – 600 7.5 – 87.5 – 8
66 ExcellentExcellent 600 – 800600 – 800 8 – 8.88 – 8.8
77 OutstandinOutstandingg
> 800 > 800
> 8.8> 8.8
Wind Power Class Wind Power Class TableTable

04/19/2304/19/23 2424
04/19/2304/19/23 2525
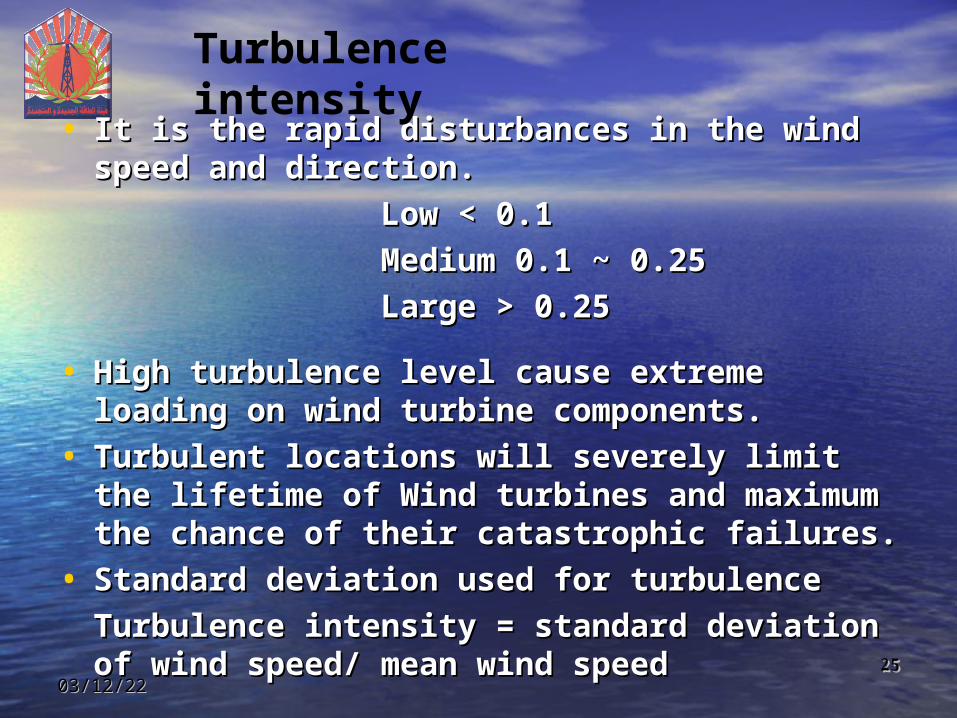
• It is the rapid disturbances in the wind It is the rapid disturbances in the wind speed and direction. speed and direction.
Low < 0.1Low < 0.1
Medium 0.1 ~ 0.25Medium 0.1 ~ 0.25
Large > 0.25Large > 0.25
• High turbulence level cause extreme High turbulence level cause extreme loading on wind turbine components. loading on wind turbine components.
• Turbulent locations will severely limit the Turbulent locations will severely limit the lifetime of Wind turbines and maximum the lifetime of Wind turbines and maximum the chance of their catastrophic failures.chance of their catastrophic failures.
• Standard deviation used for turbulenceStandard deviation used for turbulence
Turbulence intensity = standard deviation of Turbulence intensity = standard deviation of wind speed/ mean wind speedwind speed/ mean wind speed
Turbulence intensity

04/19/2304/19/23 2626
Standard deviation of wind speed calculation (σ)
•A number that indicates how much wind speed A number that indicates how much wind speed changes above or below the meanchanges above or below the mean
•Example :For set of data v1 =6 m/s n1= 19 times
v2 =7m/s n2= 54 times
v3=8 m/s n3= 42 times
Total Number of times occurrence (n) = 115
mean wind speed = (n1xv1 + n2xv2 + n3xv3)/n =
(19x6 +54x7 + 42x8)/ 115 = 7.2 m/s
σ2 =1/(n-1){(n1xv1^2 + n2xv2^2 + n3xv3^2) – 1/n (n1xv1 +n2xv2 +n3xv3)^2} =1/114 {(19x(6)2+54x(7)2 +42(8)2 –(1/115)(19x6 + 54x7 +42x8)2} = 0.495 m2/s2
σ = 0.703 m/s
Turbulence intensity = standard deviation of wind speed/ mean wind speed = 0.703 / 7.2 = 0.097

04/19/2304/19/23 2727
Once this assessment is Once this assessment is completed, an accurate completed, an accurate picture of wind resource picture of wind resource at the site should be clear at the site should be clear
04/19/2304/19/23 2828

04/19/2304/19/23 2929
Site Ranking Criteria
Note that the maximum possible score for each criterion is not the same. The differences reflect the relative importance of the criteria.

04/19/2304/19/23 3030
MicrositingMicrositing
Micrositing is used to position one or Micrositing is used to position one or more wind turbines within a given more wind turbines within a given land area to maximize the overall land area to maximize the overall energy output of the wind plant.energy output of the wind plant.
One km2 of the windy land can host 5 One km2 of the windy land can host 5 – 7 MW of potential installed capacity.– 7 MW of potential installed capacity.
100 MW wind farm needs (15-20 km2)100 MW wind farm needs (15-20 km2)

04/19/2304/19/23 3131
Total power inputP/A= 0.5xxV3
Usable power P/A= 0.5xxV3x 16/27
Turbine power P/A= 0.5xxV3x 16/27x
04/19/2304/19/23 3232

04/19/2304/19/23 3333
04/19/2304/19/23 3434
The distances between the turbines have a strong effect on the energy output of the wind park.
This effect is described by the park efficiency the relation between :-
(the output of the park) / (the output of the same number of stand-alone turbines)
04/19/2304/19/23 3535
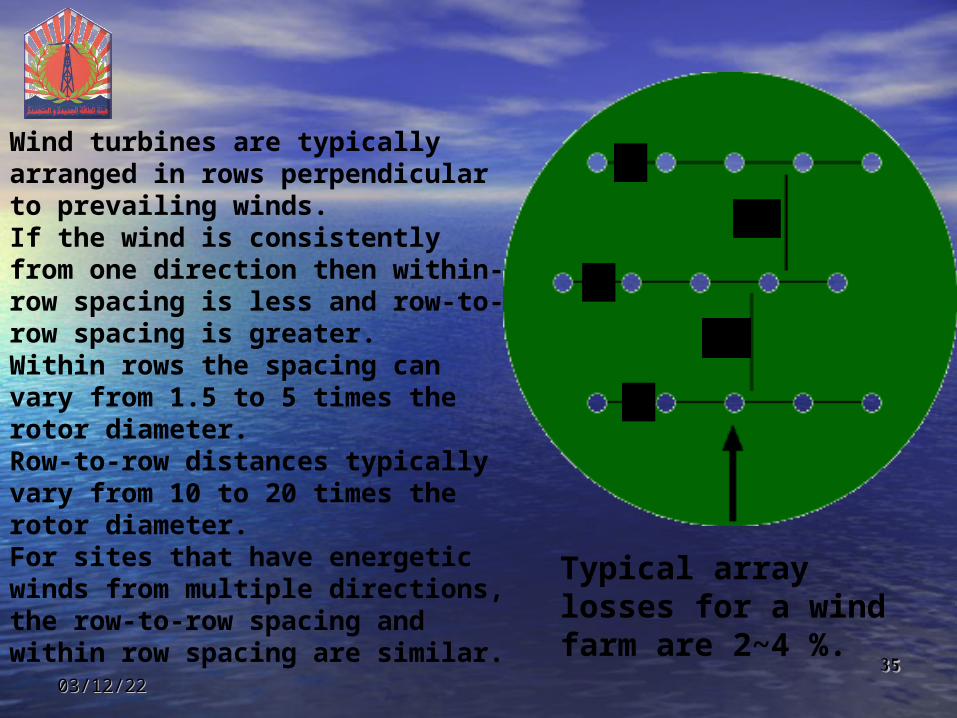
Wind turbines are typically arranged in rows perpendicular to prevailing winds. If the wind is consistently from one direction then within-row spacing is less and row-to-row spacing is greater.Within rows the spacing can vary from 1.5 to 5 times the rotor diameter. Row-to-row distances typically vary from 10 to 20 times the rotor diameter. For sites that have energetic winds from multiple directions, the row-to-row spacing and within row spacing are similar.
12
12
3
3
3
Typical array losses for a wind farm are 2~4 %.
04/19/2304/19/23 3636
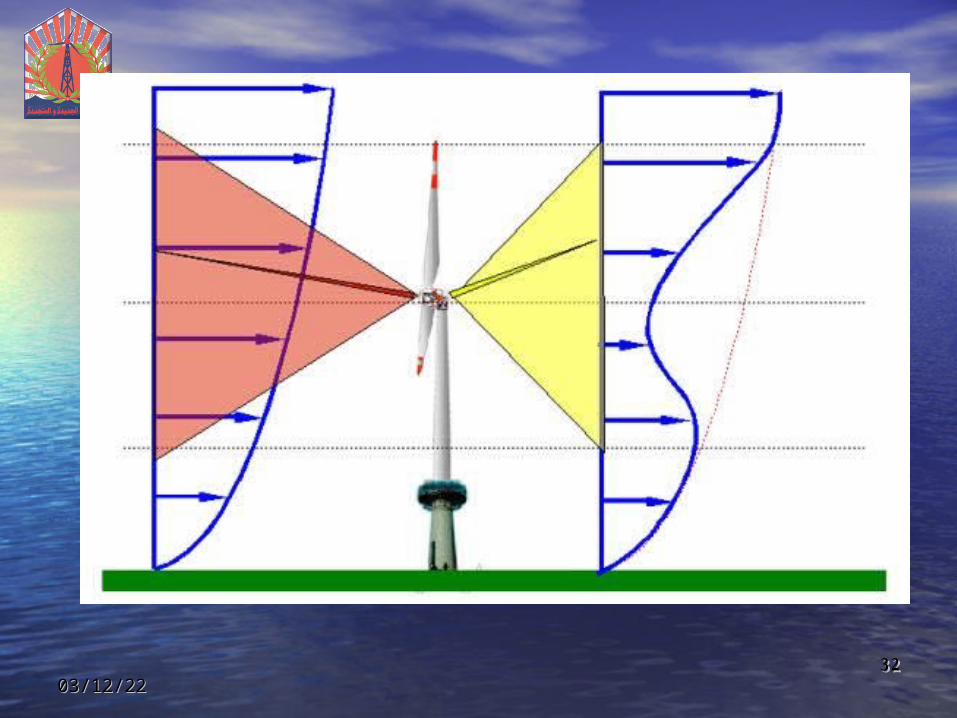
•Avoid area of steep slopeAvoid area of steep slopeThe wind on steep slopes The wind on steep slopes tends to be turbulent.tends to be turbulent.The construction costs are The construction costs are greatly increased.greatly increased.
•On hill tops, set the turbines On hill tops, set the turbines back from edge to avoid back from edge to avoid impacts of the vertical impacts of the vertical component of the wind.component of the wind.

04/19/2304/19/23 3737
The bottle-neck effect between two elevationsThe bottle-neck effect between two elevations
04/19/2304/19/23 3838
04/19/2304/19/23 3939

04/19/2304/19/23 4040

04/19/2304/19/23 4141
Highest elevation within a given Highest elevation within a given areaarea
High elevation is good and typically means increased wind power

04/19/2304/19/23 4242

04/19/2304/19/23 4343
Variation of wind speed with height
04/19/2304/19/23 4444
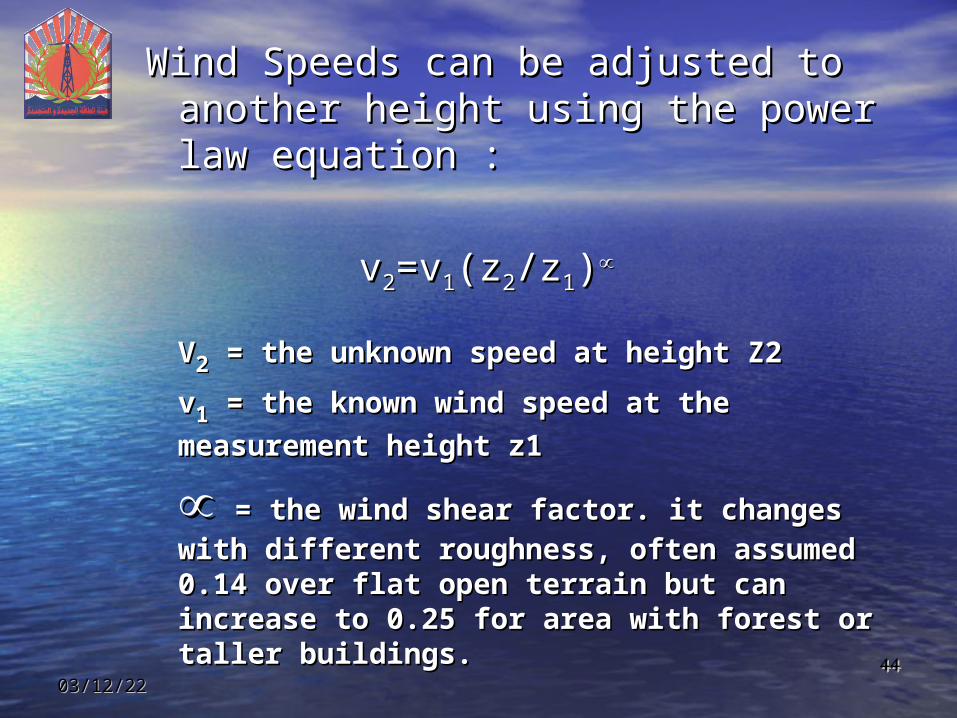
Wind Speeds can be adjusted to Wind Speeds can be adjusted to another height using the power law another height using the power law equation :equation :
vv22=v=v11(z(z22/z/z11))∝∝
VV22 = the unknown speed at height Z2 = the unknown speed at height Z2
vv11 = the known wind speed at the = the known wind speed at the
measurement height z1measurement height z1
∝∝ = the wind shear factor. it changes with = the wind shear factor. it changes with different roughness, often assumed 0.14 different roughness, often assumed 0.14 over flat open terrain but can increase to over flat open terrain but can increase to 0.25 for area with forest or taller 0.25 for area with forest or taller buildings.buildings.
04/19/2304/19/23 4545
ZoZ1
ln
ZoZ2
ln
1V
2V
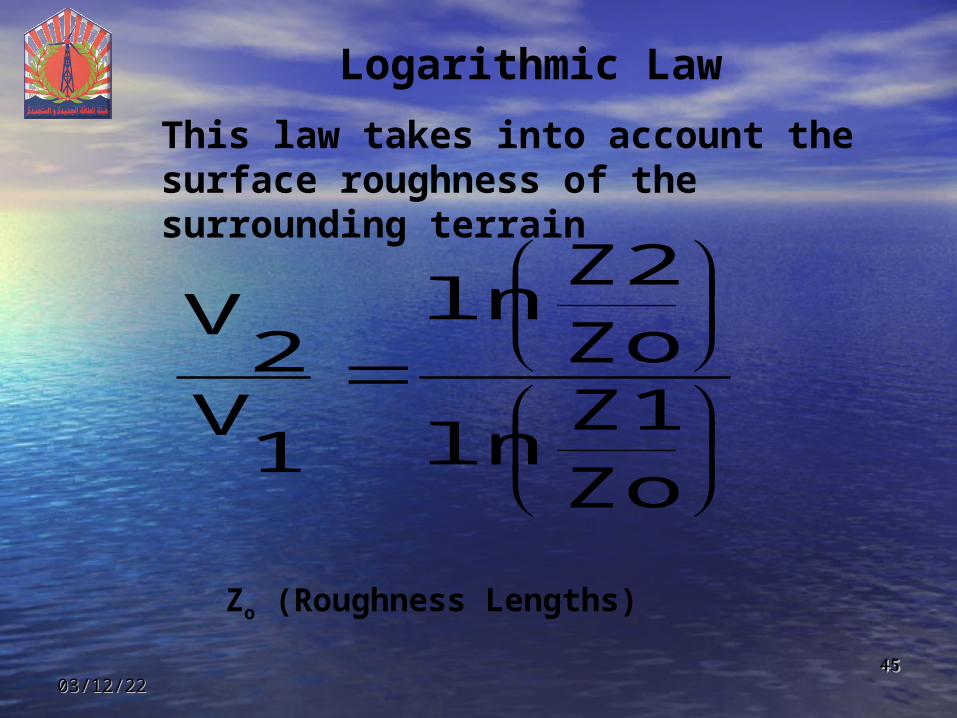
Zo (Roughness Lengths)
Logarithmic Law
This law takes into account the surface roughness of the surrounding terrain
04/19/2304/19/23 4646
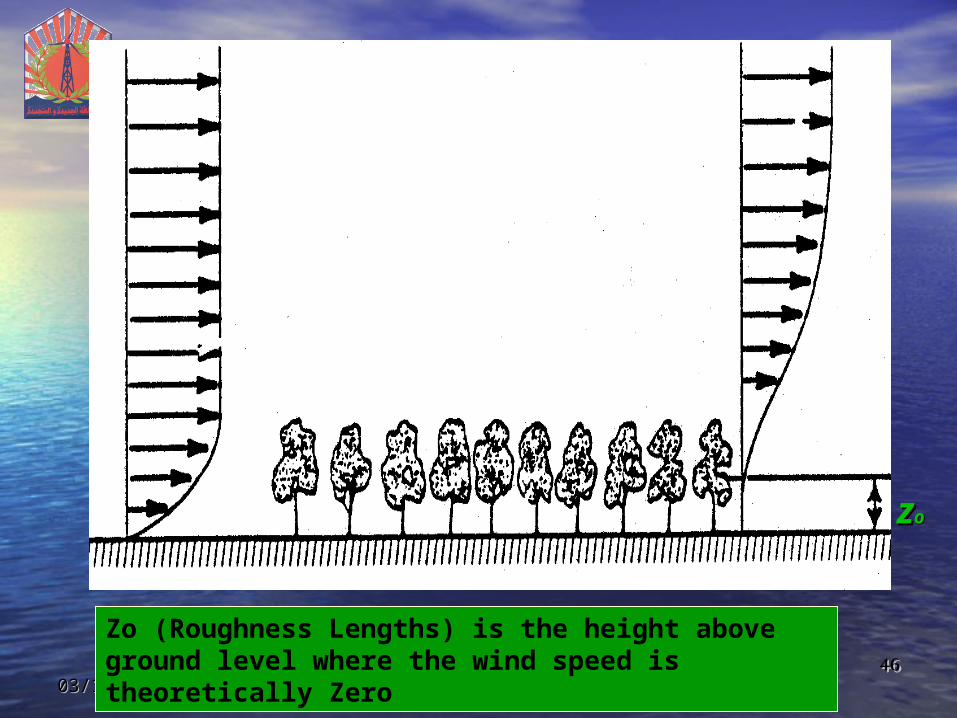
zzoo
Zo (Roughness Lengths) is the height above ground level where the wind speed is theoretically Zero

04/19/2304/19/23 4747
How to increase the wind turbine energy production
To increase the energy production of a wind farm of a specific design, there are two possibilities available:
1. Position the wind turbine at a greater height above ground. This option involves a wind turbine price increase. It is therefore necessary to study whether the increased energy production compensates the extra price.
2. Optimise the wind farm design by re-locating turbines or removing the ones that produce less.
04/19/2304/19/23 4848
769000 770000 771000 772000 773000 774000
Red Belt Easting [m ]
71
80
00
71
90
00
72
00
00
72
10
00
Red
Bel
t Nor
thin
g [m
]
2600
2700
2800
2900
3000
3100
3200
Row 1
Row 2
Row 3
Row 4
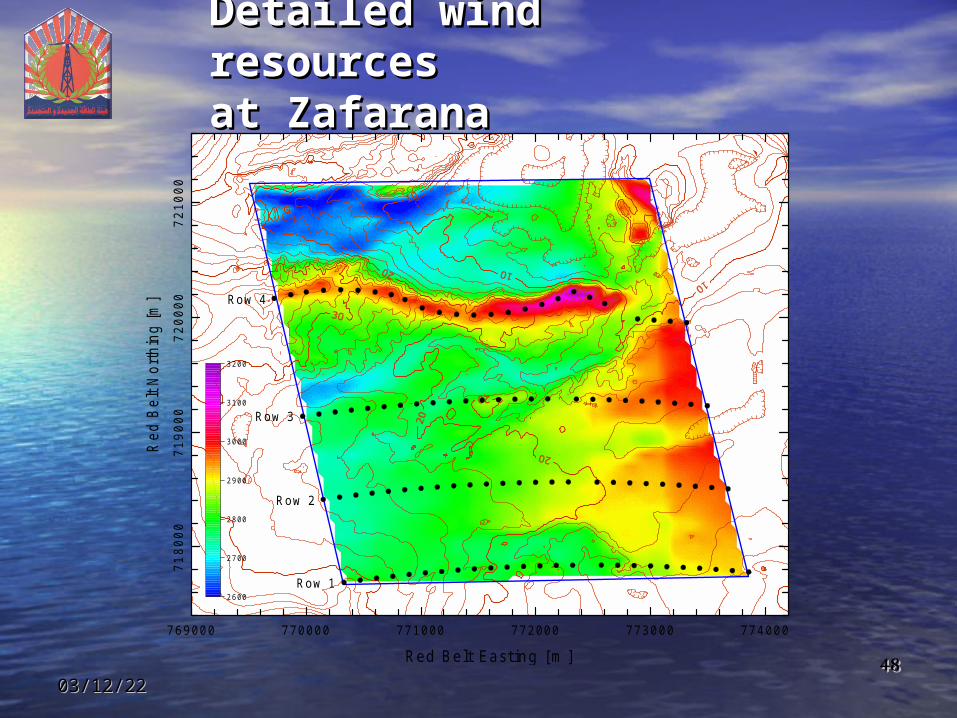
Detailed wind Detailed wind resources resources at Zafaranaat Zafarana

04/19/2304/19/23 4949
Please don’t hesitate to contact me for any question
e-mail : [email protected]

04/19/2304/19/23 5050