832424
DESCRIPTION
ÂTRANSCRIPT

Overlay Quality Metric Guy Cohen, Eran Amit, Dana Klein, Daniel Kandel, Vladimir B. Levinski
KLA-Tencor Corporation, 1 Halavyan St. Migdal Haemek, 23100, Israel
ABSTRACT
As overlay budget continues to shrink, an improved analysis of the different contributors to this budget is needed. A major contributor that has never been quantified is the accuracy of the measurements. KLA-Tencor developed a quality metric, that calculates and attaches an accuracy value to each OVL target. This operation is performed on the fly during measurement and can be applied without affecting MAM time or throughput. Using a linearity array we demonstrate that the quality metric identifies targets deviating from the intended OVL value, with no false alarms.
Keywords: Overlay, Imaging, Accuracy, TMU
1. INTRODUCTION Traditionally the quantity characterizing the quality of an overlay (OVL) measurement and therefore the quality of a
measuring technology is the total measurement uncertainty (TMU). This term incorporates the estimated error of a measurement due to precision and tool induced shift (TIS) of each measurement and additionally the tool to tool matching error. These errors are assumed to be of statistical nature and a proper sampling plan is used to assure OVL control in production. It is also well known that the metrology target OVL values are shifted with respect to the device OVL values as deduced from yield data or measurement by a reference metrology. In practice proper experiments are performed to characterize this shift and the results are utilized by fab control systems.
A large part of the device to metrology target OVL deviation is resulting from the device characteristics and their interactions with the process and the scanner. These effects are discussed elsewhere. A portion of device to metrology OVL deviation can be attributed to the accuracy of the OVL measurement. As will be clear from the examples below, target inaccuracy is not a global issue, and is not stable along time. It is specific to the local target under measurement and is affected by measurement technology, process, layer, and local surroundings. Furthermore, the magnitude of target inaccuracy may exceed significantly that of the TMU. As the OVL budget shrinks, it is particularly critical to characterize the accuracy of the targets and appropriately handle the results to assure proper process control.
KLA-Tencor developed a quality metric that delivers a quantitative evaluation of the accuracy of an OVL result for a given target. The quality metric is applicable to all imaging targets – BiB, AIM, AIMid, Blossom and multilayer AIMid. Each OVL measurement is accompanied by a quality metric value related to the accuracy of this specific OVL measurement value. In part 2 below, we introduce the quality metric concept and supporting simulations. In Part 3 we show typical experimental results. In part 4 we demonstrate the ability of the quality metric to detect outliers using a linearity array as a reference.
2. THE ORIGIN OF THE QUALITY METRIC AND SIMULATION EXAMPLE
A first step in improving the accuracy is to define what we mean by this term. A more complete theoretical explanation of the accuracy appears in Daniel Kandel et al., Overlay Accuracy Fundamentals, Proceedings of SPIE (2012), paper 8324-41 (current proceedings). In this article we will only demonstrate by simulation a simple example of inaccuracy. It is well known that when a target is symmetric the measured OVL value is not sensitive to measurement details. This is demonstrated in the simulation below ( Figure 1). In this simulation the OVL value of a symmetric target having an intended OVL value of 0nm is calculated. These calculations result in a single OVL value that is equal to the intended OVL value, independent of the measurement wavelength. The situation is more complicated when asymmetry is introduced to the target as is observed in
Metrology, Inspection, and Process Control for Microlithography XXVI, edited by Alexander Starikov, Proc. of SPIE Vol. 8324, 832424 · © 2012 SPIE · CCC code: 0277-786X/12/$18 · doi: 10.1117/12.916379
Proc. of SPIE Vol. 8324 832424-1
Downloaded from SPIE Digital Library on 10 Apr 2012 to 192.146.1.12. Terms of Use: http://spiedl.org/terms

Figure 2. In this case the simulated OVL values are deviating from the intended OVL value. One can notice that this deviation is wavelength dependent and can be either negative or positive. The fact that is most important from process control point of view is that the OVL value is not proportional to the change in the center of mass induced by the asymmetry, but it can be up to a factor of 5 larger. Assuming the center of mass OVL is the correct OVL, it leads to the conclusion that trying to control process by using TMU statistical assumptions only is not enough. These results hold for overlay measurements utilizing either imaging technology or first order scatterometry technology as is shown in by Kandel et al., Overlay Accuracy Fundamentals, Proceedings of SPIE (2012), paper 8324-41 (current proceedings).
Figure 1: OVL simulation in the case of symmetric target
Figure 2: OVL simulation in the case of asymmetric target The asymmetry of the target contributes an OVL error that exceeds the TMU and may lead to erratic process control. This situation is simulated in
Proc. of SPIE Vol. 8324 832424-2
Downloaded from SPIE Digital Library on 10 Apr 2012 to 192.146.1.12. Terms of Use: http://spiedl.org/terms
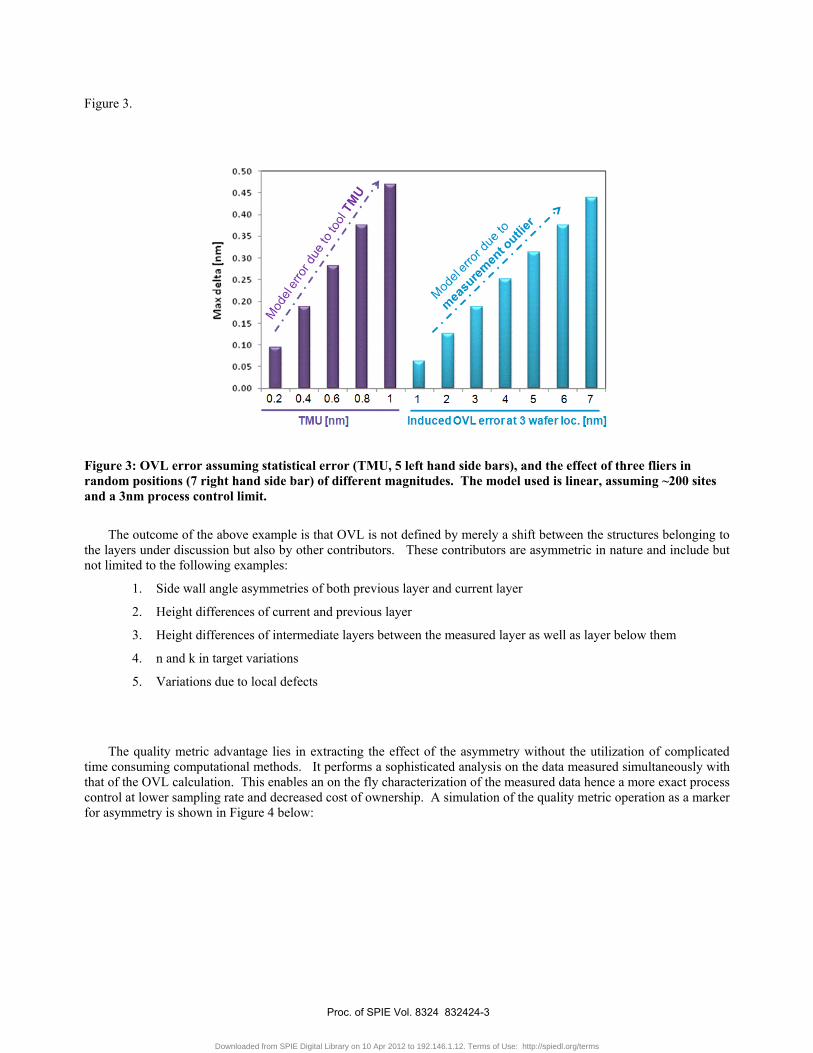
Figure 3.
Figure 3: OVL error assuming statistical error (TMU, 5 left hand side bars), and the effect of three fliers in random positions (7 right hand side bar) of different magnitudes. The model used is linear, assuming ~200 sites and a 3nm process control limit.
The outcome of the above example is that OVL is not defined by merely a shift between the structures belonging to the layers under discussion but also by other contributors. These contributors are asymmetric in nature and include but not limited to the following examples:
1. Side wall angle asymmetries of both previous layer and current layer
2. Height differences of current and previous layer
3. Height differences of intermediate layers between the measured layer as well as layer below them
4. n and k in target variations
5. Variations due to local defects
The quality metric advantage lies in extracting the effect of the asymmetry without the utilization of complicated time consuming computational methods. It performs a sophisticated analysis on the data measured simultaneously with that of the OVL calculation. This enables an on the fly characterization of the measured data hence a more exact process control at lower sampling rate and decreased cost of ownership. A simulation of the quality metric operation as a marker for asymmetry is shown in Figure 4 below:
Proc. of SPIE Vol. 8324 832424-3
Downloaded from SPIE Digital Library on 10 Apr 2012 to 192.146.1.12. Terms of Use: http://spiedl.org/terms

Figure 4: Simulation of the effect of target asymmetry on quality metric.
3. QUALITY METRIC BASIC RESULTS Before we continue to the experimental verification let’s dwell on the expected results of a typical quality metric
measurements ensemble. As mentioned above when no asymmetry exists the deviation from the correct OVL is nullified. The experimental results of quality metric are expected therefore to be concentrated around zero. This is observed in Figure 5 below. In this figure quality metric results are shown on an X-Y chart. In this chart the quality metric values of each target are represented by one point. The size of the distribution of the quality metric results around the (0, 0) point is a reflection of the asymmetry distribution of the measured targets. It is expected that for perfect targets the distribution around (0, 0) will be derived from the precision of the quality metric measurement.
Figure 5: A typical quality metric X-Y chart. The distribution is centered around (0, 0). In case of a global
asymmetry, distribution will be centered on a different value.
Proc. of SPIE Vol. 8324 832424-4
Downloaded from SPIE Digital Library on 10 Apr 2012 to 192.146.1.12. Terms of Use: http://spiedl.org/terms
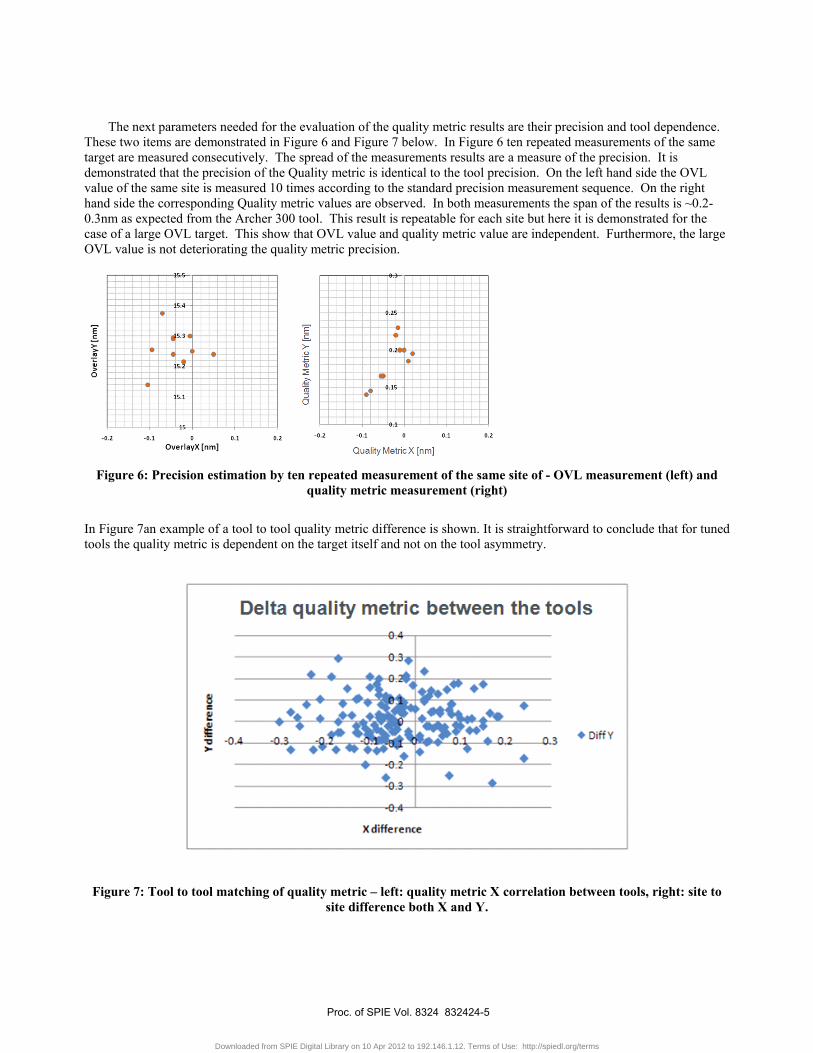
The next parameters needed for the evaluation of the quality metric results are their precision and tool dependence. These two items are demonstrated in Figure 6 and Figure 7 below. In Figure 6 ten repeated measurements of the same target are measured consecutively. The spread of the measurements results are a measure of the precision. It is demonstrated that the precision of the Quality metric is identical to the tool precision. On the left hand side the OVL value of the same site is measured 10 times according to the standard precision measurement sequence. On the right hand side the corresponding Quality metric values are observed. In both measurements the span of the results is ~0.2-0.3nm as expected from the Archer 300 tool. This result is repeatable for each site but here it is demonstrated for the case of a large OVL target. This show that OVL value and quality metric value are independent. Furthermore, the large OVL value is not deteriorating the quality metric precision.
Figure 6: Precision estimation by ten repeated measurement of the same site of - OVL measurement (left) and
quality metric measurement (right)
In Figure 7an example of a tool to tool quality metric difference is shown. It is straightforward to conclude that for tuned tools the quality metric is dependent on the target itself and not on the tool asymmetry.
Figure 7: Tool to tool matching of quality metric – left: quality metric X correlation between tools, right: site to site difference both X and Y.
Proc. of SPIE Vol. 8324 832424-5
Downloaded from SPIE Digital Library on 10 Apr 2012 to 192.146.1.12. Terms of Use: http://spiedl.org/terms

4. QUALITY METRIC EXPERIMENTAL RESULTS While simulating the quality metric results and extracting its intrinsic measurement characteristics is
straightforward, verifying the value of such a feature is a task more complicated to perform. After all, a one digit OVL deviation, in nanometers, is a hard to trace effect, and there is no easy to use reference metrology one can rely on. A well known method for estimating the accuracy of a measurement is the linearity array. Although a global inaccuracy may occur in such arrays, the target to target deviation is known and is expected to be replicated in the measurement.
In Figure 8 below, linearity array results are drawn. It is clear that the two sites marked by red circles are deviating from the line hence are not yielding the expected overlay value. This is also reflected in the R square value of 0.93. In Figure 9 the corresponding quality metric result is observed. Two sites are found away from the main distribution that, as expected, is concentrated around (0, 0). These sites correspond to the sites in the red circle as is made clear by the red arrows.
Figure 8: OVL measurement results vs. intended OVL of a linearity array
Figure 9: Identification of outliers by the quality metric and their correspondence to the OVL measurements
Proc. of SPIE Vol. 8324 832424-6
Downloaded from SPIE Digital Library on 10 Apr 2012 to 192.146.1.12. Terms of Use: http://spiedl.org/terms
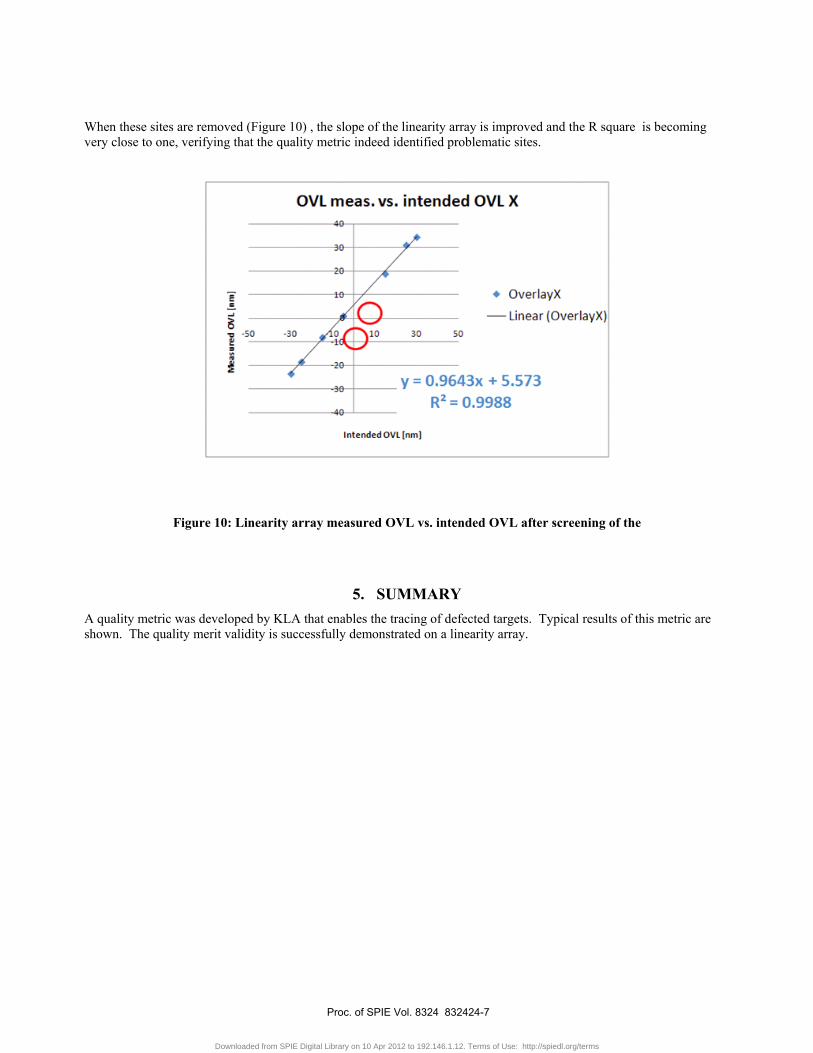
When these sites are removed (Figure 10) , the slope of the linearity array is improved and the R square is becoming very close to one, verifying that the quality metric indeed identified problematic sites.
Figure 10: Linearity array measured OVL vs. intended OVL after screening of the
5. SUMMARY A quality metric was developed by KLA that enables the tracing of defected targets. Typical results of this metric are shown. The quality merit validity is successfully demonstrated on a linearity array.
Proc. of SPIE Vol. 8324 832424-7
Downloaded from SPIE Digital Library on 10 Apr 2012 to 192.146.1.12. Terms of Use: http://spiedl.org/terms