86 rasmussen - the national academies press
TRANSCRIPT

Population Growth Makes Waves in the Distribution of Pairwise Genetic Differences ’
Alan R. Rogers* and Henry Harpending’f *Department of Anthropology, University of Utah; and TDepartment of Anthropology, Pennsylvania State University
Episodes of population growth and decline leave characteristic signatures in the distribution of nucleotide (or restriction) site differences between pairs of individuals. These signatures appear in histograms showing the relative frequencies of pairs of individuals who differ by i sites, where i = 0, 1, . . . . In this distribution an episode of growth generates a wave that travels to the right, traversing 1 unit of the horizontal axis in each 1 / 224 generations, where u is the mutation rate. The smaller the initial population, the steeper will be the leading face of the wave. The larger the increase in population size, the smaller will be the distribution’s vertical intercept. The implications of continued exponential growth are indistinguishable from those of a sudden burst of population growth. Bottlenecks in population size also generate waves similar to those produced by a sudden expansion, but with elevated upper- tail probabilities. Reductions in population size initially generate L-shaped distri- butions with high probability of identity, but these converge rapidly to a new equi- librium. In equilibrium populations the theoretical curves are free of waves. However, computer simulations of such populations generate empirical distributions with many peaks and little resemblance to the theory. On the other hand, agreement is better in the transient (nonequilibrium) case, where simulated empirical distri- butions typically exhibit waves very similar to those predicted by theory. Thus, waves in empirical distributions may be rich in information about the history of population dynamics.
Introduction
Molecular genetic data have become increasingly important in studies of recent evolutionary history ( Avise et al. 1987 ) , and their use has generated a lively controversy concerning the origin of modern humans (Cann et al. 1987; Spuhler 1988; Stringer and Andrews 1988; Mellars and Stringer 1989). These data contain information not only about relationships among populations (Felsenstein 1988; Swofford and Olsen 1990) but also about past population sizes (Nei and Graur 1984; Avise et al. 1988; Felsenstein, accepted). Methods for inferring relationships between populations are fairly well developed, but methods for inferring past population sizes are in their infancy. The present paper will show how the trajectory of population size affects one type of molecular data: the distribution of pairwise nucleotide (or restriction) site differences between individuals. It will then use the results to assess two hypotheses concerning the origin of modern humans.
1, Key words: population growth, distribution, pairwise genetic differences. Address for correspondence and reprints: Alan R. Rogers, Department of Anthropology, University of
Utah, Salt Lake City, Utah 84 I 12.
Mol. Bid. Evol. 9(3):552-569. 1992. 0 1992 by The University of Chicago. All rights reserved. 0737-4038/92/0903-0014$02.00
552

Distributional Waves in Genetic Differences 553
Waves Generated by Population Expansion
We assume that recombination is weak or absent and denote by N the number of either haploid individuals or diploid chromosomes under study. The mutation rate, U, is the per-generation probability that a mutation strikes some nucleotide in the region under study. Each mutation along the evolutionary path between two individuals is assumed to increase the count of differences between them. This is the “infinite sites” model (Kimura 197 1) and is an accurate approximation only for relatively short periods of time (while the number of generations is much less than the reciprocal of the mutation rate per nucleotide per generation).
Let Fi(t) denote the probability that two random neutral genes will differ at exactly i nucleotide sites in generation t. If u is small and N is large, so that second- order terms in u and 1 /N can be ignored, then
F,(t + 1) N l/N+(l -2u- l/N)&(t) (1)
and
Fi+r(t + 1) x (1 - 2~ - l/N)Fi+r(t) + hFi(t) s (2)
Watterson ( 1975) showed that, if the population remains constant in size, then Fi (t) converges toward an equilibrium distribution,
where 9 = 2Nu is the expected pairwise difference. This curve is easily fit to data by equating 8 with the observed mean of pairwise differences (Avise et al. 1988; Maynard Smith 1990; Wills 1990). This is done in figure 1, with the worldwide sample of human mitochondrial DNA described by Cann et al. ( 1987). Clearly, the equilibrium curve fits these data very poorly. Instead of the smooth decline that is predicted, the data exhibit a pronounced wave with a crest at roughly i = 8. Such waves also appear in other published pair-wise-difference distributions (see fig. 4) and are discussed in
Fi
0 5 10 15 20 25
FIG. 1 .-Poor fit of equilibrium distribution. The circles show the empirical pairwise-difference distri- bution reported by Cann et al. ( 1987), based on their fig. 1. The solid line is an equilibrium distribution with the same mean.

554 Rogers and Harpending
several recent publications (Di Rienzo and Wilson 199 1; Slatkin and Hudson 199 1). We will argue that these waves are the signature of an ancient population explosion.
Li ( 1977) derived an expression for the transient distribution of pairwise differ- ences. Given the probability, Fi (0), that a random pair of individuals differ by i sites at time 0, Li’s equation provides the analogous probability at any later time. The result is conveniently expressed on a mutational time scale, z = 2ut, where t measures time in generations and z measures it in units of 1/2u generations. After z units of mutational time, a random pair of individuals will differ by i sites, with probability (Li 1977, eq. 5)
Fj(T) = pj + e-r”+‘/e) ,$: (Fi-j(O) - pi-j) . (4)
Tajima ( 1989) derives similar formulas for the number of segregating sites in a sample of arbitrary size.
The simplest form of growth to consider is what we shall call the model of sudden expansion. An initial population, at equilibrium with 8 = 00, is assumed to grow (or shrink) rapidly to a new size at which 8 = 8,) and this burst of growth is assumed to occur z units of mutational time before the present. The assumption of initial equi- librium allows us to specify the initial distribution by using equation ( 3) with 8 = $. The & in equation (4) are also determined from equation (3), but with 8 = 8,. As figure 2 shows, this scenario generates a wave that travels slowly to the right and that looks much like the wave in the real data of figure 1. Indeed, figures 3 and 4 show that the waves in empirical distributions can often be fit well by this model. Di Rienzo and Wilson ( 199 1) and Slatkin and Hudson ( 199 1) fit a Poisson distribution to their distributions. To our eyes, their Poisson fit is noticeably worse than that of the model used here. The close fit of our model is encouraging but does not yet provide compelling evidence for a population expansion. We must consider the statistical properties of these waves before we draw conclusions from them.
Fi
0 5 10 15 20 25
FIG. 2.-Evolution of distribution of pairwise differences. Pairwise-difference distributions for 0, = 2, 8, = 200, and various values of 7, when it is assumed that 8 increased in value from C.4, to 8, at T units of mutational time prior to the present.

Distributional Waves in Genetic Differences 555
0.08
Fi
0.04
0.00 0 5 10 15 20 25
RG. 3.-Model of sudden expansion fit to data of Cann et al. ( 1987). The open circles show the observed distribution of pairwise restriction-site differences. The solid line was obtained by fitting 00, 01, and ‘c by using the method of nonlinear least squares.
Waves in the Empirical Distribution
The statistical properties of the empirical distribution of pairwise differences will be treated elsewhere. However, to motivate an interest in the theoretical distribution, we will show here that population growth reliably generates empirical waves such as those in figures 1 and 4 and that such waves are seldom generated in equilibrium populations. Neither ofthese findings follows obviously from the theory just discussed. The theory refers to an average over an infinite ensemble of realizations of the evo- lutionary process. Thus, to observe what the theory predicts, we would need to average the histograms of a large number of worlds, each with the same evolutionary history. In reality, of course, we have only a single world to study, so empirical distributions
. can describe only a single realization of the evolutionary process. Consequently, there is no a priori reason to assume that empirical distributions will bear any strong resem- blance to the theory. Neither is there any a priori reason to assume that waves such as those in our figures are uncommon in equilibrium populations.
To evaluate these issues, we generated random data sets by computer simulation. Figure 5 displays eight simulated equilibrium distributions (on the left) and eight simulated transient distributions (on the right). Each simulation used the coalescent algorithm (TavarC 1984; Watterson 1984; Lundstrom 1990) to generate a genetic sample of 147 individuals, equal in size to the sample on which the data in figure 1 are based. The equilibrium simulations each assume that 8 = 100; the transient sim- ulations each assume that 6, = 2, 8, = 200, and 2 = 7. In each plot, the solid line shows the theoretical distribution implied by these parameters. These curves appear to vary in shape because the axes in each plot are scaled to the simulated data, which are shown as dots.
The simulated equilibrium distributions bear little resemblance to their theoretical curve, in agreement with the data of Slatkin and Hudson ( 199 1). On the other hand, most of the transient distributions on the left bear a close resemblance to the theoretical curve. These curves are illustrative of a large number of others that we have generated. They suggest that the distribution of pairwise differences is far more informative in the transient case than in the equilibrium case.
Some insight into the cause of this behavior can be gained by studying the coef- ficient of variation (CV) of the average pairwise difference within samples of some given size. In an equilibrium population, the expectation of the average pairwise dif-
556 Rogers and Harpending
Sardinia Middle East
American Indians
I I 1 1 1 I I I 0 5 10 15 0 5 10 15
i i
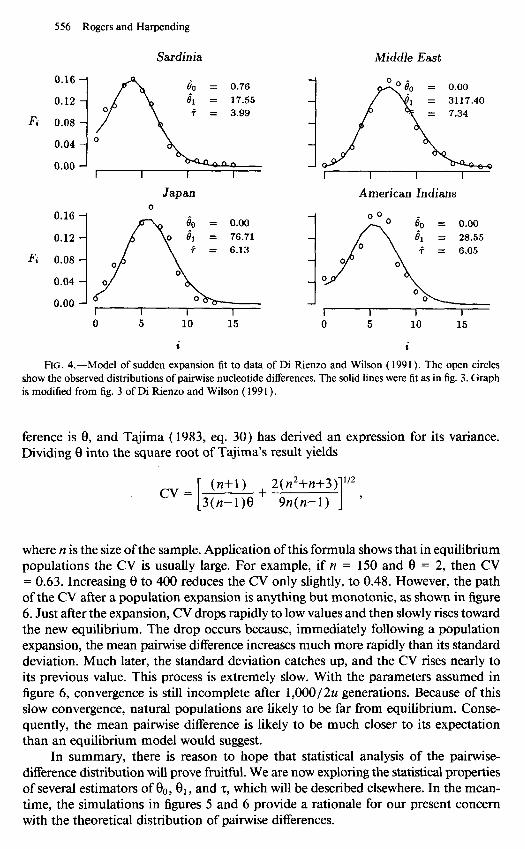
FIG. 4.-Model of sudden expansion fit to data of Di Rienzo and Wilson ( 1991). The open circles show the observed distributions of pairwise nucleotide differences. The solid lines were fit as in fig. 3. Graph is modified from fig. 3 of Di Rienzo and Wilson ( 199 I ).
ference is 8, and Tajima ( 1983, eq. 30) has derived an expression for its variance. Dividing 8 into the square root of Tajima’s result yields
CV = (n+l) + 2(n2+n+3) “2 3(n-1)8 1 9n(n-1) ’
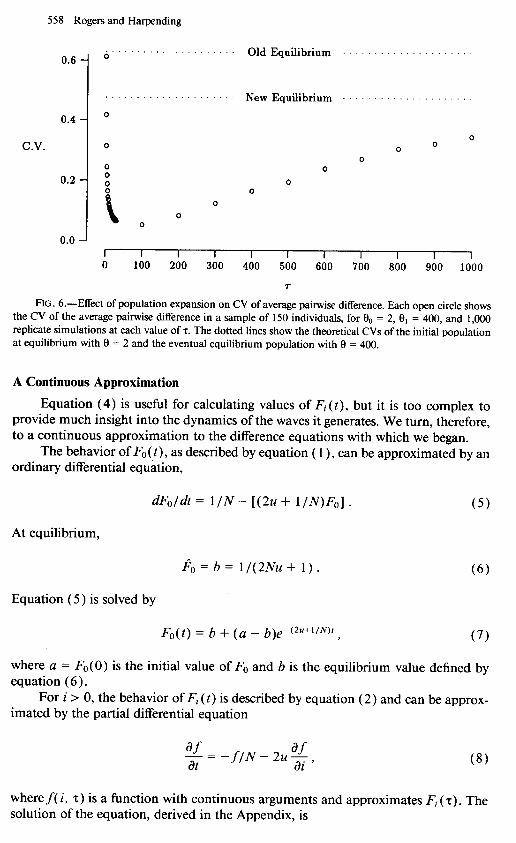
where y1 is the size of the sample. Application of this formula shows that in equilibrium populations the CV is usually large. For example, if n = 150 and 8 = 2, then CV = 0.63. Increasing 8 to 400 reduces the CV only slightly, to 0.48. However, the path of the CV after a population expansion is anything but monotonic, as shown in figure 6. Just after the expansion, CV drops rapidly to low values and then slowly rises toward the new equilibrium. The drop occurs because, immediately following a population expansion, the mean pairwise difference increases much more rapidly than its standard deviation. Much later, the standard deviation catches up, and the CV rises nearly to its previous value. This process is extremely slow. With the parameters assumed in figure 6, convergence is still incomplete after 1,000/2u generations. Because of this slow convergence, natural populations are likely to be far from equilibrium. Conse- quently, the mean pairwise difference is likely to be much closer to its expectation than an equilibrium model would suggest.
In summary, there is reason to hope that statistical analysis of the pairwise- difference distribution will prove fruitful. We are now exploring the statistical properties of several estimators of 00, Or, and 2, which will be described elsewhere. In the mean- time, the simulations in figures 5 and 6 provide a rationale for our present concern with the theoretical distribution of pairwise differences.

21’0 90’0
0’0
4
.- .-
20’0 0’0
j
10’0 0’0
4
wo
0’0 ti
4 d ii
. . . - *c: . . 5 E
.= g D
s s
..q; :. P
W
.
. ..L. -
o
.-
10’0 0’0
3
mo
zo’o 0’0
3
CO.0 0’0
4
558 Rogers and Harpending
Old Equilibrium
0 C.V. 0 0
0 0 0
0.2 z 0 0 0
B 0 0
0
0.0 , , , , , , , , , , 0 100 200 300 400 500 600 700 800 900 1000
r
FIG. 6.-Effect of population expansion on CV of average pairwise difference. Each open circle shows the CV of the average paitwise difference in a sample of 150 individuals, for O0 = 2, 9, = 400, and 1,000 replicate simulations at each value of 7. The dotted lines show the theoretical CVs of the initial population at equilibrium with 9 = 2 and the eventual equilibrium population with 9 = 400.
A Continuous Approximation
Equation (4) is useful for calculating values of Fi (t), but it is too complex to provide much insight into the dynamics of the waves it generates. We turn, therefore, to a continuous approximation to the difference equations with which we began.
The behavior of FO( t), as described by equation ( I), can be approximated by an ordinary differential equation,
dF,/dt = l/N- [(2u + l/N)Fo]. (5)
At equilibrium,
&=b= 1/(2Nu+ 1). (6)
Equation ( 5) is solved by
F,(t) = b + (a - b)e-(2u+1’N)t, (7)
where a = F,,( 0) is the initial value of F. and b is the equilibrium value defined by equation ( 6 ) .
For i > 0, the behavior of Fj (t) is described by equation (2) and can be approx- imated by the partial differential equation
af -=-flN-2u$, at (8)
where f ( i, T) is a function with continuous arguments and approximates Fi ( 2). The solution of the equation, derived in the Appendix, is
Distributional Waves in Genetic Differences 559
1 be-i/e + (a _ b)ei-T(l+lle) if i < 7
f(i, 2) = eeef( i - 7, 0) ifir z
(9)
This result allows some generalizations about the effect that our three parameters have on the shape of the wave:
The Wave’s Crest Is Determined by r
Since the wave travels at rate 2u, its crest will be at z = 2ut after t generations. Figure 2 shows that this result holds approximately for the discrete equation, as well as for the continuous approximation discussed here. Thus, the location of the crest of the wave provides a rough idea of the time, in units of 1/2u, since the episode of population expansion.
The Vertical Intercept Is Determined by 8,
Equation (9) shows that the trailing (left) face of the wave converges toward its equilibrium exponentially, at rate T( 1 + l/8), which is greater than 2. Thus, by the time the wave has reached i = 4, the discrepancy between Fo and its equilibrium value will have been reduced to no more than ep4 = 2% of its initial value. This suggests that the vertical intercept might serve as a rough estimate of pt, = 1 /( 1 + 0,). Below, in the discussion of figure 8, we show that this holds approximately for the discrete model, equation (4)) as well as for the continuous approximation considered here.
The Slope of the Wave’s Leading Face Is Determined by 80
The leading face of the wave will have i > z. Thus, equation (9) shows that the leading face is simply the initial distribution, translated to the right by z units and reduced in height by a factor of e+‘. If this also holds for the discrete model, then equation ( 3 ) implies that
&+i+l(z) e-“‘fii+l _ eO FT+i(T) = eFeFi 1 + 80 *
Numerical experiments verify that this result also holds approximately for the discrete model. Thus, if the initial population was at equilibrium, then successive values of the leading face of the wave will be in a constant ratio, and this ratio is a simple function of Bo. The smaller the initial population (i.e., the smaller the value of eo), the steeper will be the leading face of the wave.
The continuous approximation is useful in showing us why the process generates a wave, why the wave travels at rate 2u, and how the shape of the wave is affected by our parameters. However, it is not useful as a basis for data analysis, because the wave generated by equation (9) is narrower and more sharply peaked than that generated by the discrete solution, expressed by equation (4). Apparently, the increments of the discrete equation are too coarse to be well approximated by the continuous differential equation considered here.
Other Trajectories of Population Growth Exponential Growth
Waves are also generated by other trajectories of population growth, and the shape of these waves is remarkably insensitive to differences among trajectories. To
560 Rogers and Harpending
illustrate this insensitivity, we use the case of exponential growth. Several authors (Di Rienzo and Wilson 199 1; Slatkin and Hudson 199 1) have studied the effect of ex- ponential population growth on the probability that a random pair of individuals last shared a common ancestor x generations ago. However, no one has found an analytical expression describing the effect that such growth has on the distribution of pairwise differences. Nonetheless, we can use equation (4) iteratively to approximate exponential growth by a step function with a large number of steps.
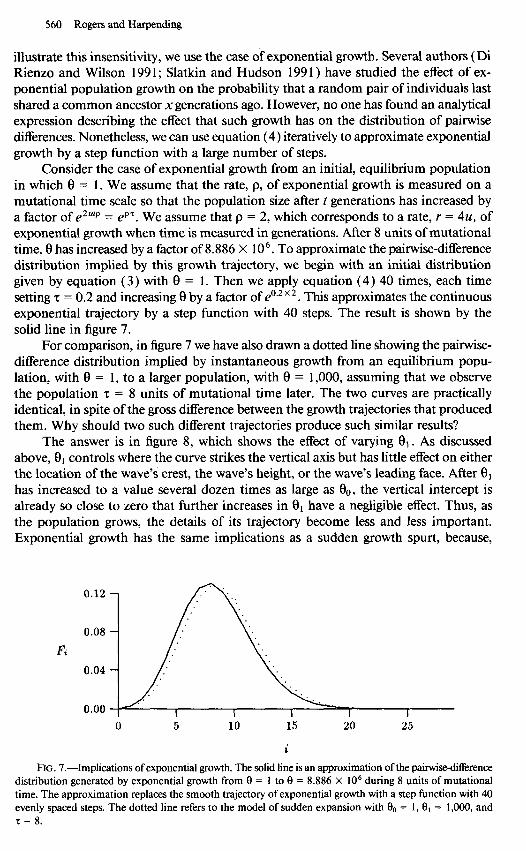
Consider the case of exponential growth from an initial, equilibrium population in which 8 = 1. We assume that the rate, p, of exponential growth is measured on a mutational time scale so that the population size after t generations has increased by a factor of ezU@ = ep’. We assume that p = 2, which corresponds to a rate, r = 4u, of exponential growth when time is measured in generations. After 8 units of mutational time, 8 has increased by a factor of 8.886 X 10⁶. To approximate the pair-wise-difference distribution implied by this growth trajectory, we begin with an initial distribution given by equation (3) with 8 = 1. Then we apply equation (4) 40 times, each time setting z = 0.2 and increasing 8 by a factor of e”.2 ’ 2. This approximates the continuous exponential trajectory by a step function with 40 steps. The result is shown by the solid line in figure 7.
For comparison, in figure 7 we have also drawn a dotted line showing the pairwise- difference distribution implied by instantaneous growth from an equilibrium popu- lation, with 8 = 1, to a larger population, with 8 = 1,000, assuming that we observe the population z = 8 units of mutational time later. The two curves are practically identical, in spite of the gross difference between the growth trajectories that produced them. Why should two such different trajectories produce such similar results?
The answer is in figure 8, which shows the effect of varying Q1. As discussed above, 8, controls where the curve strikes the vertical axis but has little effect on either the location of the wave’s crest, the wave’s height, or the wave’s leading face. After 81 has increased to a value several dozen times as large as eo, the vertical intercept is already so close to zero that further increases in 8, have a negligible effect. Thus, as the population grows, the details of its trajectory become less and less important. Exponential growth has the same implications as a sudden growth spurt, because,
0.12 -
Fi
I I 0 5 10 15 20 25
RG. 7.-Implications of exponential growth. The solid line is an approximation of the pairwkedifference distribution generated by exponential growth from 8 = 1 to 0 = 8.886 X lo6 during 8 units of mutational time. The approximation replaces the smooth trajectory of exponential growth with a step function with 40 evenly spaced steps. The dotted line refers to the model of sudden expansion with $ = 1, 8, = 1,000, and r = 8.

Distributional Waves in Genetic Differences 56 1
0.00 ; I I I I I 0 5 10 15 20 25
i
FIG. S.-Effect of varying 0,. Pairwise-difference distributions for 0, = 10, T = 4, and various values of 8, [3&, (solid line), 9@ (dashed line), and 2700 (dotted line)] show that, once the population has increased to several dozen times its original size, further increases have only a minor effect.
after the population has increased by roughly two orders of magnitude, further growth has no noticeable effect.
Bottlenecks in Population Size
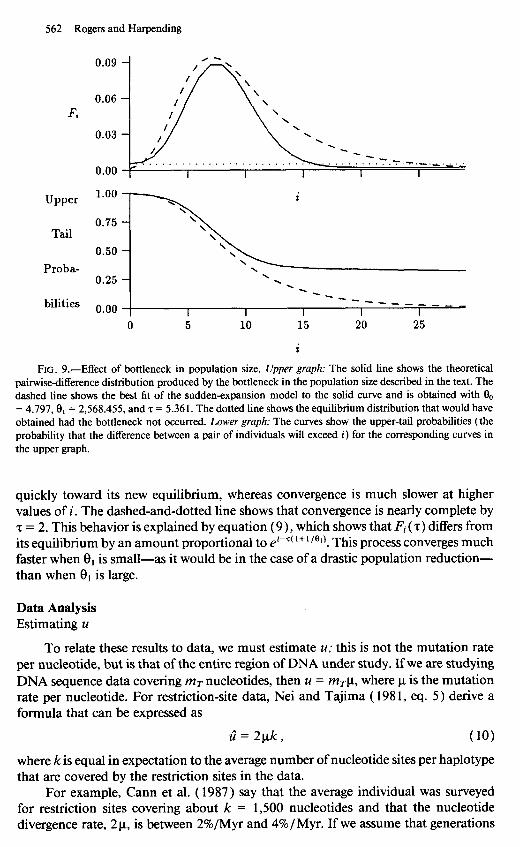
Tajima ( 1989, p. 599) has shown that the mean number of nucleotide differences responds to bottlenecks more strongly than does the number of segregating sites. We can study the first of these effects by using equation (4). If the population remains small long enough, it will converge to a new equilibrium, and the bottleneck model becomes equivalent to the sudden-expansion model. As we shall see in a moment (see fig. lo), convergence following a population reduction is rapid. Thus, the distinction between the bottleneck and sudden-expansion models is only meaningful if the bot- tleneck is short. The solid line in figure 9 shows the pairwise-difference distribution generated when an initial population, at equilibrium with 0 = 200, passes through a bottleneck that lasts 0.1 units of mutational time during which 9 = 0.1. After the bottleneck, the population resumes its original size, and we observe it 8 units of mu- tational time later. Clearly, bottlenecks can also generate waves in the distribution of pairwise differences.
This raises the question, Can waves generated by bottlenecks be distinguished from those generated by sudden expansion from an equilibrium population? The dashed line in figure 9 is a least-squares fit of the sudden-expansion model to the curve shown for the bottleneck model. The two waves in the upper graph are similar, but they also differ in important ways. First, the bottleneck generates a wave with an extremely steep leading face. Second, as shown in the lower graph of the figure, the bottleneck model generates elevated upper-tail probabilities. Under the bottleneck model a pair of individuals differ by more than 25 sites, with probability 32%. The model of sudden expansion makes this probability only 2%. Consequently, bottlenecks should often generate ragged empirical distributions with many peaks at large values, like those seen in the simulated equilibrium distributions in figure 5. If this argument is correct, then the smooth empirical curve in figure 1 may imply that the expansion model is a better description of human demographic history than is the bottleneck model. Further work is needed to check this conjecture.
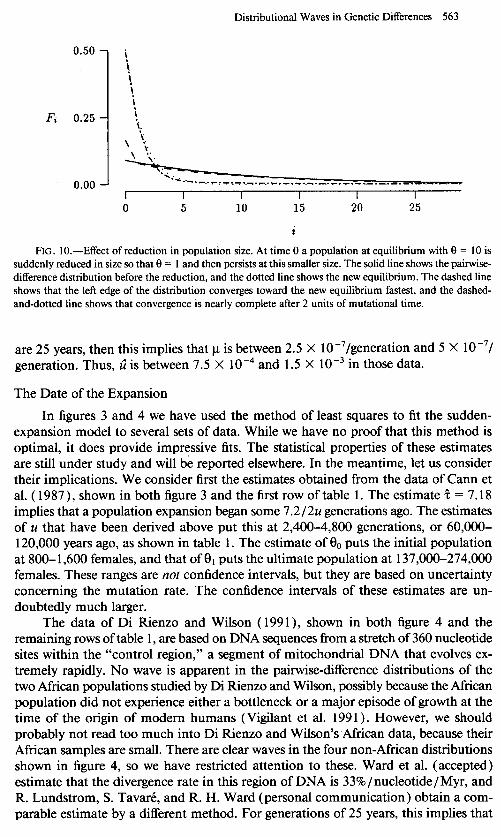
Remnants of Larger Populations
Figure 10 shows the effect of a lo-fold reduction in population size. The dashed line shows that, as in the case of an expansion, the left edge of the graph converges
562 Rogers and Harpending
Fi
Upper
Tail
0.50 -
Proba- 0.25 \ - . .
bilities o.oo _-__ --__ ---_
I I I I I 0 5 10 15 20 25
i
FIG. 9.-Effect of bottleneck in population size. Upper graph: The solid line shows the theoretical pairwisedifference distribution produced by the bottleneck in the population size described in the text. The dashed line shows the best fit of the sudden-expansion model to the solid curve and is obtained with 9, = 4.797,& = 2,568.455, and z = 5.361. The dotted line shows the equilibrium distribution that would have obtained had the bottleneck not occurred. Lower graph: The curves show the upper-tail probabilities (the probability that the difference between a pair of individuals will exceed i) for the corresponding curves in the upper graph.
quickly toward its new equilibrium, whereas convergence is much slower at higher values of i. The dashed-and-dotted line shows that convergence is nearly complete by z = 2. This behavior is explained by equation (9)) which shows that Fi (7) differs from its equilibrium by an amount proportional to e i-r(‘+“el). This process converges much faster when 8, is small-as it would be in the case of a drastic population reduction- than when l3r is large.
Data Analysis Estimating u
To relate these results to data, we must estimate U; this is not the mutation rate per nucleotide, but is that of the entire region of DNA under study. If we are studying DNA sequence data covering mr nucleotides, then u = mru, where u is the mutation rate per nucleotide. For restriction-site data, Nei and Tajima ( 198 1, eq. 5) derive a formula that can be expressed as
u^=2pk, (10)
where k is equal in expectation to the average number of nucleotide sites per haplotype that are covered by the restriction sites in the data.
For example, Cann et al. ( 1987) say that the average individual was surveyed for restriction sites covering about k = 1,500 nucleotides and that the nucleotide divergence rate, 2u, is between 2%/Myr and 4%/Myr. If we assume that generations
Distributional Waves in Genetic Differences 563
0.50
0.25
0.00
i i
I I I I I I 0 5 10 15 20 25
FIG. IO.-Effect of reduction in population size. At time 0 a population at equilibrium with 8 = 10 is suddenly reduced in size so that 8 = I and then persists at this smaller size. The solid line shows the pairwise- difference distribution before the reduction, and the dotted line shows the new equilibrium. The dashed line shows that the left edge of the distribution converges toward the new equilibrium fastest, and the dashed- and-dotted line shows that convergence is nearly complete after 2 units of mutational time.
are 25 years, then this implies that ~1 is between 2.5 X lo-‘/generation and 5 X lo-‘/ generation. Thus, li is between 7.5 X 10m4 and 1.5 X 10e3 in those data.
The Date of the Expansion
In figures 3 and 4 we have used the method of least squares to fit the sudden- expansion model to several sets of data. While we have no proof that this method is optimal, it does provide impressive fits. The statistical properties of these estimates are still under study and will be reported elsewhere. In the meantime, let us consider their implications. We consider first the estimates obtained from the data of Cann et al. ( 1987)) shown in both figure 3 and the first row of table 1. The estimate ? = 7.18 implies that a population expansion began some 7.2/2u generations ago. The estimates of u that have been derived above put this at 2,400-4,800 generations, or 60,000- 120,000 years ago, as shown in table 1. The estimate of f10 puts the initial population at 800- 1,600 females, and that of 8, puts the ultimate population at 137,000-274,000 females. These ranges are not confidence intervals, but they are based on uncertainty concerning the mutation rate. The confidence intervals of these estimates are un- doubtedly much larger.
The data of Di Rienzo and Wilson ( 199 1 ), shown in both figure 4 and the remaining rows of table 1, are based on DNA sequences from a stretch of 360 nucleotide sites within the “control region,” a segment of mitochondrial DNA that evolves ex- tremely rapidly. No wave is apparent in the pair-wise-difference distributions of the two African populations studied by Di Rienzo and Wilson, possibly because the African population did not experience either a bottleneck or a major episode of growth at the time of the origin of modern humans (Vigilant et al. 199 1). However, we should probably not read too much into Di Rienzo and Wilson’s African data, because their African samples are small. There are clear waves in the four non-African distributions shown in figure 4, so we have restricted attention to these. Ward et al. (accepted) estimate that the divergence rate in this region of DNA is 33% /nucleotide/Myr, and R. Lundstrom, S. Tavare, and R. H. Ward (personal communication) obtain a com- parable estimate by a different method. For generations of 25 years, this implies that

564 Rogers and Harpending
Table 1 Estimates of Population Sizes and of Date of Expansion of Modern Humans
li and Population &a Years Agob
7.5 x lo+ c Worldd
1.5 x 1o-3 e Worldd
1.49 x 1o-3 r Sardinia* Japan8 Middle Eastg American Indian+
2.163 X lo-“’ SardiniaB Japan8 Middle EasF American lndiansg
1.328 X 1O-4 i Sardinia% Japang Middle East& American Indian@
813 136,897 60,000
1.621 273.193 120,000
255 5,908 34,000 0 25,827 52,000 0 1,049,628 62,000 0 9,612 51,000
488 11,272 64,000 0 49,268 98,000 0 2,002,184 118,000 0 18,337 97,000
734 16,957 96,000 0 74,116 148,000 0 3,011,981 177,000 0 27,585 146,000
* 6J2iL Calculations were based on values of 6, and 6, from figs. 3 and 4. b 25?/2fi. Calculations were based on values of Z from figs. 3 and 4. c Assumes that nucleotide divergence rate is 4%/Myr (Cann et al. 1987). d Source: Cann et al. (1987). e Assumes that nucleotide divergence rate is 2%/Myr (Cann et al. 1987). fAssumes that nucleotide divergence rate is 33%/Myr (Ward et al., accepted). 8 Source: Di Rienzo and Wilson (199 I ). h Assumes that nucleotide divergence rate is 17.3%/Myr (Vigilant et al. 1991). i Assumes that nucleotide divergence rate is I l.SW/Myr (Vigilant et al. 1991).
p = 4.1 X 10e6/generation and that u = 360~ = 0.00149. This estimate was used to obtain the results shown in the second group of data in table 1, which indicate that all these populations underwent a population expansion 34,000-62,000 years ago.
A more conservative estimate of the divergence rate in the control region has just been published by Vigilant et al. ( 199 1, p. 1506). They put the divergence rate at 1 lS%-17.3%/Myr, which implies that u = 1.328 X 10m4-2.163 X 10v4 and that u is between 5.175 X lop4 and 7.785 X 10e4. As shown in last two groups of data in table 1, these estimates of u imply an earlier date-i.e., 64,000- 177,000 years ago- for the population expansion.
It is not clear which estimate of u is more accurate. Ward et al. (accepted) em- phasize that their estimate of the mutation rate makes a number of assumptions that will tend to bias it upward. This would introduce a downward bias into our estimates of the time in years since the population expansion. Thus, unbiased estimates would probably be somewhat larger than those in the second group shown in table 1. On the other hand, the estimates of Vigilant et al. are probably biased in the opposite direction. Whereas Ward et al.‘s estimate refers to exactly the region of DNA under study, the estimate by Vigilant et al. refers to a region that is nearly twice as large, including both hypervariable regions of the mitochondrial control region. Since the mean mu- tation rate per nucleotide is smaller in this larger region, the results of Vigilant et al.
Distributional Waves in Genetic Differences 565
should lead to an underestimate of u and, consequently, to overestimates of the time since the population expansion. Thus, the estimated dates in the last two groups of data in table 1 are probably too early. In spite of these uncertainties (and the additional uncertainty caused by sampling errors), the estimates obtained from the data in figure 4 are in substantial agreement with that obtained from the world sample from Cann et al. ( 1987). The signature of an early population explosion appears in non-African populations throughout the world.
The largest sample of human mitochondrial DNA is that assembled by Wallace and his colleagues and described most recently by Merriwether et al. (accepted). This sample has been studied using a set of six restriction enzymes, half the number used by Cann et al. ( 1987). Andrew Clark (personal communication) has estimated the number of substitutions between each pair of haplotypes, and from these he has tab- ulated the distribution of pairwise differences. The mode of this distribution is at 0, and it exhibits the sort of irregularities seen in the equilibrium distributions in fig- ure 5. We are at a loss to explain the difference between these data and those dis- cussed above.
Discussion
Much has been written lately about the age of the common ancestor of all human mitochondria (Brown 1980; Cann et al. 1987; Vigilant et al. 1989, 199 1; Hasegawa and Horai 199 1). The dates that have been proposed are widely quoted in articles dealing with the origin and expansion of modem humans. Yet, it is not clear that they have any real bearing on this subject. Our common mitochondrial ancestor probably lived well before the origin of modern humans, and an accurate date of her lifetime would not tell us when, where, or how modem humans evolved.
The history of late Pleistocene population growth, on the other hand, is a matter of considerable importance, for it can help to distinguish between the “replacement” and “multiregional” hypotheses of modern human origins (Stringer and Andrews 1988; Wolpoff 1989). The replacement hypothesis holds that, some 40,000-120,000 years ago, modem Homo sapiens expanded throughout the world (Klein 1989)) re- placing existing populations of H. erectus and archaic H. sapiens. In terms of our parameters, the replacement hypothesis requires both that 8, be significantly greater than 80 (otherwise there is no evidence of expansion) and that z (which measures, on a mutational time scale, the time of the expansion) be consistent with 40,000- 120,000- years-ago interval during which modem humans are thought to have originated. The data summarized in table 1 seem consistent with these expectations and thus provide some support for the replacement hypothesis.
Yet the evidence for a population expansion does not weigh against the multire- gional hypothesis, for this hypothesis does not preclude a population expansion during this period. However, the multiregional hypothesis is not consistent with the notion that, prior to the expansion, the human population contained ~2,000 females. The multiregional model holds that vast regions of Europe, Africa, and Asia were contin- uously inhabited, and this could not have been accomplished by a population so small. For example, if 1,000 females were evenly distributed over this area, which contains -80 million km2, the distance between neighboring females would have been -300 km. It is more likely that they would have been aggregated into groups; and the distances between these groups would necessarily have been even larger. It is doubtful that mating could have occurred over such distances. Thus, if our estimates of No are even approximately correct, then the multiregional hypothesis must be false.

566 Rkgers and Harpending
However, this analysis will not settle the issue. The standard errors of our estimates are as yet unknown and may well be large. In addition, there are several sources of bias in our estimates of population size. Estimates of $ (and thus of No) are probably biased by the assumption that the initial population was in equilibrium. In the model of sudden expansion from equilibrium, the slope of the leading face of the wave is determined by the size of the initial population. The smaller this population, the steeper will be the wave’s leading face. However, bottlenecks also tend to make this face steeper. Thus, if the waves in the data were produced by bottlenecks, then our estimates of O0 may be unrealistically low. In addition, our estimates of 8, (and thus of N, ) are probably biased because of the fact that the human population is geograph- ically structured. Mating is not at random but usually occurs between close neighbors. This inflates the value of F0 and may account for the elevated left shoulders of the distributions for Sardinia and American Indians in figure 4. These inflated values of F. cause a downward bias in estimates of 8,. Thus, our estimates of population size are probably all biased downward.
The Amerindian data show evidence of a population expansion that began during the period when modern humans were first expanding through the Old World. Con- ventional wisdom holds that the Americas were not colonized until - 12,000 ago, and even the earliest respectable dates (Dillehay and Collins 1988) would not place this event much earlier than 33,000 ago. Other research has suggested that the original colonists passed through a narrow bottleneck at this time (Wallace et al. 1985). This narrow bottleneck should have generated a recent wave in the distribution of pairwise differences; yet, no such wave appears. This suggests that the Amerindian bottleneck, if one occurred, was not pronounced. A similar conclusion has been reached by Ward et al. (accepted).
Acknowledgments
We are grateful for comments from Elizabeth Cashdan, Eric Charnov, Kristen Hawkes, Lynn Jorde, Ron Lundstrom, John McCullough, Mark Stoneking, Naoyuki Takahata, Ryk Ward, and Allan Wilson. We thank Mark Stoneking for providing the data shown in figures 1 and 3, and we thank Anna Di Rienzo for providing the data shown in figure 4. Richard Hudson provided a thoughtful review and corrected a mistake in our formulation of equation (4).
APPENDIX
At equilibrium the time derivative is 0, and equation ( 8) becomes an ODE, df/ di = - f/2uN, which is solved by
f(i) = j=( 0)e-‘/2UN , (11)
where the argument of f is the number of differences between a random pair of individuals. To determine the initial value, f(O), we assume that the probability distribution of i is the sum of a discrete component at i = 0 and a continuous component for i > 0. Since any probability distribution must integrate to unity,
1=&+ s
O*f( i)di .
Substituting equations (6) and ( 11) leads to!(O) = FO.

Distributional Waves in Genetic Differences 567
To find a nonequilibrium formula, substitute g = fe’lN into equation (8), producing
ag/at = -2uagldi. (12)
This is the equation for a nondispersive wave, traveling at rate 2u (Strang 1986, p. 542). Since f = gemtIN, we conclude that the wave in ftravels at rate 2u and that its amplitude decreases exponentially at rate 1 /N.
Equation ( 12) is solved by h( i - 2ut), where h is an arbitrary function. Thus,
f( i, t) = e-‘lNh( i - 2ut) (i > 0) . (13)
The function h must be determined from boundary conditions, of which there are two. First,f( i, 0) must match the initial distribution, which can take any form. This implies that h(x) = f( x, 0) if x > 0. Second, the probability distribution of i must integrate to unity at each value oft. As before, we assume that this distribution is the sum of a continuous component and a discrete component at i = 0. Thus,
1 = F,(t) + s omf(i, t)di. (14)
Substituting equations (7) and ( 13) produces
s 00
h(x)& = (1 - b)e’lN - (a - b)e-*” . -2ut
Taking the derivative with respect to t leads to
h(x) = be-X’21UY + (a - b)eX (x < 0) f(i) = e-‘lNh(i - 2ut) = be-i/2uN + (a - b)ei-(Zu+llN)t (i < 2ut) .
Putting this together with the result for x > 0 and then reexpressing the result in terms of 8 = 2Nu and r = 2ut produces equation (9). As z + 00 , this equation implies that f(i, 7) + be-‘@, in agreement with equation ( 11).
LITERATURE CITED
AVISE, J. C., J. ARNOLD, R. M. BALL, E. BERMINGHAM, T. LAMB, J. E. NEIGEL, C. A. REEB, and N. C. SAUNDERS. 1987. Intraspecific phylogeography: the mitochondrial DNA bridge between population genetics and systematics. Annu. Rev. Ecol. Syst. 18:489-522.
AVISE, J. C., R. M. BALL, and J. ARNOLD. 1988. Current versus historical population sizes in vertebrate species with high gene flow: a comparison based on mitochondrial DNA lineages and inbreeding theory for neutral mutations. Mol. Biol. Evol. 5:33 l-344.
BROWN, W. M. 1980. Polymorphism in mitochontial DNA of humans as revealed by restriction endonuclease analysis. Proc. Natl. Acad. Sci. USA 77: 1967- 197 1.
CANN, R. L., M. STONEKING, and A. C. WILSON. 1987. Mitochondrial DNA and human evo- lution. Nature 325:3 l-36.

568 Rogers and Harpending
DILLEHAY, T. D. and M. B. COLLINS. 1988. Early cultural evidence from Monte Verde, Chile. Nature 332: 150- 152.
DI RIENZO, A. and A. C. WILSON. 199 1. Branching pattern in the evolutionary tree for human mitochondrial DNA. Proc. Natl. Acad. Sci. USA 88: 1597- 160 1.
FELSENSTEIN, J. 1988. Phylogenies from molecular sequences: inference and reliability. Annu. Rev. Genet. 22:521-565.
-. Estimating effective population size from samples of sequences: inefficiency of paitwise and segregating sites as compared to phylogenetic estimates. Genet. Res. (accepted).
HASEGAWA, M. and S. HORAL. 1991. Time of the deepest root for polymorphism in human mitochondrial DNA. J. Mol. Evol. 32:37-42.
KIMURA, M. 197 1. Theoretical foundation of population genetics at the molecular level. Theor. Popul. Biol. 2: 174-208.
KLEIN, R. G. 1989. The human career: human biological and cultural origins. University of Chicago Press, Chicago.
LI, W.-H. 1977. Distribution of nucleotide differences between two randomly chosen cistrons in a finite population. Genetics 85:331-337.
LUNDSTROM, R. 1990. Stochastic models and statistical methods for DNA sequence data. Ph.D. thesis, University of Utah, Salt Lake City.
MAYNARD SMITH, J. 1990. The Y of human relationships. Nature 344:59 l-592. MELLARS, P. and C. STRINGER, eds. 1989. The human revolution: behavioural and biological
perspectives on the origins of modem humans. Princeton University Press, Princeton, N.J. MERRIWETHER, D. A., A. G. CLARK, S. W. BALLINGER, T. G. SCHURR, H. SOODYALL, T.
JENKINS, S. T. SHERRY, and D. C. WALLACE. The structure of human mitochondrial DNA variation. J. Mol. Evol. (accepted).
NEI, M. 1987. Molecular evolutionary genetics. Columbia University Press, New York. NEI, M. and D. GRAUR. 1984. Extent of protein polymorphism and the neutral mutation
theory. Evol. Biol. 17:73- 118. NEI, M. and F. TAJIMA.. 198 1. DNA polymorphism detectable by restriction endonucleases.
Genetics 97:145-163. SLATKIN, M. and R. R. HUDSON. 199 1. Pairwise comparisons of mitochondrial DNA sequences
in stable and exponentially growing populations. Genetics 129:555-562. SPUHLER, J. N. 1988. Evolution of mitochondrial DNA in monkeys, apes, and humans. Yearbook
Phys. Anthropol. 31: 15-48. STRANG, G. 1986. Introduction to applied mathematics. Wellesley-Cambridge, Wellesley, Mass. STRINGER, C. B. and P. ANDREW% 1988. Genetic and fossil evidence for the origin of modem
humans. Science 239: 1263- 1268. SWOFFORD, D. L., and G. J. OLSEN. 1990. Phylogeny reconstruction. Pp. 41 l-501 in D. M.
HILLIS and C. MORITZ, eds. Molecular systematics. Sinauer, Sunderland, Mass. TAJIMA, F. 1983. Evolutionary relationship of DNA sequences in finite populations. Genetics
105:437-460. -. 1989. The effect of change in population size on DNA polymorphism. Genetics 123:
597-601. TAVAR& S. 1984. Line-of-descent and genealogical processes, and their applications in population
genetics models. Theor. Popul. Biol. 26: 119-164. VIGILANT, L., R. PENNINGTON, H. HARPENDING, T. D. KOCHER, and A. C. WILSON. 1989.
Mitochondrial DNA sequences in single hairs from a southern African population. Proc. Natl. Acad. Sci. USA 86:9350-9354.
VIGILANT, L., M. STONEKING, H. HARPENDING, K. HAWKES, and A. C. WILSON. 199 1. African populations and the evolution of human mitochondrian DNA. Science 253: 1503-l 507.
WALLACE, D. C., K. GARRISON, and W. C. KNOWLER. 1985. Dramatic founder effects in Amerindian mitochondrial DNAs. Am. J. Phys. Anthropol. 68: 149-155.

Distributional Waves in Genetic Differences 569
WARD, R. H., B. L. FRAZIER, K. DEW -JAGER, and S. P%~Bo. Extensive mitochondrial diversity within a single Amerindian tribe. Proc. Natl. Acad. Sci. USA (accepted).
WATTERSON, G. A. 1975. On the number of segregating sites in genetical models without re- combination. Theor. Popul. Biol. 7:256-276.
-. 1984. Lines of descent and the coalescent. Theor. Popul. Biol. 26:77-93. WILLS, C. 1990. Population size bottleneck. Nature 348:398. WOLPOFF, M. H. 1989. Multiregional evolution: the fossil alternative to Eden. Pp. 62-108 in
P. MELLARS and C. STRINGER, eds. The human revolution: behavioural and biological per- spectives on the origins of modem humans. Princeton University Press, Princeton, N.J.
MASATOSHI NEI, reviewing editor
Received August 13, 199 1; revision received November 5, 199 1
Accepted November 5, 199 1