87. profile on the production of rubber …preciseethiopia.com/download/publication/business... ·...
TRANSCRIPT
87. PROFILE ON THE PRODUCTION OF RUBBER
GASKET AND SEALS

87-1
TABLE OF CONTENTS
PAGE
I. SUMMARY 87-2
II. PRODUCT DESCRIPTION & APPLICATION 87-2
III. MARKET STUDY AND PLANT CAPACITY 87-3
A. MARKET STUDY 87-3
B. PLANT CAPACITY & PRODUCTION PROGRM 87-5
IV. MATERIALS AND INPUTS 87-6
A. RAW & AUXILIARY MATERIALS 87-6
B. UTILITIES 87-7
V. TECHNOLOGY & ENGINEERING 87-8
A. TECHNOLOGY 87-8
B. ENGINEERING 87-8
VI. HUMAN RESOURCE & TRAINING REQUIREMENT 87-12
A. HUMAN RESOURCE REQUIREMENT 87-12
B. TRAINING REQUIREMENT 87-13
VII. FINANCIAL ANLYSIS 87-13
A. TOTAL INITIAL INVESTMENT COST 87-14
B. PRODUCTION COST 87-15
C. FINANCIAL EVALUATION 87-16
D. ECONOMIC & SOCIAL BENEFITS 87-18

87-2
I. SUMMARY
This profile envisages the establishment of a plant for the production of gasket and seals with a
capacity of 400 tons per annum. Gasket and seals are mechanical devices that fill the space
between two objects, generally to prevent leakage between the two objects while under
compression.
The demand for gasket and seals is through domestic production and import. The present (2012)
demand for gasket and seals is estimated at 1,168 tons. The demand for gasket and seals is
projected to reach 1,881 tons and 3,030 tons by the year 2017 and 2022, respectively.
The principal raw material required is nitrite rubber, which has to be imported.
The total investment cost of the project including working capital is estimated at Birr 34.92
million. From the total investment cost, the highest share (Birr 28.87 million or 82.67%) is
accounted by fixed investment cost followed by pre operation cost (3.24 million or 9.27%) and
working capital (Birr 2.81 million or 8.05%). From the total investment cost, Birr 17.51 million
or 50.15% is required in foreign currency.
The project is financially viable with an internal rate of return (IRR) of 18.95% and a net present
value (NPV) of Birr 15.45 million, discounted at 10%.
The project can create employment for 47 persons. The establishment of such factory will have a
foreign exchange saving effect to the country by substituting the current imports and also
generates income for the Government in terms of tax revenue and payroll tax.
II. PRODUCT DESCRIPTION AND APPLICATION
Gasket and seals are mechanical devices that fill the space between two objects, generally to
prevent leakage between the two objects while under compression. They save money by
allowing less precise mating surfaces on machine parts which can use them to fill irregularities.
One of the more desirable properties of an effective gasket in industrial applications for
compressed fiber gasket material is the ability to withstand high compressive loads. Most

87-3
industrial gasket applications involve bolts exerting compression well into the 14 MPa (2000 psi)
range or higher.
A washer is a thin plate (typically disk-shaped) with a hole (typically in the middle) that is
normally used to distribute the load of a threaded fastener. Other uses are as a spacer, spring
(Belleville, wave washers), wear pad, preload indicating device, and locking device.
Gaskets used in taps to stop the flow of water are sometimes referred to colloquially as washers;
while they may look similar, however, washers and gaskets are usually made differently and
designed for different functions.
III. MARKET STUDY AND PLANT CAPACITY
A. MARKET STUDY
1. Past Supply and Present Demand
The current demand for rubber gaskets, washers and seals is met mainly through import.
Although it is believed that there is some amount of local production the data could not be found
in the medium and large scale manufacturing industries survey conducted by CSA. As a result
the import data has been analyzed to estimate the unsatisfied demand for the products. Import of
rubber gaskets, washers and seals is given in Table 3.1.
87-4
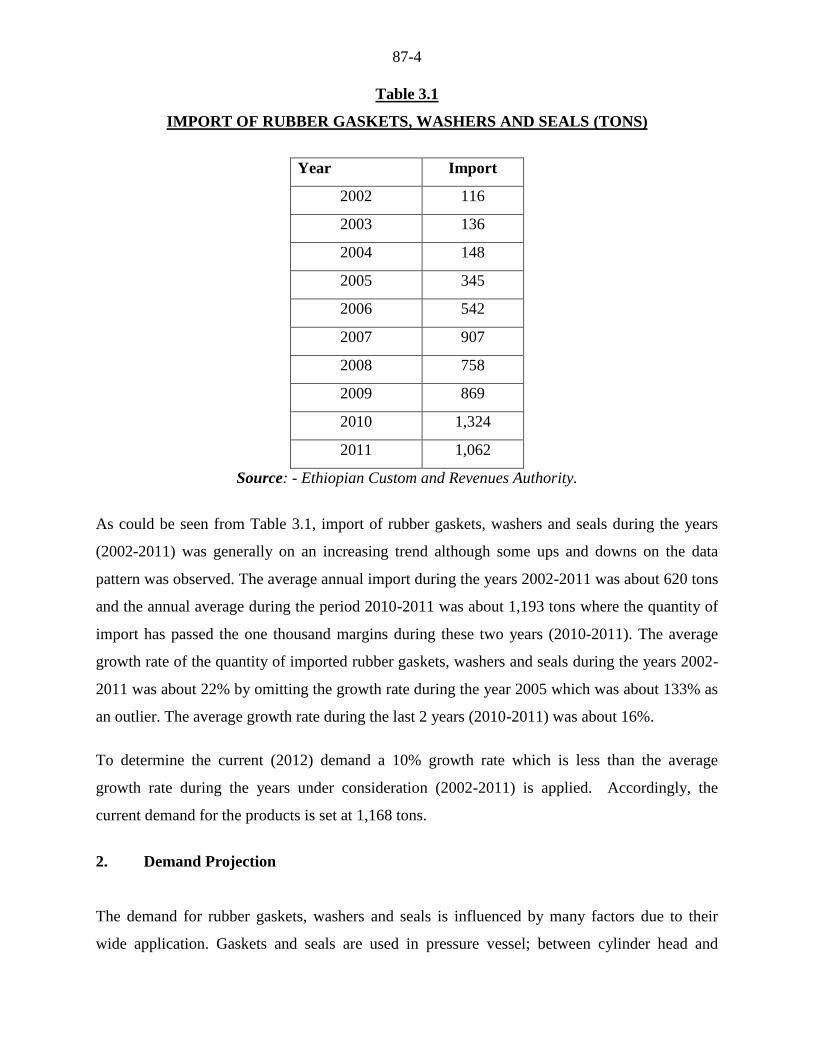
Table 3.1
IMPORT OF RUBBER GASKETS, WASHERS AND SEALS (TONS)
Year Year Import
2002 116
2003 136
2004 148
2005 345
2006 542
2007 907
2008 758
2009 869
2010 1,324
2011 1,062
Source: - Ethiopian Custom and Revenues Authority.
As could be seen from Table 3.1, import of rubber gaskets, washers and seals during the years
(2002-2011) was generally on an increasing trend although some ups and downs on the data
pattern was observed. The average annual import during the years 2002-2011 was about 620 tons
and the annual average during the period 2010-2011 was about 1,193 tons where the quantity of
import has passed the one thousand margins during these two years (2010-2011). The average
growth rate of the quantity of imported rubber gaskets, washers and seals during the years 2002-
2011 was about 22% by omitting the growth rate during the year 2005 which was about 133% as
an outlier. The average growth rate during the last 2 years (2010-2011) was about 16%.
To determine the current (2012) demand a 10% growth rate which is less than the average
growth rate during the years under consideration (2002-2011) is applied. Accordingly, the
current demand for the products is set at 1,168 tons.
2. Demand Projection
The demand for rubber gaskets, washers and seals is influenced by many factors due to their
wide application. Gaskets and seals are used in pressure vessel; between cylinder head and
87-5
cylinder block of automobile engine, in starting piston, breaks etc. Washers are used in joints
(bolts and nuts) or assemblies to insure tightness. Therefore, the demand for the product
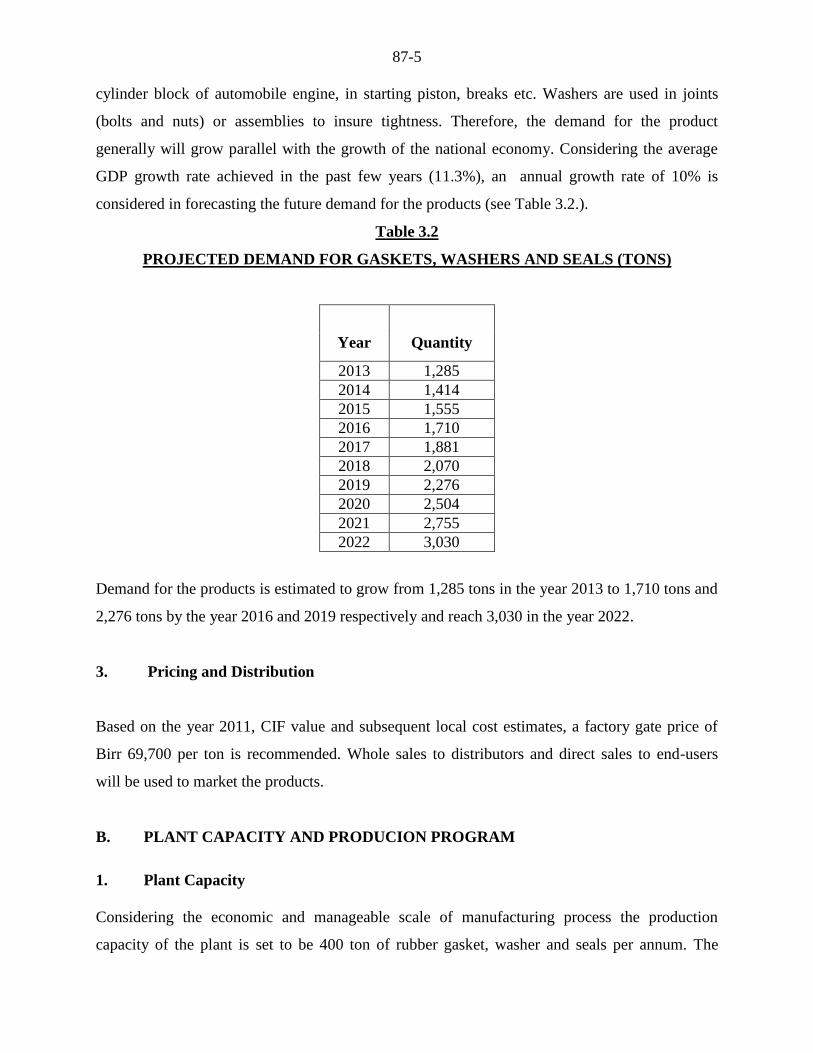
generally will grow parallel with the growth of the national economy. Considering the average
GDP growth rate achieved in the past few years (11.3%), an annual growth rate of 10% is
considered in forecasting the future demand for the products (see Table 3.2.).
Table 3.2
PROJECTED DEMAND FOR GASKETS, WASHERS AND SEALS (TONS)
Year
Quantity
2013 1,285
2014 1,414
2015 1,555
2016 1,710
2017 1,881
2018 2,070
2019 2,276
2020 2,504
2021 2,755
2022 3,030
Demand for the products is estimated to grow from 1,285 tons in the year 2013 to 1,710 tons and
2,276 tons by the year 2016 and 2019 respectively and reach 3,030 in the year 2022.
3. Pricing and Distribution
Based on the year 2011, CIF value and subsequent local cost estimates, a factory gate price of
Birr 69,700 per ton is recommended. Whole sales to distributors and direct sales to end-users
will be used to market the products.
B. PLANT CAPACITY AND PRODUCION PROGRAM
1. Plant Capacity
Considering the economic and manageable scale of manufacturing process the production
capacity of the plant is set to be 400 ton of rubber gasket, washer and seals per annum. The

87-6
envisaged plant will operate in two shifts sixteen hours per day for three hundred days within a
year considering 13 holidays and 52 Sunday per year and assuming that maintenance activities
will be performed during off hours and Sunday
2. Production Program
The plant will operate at different capacity after the implementation until all production factors
start to function properly and also till the operators develop skills and experience for operation
and troubleshooting as shown in Table 3.2
Table 3.2
PRODUCTION PROGRAM
Description Production Year
1 2 3 4
Capacity utilization rate
(%) 65 75 85 100
Gasket, seals and
washers (ton ) 260 300 340 400
IV. MATERIALS AND INPUTS
A. MATERIALS
The major raw material required for production of rubber gaskets, seals and washers is nitrite
rubber, auxiliary raw materials and additives such as GPF black, stearic acid, Zinc oxide and
others. All the raw materials have to be imported. The annual requirement and related cost of the
raw materials is shown in Table 4.1.

87-7
Table 4.1
ANNUAL RAW MATERIAL REQUIREMENT
Sr.
No. Description
Annual
Consum-
ption
UOM
Unit Cost
( Birr)
/Ton
Cost ( "000 ) Birr
LC FC
Total
( Birr)
1 Nitrile rubber 240 ton 32,727.27 7,848.00 7,848.00
2 Sulpher 1 ton 9,818.18 14.13 14.13
3 Stearic acid 2 ton 8,836.36 21.19 21.19
4
Tripoly
phosphate 24 ton 6,545.45 156.96 156.96
5 Zinc oxide 12 ton 10,472.73 125.57 125.57
7 GPF black 90 ton 6,545.45 588.60 588.60
8 Mexaplas PPA 36 ton 6,545.45 235.44 235.44
Total FOB 8,989.88 8,989.88
3 CIF (15%) 1,348.48 1,348.48
Total Annual Cost 1,348.48 8,989.88 10,338.37
B. UTILITES
The main utilities required by the envisaged plant are electricity and water annual cost of utilities
at full capacity operation is Birr 5.28 million. For details see Table 4.2.
Table 4.2
ANNUAL UTILITIES REQUIREMENT & COST
Sr.
No. Description
Annual
Consumption UOM
Unit Cost Total Cost
( Birr)
( "000 Birr
)
1 Electricity 7,560,000 kWh 0.58 4,384.80
2 Water 90,000 m³ 10.00 900.00
Total Annual Cost 5,284.80
87-8
V. TECHNOLOGY AND ENGINNERING
A. TECHNOLOGY
1. Production Process
The manufacturing process of oil seals, rubber and gasket involves mixing of raw materials,
forming and packing. The raw materials are mixed so as to attain uniform blend of the mix,
adequate dispersion of pigments, uniform degree of dispersion and viscosity.
The mixing mill is used for complete and homogenous mixing of the ingredients .The two rollers
of the mixing machine are filled with water and steam to keep the rollers cool in compounding
process and slabs of rubber material will be extruded and cut to pieces to be fed to moulds of
hydraulic press. Rubber sheets of specific thickness are cut to desired size and punched to the
required shapes by power press and rubberized to required shapes.
In general to manufacture those rubber products, rubber compounds are cut into moulds and
pressed with the help of hand press, which are heated with steam, cut to required sizes and
finally packed for the market.
2. Environmental Impact
The envisaged plant is a manufacturing plant with no chemical or any hazardous waste to the
surrounding environment and process scrapes and wastes will be recycled or sold to surrounding
market for different application. Therefore, there will not be additional investment for
environmental protection.
B. ENGINNERING
1. Machinery and Equipment
Total cost of machinery & equipment is Birr 20.13 million, out of which Birr 17.51 million is
required in foreign currency. The machinery and equipments required for the envisaged plant
together with their associated cost is shown in Table 5.1.

87-9
Table 5.1
MACHINERY AND EQUIPMENT REQUREMENT AND COST
Sr.
No. Description Qty. UOM
Unit Cost
( Birr)
Cost ( `000 Birr )
LC FC Total
1 Rubber mixing mill 1 pcs 5,400,000 5,400.0 5,400.0
2 Hydraulic press 3 pcs 540,000 1,620.0 1,620.0
3 Steam heated press 2 pcs 2,160,000 4,320.0 4,320.0
4 Boiler 1 pcs 900,000 900.0 900.0
5 Power press 4 pcs 252,000 1,008.0 1,008.0
6 Shearing machine 1 pcs 540,000 540.0 540.0
7
Extruder /calander
machine 1 pcs 1,260,000 1,260.0 1,260.0
8 Lathe 1 pcs 720,000 720.0 720.0
9 Milling machine 1 pcs 720,000 720.0 720.0
10
Hydraulic press
machine 1 pcs 360,000 360.0 360.0
11 Welding 1 pcs 27,000 27.0 27.0
12 Bench grinder 1 pcs 5,400 5.4 5.4
13 Compressor 1 pcs 630,000 630.0 630.0
Total Fob Price 17,510.4 17,510.4
14 CIF (15%) 2,626.6 2,626.6
Grand Total Cost 2,626.6 17,510.4 20,137.0
2. Land, Building and Civil Works
The envisaged plant requires total land area of 3,000 meter square, out of which built -up are is
1,500 meter square. At the rate of Birr 5,000 per m2, the total cost of building and civil work is
estimated at Birr 7.5 million.
According to the Federal Legislation on the Lease Holding of Urban Land (Proclamation No.
721/2004) in principle, urban land permit by lease is on auction or negotiation basis, however,
the time and condition of applying the proclamation shall be determined by the concerned
regional or city government depending on the level of development.
87-10
The legislation has also set the maximum on lease period and the payment of lease prices. The
lease period ranges from 99 years for education, cultural research health, sport, NGO , religious
and residential area to 80 years for industry and 70 years for trade while the lease payment
period ranges from 10 years to 60 years based on the towns grade and type of investment.
Moreover, advance payment of lease based on the type of investment ranges from 5% to
10%.The lease price is payable after the grace period annually. For those that pay the entire
amount of the lease will receive 0.5% discount from the total lease value and those that pay in
installments will be charged interest based on the prevailing interest rate of banks. Moreover,
based on the type of investment, two to seven years grace period shall also be provided.
However, the Federal Legislation on the Lease Holding of Urban Land apart from setting the
maximum has conferred on regional and city governments the power to issue regulations on the
exact terms based on the development level of each region.
In Addis Ababa, the City’s Land Administration and Development Authority is directly
responsible in dealing with matters concerning land. However, regarding the manufacturing
sector, industrial zone preparation is one of the strategic intervention measures adopted by the
City Administration for the promotion of the sector and all manufacturing projects are assumed
to be located in the developed industrial zones.
Regarding land allocation of industrial zones if the land requirement of the project is below
5,000 m2, the land lease request is evaluated and decided upon by the Industrial Zone
Development and Coordination Committee of the City’s Investment Authority. However, if the
land request is above 5,000 m2, the request is evaluated by the City’s Investment Authority and
passed with recommendation to the Land Development and Administration Authority for
decision, while the lease price is the same for both cases.
Moreover, the Addis Ababa City Administration has recently adopted a new land lease floor
price for plots in the city. The new prices will be used as a benchmark for plots that are going to
be auctioned by the city government or transferred under the new “Urban Lands Lease Holding
Proclamation.”

87-11
The new regulation classified the city into three zones. The first Zone is Central Market District
Zone, which is classified in five levels and the floor land lease price ranges from Birr 1,686 to
Birr 894 per m2. The rate for Central Market District Zone will be applicable in most areas of the
city that are considered to be main business areas that entertain high level of business activities.
The second zone, Transitional Zone, will also have five levels and the floor land lease price
ranges from Birr 1,035 to Birr 555 per m2 .This zone includes places that are surrounding the city
and are occupied by mainly residential units and industries.
The last and the third zone, Expansion Zone, is classified into four levels and covers areas that
are considered to be in the outskirts of the city, where the city is expected to expand in the future.
The floor land lease price in the Expansion Zone ranges from Birr 355 to Birr 191 per m2
(see
Table 5.2).
Table 5.2
NEW LAND LEASE FLOOR PRICE FOR PLOTS IN ADDIS ABABA
Zone Level
Floor
Price/M2
Central Market
District
1st 1686
2nd
1535
3rd
1323
4th
1085
5th
894
Transitional zone
1st 1035
2nd
935
3rd
809
4th
685
5th
555
Expansion zone
1st 355
2nd
299
3rd
217
4th
191
Accordingly, in order to estimate the land lease cost of the project profiles it is assumed that all
new manufacturing projects will be located in industrial zones located in expansion zones.
87-12
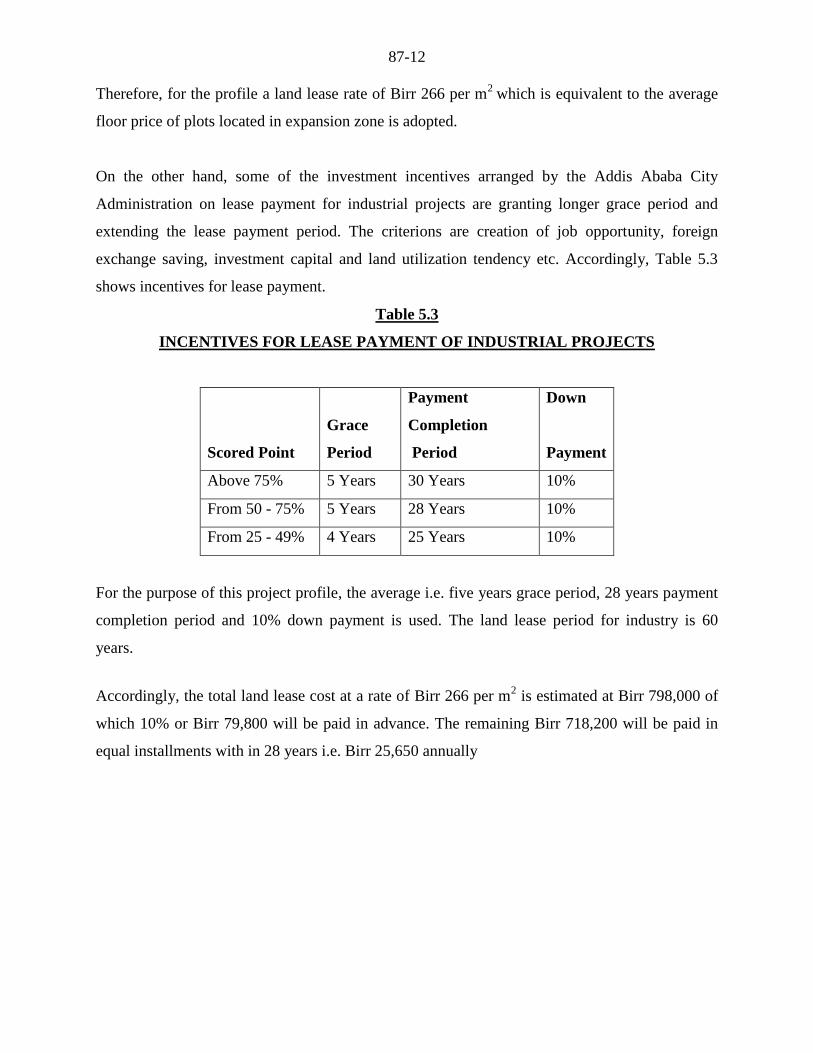
Therefore, for the profile a land lease rate of Birr 266 per m2
which is equivalent to the average
floor price of plots located in expansion zone is adopted.
On the other hand, some of the investment incentives arranged by the Addis Ababa City
Administration on lease payment for industrial projects are granting longer grace period and
extending the lease payment period. The criterions are creation of job opportunity, foreign
exchange saving, investment capital and land utilization tendency etc. Accordingly, Table 5.3
shows incentives for lease payment.
Table 5.3
INCENTIVES FOR LEASE PAYMENT OF INDUSTRIAL PROJECTS
Scored Point
Grace
Period
Payment
Completion
Period
Down
Payment
Above 75% 5 Years 30 Years 10%
From 50 - 75% 5 Years 28 Years 10%
From 25 - 49% 4 Years 25 Years 10%
For the purpose of this project profile, the average i.e. five years grace period, 28 years payment
completion period and 10% down payment is used. The land lease period for industry is 60
years.
Accordingly, the total land lease cost at a rate of Birr 266 per m2 is estimated at Birr 798,000 of
which 10% or Birr 79,800 will be paid in advance. The remaining Birr 718,200 will be paid in
equal installments with in 28 years i.e. Birr 25,650 annually
87-13
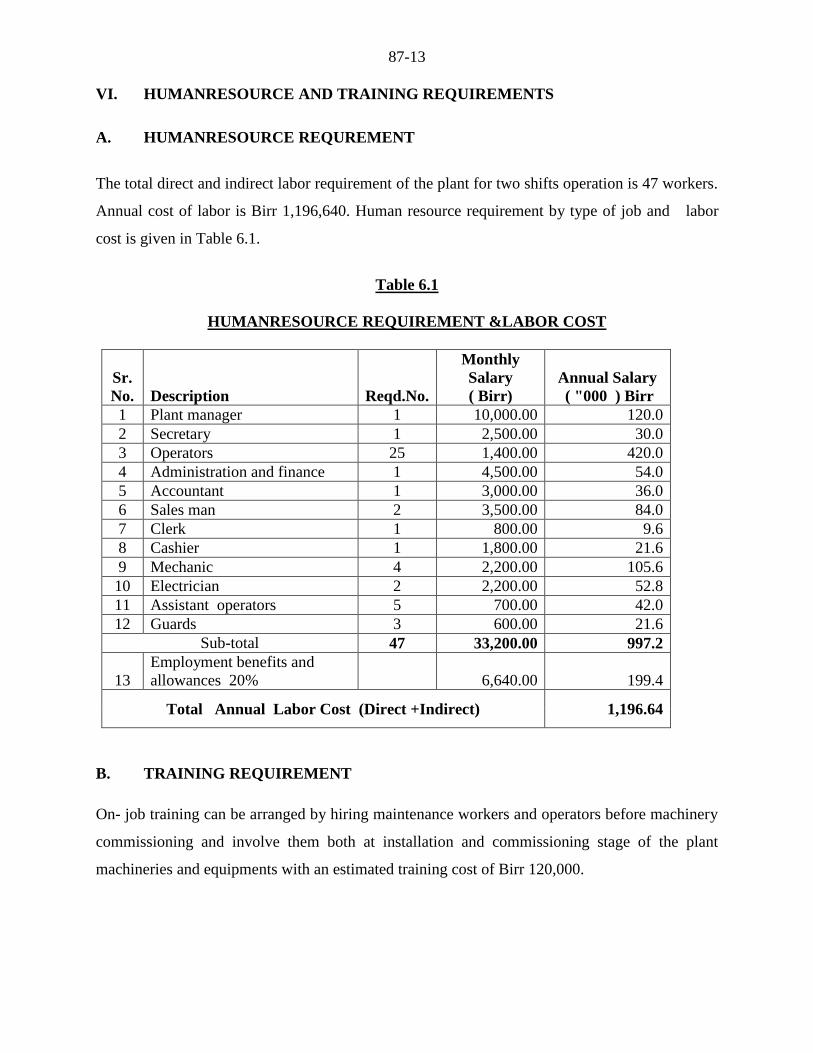
VI. HUMANRESOURCE AND TRAINING REQUIREMENTS
A. HUMANRESOURCE REQUREMENT
The total direct and indirect labor requirement of the plant for two shifts operation is 47 workers.
Annual cost of labor is Birr 1,196,640. Human resource requirement by type of job and labor
cost is given in Table 6.1.
Table 6.1
HUMANRESOURCE REQUIREMENT &LABOR COST
Sr.
No. Description Reqd.No.
Monthly
Salary
( Birr)
Annual Salary
( "000 ) Birr
1 Plant manager 1 10,000.00 120.0
2 Secretary 1 2,500.00 30.0
3 Operators 25 1,400.00 420.0
4 Administration and finance 1 4,500.00 54.0
5 Accountant 1 3,000.00 36.0
6 Sales man 2 3,500.00 84.0
7 Clerk 1 800.00 9.6
8 Cashier 1 1,800.00 21.6
9 Mechanic 4 2,200.00 105.6
10 Electrician 2 2,200.00 52.8
11 Assistant operators 5 700.00 42.0
12 Guards 3 600.00 21.6
Sub-total 47 33,200.00 997.2
13
Employment benefits and
allowances 20% 6,640.00 199.4
Total Annual Labor Cost (Direct +Indirect) 1,196.64
B. TRAINING REQUIREMENT
On- job training can be arranged by hiring maintenance workers and operators before machinery
commissioning and involve them both at installation and commissioning stage of the plant
machineries and equipments with an estimated training cost of Birr 120,000.

87-14
VII. FINANCIAL ANALYSIS
The financial analysis of the sheet glass project is based on the data presented in the previous
chapters and the following assumptions:-
Construction period 1 year
Source of finance 30 % equity & 70% loan
Tax holidays 3 years
Bank interest 10%
Discount cash flow 10%
Accounts receivable 30 days
Raw material imported 120 days
Work in progress 1 day
Finished products 30 days
Cash in hand 5 days
Accounts payable 30 days
Repair and maintenance 5% of machinery cost
A. TOTAL INITIAL INVESTMENT COST
The total investment cost of the project including working capital is estimated at Birr 34.92
million (see Table 7.1). From the total investment cost, the highest share (Birr 28.87 million or
82.67%) is accounted by fixed investment cost followed by pre operation cost (3.24 million or
9.27%) and working capital (Birr 2.81 million or 8.05%). From the total investment cost, Birr
17.51 million or 50.15% is required in foreign currency.

87-15
Table 7.1
INITIAL INVESTMENT COST ( ‘000 Birr)
Sr.No Cost Items
Local
Cost
Foreign
Cost
Total
Cost
%
Share
1 Fixed investment
1.1 Land Lease 79.80 79.80 0.23
1.2 Building and civil work 7,500.00 7,500.00 21.48
1.3 Machinery and equipment 2,626.60 17,510.40 20,137.00 57.67
1.4 Vehicles 900.00 900.00 2.58
1.5 Office furniture and equipment 250.00 250.00 0.72
Sub total 11,356.40 17,510.40 28,866.80 82.67
2 Pre operating cost *
2.1 Pre operating cost 954.11 954.11 2.73
2.2 Interest during construction 2,284.32 2,284.32 6.54
Sub total 3,238.43 3,238.43 9.27
3 Working capital ** 2,812.30 2,812.30 8.05
Grand Total 17,407.14 17,510.40 34,917.54 100
* N.B Pre operating cost include project implementation cost such as installation, startup,
commissioning, project engineering, project management etc and capitalized interest during
construction.
** The total working capital required at full capacity operation is Birr 4.14 million. However,
only the initial working capital of Birr 2.81 million during the first year of production is
assumed to be funded through external sources. During the remaining years the working
capital requirement will be financed by funds to be generated internally (for detail working
capital requirement see Appendix 7.A.1).
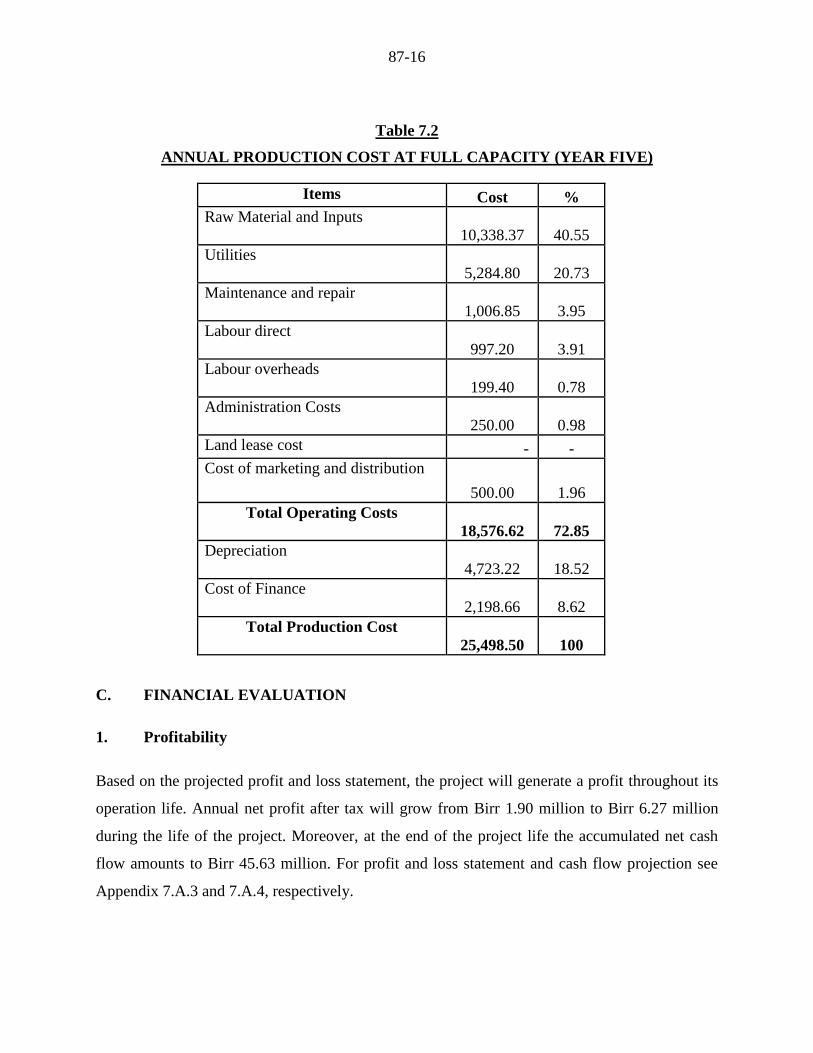
B. PRODUCTION COST
The annual production cost at full operation capacity is estimated at Birr 25.45 million (see Table
7.2). The cost of raw material account for 40.61% of the production cost. The other major
components of the production cost are utility, depreciation and financial cost, which account for
20.76%, 18.55% and 8.47%, respectively. The remaining 11.60 % is the share of labor,
marketing and distribution, labor overhead and administration cost. For detail production cost see
Appendix 7.A.2.
87-16
Table 7.2
ANNUAL PRODUCTION COST AT FULL CAPACITY (YEAR FIVE)
Items Cost %
Raw Material and Inputs
10,338.37 40.55
Utilities
5,284.80 20.73
Maintenance and repair
1,006.85 3.95
Labour direct
997.20 3.91
Labour overheads
199.40 0.78
Administration Costs
250.00 0.98
Land lease cost - -
Cost of marketing and distribution
500.00 1.96
Total Operating Costs
18,576.62 72.85
Depreciation
4,723.22 18.52
Cost of Finance
2,198.66 8.62
Total Production Cost
25,498.50 100
C. FINANCIAL EVALUATION
1. Profitability
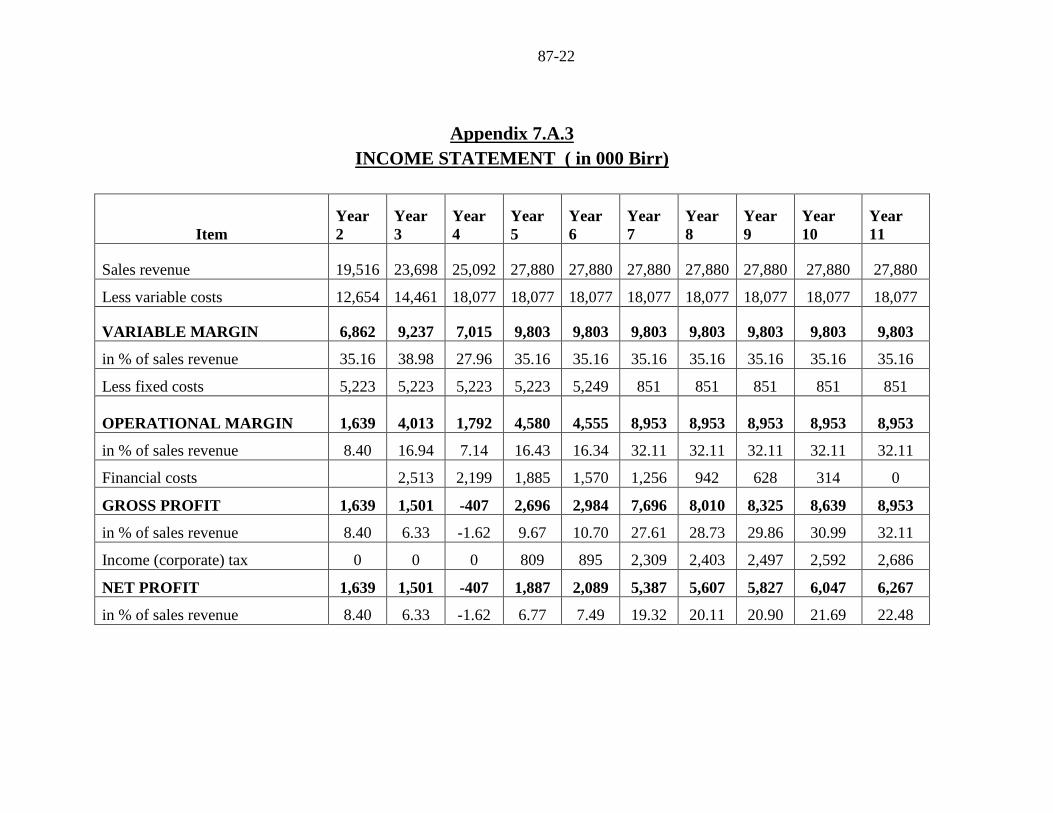
Based on the projected profit and loss statement, the project will generate a profit throughout its
operation life. Annual net profit after tax will grow from Birr 1.90 million to Birr 6.27 million
during the life of the project. Moreover, at the end of the project life the accumulated net cash
flow amounts to Birr 45.63 million. For profit and loss statement and cash flow projection see
Appendix 7.A.3 and 7.A.4, respectively.

87-17
2. Ratios
In financial analysis financial ratios and efficiency ratios are used as an index or yardstick for
evaluating the financial position of a firm. It is also an indicator for the strength and weakness of
the firm or a project. Using the year-end balance sheet figures and other relevant data, the most
important ratios such as return on sales which is computed by dividing net income by revenue,
return on assets (operating income divided by assets), return on equity (net profit divided by
equity) and return on total investment (net profit plus interest divided by total investment) has
been carried out over the period of the project life and all the results are found to be satisfactory.
3. Break-even Analysis
The break-even analysis establishes a relationship between operation costs and revenues. It
indicates the level at which costs and revenue are in equilibrium. To this end, the break-even
point for capacity utilization and sales value estimated by using income statement projection are
computed as followed.
Break -Even Sales Value = Fixed Cost + Financial Cost = Birr 11,709,600
Variable Margin ratio (%)
Break- Even Capacity utilization = Break -even Sales Value X 100 = 53 %
Sales revenue
4. Pay-back Period
The pay -back period, also called pay – off period is defined as the period required for recovering
the original investment outlay through the accumulated net cash flows earned by the project.
Accordingly, based on the projected cash flow it is estimated that the project’s initial investment
will be fully recovered within 6 years.
5. Internal Rate of Return
The internal rate of return (IRR) is the annualized effective compounded return rate that can be
earned on the invested capital, i.e., the yield on the investment. Put another way, the internal rate

87-18
of return for an investment is the discount rate that makes the net present value of the
investment's income stream total to zero. It is an indicator of the efficiency or quality of an
investment. A project is a good investment proposition if its IRR is greater than the rate of return
that could be earned by alternate investments or putting the money in a bank account.
Accordingly, the IRR of this project is computed to be 18.95% indicating the viability of the
project.
6. Net Present Value
Net present value (NPV) is defined as the total present (discounted) value of a time series of cash
flows. NPV aggregates cash flows that occur during different periods of time during the life of a
project in to a common measuring unit i.e. present value. It is a standard method for using the
time value of money to appraise long-term projects. NPV is an indicator of how much value an
investment or project adds to the capital invested. In principle, a project is accepted if the NPV is
non-negative.
Accordingly, the net present value of the project at 10% discount rate is found to be Birr 15.45
million which is acceptable. For detail discounted cash flow see Appendix 7.A.5.
D. ECONOMIC AND SOCIAL BENEFITS
The project can create employment for 47 persons. The project will generate Birr 14.19 million
in terms of tax revenue. The establishment of such factory will have a foreign exchange saving
effect to the country by substituting the current imports. The project will also generate other
income for the Government.

87-19
Appendix 7.A
FINANCIAL ANALYSES SUPPORTING TABLES

87-20
Appendix 7.A.1
NET WORKING CAPITAL ( in 000 Birr)
Items
Year
2
Year
3
Year
4
Year
5
Year
6
Year
7
Year
8
Year
9
Year
10
Year
11
Total inventory 1,809 2,068 2,585 2,585 2,585 2,585 2,585 2,585 2,585 2,585
Accounts receivable 1,096 1,247 1,548 1,548 1,550 1,550 1,550 1,550 1,550 1,550
Cash-in-hand 24 27 34 34 34 34 34 34 34 34
CURRENT ASSETS 2,929 3,342 4,167 4,167 4,169 4,169 4,169 4,169 4,169 4,169
Accounts payable 117 134 167 167 167 167 167 167 167 167
CURRENT
LIABILITIES 117 134 167 167 167 167 167 167 167 167
TOTAL WORKING
CAPITAL 2,812 3,208 4,000 4,000 4,002 4,002 4,002 4,002 4,002 4,002

87-21
Appendix 7.A.2
PRODUCTION COST ( in 000 Birr)
Item Year 2 Year 3 Year 4 Year 5 Year 6 Year 7 Year 8 Year 9 Year 10 Year 11
Raw Material and Inputs 7,237 8,271 10,338 10,338 10,338 10,338 10,338 10,338 10,338 10,338
Utilities 3,699 4,228 5,285 5,285 5,285 5,285 5,285 5,285 5,285 5,285
Maintenance and repair 705 805 1,007 1,007 1,007 1,007 1,007 1,007 1,007 1,007
Labour direct 698 798 997 997 997 997 997 997 997 997
Labour overheads 140 160 199 199 199 199 199 199 199 199
Administration Costs 175 200 250 250 250 250 250 250 250 250
Land lease cost 0 0 0 0 26 26 26 26 26 26
Cost of marketing
and distribution 500 500 500 500 500 500 500 500 500 500
Total Operating Costs 13,154 14,961 18,577 18,577 18,602 18,602 18,602 18,602 18,602 18,602
Depreciation 4,723 4,723 4,723 4,723 4,723 325 325 325 325 325
Cost of Finance 0 2,513 2,199 1,885 1,570 1,256 942 628 314 0
Total Production Cost 17,877 22,197 25,499 25,184 24,896 20,184 19,870 19,555 19,241 18,927
87-22
Appendix 7.A.3
INCOME STATEMENT ( in 000 Birr)
Item
Year
2
Year
3
Year
4
Year
5
Year
6
Year
7
Year
8
Year
9
Year
10
Year
11
Sales revenue 19,516 23,698 25,092 27,880 27,880 27,880 27,880 27,880 27,880 27,880
Less variable costs 12,654 14,461 18,077 18,077 18,077 18,077 18,077 18,077 18,077 18,077
VARIABLE MARGIN 6,862 9,237 7,015 9,803 9,803 9,803 9,803 9,803 9,803 9,803
in % of sales revenue 35.16 38.98 27.96 35.16 35.16 35.16 35.16 35.16 35.16 35.16
Less fixed costs 5,223 5,223 5,223 5,223 5,249 851 851 851 851 851
OPERATIONAL MARGIN 1,639 4,013 1,792 4,580 4,555 8,953 8,953 8,953 8,953 8,953
in % of sales revenue 8.40 16.94 7.14 16.43 16.34 32.11 32.11 32.11 32.11 32.11
Financial costs 2,513 2,199 1,885 1,570 1,256 942 628 314 0
GROSS PROFIT 1,639 1,501 -407 2,696 2,984 7,696 8,010 8,325 8,639 8,953
in % of sales revenue 8.40 6.33 -1.62 9.67 10.70 27.61 28.73 29.86 30.99 32.11
Income (corporate) tax 0 0 0 809 895 2,309 2,403 2,497 2,592 2,686
NET PROFIT 1,639 1,501 -407 1,887 2,089 5,387 5,607 5,827 6,047 6,267
in % of sales revenue 8.40 6.33 -1.62 6.77 7.49 19.32 20.11 20.90 21.69 22.48

87-23
Appendix 7.A.4
CASH FLOW FOR FINANCIAL MANAGEMENT ( in 000 Birr)
Item Year 1 Year 2 Year 3 Year 4 Year 5 Year 6 Year 7 Year 8 Year 9 Year 10 Year 11 Scrap
TOTAL CASH INFLOW 29,821 24,730 23,715 25,125 27,880 27,880 27,880 27,880 27,880 27,880 27,880 10,866
Inflow funds 29,821 5,214 17 33 0 0 0 0 0 0 0 0
Inflow operation 0 19,516 23,698 25,092 27,880 27,880 27,880 27,880 27,880 27,880 27,880 0
Other income 0 0 0 0 0 0 0 0 0 0 0 10,866
TOTAL CASH
OUTFLOW 29,821 18,367 21,028 24,741 24,411 24,211 25,309 25,089 24,869 24,649 21,288 0
Increase in fixed assets 29,821 0 0 0 0 0 0 0 0 0 0 0
Increase in current assets 0 2,929 413 825 0 2 0 0 0 0 0 0
Operating costs 0 12,654 14,461 18,077 18,077 18,102 18,102 18,102 18,102 18,102 18,102 0
Marketing and
Distribution cost 0 500 500 500 500 500 500 500 500 500 500 0
Income tax 0 0 0 0 809 895 2,309 2,403 2,497 2,592 2,686 0
Financial costs 0 2,284 2,513 2,199 1,885 1,570 1,256 942 628 314 0 0
Loan repayment 0 0 3,141 3,141 3,141 3,141 3,141 3,141 3,141 3,141 0 0
SURPLUS (DEFICIT) 0 6,362 2,687 384 3,469 3,669 2,571 2,791 3,011 3,231 6,592 10,866
CUMULATIVE CASH
BALANCE 0 6,362 9,050 9,434 12,903 16,572 19,143 21,934 24,946 28,177 34,769 45,635

87-24
Appendix 7.A.5
DISCOUNTED CASH FLOW ( in 000 Birr)
Item Year 1
Year
2 Year 3
Year
4 Year 5
Year
6 Year 7
Year
8 Year 9
Year
10 Year 11 Scrap
TOTAL CASH INFLOW 0 19,516 23,698 25,092 27,880 27,880 27,880 27,880 27,880 27,880 27,880 10,866
Inflow operation 0 19,516 23,698 25,092 27,880 27,880 27,880 27,880 27,880 27,880 27,880 0
Other income 0 0 0 0 0 0 0 0 0 0 0 10,866
TOTAL CASH OUTFLOW 32,633 13,549 15,753 18,577 19,388 19,497 20,911 21,005 21,100 21,194 21,288 0
Increase in fixed assets 29,821 0 0 0 0 0 0 0 0 0 0 0
Increase in net working capital 2,812 396 792 0 2 0 0 0 0 0 0 0
Operating costs 0 12,654 14,461 18,077 18,077 18,102 18,102 18,102 18,102 18,102 18,102 0
Marketing and Distribution cost 0 500 500 500 500 500 500 500 500 500 500 0
Income (corporate) tax 0 0 0 809 895 2,309 2,403 2,497 2,592 2,686 0
NET CASH FLOW -32,633 5,967 7,945 6,515 8,492 8,383 6,969 6,875 6,780 6,686 6,592 10,866
CUMULATIVE NET CASH FLOW -32,633
-
26,667 -18,722
-
12,206 -3,714 4,669 11,637 18,512 25,292 31,978 38,570 49,437
Net present value -32,633 5,424 6,566 4,895 5,800 5,205 3,934 3,528 3,163 2,836 2,541 4,189
Cumulative net present value -32,633
-
27,209 -20,643
-
15,748 -9,947 -4,743 -809 2,719 5,882 8,718 11,259 15,448
NET PRESENT VALUE 15,448
INTERNAL RATE OF RETURN 18.95%
NORMAL PAYBACK 6 years