89100 merged williams analyst...
TRANSCRIPT

We make energy happen.®
© 2017 The Williams Companies, Inc. All rights reserved.
Williams Analyst Day
May 11, 2017

NYSE: WMB
NYSE: WPZ
williams.com
WE MAKE ENERGY HAPPEN
2017 Analyst Day May 11, 2017
2 © 2017 The Williams Companies, Inc. All rights reserved. Williams Analyst Day 2017 | 5/11/17
Forward-Looking Statements
INTRO & AGENDA
> The reports, filings, and other public announcements of The Williams Companies, Inc. (Williams) and Williams Partners L.P. (WPZ) may contain or incorporate by reference statements that do not directly or exclusively relate to historical facts. Such statements are “forward-looking statements” within the meaning of Section 27A of the Securities Act of 1933, as amended, and Section 21E of the Securities Exchange Act of 1934, as amended. These forward-looking statements relate to anticipated financial performance, management’s plans and objectives for future operations, business prospects, outcome of regulatory proceedings, market conditions and other matters. We make these forward-looking statements in reliance on the safe harbor protections provided under the Private Securities Litigation Reform Act of 1995. All statements, other than statements of historical fact, included in this document that address activities, events or developments that we expect, believe or anticipate will exist or may occur in the future, are forward-looking statements. Forward-looking statements can be identified by various forms of words such as “anticipates,” “believes,” “seeks,” “could,” “may,” “should,” “continues,” “estimates,” “expects,” “forecasts,” “intends,” “might,” “goals,” “objectives,” “targets,” “planned,” “potential,” “projects,” “scheduled,” “will,” “assumes,” “guidance,” “outlook,” “in service date” and other similar expressions. These forward-looking statements are based on management’s beliefs and assumptions and on information currently available to management and include, among others, statements regarding:
– Levels of cash distributions by WPZ with respect to limited partner interests; – Levels of dividends to Williams stockholders; – Future credit ratings of Williams, WPZ and their affiliates; – Amounts and nature of future capital expenditures; – Expansion and growth of Williams’ business and operations; – Financial condition and liquidity; – Business strategy; – Cash flow from operations or results of operations; – Seasonality of certain business components; – Natural gas, natural gas liquids, and olefins prices, supply, and demand; and – Demand for our services.
> Forward-looking statements are based on numerous assumptions, uncertainties and risks that could cause future events or results to be materially different from those stated or implied in this document. Many of the factors that will determine these results are beyond our ability to control or predict. Specific factors that could cause actual results to differ from results contemplated by the forward-looking statements include, among others, the following:
– Whether WPZ will produce sufficient cash flows to provide the level of cash distributions that Williams expects; – Whether Williams is able to pay current and expected levels of dividends; – Whether WPZ elects to pay expected levels of cash distributions and Williams elects to pay expected levels of dividends; – Whether we will be able to effectively execute our financing plan including the receipt of anticipated levels of proceeds from planned asset sales; – Whether Williams will be able to effectively manage the transition in its board of directors and management as well as successfully execute its business restructuring; – Availability of supplies, including lower than anticipated volumes from third parties served by our midstream business, and market demand; – Volatility of pricing including the effect of lower than anticipated energy commodity prices and margins; – Inflation, interest rates, and general economic conditions (including future disruptions and volatility in the global credit markets and the impact of these events on customers and
suppliers); – The strength and financial resources of our competitors and the effects of competition; – Whether we are able to successfully identify, evaluate and timely execute capital projects and other investment opportunities in accordance with our forecasted capital
expenditures budget; – Our ability to successfully expand our facilities and operations; – Development of alternative energy sources;

3 © 2017 The Williams Companies, Inc. All rights reserved. Williams Analyst Day 2017 | 5/11/17
INTRO & AGENDA
Forward-Looking Statements, cont.
– The impact of operational and developmental hazards and unforeseen interruptions, and the availability of adequate insurance coverage for such interruptions; – The impact of existing and future laws, regulations, the regulatory environment, environmental liabilities, and litigation, as well as our ability to obtain permits and achieve
favorable rate proceeding outcomes; – Williams’ costs and funding obligations for defined benefit pension plans and other postretirement benefit plans; – WPZ’s allocated costs for defined benefit pension plans and other postretirement benefit plans sponsored by its affiliates; – Changes in maintenance and construction costs; – Changes in the current geopolitical situation; – Our exposure to the credit risk of our customers and counterparties; – Risks related to financing, including restrictions stemming from debt agreements, future changes in credit ratings as determined by nationally-recognized credit rating agencies
and the availability and cost of capital; – The amount of cash distributions from and capital requirements of our investments and joint ventures in which we participate; – Risks associated with weather and natural phenomena, including climate conditions and physical damage to our facilities; – Acts of terrorism, including cybersecurity threats and related disruptions; and – Additional risks described in our filings with the Securities and Exchange Commission (SEC).
> Given the uncertainties and risk factors that could cause our actual results to differ materially from those contained in any forward-looking statement, we caution investors not to unduly rely on our forward-looking statements. We disclaim any obligations to and do not intend to update the above list or announce publicly the result of any revisions to any of the forward-looking statements to reflect future events or developments.
> In addition to causing our actual results to differ, the factors listed above and referred to below may cause our intentions to change from those statements of intention set forth in this document. Such changes in our intentions may also cause our results to differ. We may change our intentions, at any time and without notice, based upon changes in such factors, our assumptions, or otherwise.
> Because forward-looking statements involve risks and uncertainties, we caution that there are important factors, in addition to those listed above, that may cause actual results to differ materially from those contained in the forward-looking statements. For a detailed discussion of those factors, see Part I, Item 1A. Risk Factors in Williams’ and WPZ’s Annual Reports on Form 10-K filed with the SEC on February 22, 2017.
4 © 2017 The Williams Companies, Inc. All rights reserved. Williams Analyst Day 2017 | 5/11/17
Agenda
INTRO & AGENDA
Continental Breakfast/Registration
Welcome and Introductions John Porter
CEO Perspective Alan Armstrong
Operations Micheal Dunn
Break
Atlantic-Gulf Rory Miller
West Walter Bennett
Break (Box Lunches)
Northeast G&P Jim Scheel
Financial Outlook Don Chappel
Closing Remarks Alan Armstrong

NYSE: WMB
NYSE: WPZ
williams.com
WE MAKE ENERGY HAPPEN
CEO Perspective Alan Armstrong, President and Chief Executive Officer
2 © 2017 The Williams Companies, Inc. All rights reserved. Williams Analyst Day 2017 | 5/11/17 A-
Strategic Focus
Clear Vision Drives Transformation to Energy Infrastructure Leader
CEO PERSPECTIVE
Guiding Principle
Strategy remains focused on natural gas volumes
> North American natural gas to remain globally cost-advantaged, low volatility fuel for long-term
> Increase fee-based revenue
> Reduce commodity exposure
Large-scale, competitive positions generate long-term value
> Strong competitive advantages
> Provides attractive incremental investment opportunity
> Positioned to capture growth and operate efficiently

3 © 2017 The Williams Companies, Inc. All rights reserved. Williams Analyst Day 2017 | 5/11/17 A-
Williams: Unmatched Assets, Uniquely Positioned to Serve Growing Natural Gas Demand
CEO PERSPECTIVE
Positioned for Long-term,
Sustainable Growth
Advantaged Assets Connect to
Opportunities in Stable Natural
Gas Market
Focus on Execution, Delivering on Our
Commitments
4 © 2017 The Williams Companies, Inc. All rights reserved. Williams Analyst Day 2017 | 5/11/17 A-
Our Organization is Energized, Passionate and Focused on Shareholder Value Creation
CEO PERSPECTIVE
Our Imperatives
Safety > Operating safely in everything we do, every day
> Continuing to develop a best-in-class safety culture
Growth > Exercising capital discipline while pursuing attractive growth opportunities that leverage advantaged asset base
Efficiency > Streamlining organization around an even more focused strategy
> Driving continuous improvement in operating margin ratio
Execution > Meeting all of our sanctioned project cost, quality and timeline commitments
Financial Performance
> Driving long-term, sustainable distribution growth with strong coverage and credit profile

5 © 2017 The Williams Companies, Inc. All rights reserved. Williams Analyst Day 2017 | 5/11/17 A-
Advantaged Asset Positions & Stable Natural Gas Market Drive Predictable Growth
6 © 2017 The Williams Companies, Inc. All rights reserved. Williams Analyst Day 2017 | 5/11/17 A-
Source: EIA historical monthly prices, Wood Mackenzie forecasted monthly prices, NYMEX forward curve
U.S. Natural Gas: Stable, Low Volatility Investment vs. Global Commodity Market
CEO PERSPECTIVE
$0
$5
$10
$15
$20
$25
$120
$0
$30
$60
$90
$150 Forecast �
U.S. Natural Gas Revolution
Hurricane Katrina
Natural Gas Henry Hub Spot Price- Wood Mackenzie
Henry Hub Forward Curve
WTI Crude Oil Price- Wood Mackenzie
WTI Forward Curve
$/MMBtu $/Bbl
Speculative Bubble
Financial Crisis
Polar Vortex
OPEC Policy
Change
Less Predictable
Steady Trend

7 © 2017 The Williams Companies, Inc. All rights reserved. Williams Analyst Day 2017 | 5/11/17 A-
Sources: Wood Mackenzie; historical Henry Hub natural gas price per the EIA
Natural Gas Demand, Not Price, Driving Williams’ Growth
CEO PERSPECTIVE
$0.00
$1.00
$2.00
$3.00
$4.00
$5.00
0102030405060708090
100110
2010 2011 2012 2013 2014 2015 2016 2017 2018 2019 2020 2021
$/MM
Btu
Bcf
/d $3.01
$4.37
$2.49
North American Natural Gas Demand by Sector (2010–2021)
Residential/ Commercial
Industrial Power Generation
LNG Exports
Mexico Exports
Transport/ Other
Henry Hub Price
8 © 2017 The Williams Companies, Inc. All rights reserved. Williams Analyst Day 2017 | 5/11/17 A-
Source: Wood Mackenzie
LNG Impact: Exports Increasing Rapidly; Williams Contracted to Continued Volume Growth
CEO PERSPECTIVE
= Williams Partners long-term contract for firm transport to LNG supply
0
2,000
4,000
6,000
8,000
10,000
12,000
MM
cf/d
Sabine Pass Cove Point Cameron Freeport
Corpus Christi Elba Island Annual Average
Gulf Trace: 1,200 MMcf/d
Atlantic Sunrise: 350 MMcf/d
Gulf Connector: 75 MMcf/d
Gulf Connector: 400 MMcf/d
(Forecasted LNG Export Volumes)
U.S. LNG Export Volumes Reach 2.2 Bcf/d in Apr. 2017, Up from 1.4 Bcf/d in Dec. 2016

9 © 2017 The Williams Companies, Inc. All rights reserved. Williams Analyst Day 2017 | 5/11/17 A-
Source: Wood Mackenzie
Williams Capturing Current and Future LNG Export Volumes
CEO PERSPECTIVE
Contracted
Market Access
Contracted
with 4 of 6 LNG Facilities In-service or Under
Construction (~2Bcf/d)
Market Access to Other 2
10 © 2017 The Williams Companies, Inc. All rights reserved. Williams Analyst Day 2017 | 5/11/17 A-
Increased Industrial Demand to Support Ongoing Williams Growth
CEO PERSPECTIVE
0
1,000
2,000
3,000
4,000
5,000
6,000
2017 2018 2019 2020 2021
MM
cf/d
Other Methanol Fertilizers Chemicals Ethylene
50 identified projects
included
Includes modeled growth from
additional, smaller sub-sectors
~600 Mbpd of ethane for
ethylene feedstock
represents ~1.7 Bcf/d natural gas*
Incremental North American Gas Demand From Industrial Facilities Through 2021 by Sector/End Product
Source: Wood Mackenzie & WMB analysis *Incremental 1.7 Bcf/d of natural gas applies to all demand sectors and is not limited to the industrial sector

11 © 2017 The Williams Companies, Inc. All rights reserved. Williams Analyst Day 2017 | 5/11/17 A-
Source: Wood Mackenzie
Williams Well Positioned to Serve Growing Industrial Uses
CEO PERSPECTIVE
50 Industrial Projects Driving
Natural Gas Demand Through 2021
12 © 2017 The Williams Companies, Inc. All rights reserved. Williams Analyst Day 2017 | 5/11/17 A-
*Source: EIA
Williams’ Opportunities to Capture Power Generation Demand Continue
CEO PERSPECTIVE
> Current Projects: Dalton Expansion, Hillabee Phase 1&2, Virginia Southside II
> Power sector continues making long-term investments
– 2017-2021: Additional 88 plants expected to come on line*
> Williams’ assets in close proximity to expected power generation expansion, especially in Northeast and Transco
Well More Than Half of Future Gas-fired Capacity Through 2021 to Be Sited in States Served by Transco

13 © 2017 The Williams Companies, Inc. All rights reserved. Williams Analyst Day 2017 | 5/11/17 A-
Source: EIA
Natural Gas-fired Power Generation Projects Overlap Williams’ Advantaged Asset Footprint
CEO PERSPECTIVE
54 of 88 Projects
Located in Transco Corridor Totaling 33.6 Gigawatts in Nameplate Capacity
14 © 2017 The Williams Companies, Inc. All rights reserved. Williams Analyst Day 2017 | 5/11/17 A-
Note: Chart excludes Canada, Alaska, West Coast, Rockies, Barnett, Gulf Coast conventional and GOM production that amounts to a decline of 2.5 Bcf/d through 2021; CV=Cotton Valley Source: Wood Mackenzie
Williams Positioned to Benefit from Significant Opportunities in Best Plays
CEO PERSPECTIVE
23.2
4.5
9.3
4.8 5.0
37.9
7.7 9.6
8.2 6.1
0
10
20
30
40
Northeast Eagle Ford Mid-Con Permian Haynesville + CV
Bcf
/d
+14.7 Bcf/d
+3.2 Bcf/d
+0.3 Bcf/d +3.4
Bcf/d +1.1 Bcf/d
Northeast Accounts for
More Than 70% of N.A.
Growth
Natural Gas Forecasted Production by Region (2016–2021)

15 © 2017 The Williams Companies, Inc. All rights reserved. Williams Analyst Day 2017 | 5/11/17 A-
Note: CV = Cotton Valley Source: Wood Mackenzie NACPAT
Continued Growth Driven by Position in Most Economic and Largest Remaining Undrilled Gas-directed Reserves
CEO PERSPECTIVE
0
100
200
300
400
500
600
< $2.50 < $3.00 < $3.50 < $4.00 < $4.50 over $4.50
Marcellus Utica Haynesville + CV Remaining Gulf Coast US - Mid-Continent US - Rocky Mountains
Tcfe
Gas-directed Breakevens by U.S. Region ~425 Tcfe Under $4.00 Cumulative Remaining Risked Reserves
Northeast Has ~75% of
the Remaining Risked Reserves
Under $4
16 © 2017 The Williams Companies, Inc. All rights reserved. Williams Analyst Day 2017 | 5/11/17 A-
Focus on Execution, Delivering on Our Commitments

17 © 2017 The Williams Companies, Inc. All rights reserved. Williams Analyst Day 2017 | 5/11/17 A-
CEO PERSPECTIVE
18 © 2017 The Williams Companies, Inc. All rights reserved. Williams Analyst Day 2017 | 5/11/17 A-
Large, Complex Projects Now Driving Predictable Revenues, Sustainable Returns
CEO PERSPECTIVE
Placed $1.6+ Billion of Transco Projects in Service > Mobile Bay South III, CPV Woodbridge, Rockaway Lateral,
Northeast Connector, Virginia Southside, Leidy SE, Gulf Trace
Placed $1.4+ Billion of Deepwater Gulf of Mexico Projects in Service > Keathley Canyon Connector, Kodiak, Gulfstar One (Tubular
Bells & Gunflint)
Other Major Projects > Northeast Expansions, Bucking Horse Plant, Bayou Ethane
& Texas Belle Pipelines

19 © 2017 The Williams Companies, Inc. All rights reserved. Williams Analyst Day 2017 | 5/11/17 A-
Ongoing Execution in Current Regulatory/ Political Environment
CEO PERSPECTIVE
Proactively communicating the tremendous value of U.S. natural gas
Executing robust campaigns to support major projects, especially Atlantic Sunrise > Industry-leading digital/social media
> TV, radio and print advertising
> Significant political, grassroots and community advocacy
> Win-win partnerships with key stakeholders
Progress on the federal landscape, realistic about opposition, especially at the local level
20 © 2017 The Williams Companies, Inc. All rights reserved. Williams Analyst Day 2017 | 5/11/17 A-
Business Model Execution Strong Through Challenging 2015 – 1Q 2017 Period
CEO PERSPECTIVE
Operational & Financial Performance
> New record Transco peak-day volumes & Northeast G&P volumes
> Win-win G&P contract renegotiations (Dry Utica, Haynesville, Barnett & Mid-con)
> Intensified focus on streamlining the organization and reducing costs – 15% headcount reduction; SG&A/O&M costs down ~$130 MM; improving operating
margin ratio
> Delivered 8% WPZ Adjusted EBITDA growth 2016 vs. 2015
Repositioned for Continued, Sustainable, Long-term Growth
> Strengthened credit metrics; Focused on strong sustainable coverage
> Allocating capital to fee-based assets, away from commodity-exposed, consistent with large scale natural gas strategy
> ~$3.3 Billion Monetizations: Canada, Marcellus-for-Permian and Geismar* transactions
> Removed need for equity to fund attractive growth portfolio
*Geismar transaction expected to close in Summer of 2017. Adjusted EBITDA is a non-GAAP financial measure. A reconciliation of all non-GAAP financial measures used in this presentation to their nearest GAAP financial measures is included at the back of this presentation.

21 © 2017 The Williams Companies, Inc. All rights reserved. Williams Analyst Day 2017 | 5/11/17 A-
1 Adjusted EBITDA is a non-GAAP financial measure. A reconciliation of WPZ Adjusted EBITDA to Net Income is included at the back of this presentation. 2 WPZ Peers Include: BWP, ENBL, EPD, ETP, KMI, MMP, PAA, SEP and TRP 3 Historical EBITDA based on reporting disclosure for peer companies except for PAA and SEP in Q1’17 which are based on CapitalIQ consensus estimate as of May 4, 2017. Results reported in $ Canadian are translated to $US based on average exchange rate for each quarter per Capital IQ.
Proven Strategy Demonstrates Resiliency Through Challenging Markets
CEO PERSPECTIVE
Attractive Adjusted EBITDA1 Performance vs. Peers2,3
60
85
110
135
Q1 '15 Q2 '15 Q3 '15 Q4 '15 Q1 '16 Q2 '16 Q3 '16 Q4 '16 1Q'17
WPZ Peer A Peer B Peer C Peer D Peer E Peer F Peer G Peer H Peer I
High-quality fee-based revenue, drives peer-leading stability
and WPZ Adjusted EBITDA growth
WMB: Highly liquid, institutional-friendly option
to invest in WPZ’s underlying business
Fully contracted, fee-based expansion projects, advantaged
assets underpin Williams expected growth
WPZ
22 © 2017 The Williams Companies, Inc. All rights reserved. Williams Analyst Day 2017 | 5/11/17 A-
Today’s Speakers: Deep Dive on Williams’ Commitment to Sustainable, Long-term Growth
CEO PERSPECTIVE
Don Chappel
Chief Financial Officer
Micheal Dunn
Chief Operating Officer
Rory Miller
Senior Vice President,
Atlantic-Gulf
Jim Scheel
Senior Vice President,
Northeast G&P
Walter Bennett Senior Vice
President, West
Focus on operational excellence
Investing in the future of America’s
fastest growing interstate pipeline
Long-term contracts, steady volumes driving
consistent revenues
Assets positioned to
capture significant opportunities
Financial positioning to
provide long-term, sustainable growth

23 © 2017 The Williams Companies, Inc. All rights reserved. Williams Analyst Day 2017 | 5/11/17 A-
Williams: Best Basin Positions, Preeminent Market Access, Unmatched Scale
CEO PERSPECTIVE
Positioned for Long-term,
Sustainable Growth
Advantaged Assets Connect to
Opportunities in Stable Natural
Gas Market
Focus on Execution, Delivering on Our
Commitments

WE MAKE ENERGY HAPPEN
NYSE: WMB
NYSE: WPZ
williams.com
Operations Micheal Dunn, Chief Operating Officer
2 © 2017 The Williams Companies, Inc. All rights reserved. Williams Analyst Day 2017 | 5/11/17 B-
Williams: Focused on Operational Excellence
Safety is the Number One
Company Imperative
Continuously Improving the
Reliability of Our Operations
Disciplined Project Execution and Cost
Management
OPERATIONS

3 © 2017 The Williams Companies, Inc. All rights reserved. Williams Analyst Day 2017 | 5/11/17 B-
Williams’ Operations Team
OPERATIONS
Operating Areas
Operations Support
Walter Bennett West
Rory Miller Atlantic-Gulf
Jim Scheel Northeast G&P
John Seldenrust Engineering Services
Mark Cluff Safety and Ops. Discipline
Larry Larsen Central Services
Brian Letzkus Information Systems
4 © 2017 The Williams Companies, Inc. All rights reserved. Williams Analyst Day 2017 | 5/11/17 B-
> Safety is an Imperative – The safety of our employees and assets
is our highest priority – Commitment to asset and pipeline
integrity programs – Process safety and pipeline integrity
enables our assets to be most reliable for our customers
> Continuous Improvement Safety Culture – Robust safety metrics help us ensure we
are focused on continuously improving – Continuous safety improvement focus
yields reliability benefits
Safety Focus
OPERATIONS
TIER 1 LOPC Events
of Greater Consequence
TIER 2 LOPC Events
of Lesser Consequence
TIER 3 Challenges to Safety Systems
TIER 4 Operating Discipline and Management
System Performance Indicators

5 © 2017 The Williams Companies, Inc. All rights reserved. Williams Analyst Day 2017 | 5/11/17 B-
Reliability
OPERATIONS
> Performance – Strong Preventive Maintenance
Performance – Asset Performance Monitoring /
Optimization
> Predictability – Predictive Failure Analysis – Condition-Based Maintenance
> Continuous Improvement – Reliability programs include embedded
improvement processes – Dedicated team to share operational
lessons learned
Real-Time Gathering System Optimization
6 © 2017 The Williams Companies, Inc. All rights reserved. Williams Analyst Day 2017 | 5/11/17 B-
Williams Project Excellence
OPERATIONS
Williams Project Life Cycle (PLC)
Commercial and FP&A
Development
Execution
Operations
Discover G0 Select G1 Define G2 Deliver G3 Integrate G4 G5
Decide to Initiate
Decide to Proceed
Decide to Continue
Decide to Sanction
Decide to Handover
Decide to Closeout

7 © 2017 The Williams Companies, Inc. All rights reserved. Williams Analyst Day 2017 | 5/11/17 B-
Project Execution Excellence
OPERATIONS
> Disciplined Front End Processes – Well established Project Life Cycle process
– Improved cost estimates & schedules
> Well Orchestrated Project Execution – Highly capable teams led by experienced Project Managers
– Strong permitting and public outreach efforts
> Carefully Coordinated Startups & Handoffs – Improved commissioning processes
> Leadership Engagement in Project Governance – Robust project controls and project reporting cadence
> Multi-Year Efforts Are Paying Off – Leidy Southeast (AG, On Budget; On Time)
– Cabot 5th Expansion (NE, Below Budget, On Time)
– Gulf Trace (AG, Below Budget, 5 months early)
– In-flight projects show similar trends
Williams’ Project Management is Based On:
Gulf Trace Station 44
8 © 2017 The Williams Companies, Inc. All rights reserved. Williams Analyst Day 2017 | 5/11/17 B-
Coming Soon: About $1.5 Billion of Regulated Expansions with Full 2017 ISD Nearing Completion
OPERATIONS
> Transco – Gulf Trace – ~1.2 Bcf/d expansion serving Cheniere Sabine Pass LNG export terminal placed in
service under budget and ahead of schedule
> Transco – Dalton Expansion – 0.4 Bcf/d Power Gen Southern Market Expansion – construction continues – expect full
in-service 3Q 2017 – on time
> Transco – Hillabee Phase 1 – 0.8 Bcf/d Power Gen Southern Market Expansion – construction continues – expect
partial service 2Q, full service 3Q 2017 – on time
> Transco – New York Bay Expansion – 0.1 Bcf/d Northern Market Expansion – expect in-service 4Q 2017 – on time
> Transco – Virginia South Side Phase II – 0.3 Bcf/d Power Gen Southern Market Expansion – expect in-service 4Q 2017 – on time

9 © 2017 The Williams Companies, Inc. All rights reserved. Williams Analyst Day 2017 | 5/11/17 B-
Atlantic Sunrise & Susquehanna Supply Hub Expansion: Key Energy Infrastructure
OPERATIONS
> Atlantic Sunrise: – ~$2.6B1 (100%) Forecasted CapEx; 1.7 Bcf/d Fully Committed;
15-year Binding Firm-Transportation Agreements
– Project Status: • FERC order received Feb 3, 2017 • Full project target in-service date: mid-2018 (financial plan further
risks cash flows by ~6 months, which results in a phased approach)
– Early Mainline Service (Station 195 to Station 85) • Reversals at six Transco stations • Add compression at one Transco station • Construction began on March 16, 2017
– Early Initial Service on Central Penn Line • 186 miles of new pipeline • Add compression at two Transco stations • Subject to certain environmental construction windows
– Full Project In-Service • Two new compressor stations on Central Penn Line
> Northeast G&P: Susquehanna Supply Hub Expansion: – Major expansion allowing Cabot to fulfill 850,000 Dth/d firm
Commitment to Atlantic Sunrise
– 49,000 new horsepower at two new compression facilities and 59 miles of 12” and 24” pipelines
– Key takeaway project expected to drive additional gathering volumes in the region
Atlantic Sunrise 1.7 MMDth/d Mid 2018
Cove Point LNG
1 As per FERC filing.
10 © 2017 The Williams Companies, Inc. All rights reserved. Williams Analyst Day 2017 | 5/11/17 B-
1 Excludes Constitution which is appealing the denial of a required permit, and is not included in financial forecast.
Steady Progress on Over $4 Billion of Projects in the Pipeline with Post-2017 In-Service Dates
OPERATIONS
FERC Certificate Application Filed
FERC Certificate
Major Construction Activities
In-Service
REGULATORY MILESTONES FOR FULLY CONTRACTED REGULATED EXPANSIONS1
Other Federal / State / Local Permits
Gulf Connector Filed 8/16
St. James Supply Filed 2/17
NE Supply Enhancement
Filed 3/17
Hillabee Ph 2 Received 2/16
Garden State Began 2/17
Atlantic Sunrise Began 3/17

11 © 2017 The Williams Companies, Inc. All rights reserved. Williams Analyst Day 2017 | 5/11/17 B-
Sharp Focus on Key Performance Indicator: Operating Margin Percentage
OPERATIONS
> OM% neutralizes diversity in practice among peers in classification of expenses e.g., O&M vs. G&A
> Measured on a GAAP basis for comparison to peers
> Cost efficiency metric designed to measure the percentage of profits impacting the bottom line
> Strong and consistent year-over-year improvement
$ in millions
Operating Margin %1 Performance
53%
57% 60%
45%
50%
55%
60%
65%
$0
$1,500
$3,000
$4,500
$6,000
2014 2015 2016
Gross Margin Operating Margin OM%
> Combination of growth in gross margin and sharp focus on cost efficiency expected to drive increase in operating margin %
> 2017: streamlining operating areas, closing OKC office
~13% Improvement in Operating Margin % from 2014 to 2016
Positioned to Continue Improvement
1 Gross Margin = Total revenues less related product costs expressed here as an absolute amount. Operating Margin % = operating margin / gross margin. Operating margin = gross margin less operating and maintenance costs and selling, general and administrative expenses. Depreciation and amortization expense, impairment charges and other expenses not associated with operating the business are excluded. Operating Margin % is a non-GAAP financial measure. A reconciliation to the most relevant GAAP measure is included in this presentation.
12 © 2017 The Williams Companies, Inc. All rights reserved. Williams Analyst Day 2017 | 5/11/17 B-
Williams: Focused on Operational Excellence
OPERATIONS
Safety is the Number One
Company Imperative
Continuously Improving the
Reliability of Our Operations
Disciplined Project Execution and Cost
Management

WE MAKE ENERGY HAPPEN
NYSE: WMB
NYSE: WPZ
williams.com
Atlantic – Gulf Rory Miller, Senior Vice President
2 © 2017 The Williams Companies, Inc. All rights reserved. Williams Analyst Day 2017 | 5/11/17 C-
Connecting the Best Markets to World’s Lowest-cost Supplies
ATLANTIC – GULF
Executing on $7 Billion in
Projects, Doubling Transco Capacity
20+ Demand-driven Interstate Projects
in Development
New Deepwater Investment Cycle
Underway

3 © 2017 The Williams Companies, Inc. All rights reserved. Williams Analyst Day 2017 | 5/11/17 C-
In service. *Wood Mackenzie 2H 2016 forecasted demand growth through 2021 in states which Transco passes through. **Assuming successful and prompt resolution of permit litigation.
$7 Billion in Interstate Pipeline Expansions Inked and Underway
ATLANTIC – GULF
Leidy Southeast (0.5 Bcf/d)
Virginia Southside II (0.3 Bcf/d) Rock Springs Expansion
(0.2 Bcf/d)
Dalton Expansion (0.4 Bcf/d)
Hillabee Phase 1&2 (1.0 Bcf/d)
Atlantic Sunrise (1.7 Bcf/d)
Constitution** (0.7 Bcf/d)
Bcf/d
Williams New/Recent Project Capacity 7.4
*Forecasted Demand Growth 13.7
St. James Supply (0.2 Bcf/d)
Gulf Trace (1.2 Bcf/d)
New York Bay Expansion (0.1 Bcf/d)
Gulf Connector (0.5 Bcf/d)
Northeast Supply Enhancement
(0.4 Bcf/d)
Garden State Expansion (0.2 Bcf/d)
20+ Additional Projects in
Development
4 © 2017 The Williams Companies, Inc. All rights reserved. Williams Analyst Day 2017 | 5/11/17 C-
1 In-service dates for projects not yet in service represent expected in-service dates. Expected in-service dates assume timely receipt of all necessary regulatory approvals. Constitution, which is appealing the denial of a required permit, is not included in financial forecast.
2 Excludes impact of any early in-service revenues. 3 Targeting partial service to begin 2H 2017, full-in service mid 2018; financial plan further risks cash flows by approximately six months.
Strong EBITDA Projected from Current Project Slate
ATLANTIC – GULF
Transco Project Return Profile – Projects Placed In-service1
2015–2016 20172 2018–2020
Growth Capital Placed In-service ($ B)
$1.5 $1.5 $4.0
Full-year Run Rate Modified EBITDA ($ B)
~ $0.25 ~ $0.25 ~ $0.65
Projects Mobile Bay South 3 CPV Woodbridge
NE Connector Rockaway Lateral Leidy Southeast
Virginia Southside Rock Springs
Garden State I Gulf Trace
Dalton Hillabee (Ph. 1)
Virginia Southside II NY Bay Expansion
St. James Supply Gulf Connector
NE Supply Enhancement Hillabee (Ph. 2) Garden State II
Atlantic Sunrise3

5 © 2017 The Williams Companies, Inc. All rights reserved. Williams Analyst Day 2017 | 5/11/17 C-
Note: Includes all system deliveries and all zones. 1 Contracted Incremental Expansion Projects include: Gulf Trace: 1.2 MMDt/d (placed in-service Feb 1, 2017); Hillabee Phase 1 and 2: 1.0 MMDt/d; Dalton: 0.4 MMDt/d; Garden State: 0.2
MMDt/d; Virginia Southside 2: 0.3 MMDt/d; NY Bay Expansion: 0.1 MMDt/d; Atlantic Sunrise: 1.7 MMDt/d; Gulf Connector: 0.5 MMDt/d; NE Supply Enhancement 0.4 MMDt/d; St James Supply: 0.2 MMDt/d.
2 Sum of Heating Degree Days for Mid Atlantic plus South Atlantic regions.
Transco: Doubling Contracted Capacity Since 2010
ATLANTIC – GULF
Transco Peak Day Volumes and Contracted Capacity1 vs Heating Degree Days2
8.5 8.6 8.9 9.5 9.6
10.1 10.1
11.5 11.7
14.5
16.4 17.1
17.7
0
1,000
2,000
3,000
4,000
5,000
6,000
8
10
12
14
16
18
20
2008 2009 2010 2011 2012 2013 2014 2015 2016 2017 2018 2019 2020
Jan-F
eb H
DD
2 M
MD
t/d
Contracted Capacity Peak Day Jan-Feb HDD
6 © 2017 The Williams Companies, Inc. All rights reserved. Williams Analyst Day 2017 | 5/11/17 C-
Interconnects Reflect Unique Position of Transco, a Transportation Network Unlike Any Other
ATLANTIC – GULF
0
1
2
3
4
5
6
7
8
2012 2013 2014 2015 2016 2017+
Des
ign
Cap
acit
y (B
cf/d
)
Bi-directional Delivery Receipt
22 Bcf/d
Since 2012
Annual Installed Interconnect Capacity on Transco Paid for by Others

7 © 2017 The Williams Companies, Inc. All rights reserved. Williams Analyst Day 2017 | 5/11/17 C-
Atlantic Sunrise: Largest-ever Transco Expansion Unlocks Low-cost Supplies for Major Markets
ATLANTIC – GULF
Atlantic Sunrise 1.7 MMDth/d Mid 2018
> In 2019, Atlantic Sunrise expected to account for ~25% of Eastern Interstates’ Modified EBITDA
> Fee based revenue for early in-service in 2018
– Early mainline service ~ $4.5 million/month
– Central Penn line ~ $24 million/month
> When project is fully in service, fee-based revenue will be $35 million/month
Atlantic Sunrise
Remainder of the Eastern Interstates
Cove Point LNG
8 © 2017 The Williams Companies, Inc. All rights reserved. Williams Analyst Day 2017 | 5/11/17 C-
Dalton Expansion: On Track for On-schedule Delivery
ATLANTIC – GULF
Starts at Station 210
Ends at Holmesville,
MS
115 Miles Greenfield
Lateral
> Conservation success story
> Target in-service date: July 2017
– Monthly fee-based revenue of approximately $6 million
> 448 MDth/d
> Customer: AGL, Oglethorpe
> Early mainline service April 2017: ~ $4 million/month fee based revenue
9 © 2017 The Williams Companies, Inc. All rights reserved. Williams Analyst Day 2017 | 5/11/17 C-
205
200
River Road
Rockaway Delivery Point 207
210
195
Narrows
0
207
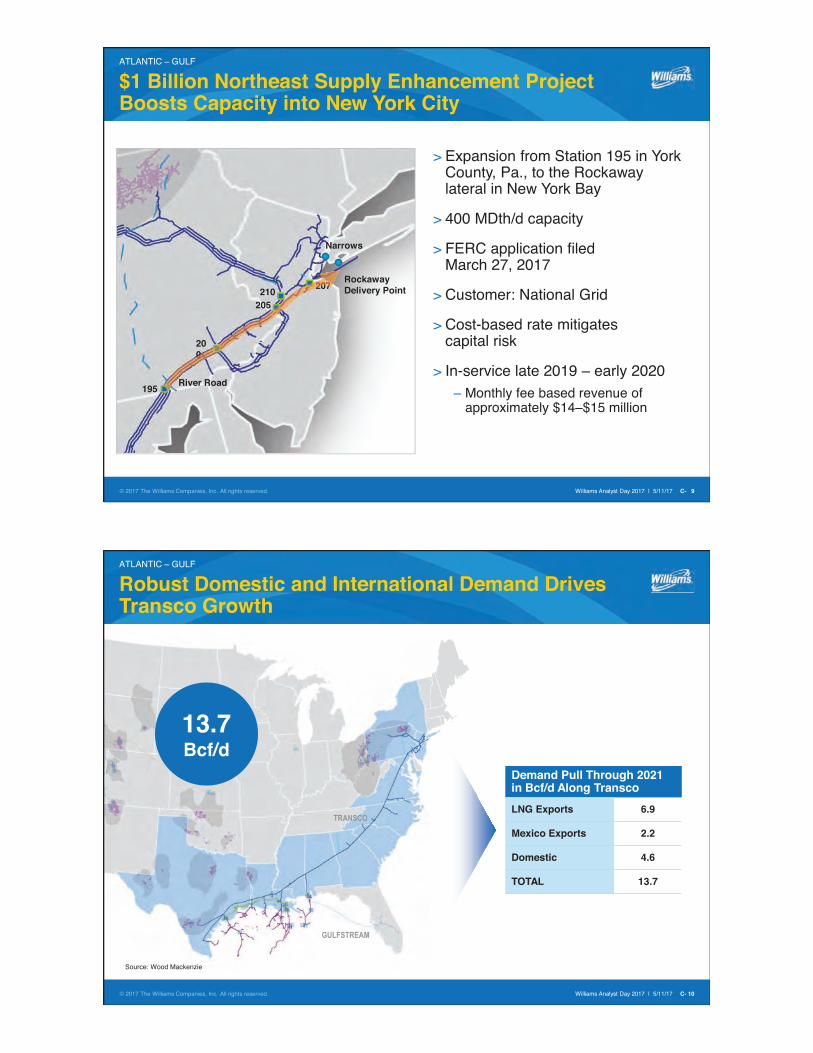
$1 Billion Northeast Supply Enhancement Project Boosts Capacity into New York City
ATLANTIC – GULF
> Expansion from Station 195 in York County, Pa., to the Rockaway lateral in New York Bay
> 400 MDth/d capacity
> FERC application filed March 27, 2017
> Customer: National Grid
> Cost-based rate mitigates capital risk
> In-service late 2019 – early 2020 – Monthly fee based revenue of
approximately $14–$15 million
10 © 2017 The Williams Companies, Inc. All rights reserved. Williams Analyst Day 2017 | 5/11/17 C-
Robust Domestic and International Demand Drives Transco Growth
ATLANTIC – GULF
Demand Pull Through 2021 in Bcf/d Along Transco
LNG Exports 6.9
Mexico Exports 2.2
Domestic 4.6
TOTAL 13.7
Transco Growth
13.7 Bcf/d
TRANSCO
GULFSTREAM
Source: Wood Mackenzie

11 © 2017 The Williams Companies, Inc. All rights reserved. Williams Analyst Day 2017 | 5/11/17 C-
Transco Plays a Key Role in Connecting Low-cost LNG to Global Gas Markets
ATLANTIC – GULF
The gas demand to serve LNG export facilities along
Transco is expected to grow by ~7 Bcf/d through 2021*
> A pipeline reversal to deliver gas to the Sabine Pass Liquefaction Facility 2
> Provides 1.2 Bcf/d of incremental capacity to Transco
> In service Feb. 2017
Gulf Trace
> Will deliver 75 MMcf/d to Freeport’s liquefaction project by the second half of 2018
> Will deliver 400 MMcf/d to Cheniere’s Corpus Christi liquefaction terminal in 2019
Gulf Connector
> 350 MMcf/d capacity to serve Cove Point
Atlantic Sunrise
*Wood Mackenzie
Cove Point
Elba Island
Sabine Pass
ee Cameron aPFreeport FreeepFree
Corpus Christi
12 © 2017 The Williams Companies, Inc. All rights reserved. Williams Analyst Day 2017 | 5/11/17 C-
Gulf Trace: Early in Service, Under Budget
ATLANTIC – GULF

13 © 2017 The Williams Companies, Inc. All rights reserved. Williams Analyst Day 2017 | 5/11/17 C-
Pursuing 20+ Different Demand-Driven Expansion Opportunities Across Eastern Interstates
ATLANTIC – GULF
> Potential projects are primarily demand pull and along existing corridor
– Power generation
– Industrial demand
– LDC demand
– LNG / Mexican exports
> In final negotiations on three projects
7 in the Northeast
4 in the Mid-Atlantic
10 in the Southeast
& Gulf
14 © 2017 The Williams Companies, Inc. All rights reserved. Williams Analyst Day 2017 | 5/11/17 C-
0
50
100
150
200
250
300
Plant Gas Usage at6,800 Btu/kWh,100% Utilization
Plant Gas Usage at65% Utilization
Plant Gas Usage at50% Utilization
Contracted Capacityon Transco
MM
cf/d
Source: WMB analysis
Natural Gas: First Choice for New Power Plants
ATLANTIC – GULF
Transco’s Virginia Southside II Expansion Project to Serve Proposed Gas-fired Power Plant in Greensville County, VA
Transco’s Virginia Southside II Contracted Capacity vs. Potential Power Plant Gas Burn

15 © 2017 The Williams Companies, Inc. All rights reserved. Williams Analyst Day 2017 | 5/11/17 C-
Investing in the Future of America’s Fastest Growing Interstate Gas Pipeline
ATLANTIC – GULF
> Fulfilling obligation to customers, shareholders and public to modernize system
> Defined Transco modernization program to upgrade and/or replace HP/compression and pipeline facilities
> Evaluating various capital recovery methods allowable under FERC policy
– Modernization tracker vs. rate case
> Customer education and participation
> Rate case milestones – Filing date: August 31, 2018
– Base period: June 1, 2017 – May 31, 2018
– Test period: June 1, 2018 – Feb. 28, 2019
– Effective date: March 1, 2019
16 © 2017 The Williams Companies, Inc. All rights reserved. Williams Analyst Day 2017 | 5/11/17 C-
Right Assets, Right Skills Provide Strong Competitive Advantage for New Gulf of Mexico Investment Cycle
ATLANTIC – GULF
Perdido
Salina
Perdido
Salina
17 © 2017 The Williams Companies, Inc. All rights reserved. Williams Analyst Day 2017 | 5/11/17 C-
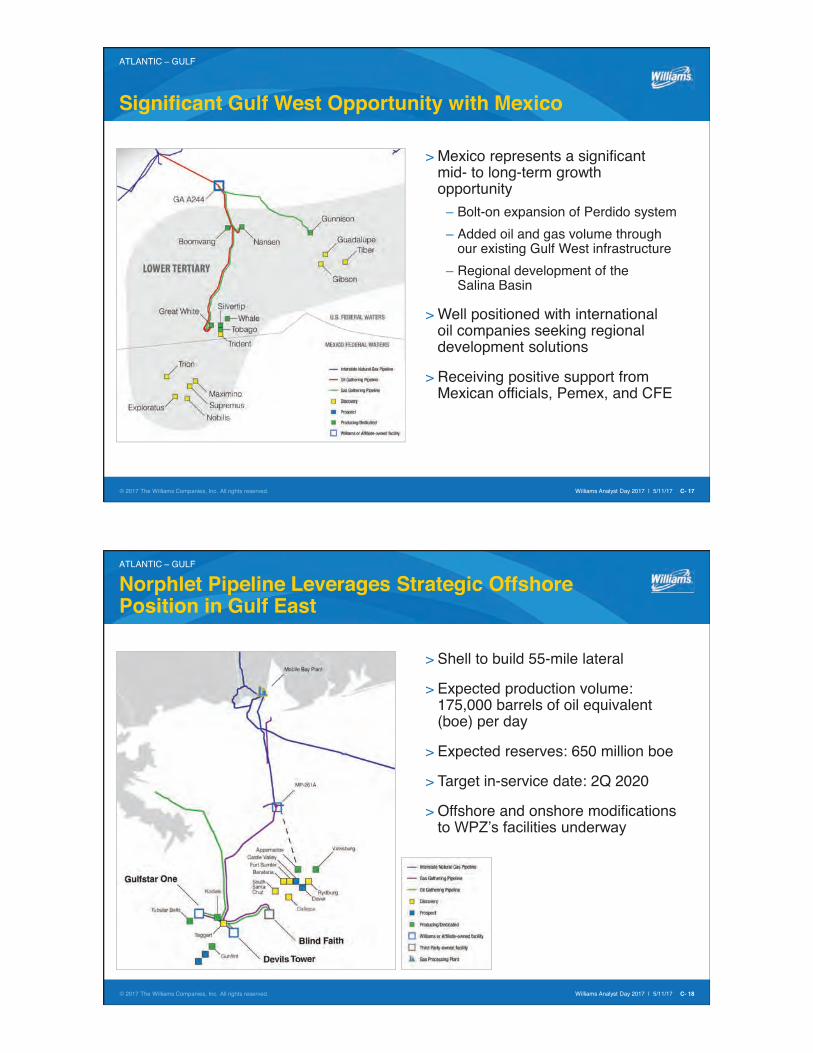
Significant Gulf West Opportunity with Mexico
ATLANTIC – GULF
> Mexico represents a significant mid- to long-term growth opportunity
– Bolt-on expansion of Perdido system
– Added oil and gas volume through our existing Gulf West infrastructure
– Regional development of the Salina Basin
> Well positioned with international oil companies seeking regional development solutions
> Receiving positive support from Mexican officials, Pemex, and CFE
18 © 2017 The Williams Companies, Inc. All rights reserved. Williams Analyst Day 2017 | 5/11/17 C-
Norphlet Pipeline Leverages Strategic Offshore Position in Gulf East
ATLANTIC – GULF
> Shell to build 55-mile lateral
> Expected production volume: 175,000 barrels of oil equivalent (boe) per day
> Expected reserves: 650 million boe
> Target in-service date: 2Q 2020
> Offshore and onshore modifications to WPZ’s facilities underway

19 © 2017 The Williams Companies, Inc. All rights reserved. Williams Analyst Day 2017 | 5/11/17 C-
Continued Opportunity on Discovery System
ATLANTIC – GULF
> Strategically located in the deepwater, Keathley Canyon Connector (KCC) continues to provide long-term growth opportunities
> Discovery’s joint venture structure allows for the allocation of project risk and capital (60% Williams)
> Discoveries along the KCC corridor include over 1 TCF of gas reserves
20 © 2017 The Williams Companies, Inc. All rights reserved. Williams Analyst Day 2017 | 5/11/17 C-
Connecting the Best Low-Cost Supplies to the Best Global Markets
ATLANTIC – GULF
Executing on $7 Billion in
Projects, Doubling Transco Capacity
20+ Demand-driven Interstate Projects
in Development
New Deepwater Investment Cycle
Underway

WE MAKE ENERGY HAPPEN
NYSE: WMB
NYSE: WPZ
williams.com
West Walter Bennett, Senior Vice President
2 © 2017 The Williams Companies, Inc. All rights reserved. Williams Analyst Day 2017 | 5/11/17 D-
Large Portfolio of Efficient Operations Positioned to Produce Long-term Sustainable Cash Flows
WEST
Large Portfolio of Reliable Assets
Connect Supplies to Opportunities
Positioned for Long-term Stability
and Growth Opportunities
Strong Focus on Cash Flow and
Operational Discipline

3 © 2017 The Williams Companies, Inc. All rights reserved. Williams Analyst Day 2017 | 5/11/17 D-
Portfolio of Reliable Assets
WEST
Asset Type Key Asset Characteristics
Interstate Gas Pipeline
~3,900 pipeline miles
3.8 MMdth/d reserved capacity
366 delivery points
Gas Gathering
12,774 pipeline miles
8.8 Bcf/d inlet
capacity
22,000+ receipt points
Gas Processing
7 plant sites
4.2 Bcf/d inlet
capacity
189 Mbpd NGL production
capacity
Interstate NGL Pipeline
1,096 pipeline miles
255 Mbpd transport capacity
17 receipt points
NGL Services
~50 Mbpd fractionation
capacity
~20 MMbbls storage capacity
8 pipeline interconnects
& truck/rail terminal
OVERLAND PASS
NORTHWEST
4 © 2017 The Williams Companies, Inc. All rights reserved. Williams Analyst Day 2017 | 5/11/17 D-
Rockies Basins
Western Canada Sedimentary Basin
Clay Basin
Jackson Prairie
Plymouth
Avista Cascade Intermountain Gas Northwest Natural Puget Sound Energy Sierra / Southwest Gas
Northwest Pipeline: Giving End-market Consumers Reliable Access to Low-cost Gas Supply
WEST
> Low-cost, primary service provider in the Pacific Northwest
– ~3,900-mile system with 3.8 Bcf/d peak design capacity
– Access to 120 Bcf of storage along pipeline, high injection and delivery capability in market area
– Primary Washington high pressure gas delivery west of Cascade Mountains
> Bi-directional design – Flexibility: Canadian gas to market and
Rockies gas to market – Cheapest supply drives flow patterns
> Prolific supply sources – U.S. sources: Greater Green River,
Piceance, San Juan – Canadian sources: Montney, Western
Canadian Sedimentary Basin
> Significant market options – 366 delivery points totaling 9.7 Bcf/d of
delivery capacity
Critical Existing Infrastructure – Fully Contracted Demand Charge Revenue

5 © 2017 The Williams Companies, Inc. All rights reserved. Williams Analyst Day 2017 | 5/11/17 D-
Note: Population density data per US Census Bureau Census 2010 Summary File 1 population by census tract.
Unrivaled Position in Pacific Northwest Market: Current Demand and Potential Future Growth
WEST
Scale, Flexibility, and Location Create Competitive Advantages
Boise
Portland
Seattle
Spokane
Tacoma
e
Olympia
In 2016 Northwest Pipeline Supplied 89% of Washington Demand and 100% of Seattle/Tacoma Demand
Pacific Northwest Advantaged for Asian Export Markets:
> Methanol > LNG
Pacific Northwest’s Current Primary Market Areas:
> Seattle > Tacoma > Portland > Spokane > Boise
6 © 2017 The Williams Companies, Inc. All rights reserved. Williams Analyst Day 2017 | 5/11/17 D-
1 Capacity is long-term, maximum rate, Rate schedule TF-1 capacity as of 12/31/2016.
Exceptional Contract Profile Demonstrates Strength of Access to Market Demand
WEST
Majority of Customers Have Strong Investment Grade Ratings
Northwest Pipeline Contract Base Predominately “Demand Pull” Customers
Northwest Pipeline Revenue Predominately Demand Charges
76%
17%
6% 1%
Firm Capacity1 by Customer Type
Utilities/LDC MarketerEnd-User Producer
95%
5%
2016 Revenue by Type
Demand Charge Throughput Revenue

7 © 2017 The Williams Companies, Inc. All rights reserved. Williams Analyst Day 2017 | 5/11/17 D-
9.4 9.4 9.9
10.5 9.7
9.2
10.1 9.5
0
2
4
6
8
10
12
Northwest Pipeline Average Remaining Contract Life (Years) History
Reliability, Customer Satisfaction, and Location Advantage Drive Continued Contract Renewals
WEST
> Continued customer renewals reflect critical nature of Northwest Pipeline infrastructure
> Exceptional system reliability
– 2016 – 99.9%
– 2015 – 100%
– 2014 – 99.9%
> Top 10 percent of all interstate pipelines for customer service1
1 2017 Mastio Survey
8 © 2017 The Williams Companies, Inc. All rights reserved. Williams Analyst Day 2017 | 5/11/17 D-
New Demand Drives Contracted Expansion Opportunities
WEST
$75 Million Capital Investment Opportunity at Attractive Regulated Pipeline Returns
North Seattle Lateral Upgrade
> Will provide up to 196 MDth/d of incremental firm lateral capacity to Puget’s Seattle market area – Anticipated FERC certificate filing: May 2017
– Anticipated in-service: November 2019
Kalama Lateral
> Will serve NW Innovation Works’ proposed methanol plant for export to markets in China – 320 MDth/d new firm lateral capacity
– FERC certificate received: April 2016
– Anticipated in-service: Late 2020

9 © 2017 The Williams Companies, Inc. All rights reserved. Williams Analyst Day 2017 | 5/11/17 D-
Potential Expansion Opportunities Due to Local and Global Demand Sources
WEST
Mainline Expansion
> Sumas Express: Market driven expansion(s) to serve increases in LDC, electric generation, and/or industrial firm transportation needs from British Columbia
LNG Export
> Island Gas Connector: Deliver British Columbia natural gas to Steelhead LNG’s proposed facilities on Vancouver Island
> Jordan Cove/Pacific Connector: Investment opportunity to partner with Veresen
Regional Coal Conversions
> Planned coal plant retirements by 2025 drive increased natural gas demand for power generation
10 © 2017 The Williams Companies, Inc. All rights reserved. Williams Analyst Day 2017 | 5/11/17 D-
Key Producer Customers
Provide Large Acreage
Dedications
Partnering with Customers
Under Long-term Contracts
> Long-term acreage dedications, low contract risk
> Aim to maximize production volume and minimize cost
Cash Flows > Long-term stable cash flows from portfolio of assets
Large-scale West Gathering, Processing & NGL Assets Aligned with Significant Hydrocarbon Reserves
WEST
Strong Portfolio of Customers Active Across Range of Supply Areas
OVERLAND PASS
NORT
HWES
T

11 © 2017 The Williams Companies, Inc. All rights reserved. Williams Analyst Day 2017 | 5/11/17 D-
1 Anadarko volumes exclude SCOOP and STACK. 2 Eagle Ford includes Black Oil, Hawkville Condensate, Maverick Condensate and Maverick Oil sub-plays. 3 Haynesville volumes include Caspiana Core, Greenwood-Waskom and Spider sub-plays.
Wood Mackenzie Forecast Points to Stable Volumes from West G&P Portfolio
WEST
2016–2026 Composite CAGR of (0.2)%
0
2
4
6
8
10
12
14
16
18
20
2016 2017 2018 2019 2020 2021 2022 2023 2024 2025 2026Nat
ura
l Gas
Pro
du
ctio
n (
Bcf
/d)
Areas with Williams West G&P Assets
Anadarko Eagle Ford Fort WorthGreater Green River Haynesville PiceancePowder River Basin San Juan
1 2
3
Factors Driving West G&P Volumes Across Portfolio Include:
> Available infrastructure
> Proximity to growing markets
> New technologies unlocking new resources, improving economics of established reserves
> Regionally focused producers
Wood Mackenzie Production Forecast (Bcf/d):
12 © 2017 The Williams Companies, Inc. All rights reserved. Williams Analyst Day 2017 | 5/11/17 D-
1 Excludes Cotton Valley production; 2 Wood Mackenzie NACPAT; 3 Chesapeake Analyst Day, 10/20/2016 noted 1,425 undrilled locations, after effect of announced acreage sales; 4 Chesapeake Guidance, 2/23/2017
Haynesville – Significant Footprint in Most Economic Dry Gas Basin Outside of Northeast
WEST
Proximity to Demand Growth and Infrastructure Ready
Henry Hub Henry
Texas Louisiana
Key Customers
> Chesapeake > Exco
Service Offering, Assets &
Competitive Position
> Gathering, compression & treating
> 1.7 Bcf/d of gathering capacity; 598 miles of pipeline
> Largest gatherer in Louisiana Haynesville Shale1
Basin Attributes and
Customer Activities Driving Growth
> Largest, most economic remaining gas reserves outside of Northeast
� ~40 Tcfe recoverable at <$3.50 Henry Hub2
> Significant existing infrastructure > Proximity to Gulf Coast markets and multiple
pipeline takeaway options > Strong recent well results: ROTC 1H and CA
1H wells IP ~40 MMcf/d with 10,000’ laterals > Chesapeake ~1,400 undrilled locations3;
2017 expecting 3 rigs, 30-35 Spuds & 32-37 TILs in 20174
> Pursuing additional business in close proximity to our assets
> Optimizing system capabilities to meet expected growth

13 © 2017 The Williams Companies, Inc. All rights reserved. Williams Analyst Day 2017 | 5/11/17 D-
1 50% owner and operator; 2 Wood Mackenzie NACPAT; 3 45% IRR assumes $10 mm well cost, $3 Henry Hub and $55 WTI; BP Upstream Field Trip 2016, “Lower 48 deep dive” June 2016; 4 Ultra Petroleum press release, March 15, 2017; 5 Chesapeake Investor Presentations, 1/20/2017 and 2/14/2017
Wyoming – Regionally Focused Producers Concentrate on Prolific Oil, Gas and NGL Reserves
WEST
Largest Gas Processor in Wyoming; Producer Economics Improving
OVERLAND PASS
NORT
HWES
T
Key Customers
> BP > Ultra Petroleum > Chesapeake
Service Offering, Assets &
Competitive Position
> Gathering & Processing > SW Wyoming gathering & Opal processing > Wamsutter gathering & Echo
Springs processing > Jackalope gathering & Bucking Horse
processing1 > Largest gas processor in Wyoming
Basin Attributes and
Customer Activities Driving Growth
> Rich gas & oil directed drilling > Greater Green River contains 15.4 Tcfe
recoverable at <$3.50 Henry Hub2
> Introduction of horizontal drilling and enhanced completion techniques
> Exploration of stacked pay resource > BP horizontal wells delivering up to 45% IRR;
~2,000 horizontal locations identified3
> Ultra Petroleum expects 245 new gross Wyoming wells in 20174
> Chesapeake ~2,600 risked locations; 2017 expecting 2 rigs; 25-30 wells; 28-33 TILs5
14 © 2017 The Williams Companies, Inc. All rights reserved. Williams Analyst Day 2017 | 5/11/17 D-
1 Wood Mackenzie NACPAT, range of break-evens for Black Oil sub-play for Chesapeake and other customers; 2 Chesapeake IR Presentation 1/20/2017; 3 Chesapeake IR Presentation 2/14/2017; 4 Chesapeake 1Q’17 Earnings Presentation, 5/4/2017
Eagle Ford Shale: Well-positioned for Growth Expected From Announced Drilling Activity
WEST
175+ New Wells Expected in Eagle Ford in 2017
Key Customers
> Chesapeake > EOG
Service Offering, Assets &
Competitive Position
> Gathering, treating & compression
> 0.7 Bcf/d gathering capacity; 135 MMcf/d treating capacity; 1,010 miles of pipeline
> Premier sour gas gatherer and treater in Eagle Ford Shale
Basin Attributes and
Customer Activities Driving Growth
> Oil directed drilling, with associated gas
> Break-evens range from $35–$65 WTI1
> Proximity to Gulf Coast crude markets and gas demand growth
> Chesapeake expects to be active
� >4,000 Eagle Ford locations2
� Expect average lateral length >10,000’ 3 � 5 to 7 rigs, 175-195 Spuds and 155-175 TILs in
20174
> Increasing customer diversification > Expanding gathering and treating capacity
for expected growth

15 © 2017 The Williams Companies, Inc. All rights reserved. Williams Analyst Day 2017 | 5/11/17 D-
1 Capacity varies with NGL component make-up.
Downstream NGL Assets Provide Attractive Markets for Liquids Production from West G&P Assets
WEST
121 152 164 169 185 202 201 197 204
OPPL Volumes (Mbpd) C3+ Ethane
OVERLAND PASS
NO
RT
HW
ES
T
Overland Pass
Pipeline
> Mixed NGL pipeline, nominal capacity 255 Mbpd1
> Attractive path to market for Williams Wyoming and Rockies NGL production
> Access to DJ, Bakken and Powder River volumes
> Steady volume performance through commodity cycle
> Exploring expansion opportunity to serve growing western volumes
Mid-Continent Frac and Storage
> 50% interest in and operator of ~100 Mbpd fractionator
> ~20 MMbbls of underground storage (Mixed and purity NGLs and specialty products)
> 8 pipeline interconnects; active truck and rail terminals
> Component of integrated G&P solution for West producers
> Supplies Mid-continent demand sources: crop-drying, refining and fuels, petchem, and Canadian diluent
16 © 2017 The Williams Companies, Inc. All rights reserved. Williams Analyst Day 2017 | 5/11/17 D-
Large Portfolio of Efficient Operations Positioned to Produce Long-term Sustainable Cash Flows
WEST
Large Portfolio of Reliable Assets
Connect Supplies to Opportunities
Positioned for Long-term Stability
and Growth Opportunities
Strong Focus on Cash Flow and
Operational Discipline

NYSE: WMB
NYSE: WPZ
williams.com
WE MAKE ENERGY HAPPEN
Northeast G&P Jim Scheel, Senior Vice President
2 © 2017 The Williams Companies, Inc. All rights reserved. Williams Analyst Day 2017 | 5/11/17 E-
Williams in the Northeast: Well-positioned for More Significant Growth
Foundational, Large-scale Assets
Established in Best Acreage
Demand vs. Takeaway Capacity:
Key Issue Being Addressed
Positioned for Even More Significant
Growth
NORTHEAST G&P

3 © 2017 The Williams Companies, Inc. All rights reserved. Williams Analyst Day 2017 | 5/11/17 E-
Foundational Assets in Place
NORTHEAST G&P
Large-scale Position Spanning Marcellus/Utica Wet/Dry Gas
4 © 2017 The Williams Companies, Inc. All rights reserved. Williams Analyst Day 2017 | 5/11/17 E-
Foundational Assets in Place
NORTHEAST G&P
Largest Gathering Footprint in NE Pennsylvania Dry Gas
> Large-scale supply hubs in the heart of highly productive/low cost dry-gas Marcellus
> 5.7 Bcf/d of gathering capacity with extensive, reliable, robust delivery point capabilities
> Production in supply hubs has access to Northeast, Canadian, Southeast, Mid-Atlantic, and Gulf Coast markets.
> Acreage dedications covering most of Susquehanna, Bradford counties from top-tier producers
BRADFORD SUPPLY HUB
SUSQUEHANNA SUPPLY HUB

5 © 2017 The Williams Companies, Inc. All rights reserved. Williams Analyst Day 2017 | 5/11/17 E-
1 Gathering and processing statistics for Utica Supply Hub do not include Blue Racer. 2 Non-operated joint venture.
Foundational Assets in Place
NORTHEAST G&P
Powerful Combination of Assets in SW Marcellus/Utica Wet/Dry Gas
> Extensive acreage dedications and long-term contracts liquids-rich Marcellus and dry Utica
> 1.5 Bcf/d of gathering capacity in dry/wet gas
> 800+ MMcf/d processing capacity
> 120,000+ bpd fractionation and de-ethanization capacity
> Extensive CHK acreage dedication in both the liquids-rich and dry windows of the Utica
> 1.2 Bcf/d of gathering capacity in dry/wet systems
> 800 MMcf/d of processing capacity
> 135,000 bpd fractionation capacity
UTICA SUPPLY HUB1
> Cardinal Gathering > Flint Gathering > Utica East Ohio (UEO)2
OHIO RIVER SUPPLY HUB
> Ohio River Midstream > Laurel Mtn Midstream > Marcellus South
BLUE RACER MIDSTREAM2
6 © 2017 The Williams Companies, Inc. All rights reserved. Williams Analyst Day 2017 | 5/11/17 E-
Established, Large-scale Position Creates Advantages
NORTHEAST G&P
> Best-in-Class Operational Efficiency – Consistently moving 98%+ of available gas
– Planning with producers to efficiently optimize system capacities
– Focused on driving down cost structure
– Resolved geotechnical challenges
> Efficient Incremental Capital Investment
– All critical gathering infrastructure is in place
– Volume expansions focused primarily on compression and processing expansions
– Producers often providing well connects to core gathering system
– Timing capital to correspond to rig activity
> Speed-to-Market Advantage – Deploying standardized compression,
dehydration and processing
– Responsive to customers’ production schedules

7 © 2017 The Williams Companies, Inc. All rights reserved. Williams Analyst Day 2017 | 5/11/17 E-
Customer Base Has Evolved
NORTHEAST G&P
> Consolidation in E&P space means more stable, high-quality producer customers
> Producers have significantly increased their efficiency in the past few years as they continue to gain better understanding of basin
– Wells per pad increasing
– Cost to drill decreasing
8 © 2017 The Williams Companies, Inc. All rights reserved. Williams Analyst Day 2017 | 5/11/17 E-
Source: Wood Mackenzie Note: Chart excludes Canada, Alaska, West Coast, Rockies, Barnett, Gulf Coast conventional and GOM production that amounts to a decline of 2.5 Bcf/d through 2021
Williams Positioned to Benefit from Significant Opportunities in Best Plays
NORTHEAST G&P
23.2
4.5
9.3
4.8 5.0
37.9
7.7 9.6
8.2 6.1
0
10
20
30
40
Northeast Eagle Ford Mid-Con Permian Haynesville + CV
Bcf
/d
+14.7 Bcf/d
+3.2 Bcf/d
+0.3 Bcf/d +3.4
Bcf/d +1.1 Bcf/d
Northeast Accounts for
More Than 70% of N.A.
Growth
Natural Gas Forecasted Production by Region (2016–2021)

9 © 2017 The Williams Companies, Inc. All rights reserved. Williams Analyst Day 2017 | 5/11/17 E-
Source: Wood Mackenzie Note: Sub-plays with flat production growth were excluded from the chart
Key Marcellus/Utica Sub-plays Driving Northeast Growth Through 2021
NORTHEAST G&P
Wood Mackenzie Marcellus and Utica Production Outlook by Sub-play (2016–2021)
6.8
6.1
4.8
3.3 3.0 2.8
2.5
1.1 0.7 0.7
0.2 0
1
2
3
4
5
6
7
8
Bradford Area Lean Gas Core WV Rich Gas SusquehannaCore
Greene DryGas
Southwest RichGas
WV Dry Gas Rich Gas Core Southern WetGas
AlleghenyMountains
Condensate
Bcf
/d
2016 2017 2018 2019 2020 2021
Utica Marcellus
+2.5 Bcf/d
+4.2 Bcf/d
+3.2 Bcf/d
+1.5 Bcf/d
+0.2 Bcf/d +1.2
Bcf/d +1.9 Bcf/d
+0.3 Bcf/d +0.2
Bcf/d
-0.3 Bcf/d
-0.2 Bcf/d
Marcellus/Utica Sub-plays that Represent
+14.7 Bcf/d of Projected Growth by 2021
10 © 2017 The Williams Companies, Inc. All rights reserved. Williams Analyst Day 2017 | 5/11/17 E-
Source: Wood Mackenzie
Wood Mackenzie Marcellus Shale Sub-plays
NORTHEAST G&P
8
3
4
5
6
15
14
1. Susquehanna Core 2. Bradford Area 3. Northeast PA 4. Lycoming Area 5. Central PA 6. High Plateau 7. Allegheny Mountains 8. Pittsburgh Area 9. Greene Dry Gas 10. Southwest Rich Gas 11. Rich Gas Core 12. WV Dry Gas 13. WV Rich Gas 14. Big Sandy Field Area 15. Ohio 16. New York
Highlighted sub-plays are the key growth plays listed on Slide 9
16
1
9
2
7
10
11
12
13

11 © 2017 The Williams Companies, Inc. All rights reserved. Williams Analyst Day 2017 | 5/11/17 E-
Source: Wood Mackenzie
Wood Mackenzie Utica Shale Sub-plays
NORTHEAST G&P
9
4
3
2 11
10
7
5
1. Lean Gas Core 2. Lean Gas 3. Lean Gas Frontier 4. Tioga County 5. Northern Wet Gas 6. Southern Wet Gas 7. Condensate Core 8. Condensate 9. Condensate Frontier 10. Western Oil 11. Lean Gas SWPA
Highlighted sub-plays are the key growth plays listed on Slide 9
6 1
8
12 © 2017 The Williams Companies, Inc. All rights reserved. Williams Analyst Day 2017 | 5/11/17 E-
Source: Wood Mackenzie Marcellus Shale Sub-play Boundaries
Bradford/Susquehanna Supply Hubs Ideally Situated in the Core of NE Marcellus Dry Gas…
NORTHEAST G&P
BRADFORD SUPPLY HUB
SUSQUEHANNA SUPPLY HUB
PENNSYLVANIA
NEW YORK
1
2
3
WOOD MACKENZIE NE MARCELLUS SUB-PLAYS
Susquehanna Core 1
Bradford Area 2
Northeast PA 3
13 © 2017 The Williams Companies, Inc. All rights reserved. Williams Analyst Day 2017 | 5/11/17 E-
Source: Wood Mackenzie Marcellus Shale Sub-play Boundaries
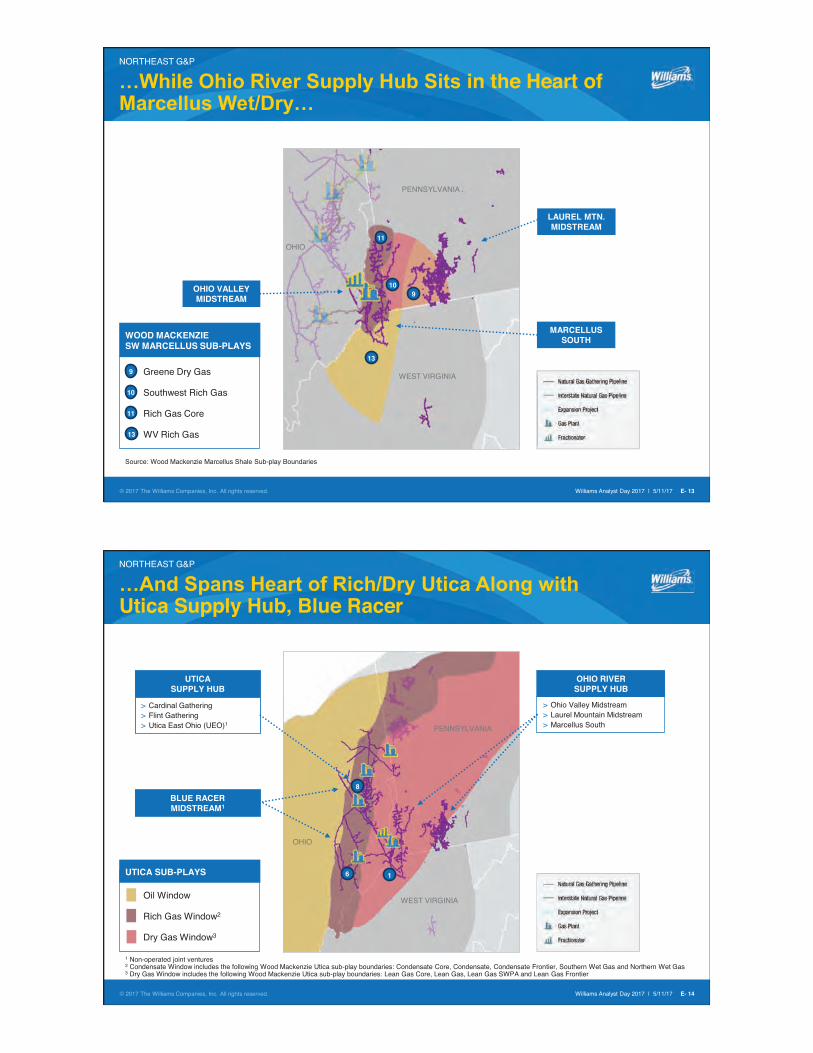
…While Ohio River Supply Hub Sits in the Heart of Marcellus Wet/Dry…
NORTHEAST G&P
LAUREL MTN. MIDSTREAM
OHIO VALLEY MIDSTREAM
MARCELLUS SOUTH WOOD MACKENZIE
SW MARCELLUS SUB-PLAYS
OHIO
PENNSYLVANIA
WEST VIRGINIA
9
Greene Dry Gas 9
10
Southwest Rich Gas 10
Rich Gas Core 11
WV Rich Gas 13
13
11
14 © 2017 The Williams Companies, Inc. All rights reserved. Williams Analyst Day 2017 | 5/11/17 E-
1 Non-operated joint ventures 2 Condensate Window includes the following Wood Mackenzie Utica sub-play boundaries: Condensate Core, Condensate, Condensate Frontier, Southern Wet Gas and Northern Wet Gas 3 Dry Gas Window includes the following Wood Mackenzie Utica sub-play boundaries: Lean Gas Core, Lean Gas, Lean Gas SWPA and Lean Gas Frontier
…And Spans Heart of Rich/Dry Utica Along with Utica Supply Hub, Blue Racer
NORTHEAST G&P
OHIO RIVER SUPPLY HUB
> Ohio Valley Midstream > Laurel Mountain Midstream > Marcellus South
OHIO
PENNSYLVANIA
WEST VIRGINIA
UTICA SUPPLY HUB
> Cardinal Gathering > Flint Gathering > Utica East Ohio (UEO)1
BLUE RACER MIDSTREAM1
1 6
8
UTICA SUB-PLAYS
Oil Window
Rich Gas Window2
Dry Gas Window3

15 © 2017 The Williams Companies, Inc. All rights reserved. Williams Analyst Day 2017 | 5/11/17 E-
Source: Wood Mackenzie Note: Sub-plays with flat production growth were excluded from the chart
Williams’ Unique NE Position: Exposed to 100 Percent of Projected Marcellus/Utica Growth
NORTHEAST G&P
6.8
6.1
4.8
3.3 3.0 2.8
2.5
1.1 0.7 0.7
0.2 0
1
2
3
4
5
6
7
8
Bradford Area Lean Gas Core WV Rich Gas SusquehannaCore
Greene DryGas
Southwest RichGas
WV Dry Gas Rich Gas Core Southern WetGas
AlleghenyMountains
Condensate
Bcf
/d
2016 2017 2018 2019 2020 2021Utica Marcellus
+2.5 Bcf/d
+4.2 Bcf/d
+3.2 Bcf/d
+1.5 Bcf/d
+0.2 Bcf/d +1.2
Bcf/d +1.9 Bcf/d
+0.3 Bcf/d +0.2
Bcf/d
-0.3 Bcf/d
-0.2 Bcf/d
Wood Mackenzie Marcellus and Utica Production Outlook by Sub-play (2016–2021)
Williams assets/dedications in sub-play
W W W W W W W W W W W
W
100% Assets/Dedications
Exposed to Sub-Plays Encompassing
Of Projected Marcellus/ Utica Growth through 2021
16 © 2017 The Williams Companies, Inc. All rights reserved. Williams Analyst Day 2017 | 5/11/17 E-
+15 23 � 38 +2
15 � 17
+5 37 � 42
+11 26 � 37
1 Size of bubble indicates magnitude of 2021 production or demand Source: Wood Mackenzie 2H 2016, excludes impact of net Canadian imports
Northeast Supplies Catalyst for Transco Expansions
NORTHEAST G&P
Tremendous Marcellus-Utica Resources Critical to Industry Growth, U.S. Economy
+2 12 � 14
+1 11 � 12
Regional Production change, 2016 to 2021 (Bcf/d)1
Regional Demand change, 2016 to 2021 (Bcf/d)1

17 © 2017 The Williams Companies, Inc. All rights reserved. Williams Analyst Day 2017 | 5/11/17 E-
Source: Wood Mackenzie 1 Note: Constitution, which is appealing the denial of a required permit, is not included in financial forecast.
New Takeaway Capacity Connects NE to Best Markets Across the Country…
NORTHEAST G&P
> Adair SW/ Lebanon Ex. (0.3 Bcf/d) > Leach Xpress: (1.5 Bcf/d) > Lebanon West- Ph. 2 (0.13 Bcf/d) > Mountaineer Express: (1.4 Bcf/d) > Nexus Pipeline: (1.3 Bcf/d) > Rex Zone 3 Cap. Enh. (0.8 Bcf/d) > Rover Pipeline: (3.25 Bcf/d) > Utica Access (0.21 Bcf/d)
> Atlantic Coast Pipeline: (1.5 Bcf/d) > Atlantic Sunrise (1.7 Bcf/d) > Dalton Expansion (0.4 Bcf/d) > Mountain Valley: (2.0 Bcf/d) > WB Xpress: (0.5 Bcf/d)
+2 15 � 17
+10 23 � 33
+2 12 � 14
+2 14 � 16
Regional Production change, 2016 to 2021 (Bcf/d)
Regional Demand change, 2016 to 2021 (Bcf/d)
> Access South (0.32 Bcf/d) > Gulf Markets Expansions (0.35 Bcf/d) > Broad Run Ex. (0.2 Bcf/d)
+15 23� 38
> Access Northeast (0.5 Bcf/d) > Atlantic Bridge (0.15 Bcf/d) > Constitution Pipeline (0.7 Bcf/d)1
> CPV Valley Lateral Project (0.13 Bcf/d) > Equitrans Expansion Project (0.6 Bcf/d) > Garden State Expansion (0.2 Bcf/d) > Leidy South (0.5 Bcf/d) > Millennium Eastern System Upgrade (0.2 Bcf/d) > New Market Project (0.1 Bcf/d) > New York Bay Expansion (0.1 Bcf/d) > Northeast Supply Enhancement (0.4 Bcf/d) > Northern Access 2016 (0.15 Bcf/d) > Orion Expansion Project (0.14 Bcf/d) > PennEast (1.1 Bcf/d) > South to North (0.3 Bcf/d) > Susquehanna West (0.15 Bcf/d) > Triad Expansion Project (0.18 Bcf/d) > WB Xpress (0.8 Bcf/d)
>>>>>>>>>>>>>>>>>>>>>>>>
Northeast Pipeline Projects (2016–2021) ~22 Bcf/d of Incremental Capacity
18 © 2017 The Williams Companies, Inc. All rights reserved. Williams Analyst Day 2017 | 5/11/17 E-
Source: EIA
…While Northeast Gas-Fired Power Generation Growth Will Drive Incremental Local Demand
NORTHEAST G&P
17,800 MW Announced Capacity Through 2021 Could Drive ~1–2 Bcf/d of Incremental Demand within Northeast
Planned gas-fired electric generation additions by electric utilities and independent power producers

19 © 2017 The Williams Companies, Inc. All rights reserved. Williams Analyst Day 2017 | 5/11/17 E-
Partially owned system volumes are shown at 100%. Note: Excludes volumes for all non-operated assets.
Substantial Growth Through ’14; 2015–16 Constrained by Market, Takeaway Capacity
NORTHEAST G&P
-
1.00
2.00
3.00
4.00
5.00
6.00
7.00
8.00
Q1 Q2 Q3 Q4 Q1 Q2 Q3 Q4 Q1 Q2 Q3 Q4 Q1 Q2 Q3 Q4 Q1 Q2 Q3 Q4 Q1
2012 2013 2014 2015 2016 2017
Bcf
/d
Dry Gas Wet Gas
Gathering Volume Growth Through 1Q 2017 Average Gathered Volumes (Bcf/d)
20 © 2017 The Williams Companies, Inc. All rights reserved. Williams Analyst Day 2017 | 5/11/17 E-
1 Source for total Utica and Marcellus volume: Energy Information Administration, average daily production for 1Q 2017. 2 Partially owned gathering system volumes are shown at 100%.
Leading Gathering Position in Preeminent Gas Basin in North America
NORTHEAST G&P
34% Marcellus & Utica
Gathered Volumes2
Utica Supply Hub2
Blue Racer Midstream2
Bradford Supply Hub2
Susquehanna Supply Hub Ohio Valley Midstream
Marcellus South2
Laurel Mountain Midstream2
Non-Williams
Total Marcellus/Utica Average Gathered Volumes (Bcf/d) – 1Q 20171

21 © 2017 The Williams Companies, Inc. All rights reserved. Williams Analyst Day 2017 | 5/11/17 E-
4,000
5,000
6,000
7,000
8,000
9,000
10,000
11,000
12,000
2016 2021
* Includes 100% of consolidated assets and operated equity-method investments. Excludes non-operated equity-method investments.
Northeast Poised for Significant Value Creation
NORTHEAST G&P
Northeast Modified EBITDA/MCF Growing on Higher Volume
Target: 2016 ~37 cents 2021 ~50-55 cents
> Using Wood Mackenzie’s ‘16-’21 volume CAGR we could see 2021 Modified EBITDA around $2 billion
> Volume growth could require annual growth capital of ~$500MM
WILLIAMS 2016
ACTUAL
Gat
her
ed V
olu
mes
(M
Mcf
/d) 63%
53%
73%
Wood Mackenzie Marcellus/Utica growth rate of 63% applied to 2016 actuals:
> 4.0 Bcf/d of growth
> CAGR of 10.3%
22 © 2017 The Williams Companies, Inc. All rights reserved. Williams Analyst Day 2017 | 5/11/17 E-
Northeast – Ideally Positioned in Preeminent Growth Basin in North America
NORTHEAST G&P
Foundational, Large-scale Assets in the Best Acreage
Demand vs. Takeaway Capacity:
Key Issue Being Addressed
Positioned for Even More Significant
Growth

WE MAKE ENERGY HAPPEN
NYSE: WMB
NYSE: WPZ
williams.com
Williams and Williams Partners Financial Outlook Don Chappel, Chief Financial Officer
2 © 2017 The Williams Companies, Inc. All rights reserved. Williams Analyst Day 2017 | 5/11/17 F-
Williams and Williams Partners: Focused on Peer Leading Value Creation and Financial Discipline
WILLIAMS AND WILLIAMS PARTNERS FINANCIAL OUTLOOK
Growing Distributable Cash Flow per Unit /
Share and Sustaining Strong Cash Coverage
Focused on Projects within Our Competitively Advantaged Asset Base
Offering Attractive Financial Return
Retaining Cash Flow While Maintaining a
Strong Balance Sheet and Funding Growth with Low-Cost Debt

3 © 2017 The Williams Companies, Inc. All rights reserved. Williams Analyst Day 2017 | 5/11/17 F-
Positioned for Long-Term, Sustainable Growth with Disciplined Capital Allocation and Financial Policies
WILLIAMS AND WILLIAMS PARTNERS FINANCIAL OUTLOOK
Compelling Market Fundamentals
> Clear line of sight to continued strong growth in natural gas demand driven by LNG exports, industrial, LDCs, power generation, Mexican exports and other
> Best supply basins respond to demand growth with relief of infrastructure constraints
Premier Assets
> Nation’s largest and fastest growing interstate gas pipeline system, Transco, with unrivaled proximity to growing Mid-Atlantic, Southeast and Gulf Coast demand centers
> Largest gas gatherer in fastest growing basins (Marcellus and Utica; currently almost 7 Bcf/d) > Steady, high-quality revenues from large-scale West operations and unique footprint and
capabilities in Atlantic Gulf’s Gulf of Mexico operations
Immaterial Direct Commodity Exposure
> Pro Forma for Geismar sale, 97% of WPZ’s gross margin expected from fee-based revenues in 2017
Focused on Lower-Risk, Competitively
Advantaged Projects with Attractive
Financial Returns
> 64% of 2017–2019 growth capex is projected to be spent on regulated growth projects backed by long-term contracts with low credit risk customers that will also drive volumes on G&P systems
> 27% of 2017–2019 growth capex is forecasted to be spent on Northeast G&P projects that will drive volume growth
Strong Financial Outlook
> WPZ expects to fund planned growth capex with retained cash flow, asset sale proceeds, and low-cost debt
> No new equity issuances required to fund WPZ planned growth capex for the next several years > Improved balance sheet and ample liquidity have strengthened the WPZ credit profile, solidifying
its investment grade credit rating > Streamlining the organization and aggressively managing costs > Attractive cash distribution/dividend growth and strong, sustainable coverage
4 © 2017 The Williams Companies, Inc. All rights reserved. Williams Analyst Day 2017 | 5/11/17 F-
WPZ 2016 Proportionate Share of Total Revenues of Equity Investments Have Increased 178% (23% CAGR) Since 2011
Completing Transformation to Stable, Predictable Cash Flows
WILLIAMS AND WILLIAMS PARTNERS FINANCIAL OUTLOOK
WPZ Fee-based Revenues Increased ~$2.7 Billion, 2016 NGL Margins ~3% of Gross Margin
Note: Fee-based Revenue Presented Above Excludes Equity Method Investments Such as Gulfstream, Appalachian Midstream, Discovery, OPPL, UEOM, BRM/Caiman II, and LMM
$0
$1,000
$2,000
$3,000
$4,000
$5,000
$6,000 2014
> Access Acquisition > Gulfstar One > OVM De-ethanizer > OVM Processing &
Frac expansions > Ohio Valley Ethane
Pipeline
2015 > Buckinghorse Plant > Geismar Expansion > Mobile Bay South III > CPV Woodbridge > Leidy Southeast > VA Southside > Bayou Ethane 2013
> Mid-Atlantic Connector > Mid-South Expansion
Ph. II > NE Supply Link > Canadian Ethane
Recovery
2011 > Perdido Norte /
Markham Plant Expansion
> Gulfstream Ph. V > Station 85 North II > Mobile Bay South II
2012 > Cabot Gathering
Acquisition > Springville > Laser NE Gathering > OVM Acquisition > Boreal Pipeline > Mid-South Expansion Ph. I
2016 > NE Connector &
Rockaway > Rock Springs > Susquehanna
Supply Hub > Utica Supply Hub > Kodiak > Gunflint
NGL Margins Fee Revenues Olefins Margins
($ in millions)

5 © 2017 The Williams Companies, Inc. All rights reserved. Williams Analyst Day 2017 | 5/11/17 F-
0
100
200
300
400
500
600
700
80001
/02…
02/0
2…03
/02…
04/0
2…05
/02…
06/0
2…07
/02…
08/0
2…
09/0
2…10
/02…
11/0
2…12
/02…
01/0
2…
02/0
2…03
/02…
04/0
2…05
/02…
06/0
2…07
/02…
08/0
2…
09/0
2…10
/02…
11/0
2…12
/02…
01/0
2…
02/0
2…03
/02…
$0.0
$0.2
$0.4
$0.6
$0.8
$1.0
$1.2
$1.4
Ind
ex Valu
e $ B
illio
ns
WPZ Adjusted EBITDA Alerian Energy Infrastructure Index (AMEI)(1)
This slide contains non-GAAP financial measures. A reconciliation of all non-GAAP financial measures used in this presentation to their nearest GAAP financial measures is included at the back of this presentation. 1 Price-return basis index.
WPZ Steady Predictable EBITDA Through Commodity and Financial Market Volatility
WILLIAMS AND WILLIAMS PARTNERS FINANCIAL OUTLOOK
2015: $4.1 Billion 2016: $4.4 Billion
2017
($ Billions) Q1 '15 Q2 '15 Q3 '15 Q4 '15 Q1 '16 Q2 '16 Q3 '16 Q4 '16 Q1 '17
Adjusted EBITDA $0.9 $1.0 $1.1 $1.1 $1.1 $1.1 $1.2 $1.1 $1.1
1
6 © 2017 The Williams Companies, Inc. All rights reserved. Williams Analyst Day 2017 | 5/11/17 F-
Includes our proportional ownership of the gross margin of our equity method investments. Excludes certain regulated revenues, which are related to tracked operating costs.
~97% of WPZ 2017 Gross Margin from Fee-Based Source – Pro Forma for Geismar Sale
WILLIAMS AND WILLIAMS PARTNERS FINANCIAL OUTLOOK
~34% of WPZ 2017 Gross Margin from Regulated Pipeline Demand Payments
Regulated Gas Pipeline
Fee-Based Revenue
34%
Non-Regulated Fee-Based Revenue
Atlantic Gulf 11%
Non-Regulated Fee-Based
Revenue West 29%
Non-Regulated Fee-Based Revenue
Northeast G&P 23%
NGL & Other Commodity
Margins 3%
2017 Forecasted Gross Margin

7 © 2017 The Williams Companies, Inc. All rights reserved. Williams Analyst Day 2017 | 5/11/17 F-
This slide contains non-GAAP financial measures. A reconciliation of all non-GAAP financial measures used in this presentation to their nearest GAAP financial measures is included at the back of this presentation.
Expected WPZ 2018 Adjusted EBITDA Growth Driven by Transco and Northeast G&P Fee Revenues
WILLIAMS AND WILLIAMS PARTNERS FINANCIAL OUTLOOK
$4,350
2017 Adjusted EBITDA
2018 Adjusted EBITDA
Atlantic Sunrise (partial year)
Increase in Northeast’s
Utica Supply Hub
Increase in Northeast’s
Susquehanna Supply Hub
Increase in Northeast’s
Bradford Supply Hub
Transco Projects: Virginia South Side 2,
Hillabee, Dalton,
New York Bay,
Garden State
Increase in Transco Fee Revenues
Increase in Northeast G&P Fee Revenues Driven by
Volume Growth
Other Net Increases
and Decreases
Midpoint of
Guidance Pro Forma
for Geismar
Sale (Geismar excluded)
Increase in Operating
Costs Driven
Largely by New
Projects Partially Offset by
Cost Reduction Initiatives
($ in millions)
8 © 2017 The Williams Companies, Inc. All rights reserved. Williams Analyst Day 2017 | 5/11/17 F-
2017 – 2019 Growth Capital Focused on Transco and Northeast G&P Projects
WILLIAMS AND WILLIAMS PARTNERS FINANCIAL OUTLOOK
~64% of Growth Capital Expenditures for Regulated Projects
Regulated Growth Projects
64%
Non-Regulated Atlantic Gulf
4%
Non-Regulated West 5%
Non-Regulated Northeast G&P
27%
2017–2019 Forecasted Growth Capital Expenditures
Total Non-Regulated
Growth Projects
36%

9 © 2017 The Williams Companies, Inc. All rights reserved. Williams Analyst Day 2017 | 5/11/17 F-
** WPZ Term Loan expected to paid off in 2017 using asset sale proceeds.
Strengthened Credit Profiles with Significant Liquidity Available
WILLIAMS AND WILLIAMS PARTNERS FINANCIAL OUTLOOK
> WPZ: – Expect $850 million term loan to be paid off with a portion of the $2.1 billion of Geismar sale proceeds, with the
remaining funds to be used to prefund capex – $1.1 billion debt reduction in 4Q ’16 and $1.5 billion in 1Q ’17
> WMB HoldCo: $75 million debt reduction in 4Q of 2016 and $180 million in 1Q of 2017 with an additional ~$300 million expected in 2017
> Debt comprised of 93% fixed rate debt and 7% floating rate debt
> WPZ liquidity as of 4/30 of ~$4.2 billion and WMB HoldCo liquidity of ~$1.0 billion
WMB
WPZ Corp
$2,100
$500
$2,000 $2,000 $1,750 $1,500
$3,650
$185 $250
$85
$250
$1,983
$595 $850
$32
$21
$371
$850 $1,250
$1,688
$0
$1,000
$2,000
$3,000
$4,000
$5,000
$6,000
$7,000
$8,000
2017 2018 2019 2020 2021 2022 2023 2024 2025 2026+2026-2045
$
WMB Consolidated Debt Maturities as of March 31, 2017
WMB Revolver
($ in millions)
WPZ Term Loan**
Transco
NWP
Debt Balances as of 3/31/17*:
WPZ Debt $17,103 WMB HoldCo Debt 4,807 WMB Consolidated Debt $21,910
* Excludes net unamortized debt premiums and discounts and debt issuance costs of ($38) million at WPZ and ($47) million at WMB HoldCo
10 © 2017 The Williams Companies, Inc. All rights reserved. Williams Analyst Day 2017 | 5/11/17 F-
This slide contains non-GAAP financial measures. A reconciliation of all non-GAAP financial measures used in this presentation to their nearest GAAP financial measures is included at the back of this presentation. 1 Assumes Geismar sale in summer of 2017. 2 Rating agency adjusted debt / EBITDA. 3 Williams does not expect to be a U.S. Federal cash income taxpayer through at least 2020, excluding taxes on any potential asset monetizations.
WPZ and WMB Key Guidance Metrics
WILLIAMS AND WILLIAMS PARTNERS FINANCIAL OUTLOOK
WPZ
Adjusted EBITDA 2017 – Assumes Geismar Sale 2017 – Pro Forma Geismar Sale
$4.35–$4.55 Billion1
$4.25–$4.45 Billion
DCF 2017 $2.6–$2.8 Billion1
Distribution & Growth Rate
2017 Distribution Expected Growth Rate
$2.40 per L.P. unit 5% to 7% annual growth
Cash Coverage Ratio
2017 Cash Distribution Coverage Ratio
~1.17x
Growth Capex 2017 Total WPZ 2017 Transco
$2.1 to $2.8 Billion $1.4 to $1.9 Billion
Leverage 2017 Debt / EBITDA2 < 4.50x
WMB3
Dividend & Growth Rate
2017 Dividend Expected Growth Rate
$1.20 per share 10–15% annual growth
Cash Coverage Ratio 2017 Dividend Coverage Ratio ~1.4x
Consolidated Leverage
Consolidated 2017 Debt / EBITDA2 < 5.25x
midpoint of guidance
(excludes Geismar for full year)
(includes Geismar for partial year)

11 © 2017 The Williams Companies, Inc. All rights reserved. Williams Analyst Day 2017 | 5/11/17 F-
Williams and Williams Partners: Focused on Peer Leading Value Creation and Financial Discipline
WILLIAMS AND WILLIAMS PARTNERS FINANCIAL OUTLOOK
Growing Distributable Cash Flow per Unit / Share
and Sustaining Strong Cash Coverage
Focused on Projects within Our Competitively Advantaged Asset Base
Offering Attractive Financial Return
Retaining Cash Flow while Maintaining a
Strong Balance Sheet and Funding Growth with
Low-Cost Debt

1 © 2017 The Williams Companies, Inc. All rights reserved. Williams Analyst Day 2017 | 5/11/17 G-
Non-GAAP Reconciliations
2 © 2017 The Williams Companies, Inc. All rights reserved. Williams Analyst Day 2017 | 5/11/17 G-
Non-GAAP Disclaimer
NON-GAAP RECONCILIATIONS
> This presentation may include certain financial measures – adjusted EBITDA, adjusted income (“earnings”), adjusted earnings per share, cash available for dividends, dividend coverage ratio, distributable cash flow, cash distribution coverage ratio, operating margin, and operating margin percentage – that are non-GAAP financial measures as defined under the rules of the Securities and Exchange Commission.
> Our segment performance measure, modified EBITDA, is defined as net income (loss) before income (loss) from discontinued operations, income tax expense, net interest expense, equity earnings from equity-method investments, other net investing income, remeasurement gain on equity-method investment, impairment of equity investments and goodwill, depreciation and amortization expense, and accretion expense associated with asset retirement obligations for nonregulated operations. We also add our proportional ownership share (based on ownership interest) of modified EBITDA of equity-method investments.
> Adjusted EBITDA further excludes items of income or loss that we characterize as unrepresentative of our ongoing operations. Management believes this measure provides investors meaningful insight into results from ongoing operations.
> For Williams, cash available for dividends is defined as cash received from its ownership in WPZ and adjusted EBITDA from our Other segment, less interest, taxes, and maintenance capital expenditures with our Other segment. We also calculate the ratio of cash available for dividends to the total cash dividends paid (dividend coverage ratio). This measure reflects Williams’ cash available for dividends relative to its actual cash dividends paid. We further adjust these metrics to include Williams’ proportionate share of WPZ’s distributable cash flow in excess of distributions paid, resulting in Williams Economic DCF and Economic Coverage Ratio.
> For Williams Partners L.P., we define distributable cash flow as adjusted EBITDA less maintenance capital expenditures, cash portion of interest expense, income attributable to noncontrolling interests and cash income taxes, plus WPZ restricted stock unit non-cash compensation and certain other adjustments that management believes affects the comparability of results. Adjustments for maintenance capital expenditures and cash portion of interest expense include our proportionate share of these items of our equity-method investments.
> For Williams Partners L.P., we also calculate the ratio of distributable cash flow to the total cash distributed (cash distribution coverage ratio). This measure reflects the amount of distributable cash flow relative to our cash distribution. We have also provided this ratio calculated using the most directly comparable GAAP measure, net income.
> For Williams, we define operating margin as gross margin less operating and maintenance expenses and selling, general and administrative expenses. Operating margin percentage is defined as operating margin divided by gross margin. Management believes these metrics neutralize diversity in expense classification and measure the organization’s cost efficiency.
> This presentation is accompanied by a reconciliation of these non-GAAP financial measures to their nearest GAAP financial measures. Management uses these financial measures because they are accepted financial indicators used by investors to compare company performance. In addition, management believes that these measures provide investors an enhanced perspective of the operating performance of assets and the cash that the business is generating.
> Neither adjusted EBITDA, adjusted income, cash available for dividends, nor distributable cash flow are intended to represent cash flows for the period, nor are they presented as an alternative to net income or cash flow from operations. They should not be considered in isolation or as substitutes for a measure of performance prepared in accordance with United States generally accepted accounting principles.

3 © 2017 The Williams Companies, Inc. All rights reserved. Williams Analyst Day 2017 | 5/11/17 G-
Reconciliation of GAAP Net Income to Non-GAAP Modified EBITDA, Adjusted EBITDA
NON-GAAP RECONCILIATIONS
2017
1st Qtr 2nd Qtr 3rd Qtr 4th Qtr Year 1st Qtr 2nd Qtr 3rd Qtr 4th Qtr Year 1st Qtr
112$ 3 3 2$ (16 7 )$ (1,6 3 5 )$ (1,3 5 8 )$ 7 9$ (7 7 )$ 3 5 1$ 16 6$ 5 19$ 6 6 0$
3 — 1 (3 ) 1 1 (8 0 ) (6 ) 5 (8 0 ) 3
19 2 2 0 3 2 0 5 2 11 8 11 2 2 9 2 3 1 2 2 9 2 2 7 9 16 2 14
(5 1) (9 3 ) (9 2 ) (9 9 ) (3 3 5 ) (9 7 ) (10 1) (10 4 ) (9 5 ) (3 9 7 ) (10 7 )
— — 4 6 1 8 9 8 1,3 5 9 112 — — 3 18 4 3 0 —
(1) — — (1) (2 ) — (1) (2 8 ) — (2 9 ) (2 7 1)
13 6 18 3 18 5 19 5 6 9 9 18 9 19 1 19 4 18 0 7 5 4 19 4
— — — 1,0 9 8 1,0 9 8 — — — — — —
4 19 4 19 4 2 3 4 4 1 1,7 0 2 4 3 5 4 3 2 4 2 6 4 2 7 1,7 2 0 4 3 3
7 9 5 7 2 8 7 9 8 7 3 1 6
M o d if ie d E B IT D A 8 17 1,0 5 3 1,0 2 1 1,112 4 ,0 0 3 9 5 5 6 0 4 1,0 7 0 1,2 3 5 3 ,8 6 4 1,13 2
A d ju s tm e n ts
5 5 5 5 6 5 (17 5 ) — 6 0 6 4 7 0 (19 4 ) — 15
— — — — — 2 5 — — 12 3 7 9
— — — — — 15 — — — 15 —
3 2 14 2 2 5 0 5 — — — 5 —
— — — — — — 8 11 9 2 8 2
8 1 17 7 3 3 — — 6 19 2 5 —
— (12 6 ) — — (12 6 ) — — — (7 ) (7 ) (9 )
1 1 — — 2 — — — — — —
3 2 4 2 116 14 5 — 3 8 9 — 2 2 4 11 —
— — — — — — — — 2 4 2 4 4
— — — — — — — 3 2 2 3 4 (3 )
— — — — — — — — (11) (11) —
1 — (8 ) 1 (6 ) — — — — — —
— (14 ) — — (14 ) — — — — — —
— — — — — — — — 2 2 1
G a in s f ro m c o n tra c t s e ttle m e n ts a n d te rm in a tio n s — — — — — — — — — — (13 )
A c c ru a l fo r lo s s c o n tin g e n c y — — — — — — — — — — 9
G a in o n e a r ly re tire m e n t o f d e b t — — — — — — — — — — (3 0 )
— — 1 1 2 — — — — — —
10 0 (4 5 ) 7 9 (4 8 ) 8 6 10 5 4 6 1 119 (12 2 ) 5 6 3 (15 )
9 17 1,0 0 8 1,10 0 1,0 6 4 4 ,0 8 9 1,0 6 0 1,0 6 5 1,18 9 1,113 4 ,4 2 7 1,117
2016
E x p e n s e s a s s o c ia te d w ith s tra te g ic a lte rn a tiv e s
G a in o n e x tin g u is h m e n t o f d e b t
Im p a irm e n t o f g o o d w ill
N e t in c o m e ( lo s s )
A d ju s te d E B IT D A
Im p a irm e n t o f c e r ta in a s s e ts
E s tim a te d m in im u m v o lu m e c o m m itm e n ts
T o ta l E B IT D A a d ju s tm e n ts
L o s s re la te d to G e is m a r In c id e n t
G e is m a r In c id e n t a d ju s tm e n t fo r in s u ra n c e a n d tim in g
L o s s ( re c o v e ry ) re la te d to O p a l in c id e n t
S e v e ra n c e a n d re la te d c o s ts
P o te n tia l ra te re fu n d s a s s o c ia te d w ith ra te c a s e litig a tio n
D e p re c ia tio n a n d a m o r tiz a tio n e x p e n s e s
A c c re tio n fo r a s s e t re tire m e n t o b lig a tio n s a s s o c ia te d w ith n o n re g u la te d
o p e ra tio n s
2015
P ro v is io n (b e n e f it) fo r in c o m e ta x e s
In te re s t e x p e n s e
E q u ity (e a rn in g s ) lo s s e s
Im p a irm e n t o f e q u ity -m e th o d in v e s tm e n ts
W i l l i a m s P a rtn e rs L . P .
R e c o n c ilia tio n o f G A A P "N e t In c o m e (L o s s )" to N o n -G A A P "M o d if ie d E B IT D A ", "A d ju s te d E B IT D A ", a n d "D is trib u ta b le c a s h f lo w ”
O th e r in v e s tin g ( in c o m e ) lo s s
(Dollars in millions, except coverage ratios)
P ro p o r tio n a l M o d if ie d E B IT D A o f e q u ity -m e th o d in v e s tm e n ts
M e rg e r a n d tra n s itio n re la te d e x p e n s e s
S h a re o f im p a irm e n t a t e q u ity -m e th o d in v e s tm e n t
C o n s titu tio n P ip e lin e p ro je c t d e v e lo p m e n t c o s ts
L o s s re la te d to C a n a d a d is p o s itio n
G a in o n a s s e t re tire m e n t
E x p e n s e s a s s o c ia te d w ith s tra te g ic a s s e t m o n e tiz a tio n
O rg a n iz a tio n a l re a lig n m e n t- re la te d c o s ts
4 © 2017 The Williams Companies, Inc. All rights reserved. Williams Analyst Day 2017 | 5/11/17 G-
WPZ 2017 Guidance: Reconciliation of GAAP Net Income to Non-GAAP Modified EBITDA, Adjusted EBITDA and Distributable Cash Flow
NON-GAAP RECONCILIATIONS
2017 Guidance Range (1)
Low Mid High
$1.500 $1.600 $1.700
-
0.800
(0.500)
0.800
1.800
Modified EBITDA 4.400 4.500 4.600
Severance and related costs 0.009
Constitution Pipeline project development costs 0.002
Geismar Incident adjustment for insurance and timing (0.009)
Organizational realignment-related costs 0.004
Loss related to Canada disposition (0.003)
Gain from contract settlements and termination (0.013)
Accrual for loss contingency 0.009
Gain on early retirement of debt (0.030)
Expenses associated with strategic asset monetizations 0.001
(0.050)
Adjusted EBITDA (2) 4.350 4.450 4.550
(0.500)
(0.870)
(0.240)
(0.140)
$2.600 $2.700 $2.800
Total cash distributed $2.300 $2.300 $2.300
Cash Coverage Ratio (Distributable cash flow attributable to Partnership Operations /
Total cash distributed)1.13x 1.17x 1.22x
Assumes Geismar sale in summer of 2017.
(3) Includes proportionate share of maintenance capital expenditures of equity investments.
(4) Includes proportionate share of interest expense of equity investments.
(2)
Interest expense (cash portion) (4)
Remove amortization associated with Barnett & MidCon contract restructure prepayments
Income attributable to noncontrolling interests, cash taxes and other
Distributable cash flow attributable to Partnership Operations
Notes:
(1)
Adjusted EBITDA Pro Forma for Geismar sale is $4.35 billion at midpoint ($4.45 billion less partial year of Geismar
operations prior to sale, which includes downtime in first half of the year).
Maintenance capital expenditures (3)
(Dollars in billions, except coverage ratios)
Net income (loss)
Provision (benefit) for income taxes
Interest expense
Equity (earnings) losses
Proportional Modified EBITDA of equity-method investments
Depreciation and amortization expenses and accretion for asset retirement obligations
associated with nonregulated operations
Adjustments:
Total EBITDA adjustments

5 © 2017 The Williams Companies, Inc. All rights reserved. Williams Analyst Day 2017 | 5/11/17 G-
WMB 2017 Guidance: Dividend Illustration and Coverage Calculation
NON-GAAP RECONCILIATIONS
2017
(Dollars in billions, except per share amounts) Guidance
Distributions from WPZ (accrued / “as declared” basis) $1.7
Corporate interest (0.3)
Subtotal $1.4
WMB cash tax rate 0.0%
WMB cash taxes (excludes cash taxes paid by WPZ) -
WMB cash available for dividends and other uses $1.4
WMB dividends paid (1.0)
Excess cash available after dividends $0.4
Dividend per share $1.20
Coverage ratio (1)
1.4x
Memo:
WMB Economic Interest in WPZ Cash Coverage - Guidance Midpoint (2)
$0.3
WMB cash available for dividends and other uses 1.4
WMB Economic Distributable Cash Flow (3)
$1.7
Economic coverage ratio (4)
1.7x
Notes:
- WMB does not expect to be a U.S. federal income cash taxpayer through at least 2020,
excluding taxes on any potential asset monetizations
- WMB "Other Segment" Adjusted EBITDA and "Other Segment" Maintenance Capital are not
shown due to their immateriality
(1) WMB cash available for dividends and other uses / WMB dividends paid
(2) WMB pro rata share (~74%) of WPZ Distributable cash flow in excess of Total cash distributed
(3) WMB Economic Interest in WPZ Cash Coverage + WMB cash available for dividends and other uses
(4) WMB Economic Distributable Cash Flow / WMB dividends paid
6 © 2017 The Williams Companies, Inc. All rights reserved. Williams Analyst Day 2017 | 5/11/17 G-
Note: Operating margin % = Operating margin / Gross margin.
WMB 2014–2016 Reconciliation of GAAP Operating Income to Non-GAAP Operating Margin and Operating Margin Percentage
NON-GAAP RECONCILIATIONS
($ in Millions) 2014 2015 2016
Gross margin $4,621 $5,581 $5,774
Operating Income $1,569 $226 $700
Add: Depreciation and amortization expenses 1,176 1,738 1,763
Add: Impairment of goodwill – 1,098 –
Add: Impairment of certain assets 52 209 873
Add: Net insurance recoveries – Geismar Incident (232) (126) (7)
Add: Other (income) expense – net (97) 40 142
Operating margin $2,468 $3,185 $3,471
Operating margin % 53% 57% 60%