8a.8 disdrometer derived zs relations in south central ontario, canada
TRANSCRIPT

8A.8 DISDROMETER DERIVED Z-S RELATIONS IN SOUTH CENTRAL ONTARIO, CANADA
A. Tokay1,7, V. N. Bringi2, M. Schönhuber3, Gwo-Jong Huang2, Brian Sheppard4, D. Hudak4, D.B. Wolff7,8, P.G. Bashor5, W. A. Petersen6 and G. Skofronick-Jackson7
1University of Maryland Baltimore County, Baltimore, MD 2Colorado State University, Fort Collins, Colorado 3Joanneum Research, Graz, Austria 4 Environment Canada, King City, Ontario, Canada 5 Computer Sciences Corporation, Wallops Island, VA 6 The University of Alabama in Huntsville, Huntsville, AL 7 NASA /GSFC, Greenbelt, MD 8 Science System Applications Inc, Lanham, MD 1. INTRODUCTION During the winter of 2006-2007, a number of in-situ and remote sensing precipitation measuring devices were operated at the Center of Atmospheric Research Experiment (CARE) site located near Egbert, Ontario about 30 km to the NW of the King City C-band operational dual-polarized radar. While the experiment was originally designed to measure winter precipitation for the Canadian Cloudsat/CALIPSO validation program (C3VP), the NASA’s Global Precipitation Measurement (GPM) ground validation program joined the efforts (cf. Petersen et al., 2007; this conference) bringing optical disdrometers (2D-video and two Parsivel disdrometers) and a multi-frequency radar. The CARE is a well-instrumented facility including Vaisala FD12P visibility sensor, Precipitation Occurrence Sensor System (POSS), the McGill University’s vertically-pointing X-band Doppler, and Hydrometeor Velocity and Shape Detector (HVSD). All in-situ precipitation measuring devices and the X-band radar were collocated as shown in Fig. 1. Fig 1: CARE site near Egbert, Ontario. Shown in the foreground are the low profile 2D video disdrometer and the two Parsivels. The POSS is in the background to the left of the view which is from the SE. In this paper we focus on two case studies, (a) the 6 December 2006 and (b) the 22 January 2007 snow events. Our objectives are six-fold, (a) to determine the characteriscs of snow size spectra, (b) to determine the bulk density of snow by comparing measurements of Parsivel and FD12P, (c) to estimate a density (ρ) versus ‘size’ relation for snow by comparing the 2D-video derived Zh measurements with the well-calibrated King
City Zh data, (d) to compare the Zh between 2D-video, POSS and King City radars, (e) to estimate snowfall rate (SR) and equivalent melt water (MWR) rate, including comparison of melt water accumulations from 2D-video, POSS, and other ground-based instruments at the CARE site, and (f) to derive the Zh-SR and Zh-MWR power law relations from 2D-video and Parsivel data. The 2D-video disdrometer (2DVD: Kruger and Krajewski 2002; www.disdrometer.at) gives, for each particle falling through its 10x10 cm virtual sensor area, two orthogonal image views using two high speed line scan cameras. The illumination is provided by two lamps. Particles fall through two light planes separated by a precisely calibrated distance (nominally 6 mm) from which the fallspeed is obtained. The 2DVD also measures the maximum width and height in both planes. No information of the snow density is available and this must be estimated by comparison with other instruments which measure the melt water rate or accumulation over a time period. Since the 2DVD installation was temporary, a ‘makeshift’ double layer fence was installed on the western half of a semi-circle from N to S as the snow systems generally move in from the NW to W directions. Fences on the eastern half of the semi-circle could not be installed. Unlike the 2DVD, the Parsivel measures only the maximum width of the particle in a horizontal optical plane, while its velocity is calculated from the duration of the particle within the laser beam (Löffler-Mang and Joss 2000). Again, no information is available on snow density. The FD12P optical arrangement allows for indvidual hydrometeors to be detected from rapid signal changes. The amplitude of these changes is related to the precipitation intensity. The intensity estimate is proportional to the volume of the particles. The optical volume estimate in snow is about ten times larger than that in rain. The difference of approximately one decade is used to discern between rain and snow (User’s guide, chapter 5). POSS is a bistatic, continuous wave, horizontally polarized, X-band Doppler radar. The transmitter and receiver antennas are angled from the vertical by 20 degrees to define a measurement volume extending to about 3 meters above the radomes. The principles of
*Corresponding authors address: A. Tokay, JCET, University of Maryland Baltimore County, Maryland 21250. Email: [email protected]

operation are described in Sheppard (1990). A more recent article (Sheppard and Joe 2007) describes its performance as a precipitation gauge in rain and snow. In this paper we compare reflectivity and accumulated melt water profile as deduced from POSS with those from 2D-video and the King City radar. 2. SNOW DENSITY It is well-known that the density of snow can be parameterized by a power law of the form ρ = α (‘size’)β where different measurements of ‘size’ have been used in the literature depending on the application or the instrument used (e.g., Pruppacher and Klett 1997). In the case of the 2DVD, the ‘size’ is termed the ‘apparent’ diameter (Dapp). It is calculated in the same way as the equivolume sphere diameter of a raindrop. The scan lines recorded by the front and side view cameras divide the particle into several slices. In each of these slices, the particle is assumed to form an elliptical cylinder. In the case of snowflakes this assumption generally does not hold. However, to obtain a ‘size’ parameter for snowflakes the method is applied nevertheless. The first shadow’s begin ‘pixel’ and the last shadow’s end ‘pixel’ are taken as the width of the elliptical cylinder even if there are gaps in one scan line. Similarly, for the image from the second camera. The volume obtained by summing the elemental elliptical cylinder volumes is then equated to the volume of a sphere with diameter of Dapp. From these data the snow size distribution, N(Dapp) can be calculated for any averaging period (typically a few minutes). In a study of Colorado snow storms using the 2DVD and Geonor gauge, Brandes et al. (2007) found that on average, ρ = 0.178 Do
-0.922 where Do is the median volume diameter (in mm) calculated from N(Dapp), and ρ is in g cm-3 . From their paper we infer that ρ = 0.178 Dapp
-0.922 and we use it here as an initial relation in our objective of determining an ‘optimal’ coefficient α for our two events. For estimating snowfall rate from the 2DVD, we adjust the apparent volume of each particle by the following method. For each view, the smallest convex circumferential polygon is drawn and the ratio of the area of the image to the area of the polygon is calculated (say, rA from camera A and rB from camera B). Then the geometric mean of rA and rB is calculated (say, γ). The apparent volume is then multipled by γ3/2 . The the sum of the adjusted apparent volume for each particle is computed and normalized by the measurment area and the integration time. This method is an approximation to the snowfall rate since the images cannot show all the ‘holes’ inside the snowflake. Parsivel computes the N(D) from the measured maximum width D and fall velocity. Assuming maximum width as a spherical diameter the snowfall rate is then calculated as an integral product. Both the 2DVD and the Parsivel produces a snow rate, while FD12P software provides an estimate of snow water equivalent
of snow. We averaged the 2DVD measurements to one minute to match the resolution of the Parsivel and FD12P data. The POSS estimate of equivalent melt water rate (MWR) is based on a second order polynomial regression between the log of the 0th moment of the Doppler spectrum and log of MWR using a ‘composite’ of simulated calculations for different solid precipitation types. Similarly, this method is applied for POSS calculation of reflectivity. This is the first time POSS reflectivites in snow have been compared with other instruments. 3. CASE STUDY ANALYSES 3.1 6 December 2006 Event The time-height profile from the McGill vertical pointing X-band Doppler radar located near the 2DVD and the two Parsivals is shown in Fig. 2. The Geonor gauge measured 2.7 mm of liquid accumulation from 12:00-16:00 UTC. The temperature was around –0.3 C with winds of 3.6 m s-1 . The peak Z occurred around 14:20-14:25 UTC (upper panel); the lower panel shows the mean Doppler velocity which has increased in this period to around –1.6 to -2 m s-1 . An RHI scan of Zh from the King City radar at the azimuth angle of the CARE site is shown in Fig. 3. The reflectivity is generally maximum at the surface, while it decreases rapidly near 2 km height. It is likely that aggregation is primarily responsible for the increase in Zh with decreasing height. Fig. 3 also shows the Zh range over the CARE site to be 25-30 dBZ at this time and is consistent with the vertical pointing data shown in Fig. 2.
Fig. 2: Data from the McGill vertically pointing X-band Doppler radar located at the CARE site. Upper panel shows reflectivity and lower panel the mean Doppler velocity. Courtesy of Dr. Gyuwon Lee of NCAR.
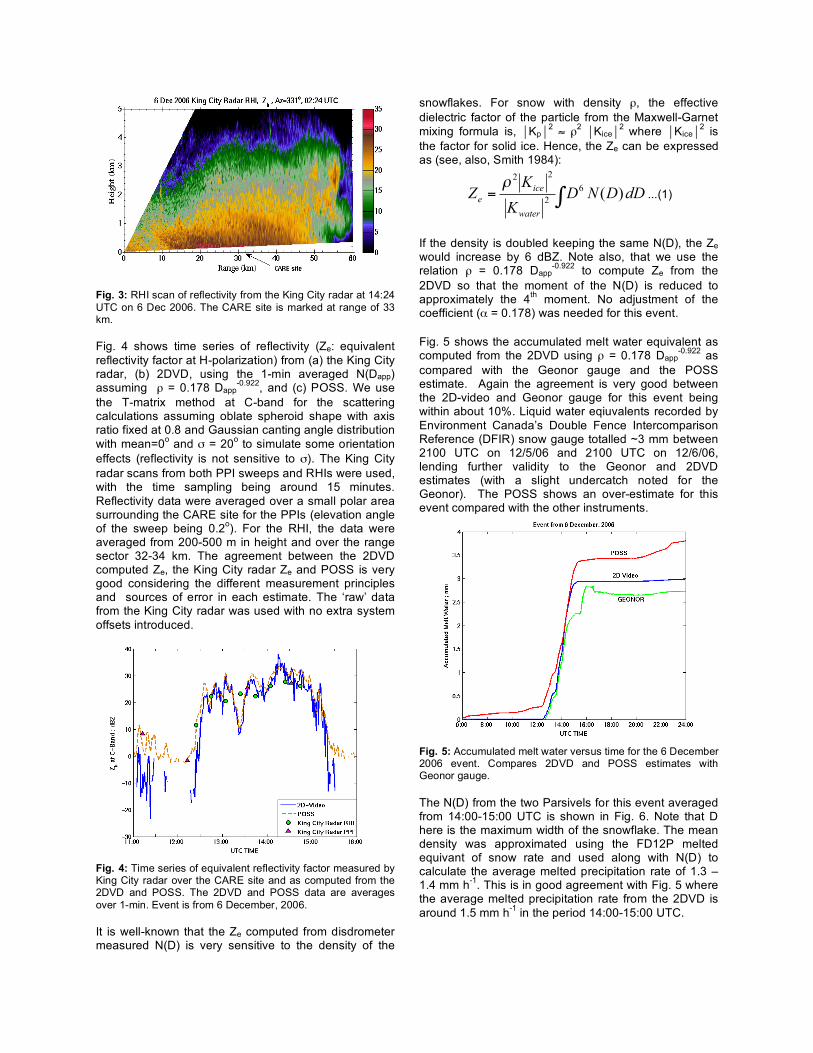
Fig. 3: RHI scan of reflectivity from the King City radar at 14:24 UTC on 6 Dec 2006. The CARE site is marked at range of 33 km. Fig. 4 shows time series of reflectivity (Ze: equivalent reflectivity factor at H-polarization) from (a) the King City radar, (b) 2DVD, using the 1-min averaged N(Dapp) assuming ρ = 0.178 Dapp
-0.922, and (c) POSS. We use the T-matrix method at C-band for the scattering calculations assuming oblate spheroid shape with axis ratio fixed at 0.8 and Gaussian canting angle distribution with mean=0o and σ = 20o to simulate some orientation effects (reflectivity is not sensitive to σ). The King City radar scans from both PPI sweeps and RHIs were used, with the time sampling being around 15 minutes. Reflectivity data were averaged over a small polar area surrounding the CARE site for the PPIs (elevation angle of the sweep being 0.2o). For the RHI, the data were averaged from 200-500 m in height and over the range sector 32-34 km. The agreement between the 2DVD computed Ze, the King City radar Ze and POSS is very good considering the different measurement principles and sources of error in each estimate. The ‘raw’ data from the King City radar was used with no extra system offsets introduced.
Fig. 4: Time series of equivalent reflectivity factor measured by King City radar over the CARE site and as computed from the 2DVD and POSS. The 2DVD and POSS data are averages over 1-min. Event is from 6 December, 2006. It is well-known that the Ze computed from disdrometer measured N(D) is very sensitive to the density of the
snowflakes. For snow with density ρ, the effective dielectric factor of the particle from the Maxwell-Garnet mixing formula is, Kp
2 ≈ ρ2 Kice2 where Kice
2 is the factor for solid ice. Hence, the Ze can be expressed as (see, also, Smith 1984):
!= dDDND
K
KZ
water
ice
e)(6
2
22"...(1)
If the density is doubled keeping the same N(D), the Ze would increase by 6 dBZ. Note also, that we use the relation ρ = 0.178 Dapp
-0.922 to compute Ze from the 2DVD so that the moment of the N(D) is reduced to approximately the 4th moment. No adjustment of the coefficient (α = 0.178) was needed for this event. Fig. 5 shows the accumulated melt water equivalent as computed from the 2DVD using ρ = 0.178 Dapp
-0.922 as compared with the Geonor gauge and the POSS estimate. Again the agreement is very good between the 2D-video and Geonor gauge for this event being within about 10%. Liquid water eqiuvalents recorded by Environment Canada’s Double Fence Intercomparison Reference (DFIR) snow gauge totalled ~3 mm between 2100 UTC on 12/5/06 and 2100 UTC on 12/6/06, lending further validity to the Geonor and 2DVD estimates (with a slight undercatch noted for the Geonor). The POSS shows an over-estimate for this event compared with the other instruments.
Fig. 5: Accumulated melt water versus time for the 6 December 2006 event. Compares 2DVD and POSS estimates with Geonor gauge. The N(D) from the two Parsivels for this event averaged from 14:00-15:00 UTC is shown in Fig. 6. Note that D here is the maximum width of the snowflake. The mean density was approximated using the FD12P melted equivant of snow rate and used along with N(D) to calculate the average melted precipitation rate of 1.3 – 1.4 mm h-1. This is in good agreement with Fig. 5 where the average melted precipitation rate from the 2DVD is around 1.5 mm h-1 in the period 14:00-15:00 UTC.

104
103
102
10-1
101
100
10-2
10-3
10-4
0 5 10 15 20
MaximumWidth (mm)
104
103
102
10-1
101
100
10-2
10-3
10-4
0 5 10 15 20
Maximum Width (mm)
Parsivel 3
Parsivel 4
December 6, 200614 -15 UTC
Density = 0.039, 0.034 g cm-3
Snow water content = 0.386, 0.351 g m-3
Mass mean diameter = 5.14, 5.19 mm
December 7, 200612 - 13 UTC
Density = 0.043, 0.044 g cm-3
Snow water content = 0.196, 0.206 g m-3
Mass mean diameter = 4.06, 3.92 mm
Precipitation rate = 19.3,19.6 mm h-1
Melted precipitation rate = 0.8, 0.8 mm h-1
Rayleigh Reflectivity = 25.7, 25.9 dBZ
Normalized intercept parameter (Nt*) = 236, 309 m-3 mm-1
Normalized intercept parameter (Np) = 1271,1502 m-3 mm-1
Parsivel 3
Parsivel 4
Precipitation rate = 34.8, 40.9 mm h-1
Melted precipitation rate = 1.3, 1.4 mm h-1
Rayleigh Reflectivity = 31.7, 30.9 dBZ
Normalized intercept parameter (Nt*) = 402, 493 m-3 mm-1
Normalized intercept parameter (Np) = 1163, 1162 m-3 mm-1
Fig. 6: N(D) from the 2 Parsivels averaged from 14:00-15:00 UTC for 6 Dec 2006 event. Note that D here is the maximum width, precipitation rate is same as snow rate defined in Eq. (2) while melted precipitation rate is same as MWR defined in Eq. (3). Parsivel measurements are not reliable at sizes less than 0.5 mm in diameter and therefore the size spectra was truncated at this threshold. The agreement between the two Parsivel units was excellent except for a slight discrepancy at the large particle end (D > 8 mm). Althought we averaged the size spectra for one hour, the large particles are rarely observed, resulting in discrepancy between the two measurements. Among the integral parameters, precipitation rate and mean mass diameter are directly calculated from the averaged size spectra. Once the bulk density is determined, reflecitivity at Rayleigh regime (equation 1), melted precipitation rate, and snow water content can be determined. The normalized gamma distribution has been widely used to parameterize the observed raindrop spectra. We adopted the same model distribution for the snow size spectra. The observed parameters that we adopted in normalization was the mean mass diameter and snow water content following Bringi et al. (2003). We then determined the shape parameter by minimizing the error between observed and gamma model precipitation rate. We repeated this exercise once more but we choose total concentration (Nt) rather than snow water content following Meneghini and Liao (2007). The normalized intercept parameters are given in Fig. 6 as well. 3.2 22 January 2007 Event The McGill VertiX radar was not available for this event having failed some weeks before. The average temperature was around –9 C, wind speeds averaging
4-5 m s-1 , wind direction varying from 55-90o (i.e., from NE-E directions being the non-fenced area) and gusts of around 4-5 m s-1. The King City radar RHI of Ze at 02:24 UTC is shown in Fig. 7. At this time a gradient of Ze can be observed across the CARE site. In general the Ze is fairly uniform beyond the CARE site (NW to CARE site). The increase in Ze below 2 km height is evidence of aggregation processes being dominant.
Fig. 7: RHI of Ze from King City radar over the CARE site at 02:24 UTC. The CARE site is marked. Similar to Fig. 4, the time series of Ze from PPI/RHI radar scans are compared with Ze from 3-min averaged N(Dapp) from 2DVD in Fig. 8. The radar time samples are approximately 12 minutes apart. The coeffficient (α) of the ρ = α Dapp
-0.922 relation was adjusted to match the Ze from the 2DVD with the radar measured Ze. The ‘optimal’ α was estimated for each radar sampling time (i.e., we have a time sequence of α values corresponding to the radar sampling times, around 30 values). The mean α was found to be 0.354 which was used to calculate the equivalent melt water accumulation for the entire period 02:00-09:00 UTC as shown in Fig. 9. Note that this coefficient is nearly twice the value of 0.178 determined by Brandes et al. (2007). This value of mean α (0.354) is high compared with values in the literature. This should be considered a preliminary estimate since there was evidence of large number of mis-matched particles (for Dapp< 4 mm) especially in the interval 02:00-03:00 UTC as compared with the Parsivel (not shown here). Fig. 9 compares the accumulation from 2D-video and POSS along with a manual reading from the DFIR of 2.4 mm. The POSS estimate is higher than this and more in line with the Parsivel estimate to be discussed later. The 2D-video estimate is closer to the manual reading but this might be fortuitous because of the unusual high value of α estimated from the 2DVD /King City radar matching for this event.

Fig. 8: Time series of equivalent reflectivity factor measured by King City radar over the CARE site and as computed from the 2DVD and POSS. The 2DVD data are averages over 3-min while 1 min for POSS. For the 22 Jan 2007 event.
Fig. 9: Accumulated melt water versus time for the 22 Jan 2007 event. Compares 2DVD and POSS estimates with manual DFIR reading at the end of the event. The N(D) from the two Parsivels for this event averaged from 02:00-03:00 UTC is shown in Fig. 10. Note that D here is the maximum width of the snowflake. This 1-h period corresponds to the first peak in Ze as shown in Fig. 8. The mean density was approximated using the FD12P data available from the CARE site and used along with N(D) to calculate the average melted precipitation rate of 1.0 – 1.2 mm h-1. In contrast the 2DVD estimates only 0.25 mm of accumulation during this 1-h period mainly due to low concentration of particles (for Dapp < 6 mm) compared with the Parsivels. To illustrate this, Fig. 11 shows the N(Dapp) from the 2DVD averaged over the same time period as well as N(D) where D is the geometric mean of the maximum widths from the two cameras (the latter to be consistent with the Parsivels). Note the lower concentrations for Dapp < 6 mm (around factors varying between 10 and 5 less).
With respect to previous case, Parsivel detected lower concentration of small flakes resulting in higher mean mass diameter and lower precipitation rate. Later in the storm (Fig. 12), the size spectra was narrower with higher concentrations of small flakes and lack of large flakes. The estimated density was higher in this event than the previous event mainly due to the lower precipitation rates in the second event. The gamma fitted parameters between the events and within the second event showed substatinal differences as well.
104
103
102
10-1
101
100
10-2
10-3
10-4
0 5 10 15 20
MaximumWidth (mm)
104
103
102
10-1
101
100
10-2
10-3
10-4
0 5 10 15 20
Maximum Width (mm)
January 22, 200702 - 03 UTC
Density = 0.081, 0.045 g cm-3
Snow water content = 0.435, 0.310 g m-3
Mass mean diameter = 6.14, 6.33 mm
Parsivel 3
Parsivel 4
Precipitation rate = 15.3, 22.4 mm h-1
Melted precipitation rate = 1.2, 1.0 mm h-1
Rayleigh Reflectivity = 37.1, 33.5 dBZNormalized intercept parameter (Nt*) = 87, 157 m-3 mm-1
Normalized intercept parameter (Np) = 310, 351 m-3 mm-1
January 22, 200706 - 07 UTC
Density = 0.113, 0.093 g cm-3
Snow water content = 0.735, 0.709 g m-3
Mass mean diameter = 3.70, 3.95 mm
Parsivel 3
Parsivel 4
Precipitation rate = 16.7, 23.3 mm h-1
Melted precipitation rate = 1.9, 2.1 mm h-1
Rayleigh Reflectivity = 34.1, 34.5 dBZ
Normalized intercept parameter (Nt*) = 493, 703 m-3 mm-1
Normalized intercept parameter (Np) = 2820, 2574 m-3 mm-1
Fig. 10: N(D) from two Parsivel disdrometers averaged from 06:00-07:00 UTC for 22 Jan 2007 event. See, also Fig. 8 for the Ze values in this period. Note that D here is the maximum width, precipitation rate is same as snow rate defined in Eq. (2) while melted precipitation rate is same as MWR defined in Eq. (3).
Fig. 11: 2DVD averaged N(Dapp) and N(D) where D is the geometric mean of the maximum widths from the two cameras. The averaging period is from 02:00-03:00 UTC A second period from 06:00-07:00 UTC was also analyzed in a similar manner. Corresponding to Figs. 10 and 11, we show similar plots in Fig. 12 and 13. The

reflectivity for this period over the CARE site is shown in Fig. 8.
104
103
102
10-1
101
100
10-2
10-3
10-4
0 5 10 15 20
MaximumWidth (mm)
104
103
102
10-1
101
100
10-2
10-3
10-4
0 5 10 15 20
Maximum Width (mm)
January 22, 200702 - 03 UTC
Density = 0.081, 0.045 g cm-3
Snow water content = 0.435, 0.310 g m-3
Mass mean diameter = 6.14, 6.33 mm
Parsivel 3
Parsivel 4
Precipitation rate = 15.3, 22.4 mm h-1
Melted precipitation rate = 1.2, 1.0 mm h-1
Rayleigh Reflectivity = 37.1, 33.5 dBZNormalized intercept parameter (Nt*) = 87, 157 m-3 mm-1
Normalized intercept parameter (Np) = 310, 351 m-3 mm-1
January 22, 200706 - 07 UTC
Density = 0.113, 0.093 g cm-3
Snow water content = 0.735, 0.709 g m-3
Mass mean diameter = 3.70, 3.95 mm
Parsivel 3
Parsivel 4
Precipitation rate = 16.7, 23.3 mm h-1
Melted precipitation rate = 1.9, 2.1 mm h-1
Rayleigh Reflectivity = 34.1, 34.5 dBZ
Normalized intercept parameter (Nt*) = 493, 703 m-3 mm-1
Normalized intercept parameter (Np) = 2820, 2574 m-3 mm-1
Fig. 12: N(D) from two Parsivels averaged from 06:00-07:00 UTC for 22 Jan 2007 event. See, also Fig. 8 for the Ze values in this period. Note that D here is the maximum width, precipitation rate is same as snow rate defined in Eq. (2) while melted precipitation rate is same as MWR defined in Eq. (3).
Fig.13: 2DVD averaged N(Dapp); the averaging period is from 06:00-07:00 UTC. From this comparison, note that the concentrations from the 2DVD are still much smaller that that of the Parsivels especially for Dapp < 4 mm. This is due to the mis-matching problem with the 2D-video software. The mean melt water rate for this 1-h period from the Parsivels is 1.9-2.1 mm h-1 whereas for the 2DVD it is only 0.67 mm h-1. Note that the Parsivel accumulations from 02:00-03:00 UTC and 06:00-07:00 UTC sum to 3.1 mm just for the 2-h period in the long event which lasts from 02:00 to 09:00 UTC. This implies that the total accumulation from the Parsivels for the entire 7-h period
must exceed 3.1 mm and more consistent with the POSS total accumulation of 3.4 mm in Fig. 9. 4. Zh-SR and Zh-MWR RELATIONS We now derive power laws relating Zh to snowfall rate (SR) and to melt water rate (MWR) using data from the 2DVD for only the 6 Dec 2006 event because of the 2D-video mis-match problem for the 22 Jan 2007 event alluded to earlier. As described earlier, the Zh from the 2DVD uses N(Dapp) averaged over 1-min and uses the ρ = 0.178 Dapp
-0.922 for the 6 Dec event. The snowfall rate is computed as follows:
!""
=n
nappn VtA
SR ,
2/31# …(2)
where γ was defined in Section 2 and Vapp is the ‘apparent’ volume of the snowflake (Vapp=π/6 Dapp
3). The sum is over all particles in the time interval Δt , and ΔA is the normalizing area. The melt water rate is defined as:
!""
=n
nappapp VDtA
MWR ,)(1
# …(3)
Fig 14 shows the scatter plot of Zh-SR data with the ‘best’ fit line, with SR being the independent variable. Similarly, Fig 15 shows Zh-MWR data with MWR being the independent variable.
Fig. 14: Scatter plot of Zh versus snow rate (SR) for December 6 2006 case from 2DVD data. The independent variable is snow rate. Each data point is a 1-min average of N(D). For the December 6, 2006 event analyzed herein, the Zh-SR relation is derived as Zh = 16 (SR)1.2. The derived Zh-MWR power law for this event is Zh = 348 (MWR)1.36 which ‘appears’ as a Z-R relation for rain. For a typical Zh of 25 dBZ as encountered in this event, the snowfall rate is 12.0 mm h-1 and water equivalent of snow is 0.9 mm h-1. As a result, the ratio of snowfall rate to melt water rate is 12.9.

Fig.15: Scatter plot of Zh versus melt water rate (MWR) for December 6, 2006 event from 2DVD data. We constructed Z-SR and Z-MWR relations for December 6 and January 22 events using two Parsivel disdrometer and FD12P observations. Recall, the volumetric diameter was approximated from maximum width without any correction as in equation 2. The error regarding this assumption will be looked at in a later stage. The agreement of the coefficients and exponents of the Z-SR relations between the two Parsivels are good (Fig. 16), while the parameters of Z-MWR relations showed more diversity (Fig. 17). At 25 dBZ, the ratio of snow rate to the water equivalent rate is 9.0 and 13.8 for the two Parsivel units, in agreement with the similar ratios in 2DVD even though both snow rate and water equivalent rate were lower in Parsivel than in 2DVD. The data points in Fig. 16 and Fig. 17 represent 5 minutes average of Parsivel and FD12P data.
103102101100 104
103
102
10-1
101
100
Reflectivity (mm6 m-3)
December 6, 200612-16 UTC
Z = 64 SR1.02 (parsivel3)Z = 27 SR1.18 (parsivel4)
34 samples
Fig. 16: Scatter plot of reflectivity versus snow rate for December 6, 2006 event from Parsivel and FD12P measurements.
10-1
101
100
Reflectivity (mm6 m-3)
December 6, 200612-16 UTC
Z = 1126 MWR2.01 (parsivel3)
Z = 835 MWR1.83 (parsivel4)
34 samples
103102101100 104
Fig. 17: Scatter plot of reflectivity versus melted snow water rate for December 6, 2006 event from Parsivel disdrometer and FD12P measurements. The second event showed wider range of reflectivity where the sample size is almost doubled (Fig. 18). The coefficient of Z-SR relations in the second event is two to three times less than those in the first event, while the exponent of Z-SR relations is substantially higher in the second event. Considering Z-MWR relations, both coefficient and exponents were also substantially higher in the second event than those in the first event (Fig. 19). At 25 dBZ, the snow rate to the melted water equivalent ratio was 6.9 and 10.6 for the two Parsivel disdrometers. Mainly, at 25 dBZ the water equivalent of snow was about 0.5 mm h-1 for both Parsivels and for both events. The snow rate, on the hand, showed had a range of 3 to 5 m h-1 and 5 and 8 mm h-1 in first and second event, respectively. We should remind the reader that these results are preliminary and should be used with a caution.
103
102
10-1
101
100
Reflectivity (mm6 m-3)
67 samples
January 22, 200702-09 UTC
Z = 37 SR1.87 (parsivel3)Z = 9 SR2.13 (parsivel4)
103102101100 104
Fig. 18: Scatter plot of reflectivity versus snow rate for January 22, 2007 event from Parsivel and FD12P measurements.

10-1
101
100
Reflectivity (mm6 m-3)
67 samples
January 22, 200702-09 UTC
Z = 3435 MWR3.02 (parsivel3)
Z = 2887 MWR3.29 (parsivel4)
103102101100 104
Fig. 18: Scatter plot of reflectivity versus melted snow water rate for January 22, 2007 event from Parsivel and FD12P measurements. 5. CONCLUSIONS In agreement with previous work, the density versus ‘size’ relation is quite variable depending on snow type, degree of riming and temperature. This relation is important for deriving the Zh-MWR power law. The 2DVD, Parsivels or POSS do not give any information on the snow density. In this paper we have tried to use the well-calibrated King City radar measurements of Zh as a basis to match the Zh from 2DVD data. This matching procedure involves adjusting the coefficient of the density-‘size’ relation which is used to compute Zh from 2DVD data. For the December 6 event this procedure gave reasonable results in terms of reflectivity and accumulated melt water amounts from 2D-video and POSS. For the January 22 event the 2D-video gave an underestimation for D < 4-5 mm compared to the Parsivels mainly because of the mis-match problem. As a result the coefficient of the density-‘size’ was unreasonably high for aggregates. This discrepancy will be addressed in the future. For the December 6 event we have derived Zh-SR and Zh-MWR power relations from the 2D-video data which appear reasonable. As an alternative method, we have also compared the Parsivel snow rate with FD12P melted snow rate to extract the bulk density. The bulk density was within the range of aggregated snowflakes, but still need to be verified through other measurements. ACKNOWLEDGEMENTS The deployment of Parsivel in Egbert, Ontario was supported through NASA TRMM Satellite Validation Office, Richard Lawrence, Chief, and Observational Sciences Branch, John Gerlach, Head. The analysis was supported by NASA grant NAG5-13615. The deployment of the 2DVD by the GPM ground validation via NASA grant NNX06AG89G. The NASA PMM grant 06-
PMM06-0014 supported the analysis work of VNB. We are grateful to Peter Rodriguez and Steve Brady of Environment Canada for assistance in installing and maintaining the 2DVD and Parsivel. Discussions with Ismail Gültepe of Environment Canada and Gyuwon Lee of NCAR were helpful during the analysis phase. Many thanks to Matthew Schwaller of NASA-GSFC for coordinating the efforts of the field campaign.
REFERENCES Brandes, E.A., K. Ikeda, G. Zhang, M. Schönhuber and R.M. Rasmussen, 2007: A statistical and physical description of hydrometeor distributions in Colorado snowstorms using a video disdrometer., J. Appl. Meteor. and Climat., vol. 46, 634-650. Bringi, V.N., V. Chandrasekar, J. Hubbert, E. Gorgucci, W.L. Randeu and M. Schoenhuber, 2003: Raindrop size distribution in different climate regimes from disdrometer and dual-polarized radar analysis. J. Atmos. Sci., vol. 60, 354-365. Kruger, A., and W.F. Krajewski, 2002: Two-dimensional video disdrometer: A description, J. Atmos. Oceanic Technol., vol. 19, 602-617. Löffler-Mang, M. and J. Joss, 2000: An optical disdrometer for measuring size and velocity of hydrometeors, J. Atmos. Oceanic Technol., vol. 17, 130-139 Meneghini R., and L. Liao, 2007: On the equivalence of dual-wavelength and dual-polarization equations for estiamtion of the raindrop size distribution, J. Atmos. Oceanic Technol., vol. 24, 806-820. Petersen, W. A. and Coauthors, 2007: NASA GPM/PMM Participation in the Canadian CloudSat/Calipso validation project (C3VP): Physical process studies in snow. 33rd International Conference on Radar Meteorology, American Meteorological Society, Cairns, Australia, August 6-10, 2007. Pruppacher, H.R. and J.D. Klett, 1997: Microphysics of clouds and precioitation. Kluwer Academic., 954 Rasmussen, R.M., J. Vivekanandan, J. Cole, B. Myers and C. Masters, 1999: The estimation of snowfall rate using visibility., J. Appl. Meteor., vol. 38, 1542-1563. Sheppard, B.E., 1990: The measurement of raindrop size distributions using a small Doppler radar. J. Atmos. Oceanic Technol., vol. 7, 255-268. Sheppard, B.E. and P.I. Joe, 2007: Performance of the precipitation occurrence and sensor system (POSS) as a precipitation gauge. Accepted in J. Atmos. Oceanic Technol. (in press). Smith, P., 1984: Equivalent radar reflectivity factor for snow and ice particles., J. Climate Appl. Meteor., vol. 23, 1258-1260.