8.data logging
TRANSCRIPT
8/12/2019 8.Data Logging
http://slidepdf.com/reader/full/8data-logging 1/21
Data Logging
8/12/2019 8.Data Logging
http://slidepdf.com/reader/full/8data-logging 2/21
Data logging is the use of sensors to measure and
record data automatically at regular intervals.
Sensors detect physical quantities and convert them
into electrical signals. These signals are sent to an interface box.
Sensors usually produce analogue signals, whichneed to be converted into digital signals by an analogue-to-digital converter (ADC) so that they canbe processed by a computer. The ADC is inside the
interface box.
Data Logging
8/12/2019 8.Data Logging
http://slidepdf.com/reader/full/8data-logging 3/21
Data logging is used where large amounts of data
are required over long or short periods of time.
As the measurements are taken automatically bysensors, data logging is often used where it wouldbe dangerous for a human to take measurements,
e.g.
Seismic activity (vibrations) near a volcano
Radioactivity inside a nuclear power station
The temperature inside a kiln
The digital data is then sent to a data logger, where
it is stored. At regular intervals, the data loggersends a batch of data to a computer to be analysed using formulas and charts.
Data Logging
8/12/2019 8.Data Logging
http://slidepdf.com/reader/full/8data-logging 4/21
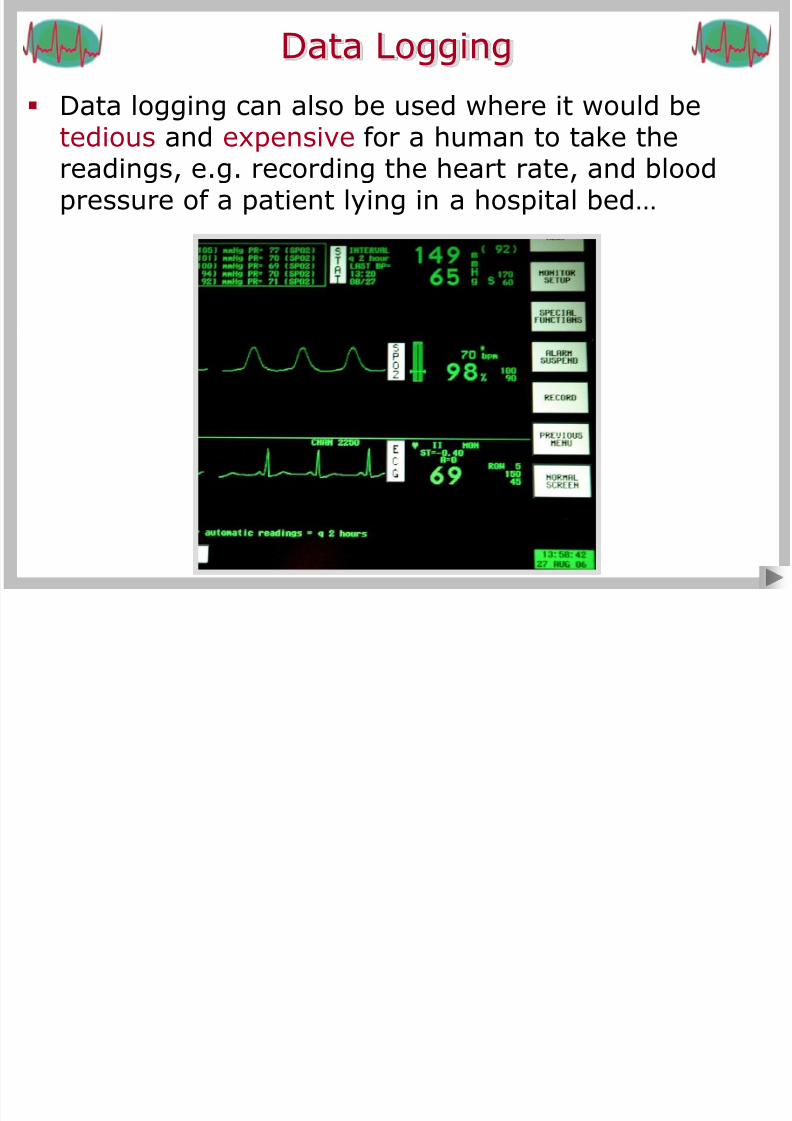
Data logging can also be used where it would be
tedious and expensive for a human to take thereadings, e.g. recording the heart rate, and bloodpressure of a patient lying in a hospital bed…
Data Logging
8/12/2019 8.Data Logging
http://slidepdf.com/reader/full/8data-logging 5/21
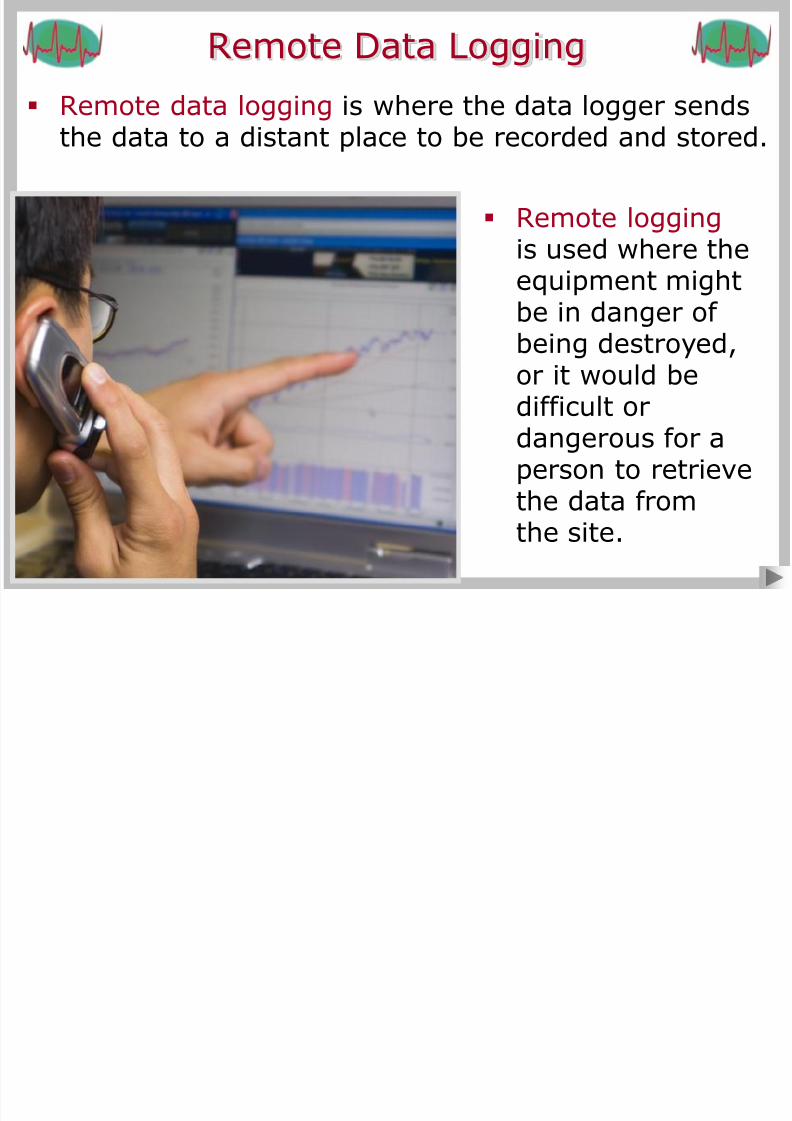
Remote data logging is where the data logger sends
the data to a distant place to be recorded and stored.
Remote logging is used where the
equipment mightbe in danger ofbeing destroyed,or it would be
difficult ordangerous for aperson to retrievethe data fromthe site.
Remote Data Logging
8/12/2019 8.Data Logging
http://slidepdf.com/reader/full/8data-logging 6/21
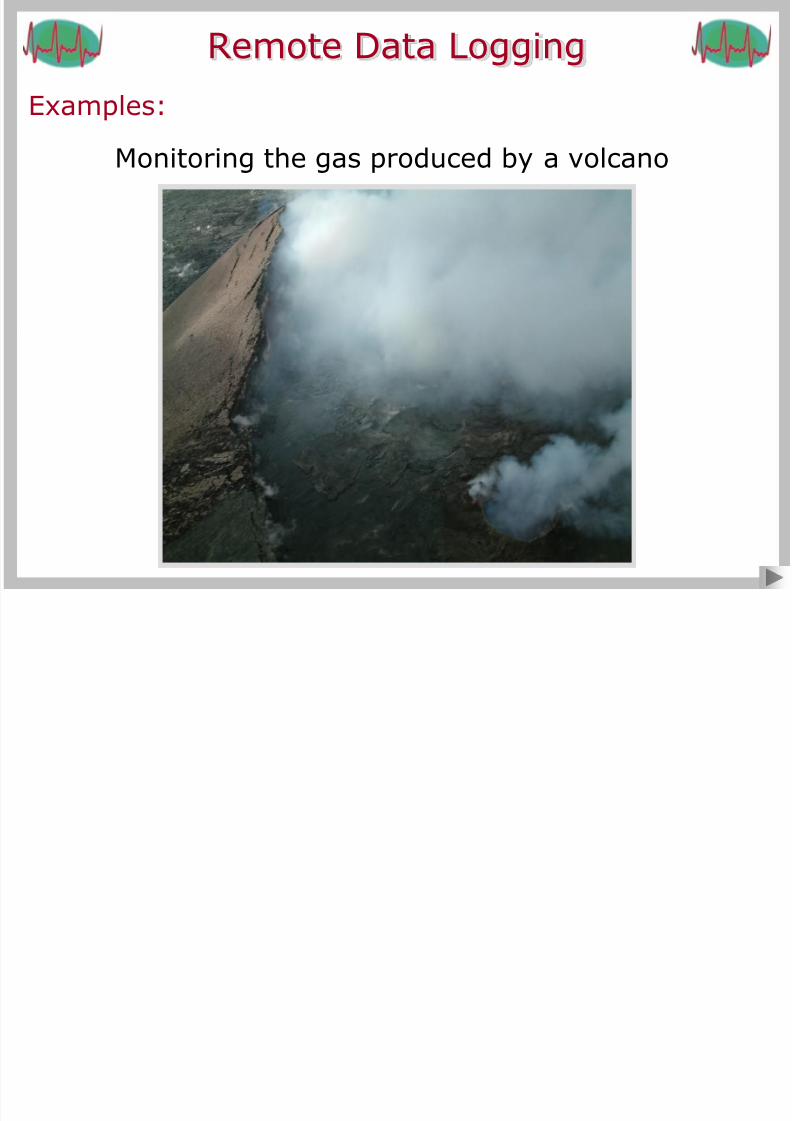
Examples:
Monitoring the gas produced by a volcano
Remote Data Logging
8/12/2019 8.Data Logging
http://slidepdf.com/reader/full/8data-logging 7/21
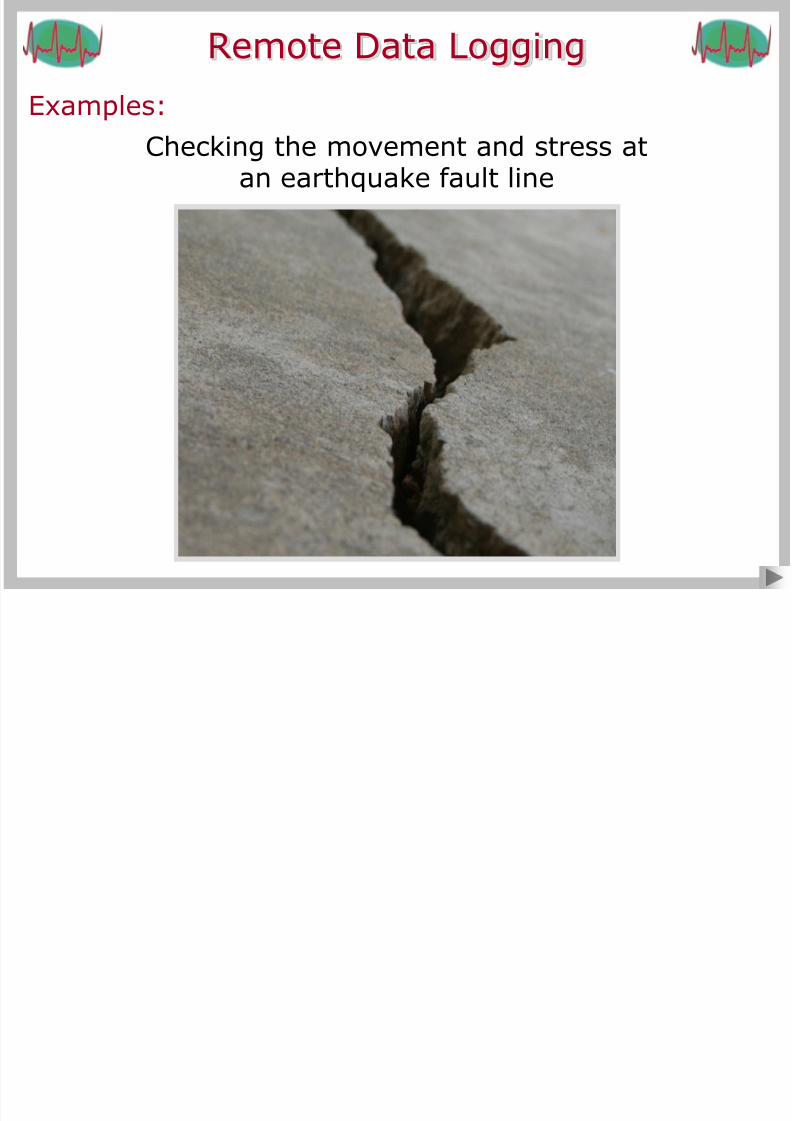
Examples:
Checking the movement and stress atan earthquake fault line
Remote Data Logging
8/12/2019 8.Data Logging
http://slidepdf.com/reader/full/8data-logging 8/21
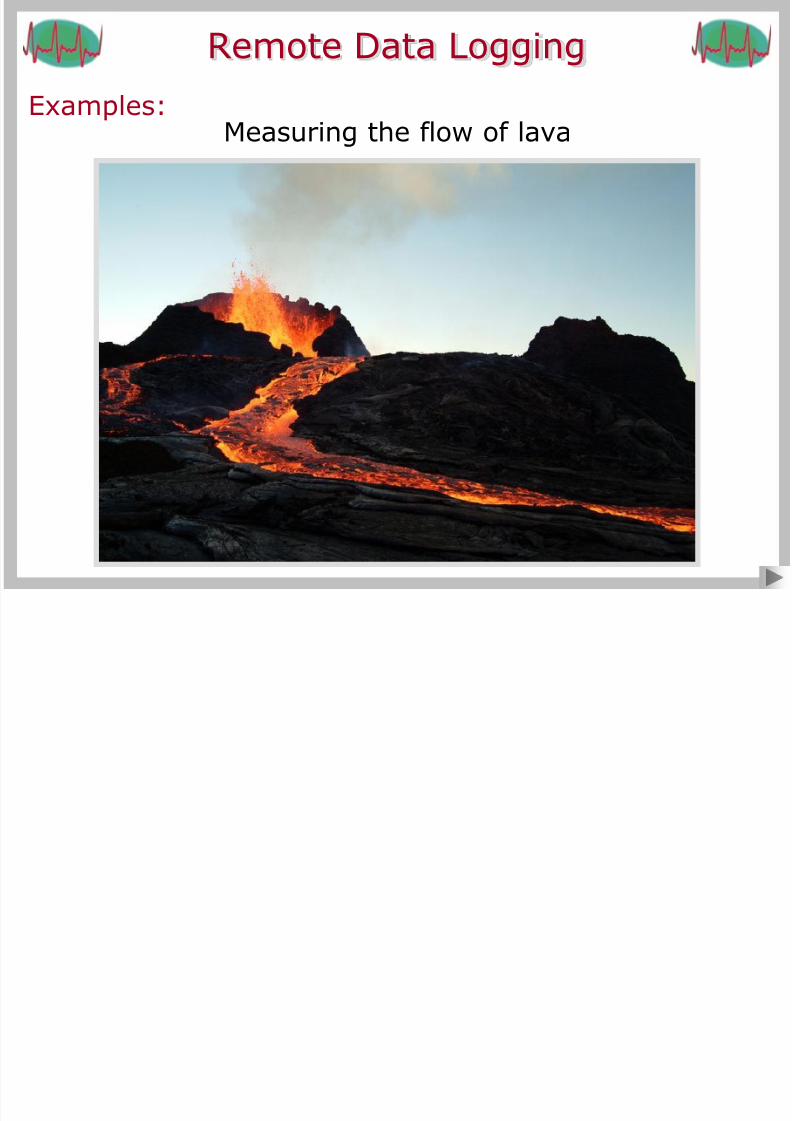
Examples:
Measuring the flow of lava
Remote Data Logging
8/12/2019 8.Data Logging
http://slidepdf.com/reader/full/8data-logging 9/21
The measurements are taken over a period of time,
called the logging period.
The choice of logging period depends on what isbeing measured, the purpose of the data logging,and how much data is required.
For an experiment in which the temperature ofwater is recorded as it cools, the logging periodcould be about an hour (the time it takes for the
water to completely cool).
For the monitoring of seismic waves (vibrations inthe Earth) near a volcano, the logging period mightbe unending, as scientists permanently record
volcanic activity in order to predict eruptions.
Logging Period
8/12/2019 8.Data Logging
http://slidepdf.com/reader/full/8data-logging 10/21
The time between measurements is called the
logging interval.
The choice of logging interval depends on whatquantity is being measured, the purpose of the
data logging, and how much data is required.
If you are measuring radiation emitted from agalaxy a long way away, you might only require
daily measurements.
If you are measuring the energy released from anexplosion, you might want a logging interval of a
fraction of a second.
Logging Interval
8/12/2019 8.Data Logging
http://slidepdf.com/reader/full/8data-logging 11/21
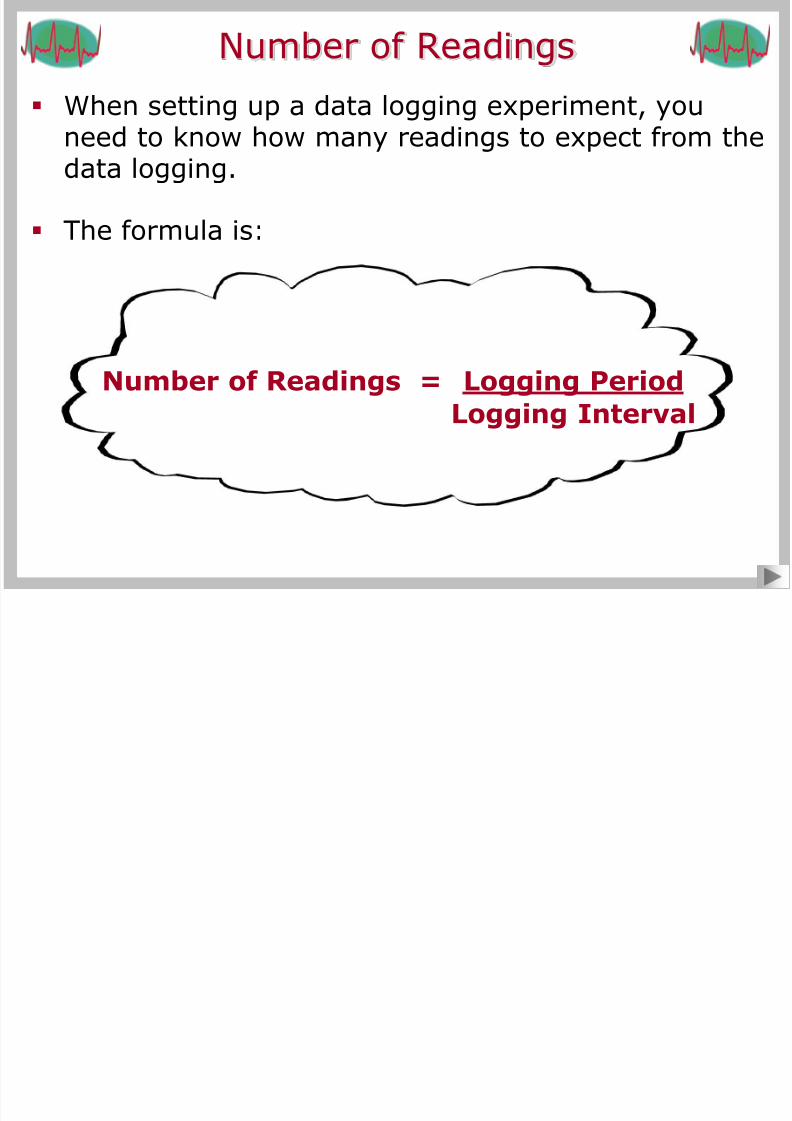
When setting up a data logging experiment, you
need to know how many readings to expect from thedata logging.
The formula is:
Number of Readings = Logging Period
Logging Interval
Number of Readings
8/12/2019 8.Data Logging
http://slidepdf.com/reader/full/8data-logging 12/21
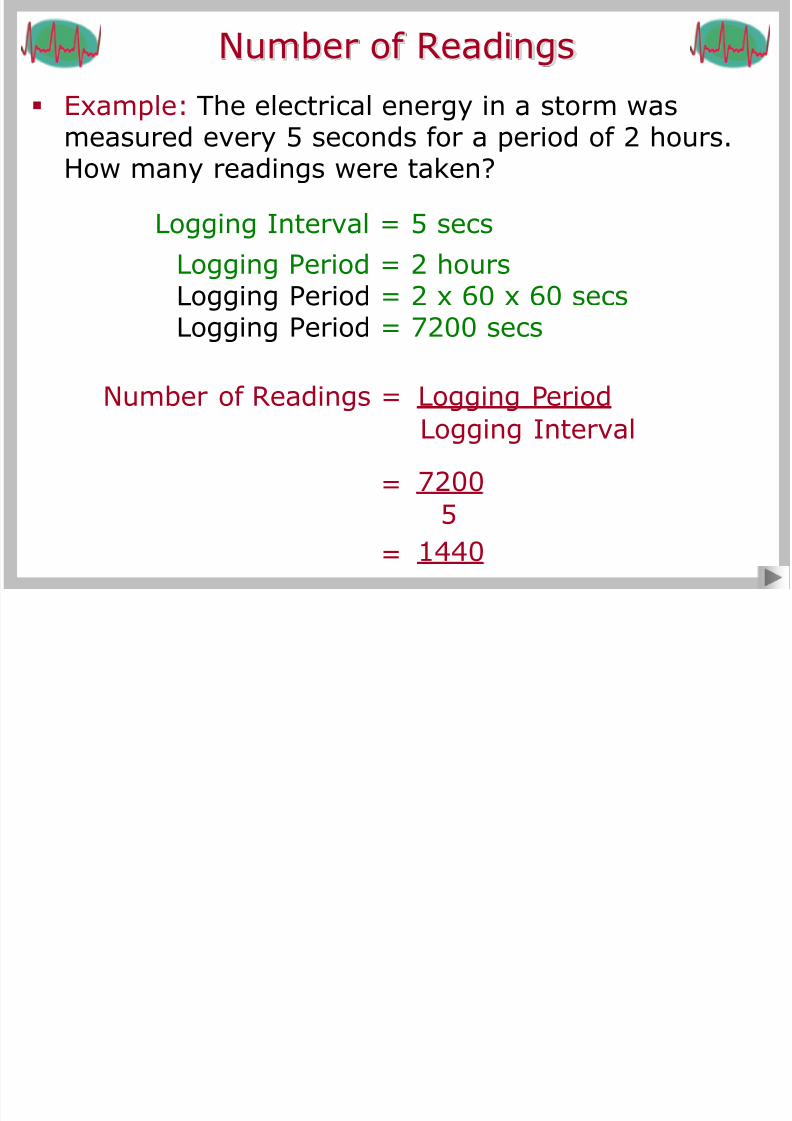
Example: The electrical energy in a storm was
measured every 5 seconds for a period of 2 hours.How many readings were taken?
Number of Readings = Logging Period
Logging Interval
7200
5=
Logging Period = 2 hoursLogging Period = 2 x 60 x 60 secsLogging Period = 7200 secs
1440=
Logging Interval = 5 secs
Number of Readings
8/12/2019 8.Data Logging
http://slidepdf.com/reader/full/8data-logging 13/21
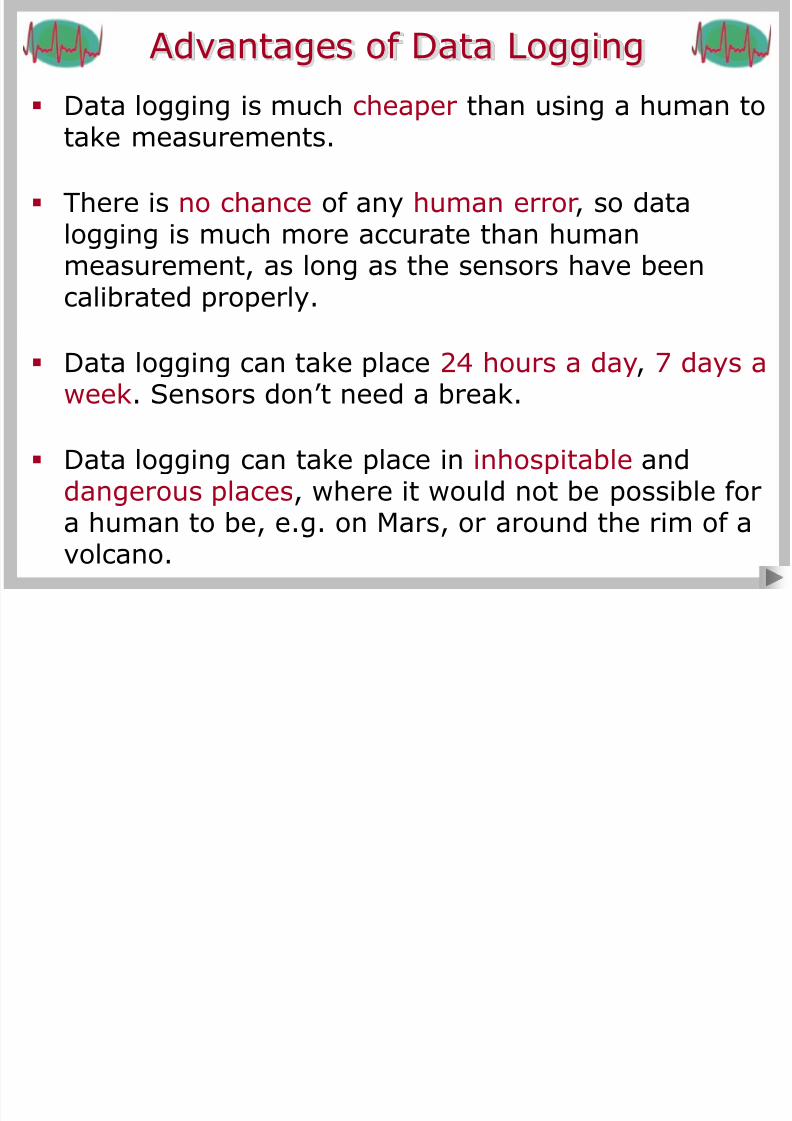
Data logging is much cheaper than using a human to
take measurements.
Advantages of Data Logging
There is no chance of any human error, so datalogging is much more accurate than human
measurement, as long as the sensors have beencalibrated properly.
Data logging can take place 24 hours a day, 7 days aweek. Sensors don’t need a break.
Data logging can take place in inhospitable anddangerous places, where it would not be possible fora human to be, e.g. on Mars, or around the rim of a
volcano.
8/12/2019 8.Data Logging
http://slidepdf.com/reader/full/8data-logging 14/21
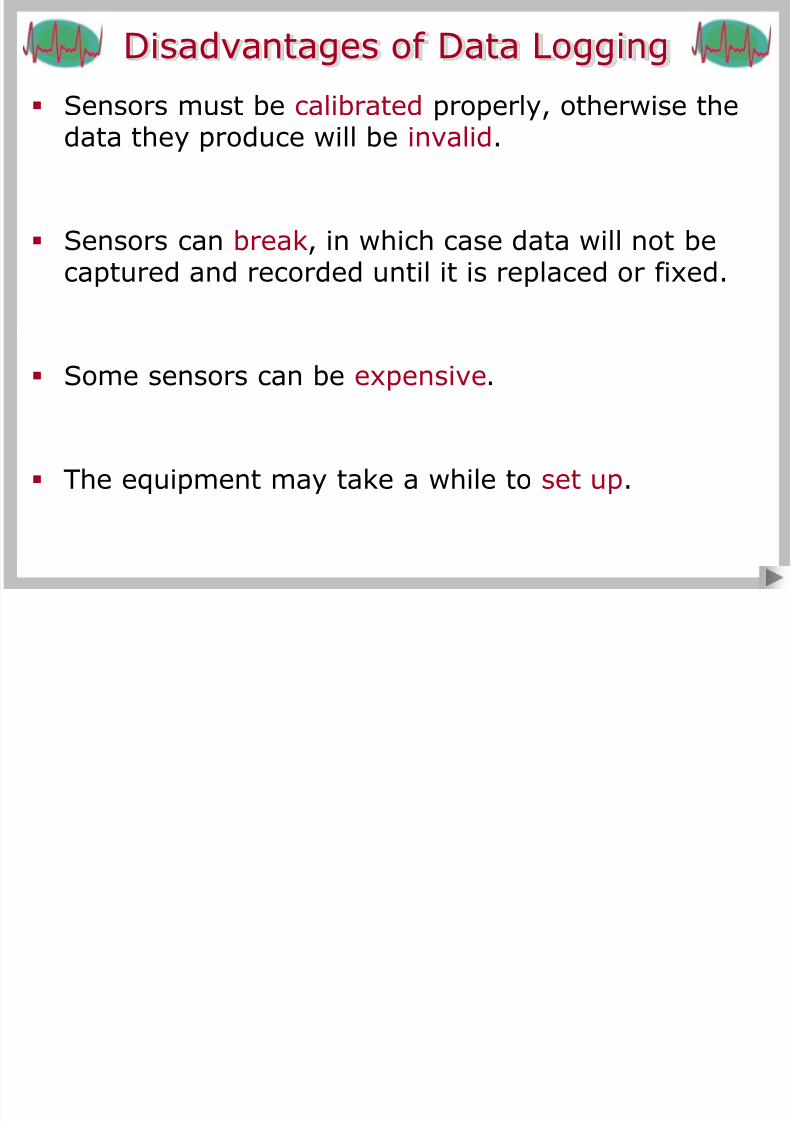
Sensors can break, in which case data will not be
captured and recorded until it is replaced or fixed.
Disadvantages of Data Logging
Some sensors can be expensive.
The equipment may take a while to set up.
Sensors must be calibrated properly, otherwise the
data they produce will be invalid.
8/12/2019 8.Data Logging
http://slidepdf.com/reader/full/8data-logging 15/21
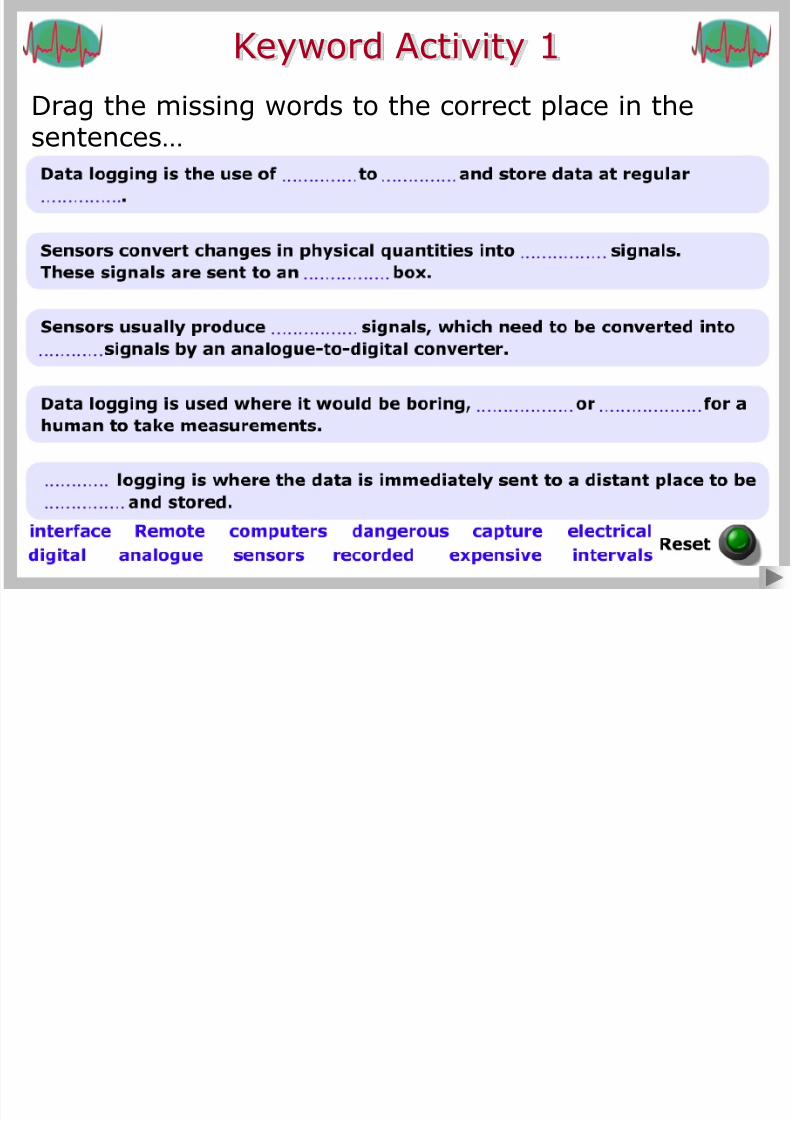
Keyword Activity 1
Drag the missing words to the correct place in the
sentences…
8/12/2019 8.Data Logging
http://slidepdf.com/reader/full/8data-logging 16/21
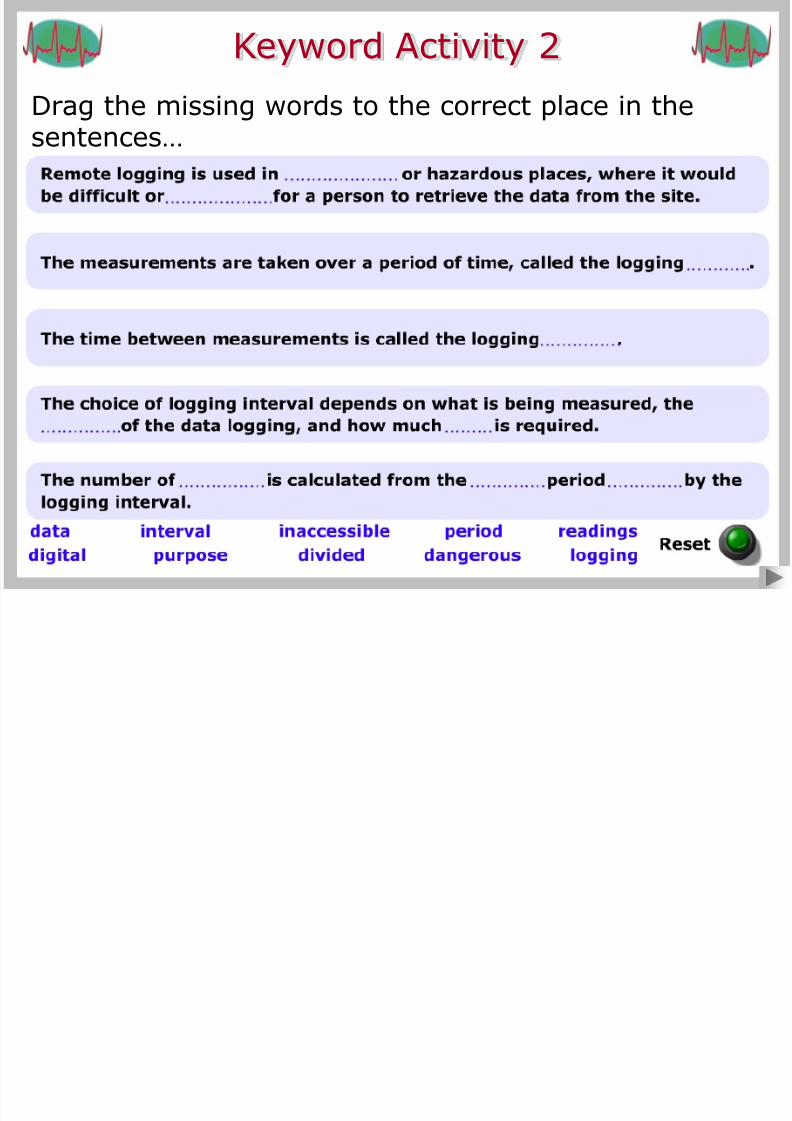
Keyword Activity 2
Drag the missing words to the correct place in the
sentences…
8/12/2019 8.Data Logging
http://slidepdf.com/reader/full/8data-logging 17/21
Wordsearch
8/12/2019 8.Data Logging
http://slidepdf.com/reader/full/8data-logging 18/21
Crossword
8/12/2019 8.Data Logging
http://slidepdf.com/reader/full/8data-logging 19/21
Quiz
8/12/2019 8.Data Logging
http://slidepdf.com/reader/full/8data-logging 20/21
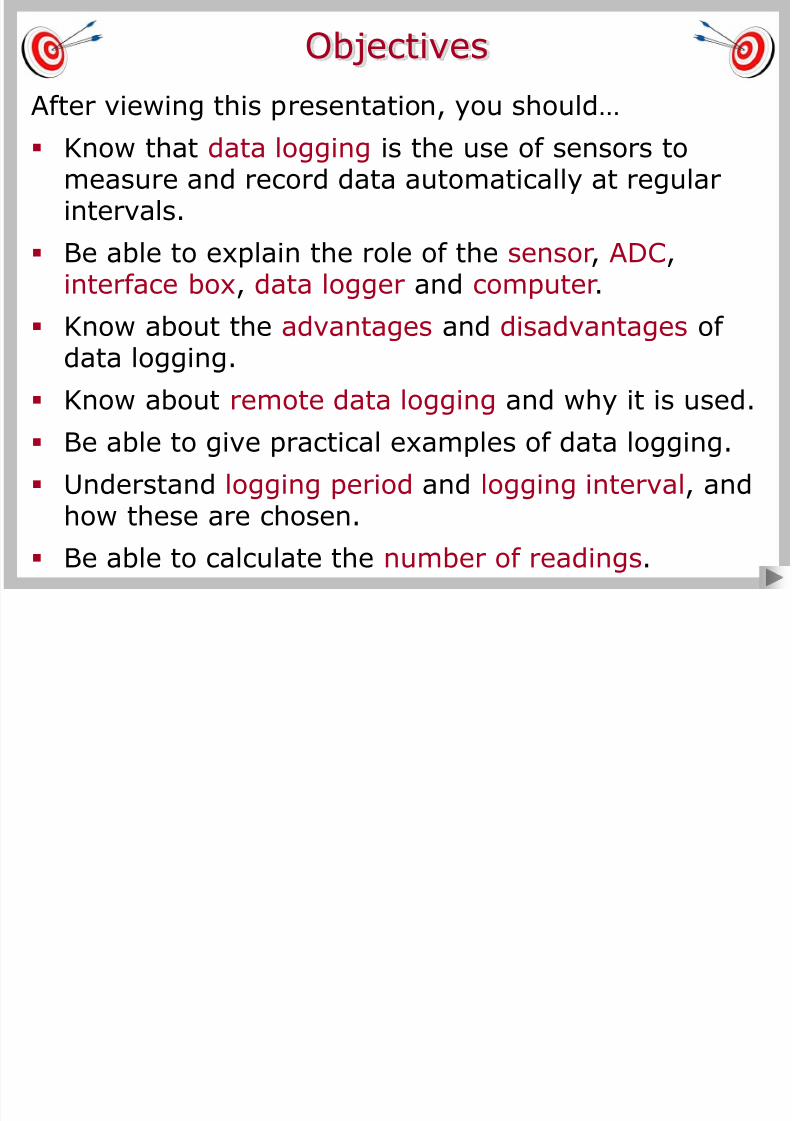
After viewing this presentation, you should…
Know that data logging is the use of sensors tomeasure and record data automatically at regularintervals.
Be able to give practical examples of data logging.
Know about the advantages and disadvantages ofdata logging.
Understand logging period and logging interval, andhow these are chosen.
Know about remote data logging and why it is used.
Objectives
Be able to calculate the number of readings.
Be able to explain the role of the sensor, ADC,
interface box, data logger and computer.
8/12/2019 8.Data Logging
http://slidepdf.com/reader/full/8data-logging 21/21
End of Show
All images are for viewing purposes only.
Copyright 2008 © Smart Presentations Ltd.and its licensors. All rights reserved.