9 15am rodney lester
TRANSCRIPT
Insurance Development and Investment in Emerging Markets
Rodney Lester, World Bank Group Consultant
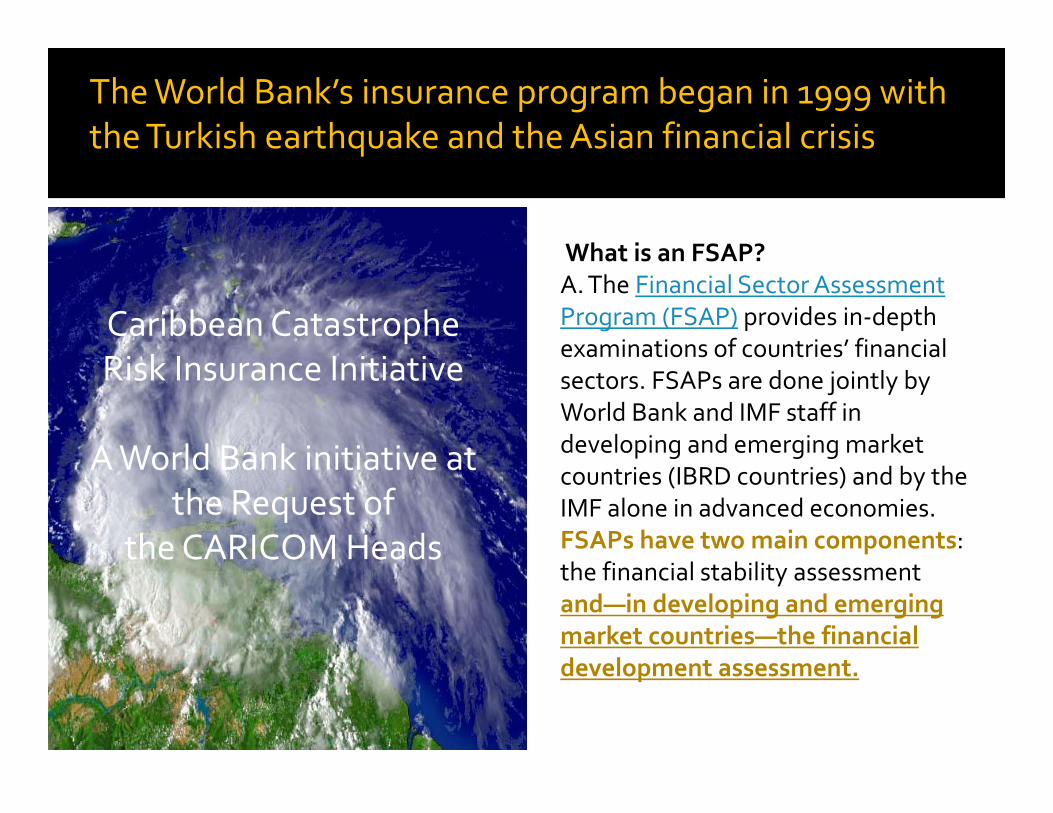
Caribbean Catastrophe Risk Insurance Initiative
A World Bank initiative at the Request of
the CARICOM Heads
What is an FSAP?A. The Financial Sector Assessment Program (FSAP) provides in‐depth examinations of countries’ financial sectors. FSAPs are done jointly by World Bank and IMF staff in developing and emerging market countries (IBRD countries) and by the IMF alone in advanced economies. FSAPs have two main components: the financial stability assessment and—in developing and emerging market countries—the financial development assessment.
The World Bank’s insurance program began in 1999 with the Turkish earthquake and the Asian financial crisis
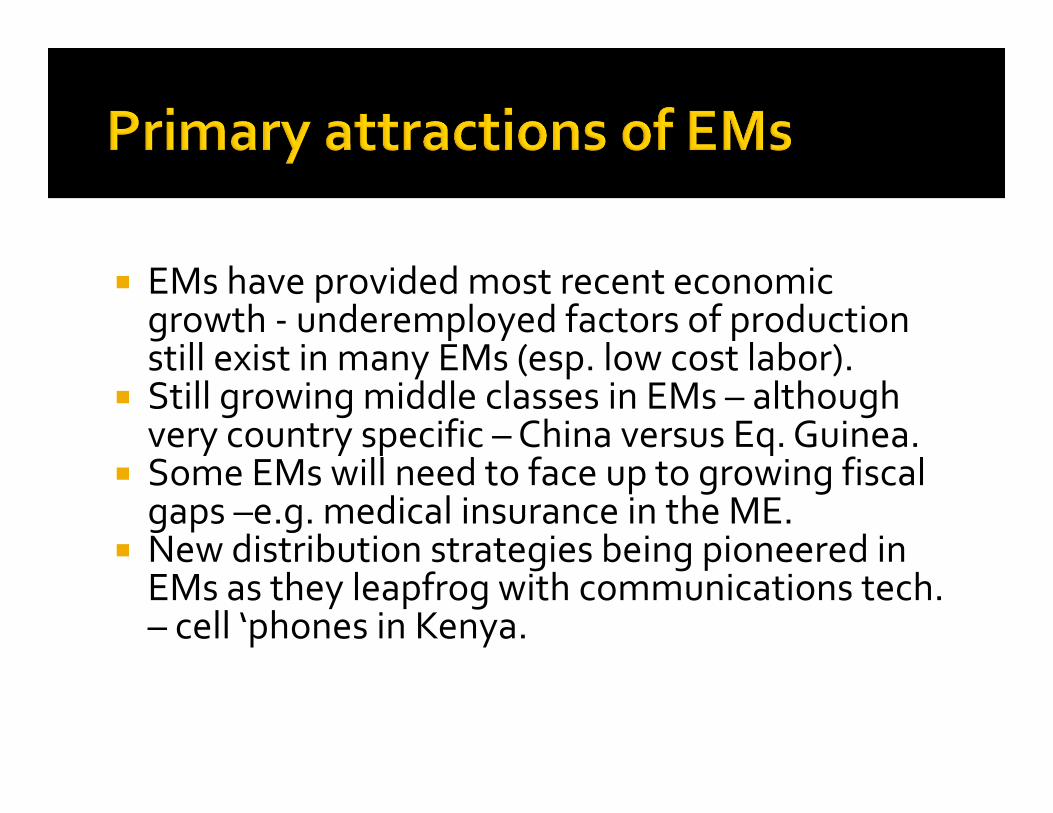
EMs have provided most recent economic growth ‐ underemployed factors of production still exist in many EMs (esp. low cost labor).
Still growing middle classes in EMs – although very country specific –China versus Eq. Guinea.
Some EMs will need to face up to growing fiscal gaps –e.g. medical insurance in the ME.
New distribution strategies being pioneered in EMs as they leapfrog with communications tech. – cell ‘phones in Kenya.
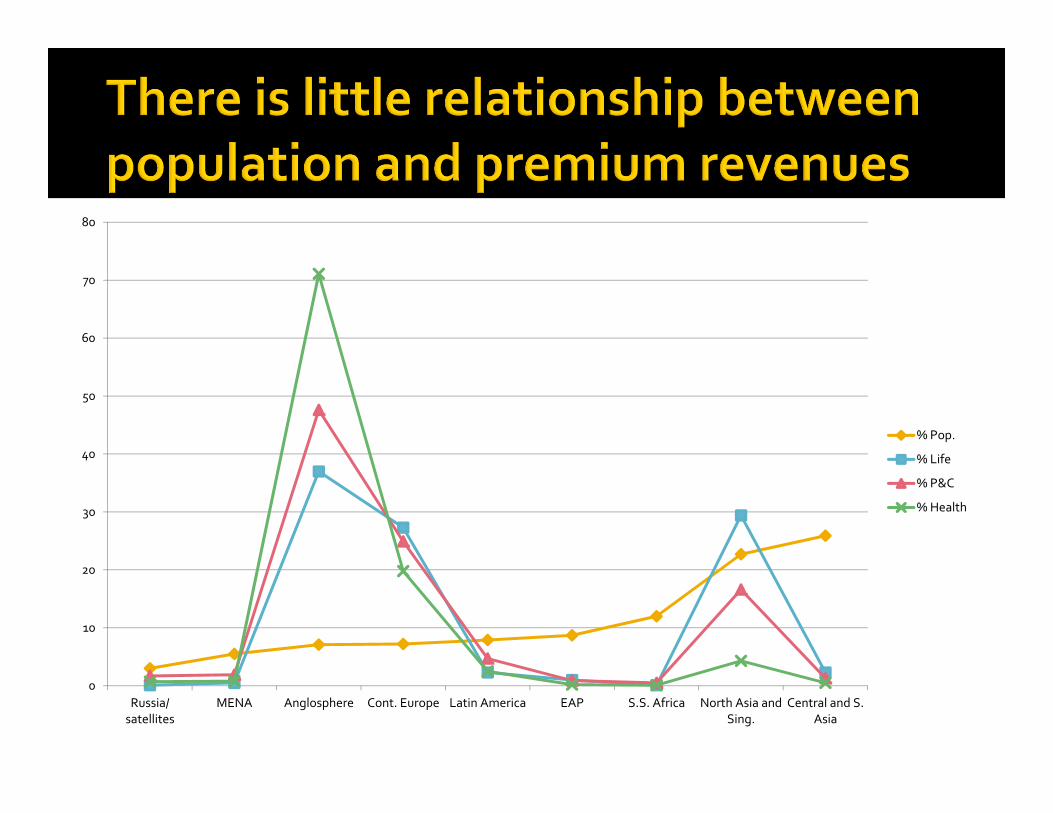
0
10
20
30
40
50
60
70
80
Russia/satellites
MENA Anglosphere Cont. Europe Latin America EAP S.S. Africa North Asia andSing.
Central and S.Asia
% Pop.
% Life
% P&C
% Health
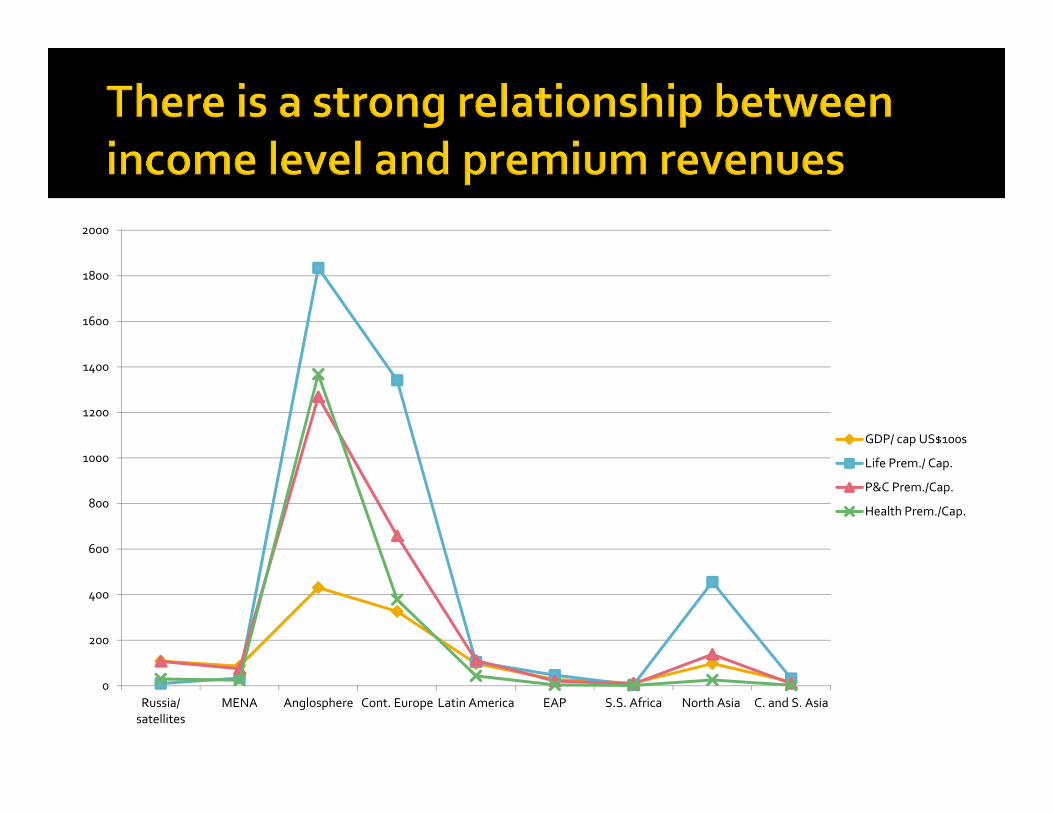
0
200
400
600
800
1000
1200
1400
1600
1800
2000
Russia/satellites
MENA Anglosphere Cont. Europe Latin America EAP S.S. Africa North Asia C. and S. Asia
GDP/ cap US$100s
Life Prem./ Cap.
P&C Prem./Cap.
Health Prem./Cap.
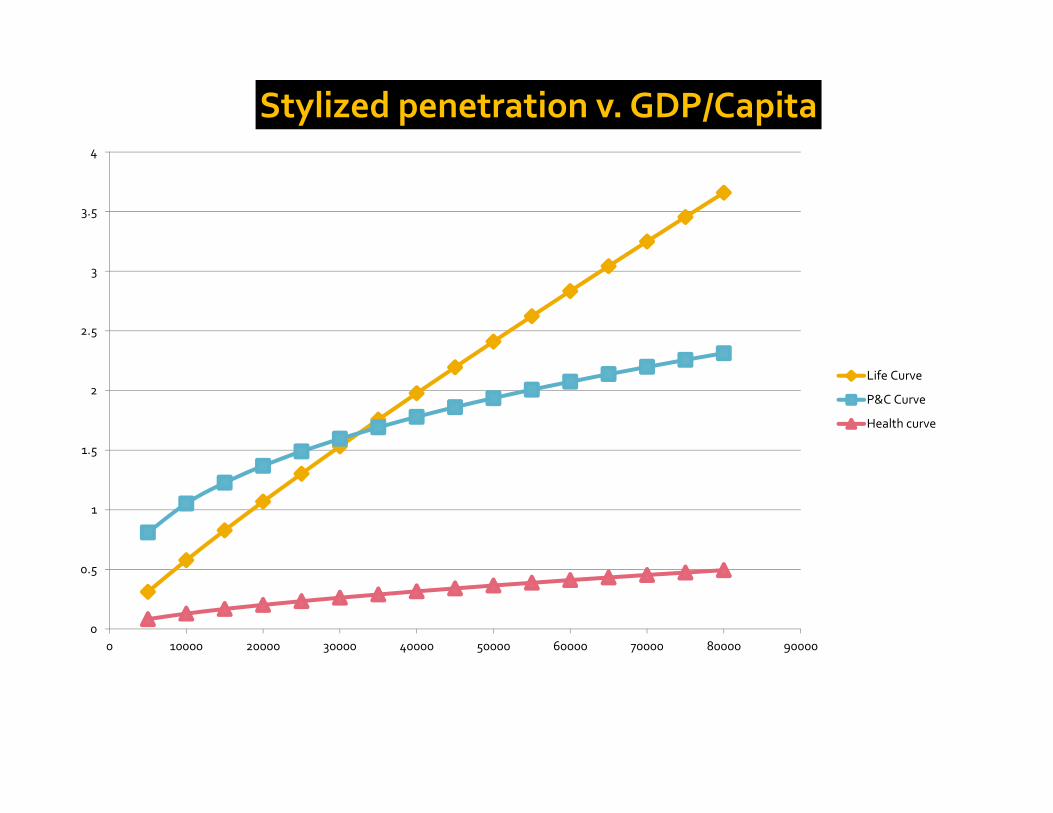
0
0.5
1
1.5
2
2.5
3
3.5
4
0 10000 20000 30000 40000 50000 60000 70000 80000 90000
Stylized penetration v. GDP/Capita
Life Curve
P&C Curve
Health curve
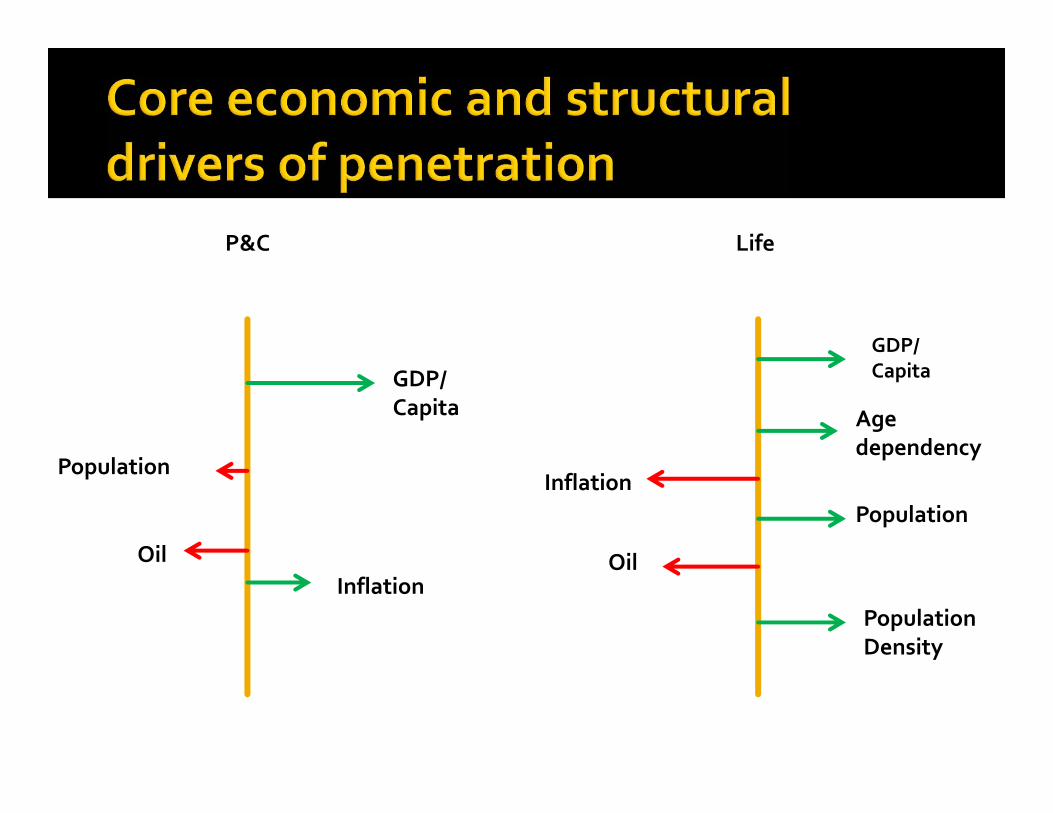
P&C Life
GDP/ Capita
Population
Population Density
Inflation
GDP/ Capita
Inflation
Population
OilOil
Age dependency
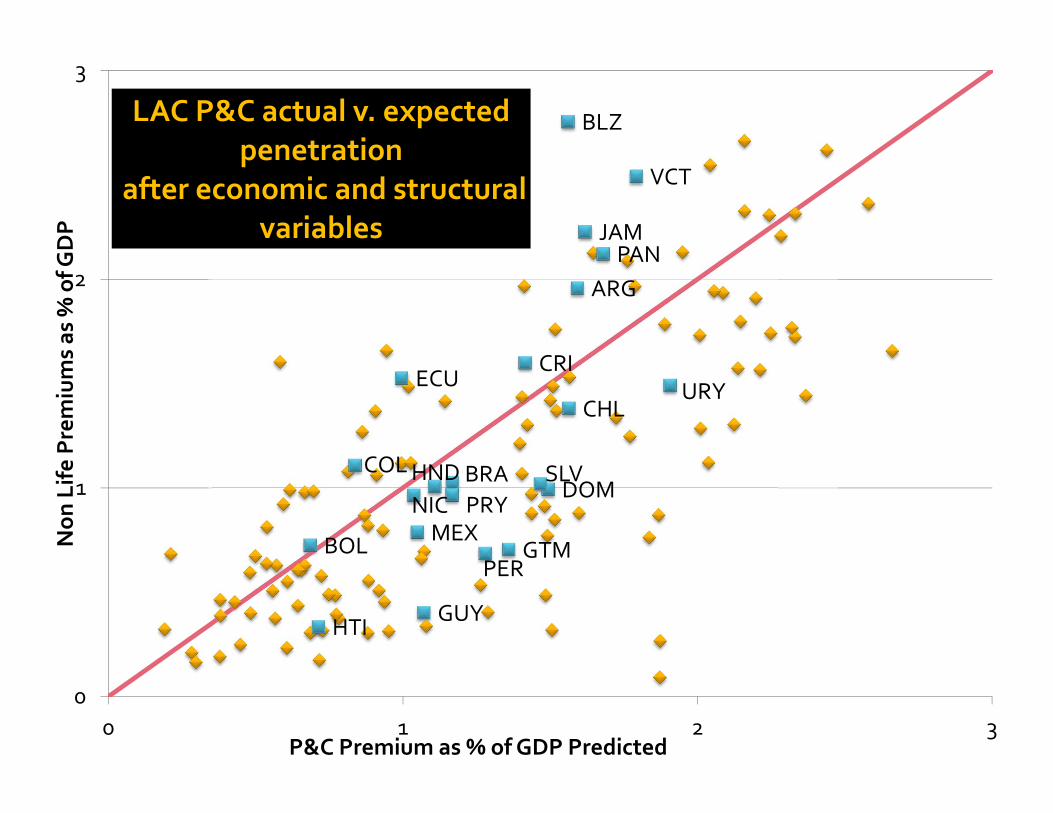
MEX
PANARG
BRA
CRI
VCT
DOMCOL
JAM
BLZ
PER
ECU
SLV
GTM
PRYHNDNIC
GUY
BOL
HTI
CHLURY
0
1
2
3
0 1 2 3
Non Life Premiums as % of G
DP
LAC P&C actual v. expected penetration
after economic and structural variables
P&C Premium as % of GDP Predicted
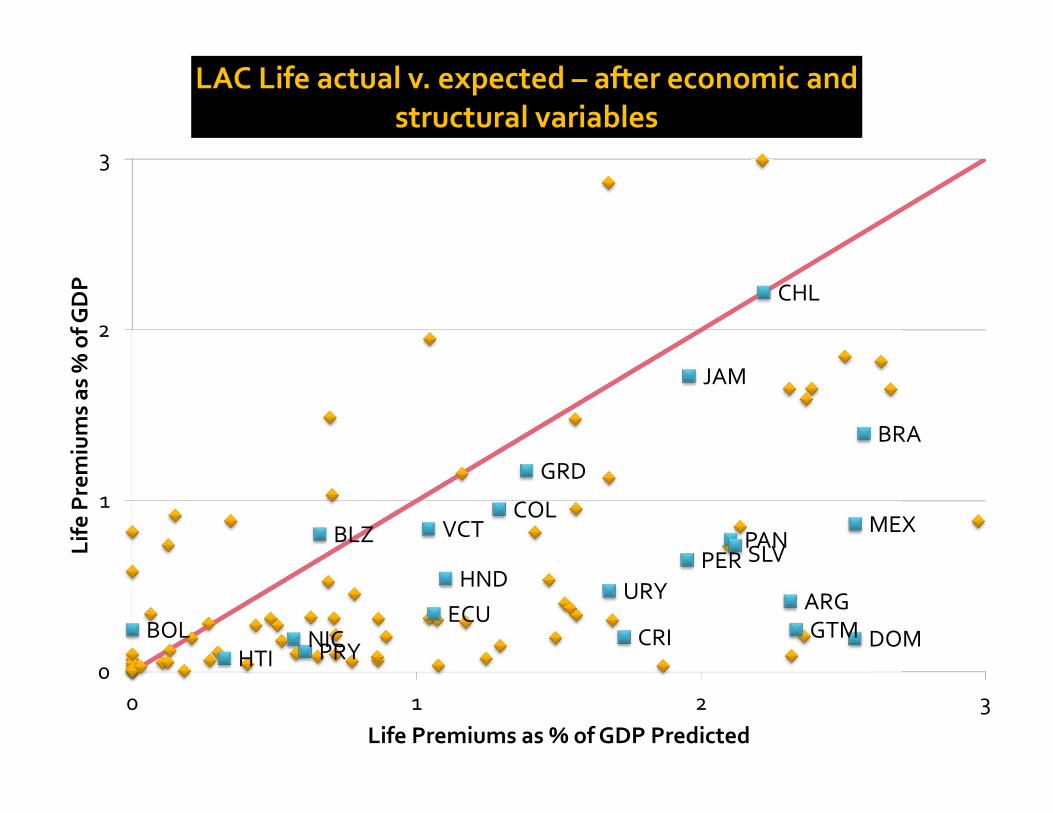
MEXPAN
ARG
GRD
BRA
CRI
VCT
DOM
COL
JAM
BLZPER
ECU
SLV
GTMPRY
HND
NICBOLHTI
CHL
URY
0
1
2
3
0 1 2 3
Life Premiums as % of G
DP
Life Premiums as % of GDP Predicted
LAC Life actual v. expected – after economic and structural variables
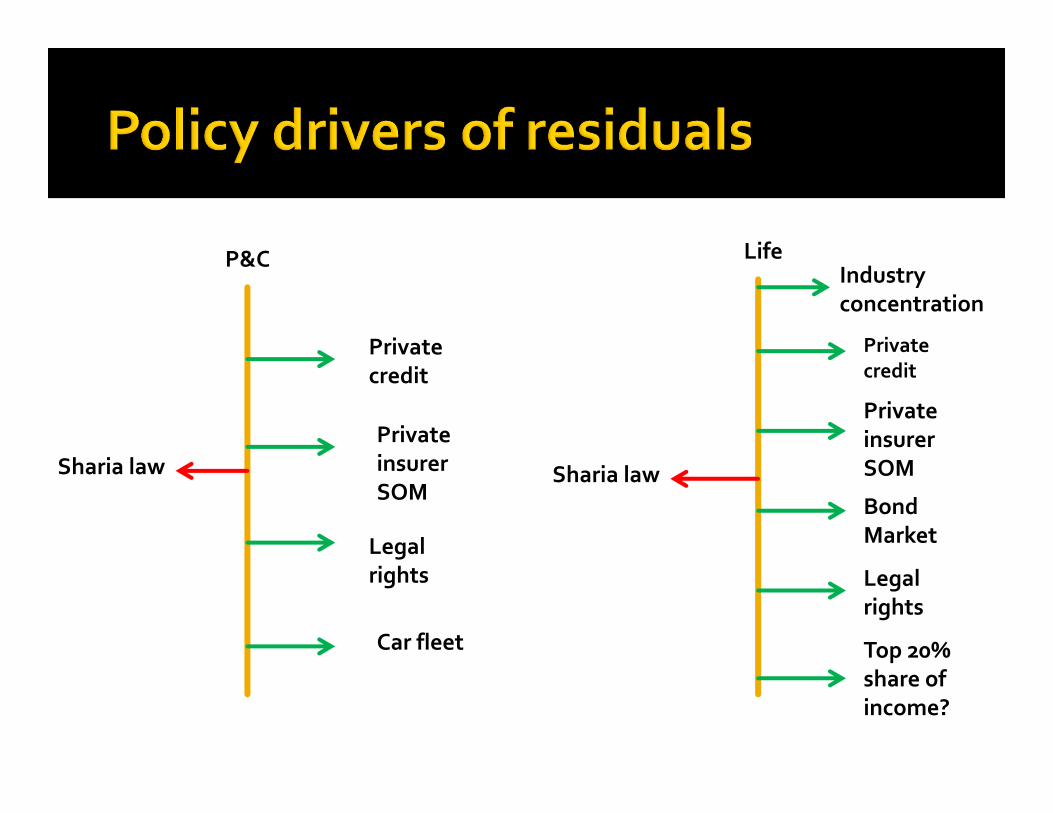
P&C Life
Private credit
Private insurer SOM
Top 20% share of income?
Sharia law
Private credit
Legal rights
Sharia lawPrivate insurer SOM
Car fleet
Bond Market
Legal rights
Industry concentration
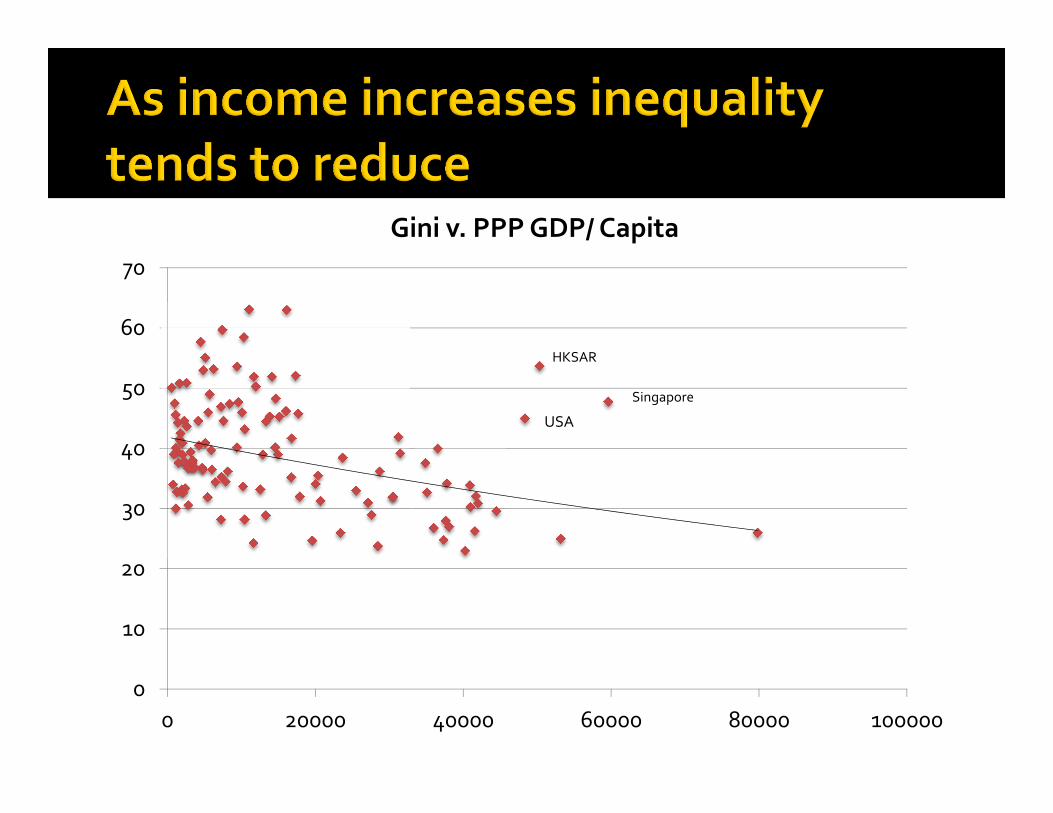
0
10
20
30
40
50
60
70
0 20000 40000 60000 80000 100000
Gini v. PPP GDP/ Capita
HKSAR
Singapore
USA
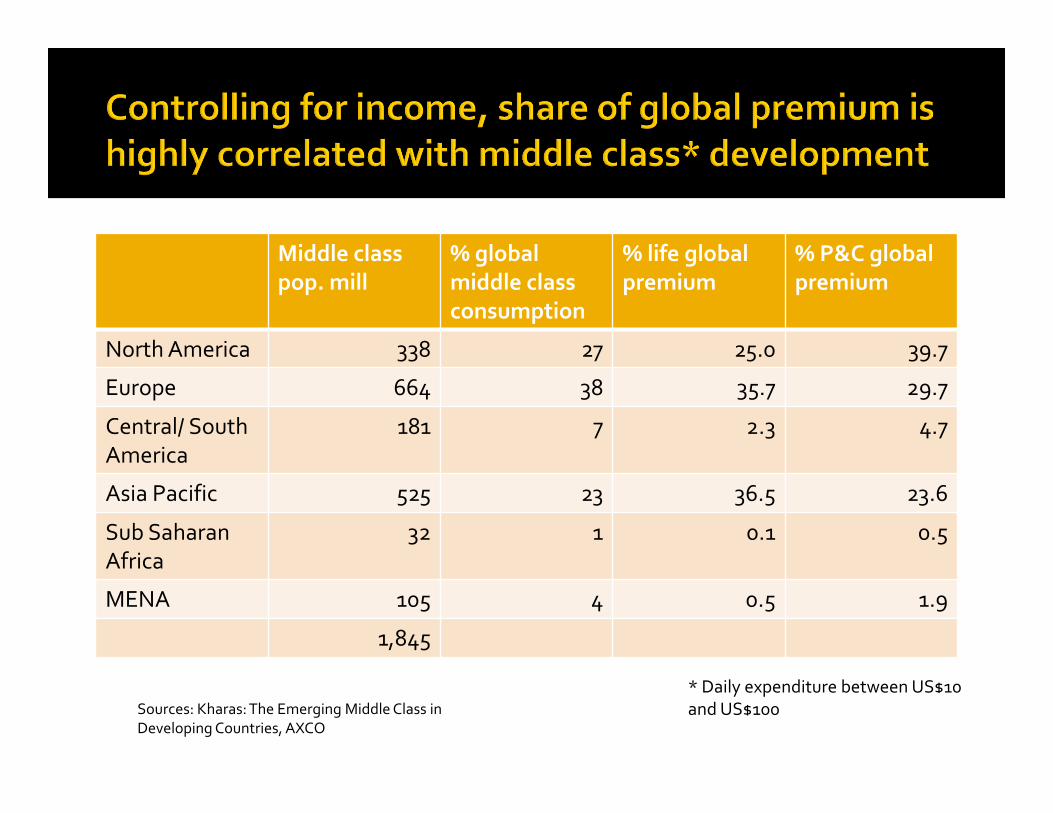
Middle class pop. mill
% global middle class consumption
% life global premium
% P&C global premium
North America 338 27 25.0 39.7
Europe 664 38 35.7 29.7
Central/ South America
181 7 2.3 4.7
Asia Pacific 525 23 36.5 23.6
Sub Saharan Africa
32 1 0.1 0.5
MENA 105 4 0.5 1.9
1,845
Sources: Kharas: The Emerging Middle Class in Developing Countries, AXCO
* Daily expenditure between US$10 and US$100
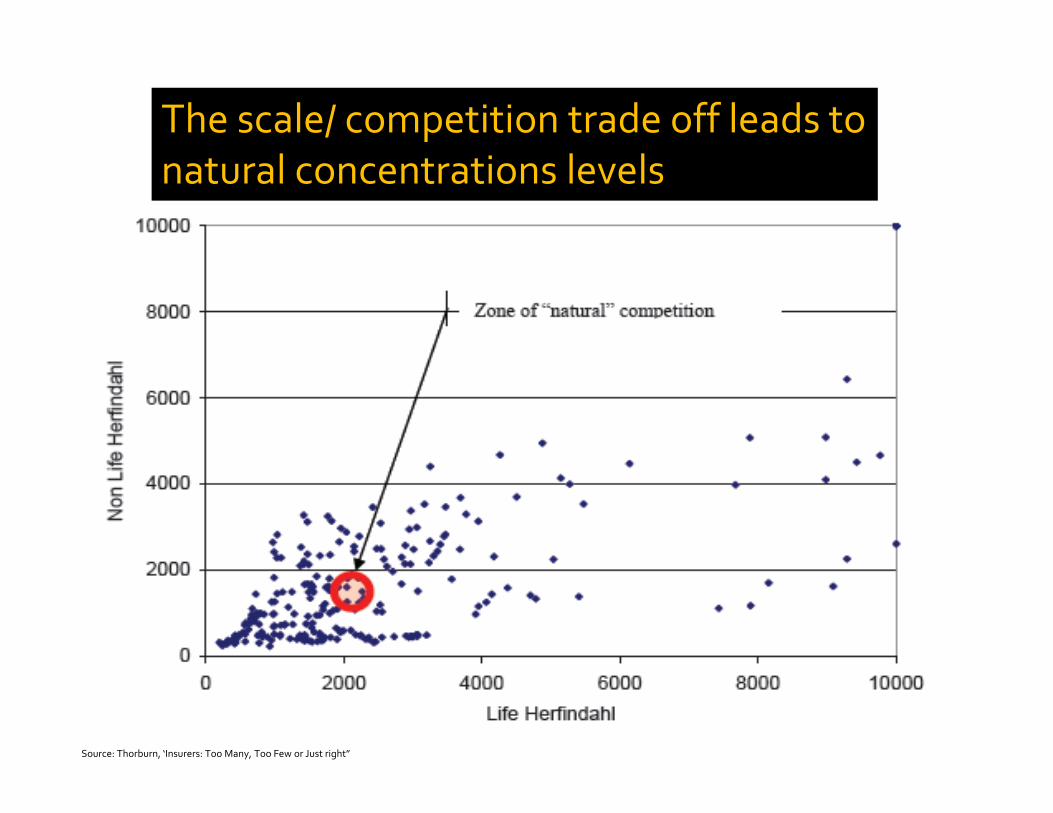
The scale/ competition trade off leads to natural concentrations levels
Source: Thorburn, ‘Insurers: Too Many, Too Few or Just right”
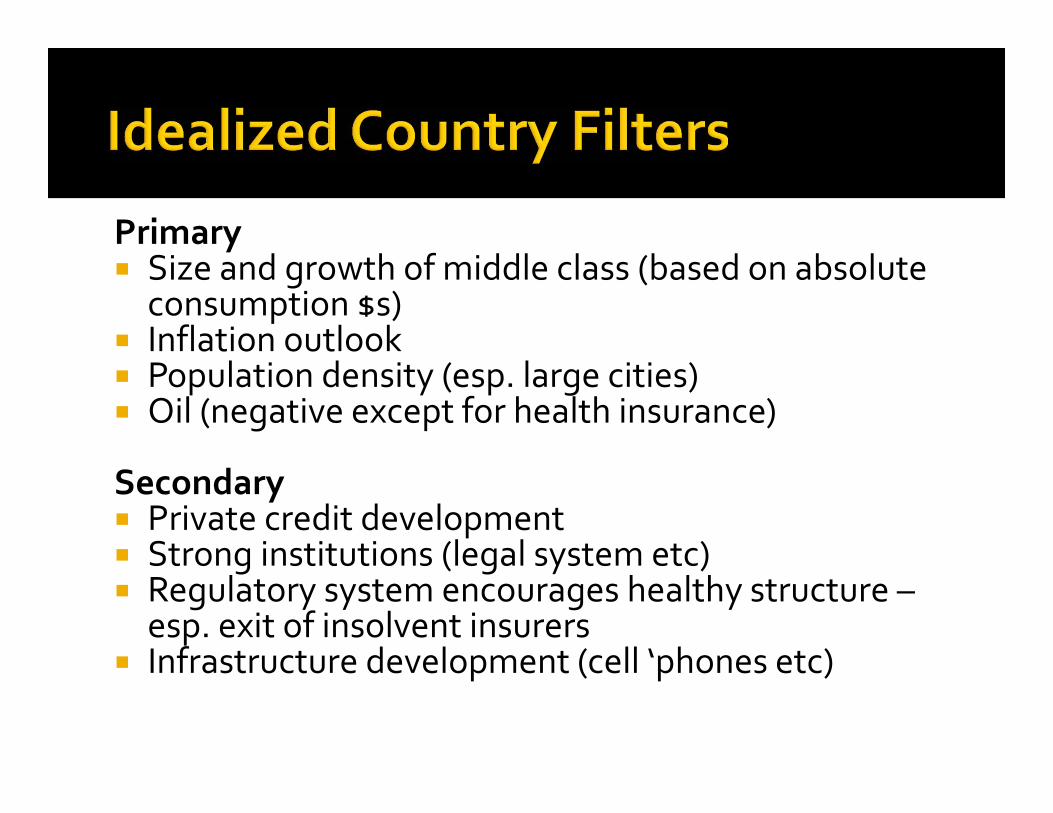
Primary Size and growth of middle class (based on absolute consumption $s)
Inflation outlook Population density (esp. large cities) Oil (negative except for health insurance)
Secondary Private credit development Strong institutions (legal system etc) Regulatory system encourages healthy structure –esp. exit of insolvent insurers
Infrastructure development (cell ‘phones etc)
0.00
0.20
0.40
0.60
0.80
1.00
1.20
0.00 0.20 0.40 0.60 0.80 1.00 1.20
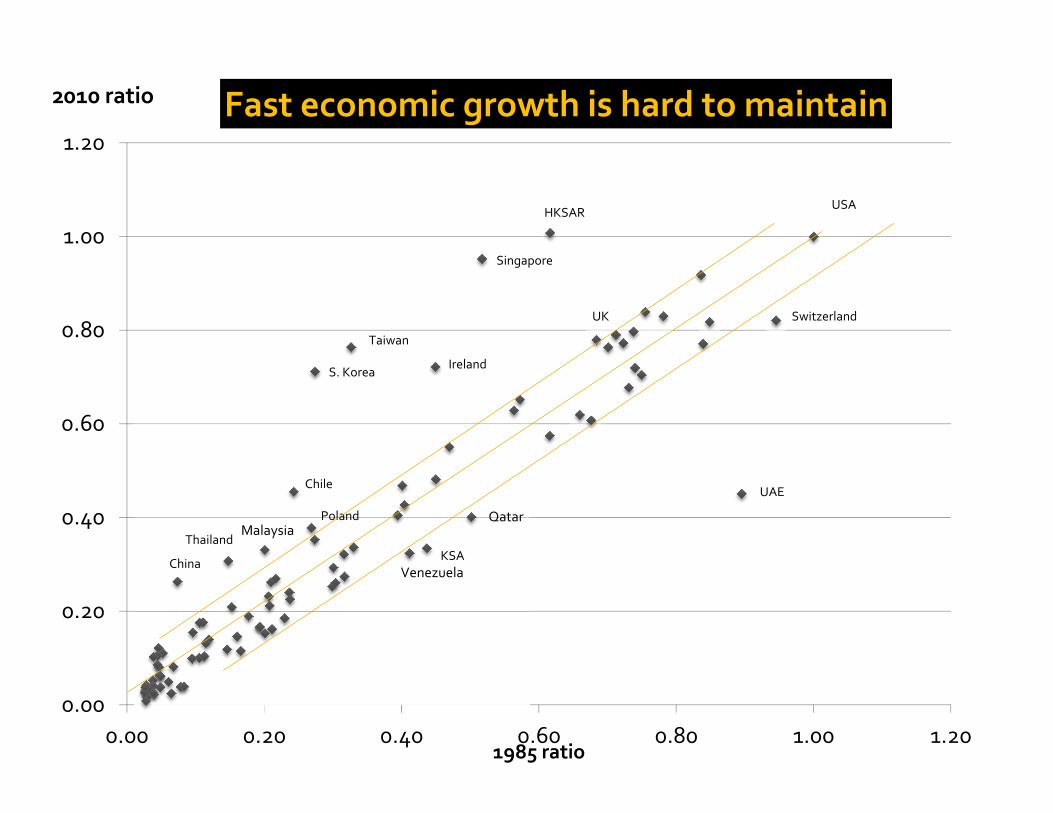
2010 ratio
1985 ratio
Fast economic growth is hard to maintain
HKSAR
UAE
MalaysiaQatar
VenezuelaChina
USA
Taiwan
S. Korea
Singapore
Chile
Ireland
Thailand
Switzerland
KSA
Poland
UK
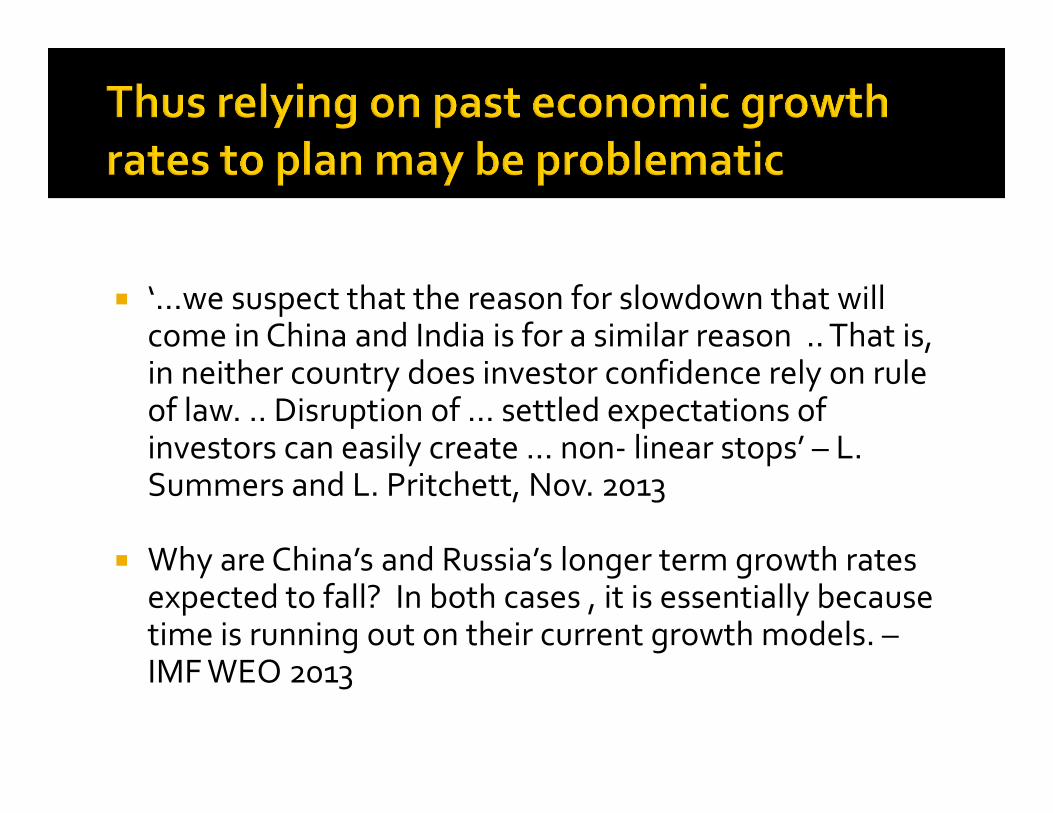
‘…we suspect that the reason for slowdown that will come in China and India is for a similar reason .. That is, in neither country does investor confidence rely on rule of law. .. Disruption of … settled expectations of investors can easily create … non‐ linear stops’ – L. Summers and L. Pritchett, Nov. 2013
Why are China’s and Russia’s longer term growth rates expected to fall? In both cases , it is essentially because time is running out on their current growth models. –IMF WEO 2013
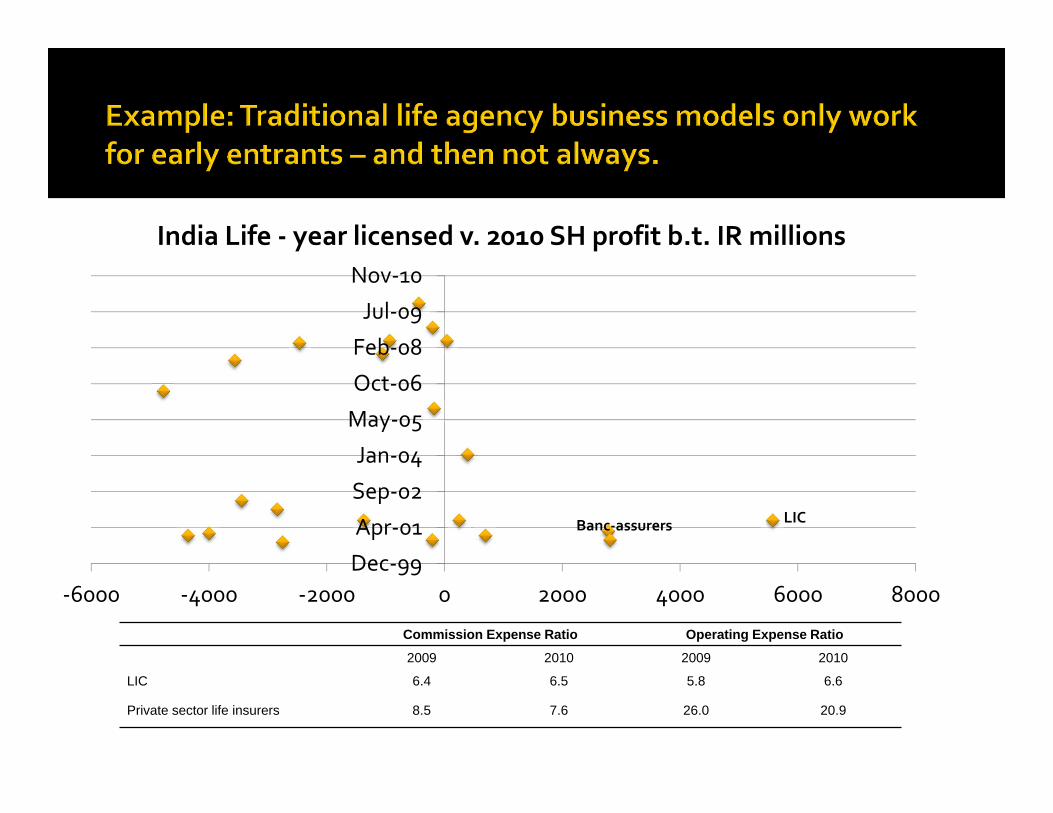
Commission Expense Ratio Operating Expense Ratio
2009 2010 2009 2010
LIC 6.4 6.5 5.8 6.6
Private sector life insurers 8.5 7.6 26.0 20.9
Dec‐99
Apr‐01
Sep‐02
Jan‐04
May‐05
Oct‐06
Feb‐08
Jul‐09
Nov‐10
‐6000 ‐4000 ‐2000 0 2000 4000 6000 8000
India Life ‐ year licensed v. 2010 SH profit b.t. IR millions
Banc‐assurers LIC