9 estimates of wildland fire emissions - southern research · 9 estimates of wildland fire...
TRANSCRIPT
9 Estimates of Wildland Fire Emissions
Yongqiang Liu Center for Forest Disturbance Science, USDA Forest Service
320 Green St., Athens, GA 30602, USA Email: [email protected]
John J. Qu, Wanting Wang and Xianjun Hao Environmental Science and Technology Center, Department of Geography and
Geoinformation Science, College of Science, George Mason University, Fairfax, VA 22030, USA
Email: [email protected], [email protected], [email protected]
Abstract Wildland fire missions can significantly affect regional and global air quality, radiation, climate, and the carbon cycle. A fundamental and yet challenging prerequisite to understanding the environmental effects is to accurately estimate fire emissions. This chapter descnbes and analyzes fire emission calculations. Various techniques (field measurements, empirical relations, modeling, and remote sensing) to obtain fuel and fire properties are first reviewed. A calculation of fire emissions across the continental U.S. is then illustrated. In this calculation, an approach recently developed based on high-resolution fuel types from satellite remote sensing is used for fuel loading factors. The burning information is obtained from a historical fire dataset collected by multiple U.S. governmental agencies. The U.S. fire emissions show large spatial and temporal variability. Finally, uncertainties in fire emission estimates are examined by comparing with another method using the traditional AP-42 Table approach for fuel loading. Emissions with the satellite remote sensing approach are mostly reduced in the western U .S., but increased in the eastern coastal regions. A perspective on future fire emission research is given.
Keywords Wildland fire, emission calculation, emission factors, fuel loading, U.S. fire emission results and analyses
9.1 Introduction
\V"tldlfire is one of the major natural disasters in the United States that threaten human life and property. Millions of acres of forest and other ecosystems are

Remote Sensing and Modeling Applications to Wildland Fires
burned annually. In 2000, for example, more than 100 thousand fires consumed 8.4 million acres (3.4 million ha) (NIFC, 2002). Nearly 30 thousand people were involved in wildland fircfighting efforts, costing the federal agency fire suppression about S1.4 billion. Prescribed burning, on the other hand, is a forest management technique that temporarily reduces damage from wildfire by removing a portion of the accumulating dead fuels (such as duff and logs on the forest floor) and reducing the stature of the developing understory when burning conditions are not severe (Wade and Outcalt, 1999). These intentional fires also serve as a surrogate for the historical fires by recycling nutrients and restoring/sustaining ecosystem health. The areas burned by prescribed fires have the same order as those by wildfires (Stan turf et al., 2002).
Emissions from wildland fires can cause severe environmental consequences. Fires release large amount of particulate matter (PM) and ozone precursors. adversely affecting regional air quality (Sandberg et al., 1999; Riebau and Fox. 2001 ). PM and ozone, as well as some other trace gas emissions, are criteria air pollutants subject to the national ambient air quality standards (NAAQS) established by the U.S. Environmental Protection Agency (EPA, 2003a). EPA recently established air quality standards for PM25 (PM with a diameter of 2.5 f..lill or smaller) and revised standards for ground-level 0 3 and PM10 (PM with a diameter of 10 f..LID or smaller) as an effort to reduce regional haze and smog and to improve visibility. EPA also issued the interim air quality policy on wildland and prescribed fire (EPA, 1998) to protect public health and welfare by mitigating the impacts of air pollutant emissions from wildland fires on air quality.
Smoke particles are one of the atmospheric aerosol sources, which can affect g lobal and regional radiation (e.g., Penner et al., 1992). They can modify earth radiation balance by scattering and absorbing solar radiation (direct radiative forcing) (Charlson et al., 1992), and by changing droplet size and life time of clouds. which are one of the most important factors for atmospheric radiative transfers (indirect radiative forcing) (Twomey et al., 1984). The radiative forcing can further change regional climate, monsoon, and drought (Hansen et al., 1997; Ackerman et al., 2000; Menon et al., 2002; Koren ct at., 2004; Liu, 2005a and b).
Fires also affect the carbon cycles. Carbon emissions due to fire increase atmospheric C02 concentration. The perturbation of atmospheric chemistry induced by biomass buming is comparable in magnitude to the effect of fossil fuel burning (Lindesay et al., 1996). The 1997 Indonesia Fires emitted as much carbon into the atmosphere as Europe's annual carbon emissions from burning fossil fuel (Page et al., 2002). Thus, biomass burning is an important source for regional atmospheric carbon. On the other hand, fires affect the ecosystem uptake of atmospheric carbon. Biomass accumulates by consuming atmospheric carbon through photosynthetic reaction. The terrestrial ecosystem, therefore, acts as a sink of atmospheric carbon during this process. Fire disturbance will alter the magnitude of this sink.
A fundamental and yet challenging prerequisite to understanding the environmental efiects of smoke 1s to accurately estimate fire em_issions. Fire emissions can be
118

9 Estimates of Wildland Fire E missions
calculated using fire and fuel properties such as area burned, fuel loading or consumption factors, and emission factors. Various techniques for calculating these properties have been developed. This C hapter describes calculation and analysis of fire emissions. Fire emission calculation formula and techniques for obtaining fuel and fire properties arc reviewed in Section 9.2. A calculation of fire emission m the continental U.S. is presented in Section 9.3. Uncertainty in fire emission c~timates is discussed in Section 9.4. Summary and a perspective on future fire emisston research are given in Section 9.5.
9.2 Fire Emission Calculation
As indicated in the following formula (Seiler and Crutzen, I980),
E=AfLS (9.1)
fire emission E (in mass) is determined by four fuel and fire properties: area burned A, consumption efficiency f (fraction of fuel consumed), fuel loading L (mass of forest fuel per unit area), and emission factorS (mass of the species per unit mass of forest fuel consumed). The product off and Lis also called effective fuel consumption or fuel loading factor (mass of forest fuel per unit area burned). These properties can be obtained using the techniques briefly described below.
9.2.1 Measurements
Burned area bas been traditionally obtained from ground measurement and reporting S):-tems. There are a number of regional and national datasets available, in the fonnat of either individual burnings or total burnings of a county or state. The examples are the nation-wide prcscnoed fires in 1989 (Peterson and Ward, 1993; Ward et al., 1993), wildfires over II Western states (Hardy et al., 1998), the data used for developing the EPA the national emission inventory (NEI) for three base years of 1996, 1999, and 2002 (EPA, 2003a), and the federal fire historic dataset (BLM, 2003). The dataset developed by the department of interior bureau of land management (BLM) collects individual fires over the lands owned by five U.S. federal agencies (BLM, Bureau of Indian Affairs, Fish and Wildlife Service, National Park Service. and USDA Forest Service). Besides area burned, this dataset also includes flre information on number. date, location. type, and causes. Figure 9.1 'hows wildfire burned areas in each of the contiguous U.S. states.
9.2.2 Empirical relations
Empirical relations have been used extensively to obtain fire emission factors and
119

Remote Sensing and Modeling Applications to Wildland F ires
~ .... ........ ~ <J
"' ~ "" ~ < "0 .., E :> co
500
400
300
200
100 I I •
0 -··· II I ... I • ~Q$<-0~~""'~""\p'.$?~Sc..~""&o-'<-.<..+~.,:"..?·.:rt>""-.."4"~~"~v .... ""~'~~~o~ .• :~.i'J?<:.""o~~""C~~~-'l:-$
L..J L..J '----' I L.J L______J L- -.1 l
N RM SW IM PSPN S SE NC NE
Figure 9.1 Annual burned area by wildfires in the contiguous U.S. states during 1980 - 2002. The horizontal line represents the average over all states. Below the state names are forest service regions (see Fig. 9.2) (redrawn from Fig. I in Liu, 2004)
fuel consumption factors. EPA ( 1995) has formed a table of default values (AP-42 Table) for emiss ion factors of major species. Emission factors in Table 9.1 are adopted from the AP-42 Table for all spec ies except C02 , which is derived based on the flaming fire emission factor (Battye and Battye, 2002, Table 39) and Hao et aL (2002). The emission factors are geographically independent. Fuel loading factors for the USDA forest service regions (Fig. 9.2) from the AP-42 Table are listed in Table 9.2.
Table 9.1 Emission factor (lbs/ton)
Component co NO_.. voc Factor 11.7 13.0 140.0 0.15 4.0 19.2 3,500.0
Figure 9.2 The USDA forest service regions (old division)
120

9 Estimates of W ild land Fire E m issions
An effort was recently made to improve the traditionally used AP-42 fuel loading factors. The Western regional air partnership (WRAP, 2002) developed an approach to estimate fuel loading and consumption using the national fire danger rating system (""FDRS) (Cohen and Deeming, 1985) vegetation types for the WRAP states. Thts approach was extended by EPA (2003b) to the reminder of the contiguous U.S. using the 1999 NFDRS fuel classification map at I km resolution derived !Tom a combination of satellite and ground data (Burgen et al., 1998). The state accumulated values from the RS approach are also listed in Table 9.2.
Table 9.2 Fuel loading factor L (ton/acre)
Remote sensing AP-42 R e m ote sen sing
AP-42 approach approach
State L Region .
L State L Region L
MT 4.7 TN 4 .3 N 60
ND 0.5 NC 9.6
WY 5.0 KY 3.3
co 12.6 VA 7.7
so 1.3 RM 30 MN 13.6
'IE 1.1 IA 2.8
KS 1.0 WI 7.4
·\Z 17.7 IL 3.1 sw 10 NC I I
~M 14.1 MI 10.1
ID 8.1 IN 2.4
NV 3.0 1M 8 OH 3.0
UT 9.6 MO 2.7
CA 15.5 PS 18 wv 4.8
WA 2.6 PN
MD 60
5.4
OR 12.5 PA 3.3
OK 2.7 DE 7.7
TX 3.5 NY 20.3 s 9 AR I 0.1 NJ 11.6
NE 11 LA 9.1 CT 3.1
MS 9.7 RJ 3.1
AL 10.1 MA 24.0
GA 13.2 SE 9 VT 51.3
FL 19.7 NH 33.4
sc 9.6 ME 27.8
·Sec Fig. 9.2 for vanous regions
121

Remote Sensing and Modeling Applications to Wildland Fires
9 .2.3 Modeling
Numerous fuel models have been developed. Fuel types in NFDRS are represented by 20 fuel models, each of which falls into one of four groups that account for fuels composed mainly of grass, shrub, timber, or slash. In consume, a comprehensive fuel model (Ottrnar et al., 1993), separate algorithms are used to calculate consumption of different fuels based on fuel loading, slope, wind, and fuel moisture. In the FCCS (Sandberg et at., 2001 ), live and dead fuel loadings for 16 types of fuels across 6 layers, from canopy to duff, for 150 fuelbed types defined for the continental U.S. arc quanti ficd. The system calculates available fuel potential index between 0- 9 for each FCCS National or customized fuelbed and provides available consumption of fuels. The fire emissions production simulator (FEPS) is developed to calculate fuel consumption efficiency (PNW, 2005). The FEPS model is run for each oftbe NFDRS fuel models and for each of the six fuel moisture classes in the model. For each of these combinations the model is used to estimate a unique fuel consumption.
Fire emissions can be simulated using modeling tools such as emission production model (EPM) (Sandberg et al., 1984), first order fire effects model (FOFEM} (Reinhardt et al., 1997). and community smoke emissions modeling (CSEM) (Barna and Fox. 2003). In the recently upgraded version of EPM, FEPS (Anderson et al .. 2004), fuel loading, fuel moisture, meteorological conditions, and other parameters are used to obtain hourly fire emissions as well fuel consumption, heat release and plume rise. CSEM, specifically designed to provide historical fire emission estimates for use in air quality models, uses consume and EPM and national GIS coverage for developing a fire inventory, locations, time and size.
A comprehensive modeling tool, BlueSky (O'Neill et al.. 2003). was developed as a framework for fire emission and air quality effect simulation and prediction. Regional forecast of smoke concentrations is made using bum information from state and federal agency bun1 reporting systems, and meteorology, fuel consumption, emission, and dispersion and trajectory models. The southern high-resolution modeling consortium southern smoke simulation system (SHRMC-4S) (Acbtemeier et al., 2003) is similar to bluesky but more specifically for prescribed burning in tbe south. It uses the sparse matrix operator kernel emissions modeling system (SMOKE) (Houyoux et al., 2002) for processing emission data and providing initial and boundary chemical conditions, and the community multiscalc air quality (CMAQ) (Byun and Ching, 1999) model for chemical modeling. A unique feature witb SHRMC-4S is that it includes a dynamical model (daysmoke) (Achtemeier, 1998) to calcualte smoke plume rise. Figure 9.3 shows a simulation result ofSHRMC-4S.
9 .2.4 Remote Sensing
Satellite remote sensing (RS) has emerged as a useful technique for fire detection in the past decade. With the unique features of global coverage, high-resolution.
122

9 Estimates ofWildland Fire Emissions
21
19
17
15
13
~II ~
9
7
3
9 10 II
35
30
25
20
15
10
5
12 13 14 15 16 17 Local T1mc
Figure 9.3 Time-height section of PM2.s concentration (~g·m"3) from prescribed fire emissions in Florida simulated with SHRMC-4S. The horizontal and vertical coordinates represent hour (local time) and height in level (from Liu et al.. 2006)
and continuous operation, RS is able to obtain detailed information of fuel type and loading, fire occurrence, extent, structure, and temporal variation (Riebau and Qu, 2004; Qu et at., 2003 and 2005). Satellite instruments such as the advanced \l!ry high resolution radiometer (AVHRR) (Kaufman et aJ., 1990; Justice et at., 1996; Li ct al.. 1997; Burgan et at., 1998), the geostationary operational environmental satdlite (GOES) (Prins and Menzel. 1990), and the moderate resolution imaging spectroradiometer (MODIS) (Kaufman et al., 1998; Justice et al., 2002) have been applied to field experiments and routine monitoring of fuels and wildfires.
AVHRR has daily data over two decades. Algorithms for detecting active fires and mapping burned area (Fraser et al., 2000) have been developed and validated for the fires in North America (Li et al., 2003). With more spectral bands and higher ~patial resolution, MODIS measurements can be used to retrieve fire information more accurately (Kaufinan ct al., 2003). The MODIS rapid response system (MRRS) \\as recently developed to provide rapid access to MODIS data globally with mitial emphasis on 250m color composite imagery and active fire data. MODIS \\3S found to be able to detect small and cool fires in the South more robustly and accurately (Wang et at., 2005). The Hazard Mapping System (HMS) (NOAA, 2006) was developed to manually integrate data from various automated fire detection algorithms with GOES, AVHRR, MODIS and defense meteorological satellite program/operational linescan system (DMSP/OLS) images. It produces a quality controlled display of the locations of fires and significant smoke plumes detected by meteorological satellites for air quality forecast. Figure 9.4 shows an example ofMODIS detection ofwildland fires.
123

Remote Sensing and Modeling Applications to Wildland Fires
Figure 9.4 An example of True-color composite MODIS GeoTiff data (Bands I, 4 and 3) of the Flathead and Bitterroot Valleys in Montana. Image acquired August 19, 2003 (from Quayle et aL 2003)
ln spite of not being a parameter in the formula for fire emissions, fuel moisture is an important property for estimating fuel consumption and fire emissions. Forest fuel consists of hve and dead vegetation. Meteorological measurements are traditionally used to estimate fuel moisture. The NFDRS monitors fuel moisture of live vegetation for shrub ecosystem using the normalized d ifference vegetation index (NDVI) and calculates dead fuel moisture with air temperature, humidity. and cloudiness. The Canadian forest fire danger rating system (CFFDRS) calculates live and dead fuel moisture using various algorithms basically based on meteorological measurements. The limitations with the traditional technique include relatively small spatial resolution of observations, unavailability over part of forest regions, and uncertainties in the relationship between meteorological data and fuel moisture. RS technique has been demonstrated as an efficient means to supplement field measurements for monitoring live fuel moisture, especially in locations not readily accessible by forest rangers . In addition to covering extens ive regions, RS a lso provides values closely related to forest vegetation status such as NDVT and Surface Temperature. Thus, RS data can be directly used to estimate fuel moisture (Chuvieco ct al., 1999).
9.3 U.S. Fire Emissions
9.3.1 Parameter Specifications
This section describes a calculation of the U.S. fire emissions. The BLM fire dataset (BLM, 2003) is used. The data used are monthly total acres burned by wildfires
124

9 Estimates of Wildland Fire Emissions
for each of the 48 contiguous states during 1980- 2002. The areas burned by wildfires were about 41,000 acres per year averaged over the contiguous U.S. stales (Fig. 9.1). Large emissions occurred in the Western states. Idaho, California, Nevada, Oregon, Montana and Utah had burning areas over hundreds of thousands of acres. Florida was the only state in the East with the emission reaching the national average. A detailed description ofthe fire statistics is given in Liu (2004). Emission factors are adopted from Table 9.1. Fuel loading factors are adopted from the values for RS approach in Table 9.2.
9.3.2 Spatial Distribution
Figure 9.5 shows geographic distribution of PM2 .5 emissions from wildfires expressed as emission intensity (kg·k:.m-2
). Large emissions are found in the West.
40N
JON
120W
120W
I lOW
I lOW
IOOW {a)
IOOW (b)
90W 80W
90W 80W
40
35
30
25
20
15
10
40
35
30
25
20
15
10
Figure 9.5 Spatial distribution of annual wildfire emissions of PM25 (kg·km-2)
(a) and standard deviation (b)
125

Remote Sens ing and '\1odeling Applications to Wildland Fires
Two centers with a magnitude of over 40 kg·km 2 are located in Pacific South and Pacific North, respectively. Emissions gradually decrease to below 10 kg·km-2
cast of the Rocky Mountains. Emissions, however, have a center in Florida with a magnitude of about 35 kg·k:m-2
. Emissions decrease rapidly to less than 10 kg·km-~ in the surrounding states. Standard deviation of annual emission series has the same magnitude as the average in most states, indtcatmg large mter-annuaJ variabilit). As shown in Liu (2004), wildfire emissions are characterized by a number of strong emission events and a relatively quiet episode up to a decade long between two strong emission events.
9.3.3 Seasonal Distribution
Figure 9.6 shows total annual emissions of PM2.s of each state and each season. In the West. California, Idaho and Oregon have the emissio ns around 15,000 tons, a majority of w hich is during summer. In the East, Florida has the emissions over 5,000 tons. Different from the West, a substantial portion of wildfire emissions in Florida and many other southern states occurs during spring, w hen the weather is warming up but not very moist yet. The emissions of PM 10, VOC and NO.- are roughly com· parable to those of PM25, while the emissions of other components are significantly different. CO and C02 are about one and two orders larger, respectively, while SO:! is about two orders smaller. They reflect the differences in the AP-42 emission factors.
25.000
20.000
c g 15.000 c 0 ·~ e 10.000 "' ~ ;f c..
5.000
0
I 0 Winter • Spring 0 S ummer 0 Fall I I
r-
f-
I~ no I~ I~ n I I '-ITW' SO 1-;.S ~\t N\i CA OR TX LA A1. FL TN t.:Y '-IN \\1 Ml Oil\\\ PA NY CT MANH
ND CO i'F A7 10 l1T WA OK -.R '1.1S (;.-"\ SC NC \ -_ lA II IN \10 JI.ID l)l; -..:J Rl VT \<IE
Figure 9.6 Wildfire emissions ofPM2 s by stale and season
9.4 Uncertainties
Substantial differences in fire emissions are found between the RS and AP-42 Table approaches for fuel loading factors. In general, wildfire emissions from the
126

9 Estimates of Wildland Fire Emissions
RS approach are smaller in the west and larger in Florida than those from the .\P-42 Table approach. A quantitative comparison is shown in Fig. 9.7 using the ratio of the difference in emission between the RS and AP-42 Table approaches to em1ssion from the AP-42 Table approach. Remarkable changes ranging from
100%--450% are obtained. The changes display certain geographic patterns. The RS approach leads to overall reduced emissions in the regions from the Pacific coast to Midwest except Southwest. In contrast, overall increased emissiOns arc found in Southeast and Northeast. The largest increase of 200% or more is found in a number of New England states due to the extremely small
500
400
....... e 300
.. ~ a 200
.&:; u .. , ·;:; Cl u a:
·200L-------------------------------------------_J MT WY SO KS '"-1 '"-' CA OR TX LA AL FL N KY M"' WI Ml 011 WV PA "Y CT '1.11\ "'ll
200
150
~ 100 0
~
~ 50 c ..
.&:; u ~ 0 ·~
~-so
-100
ISO
NO C:O "" A7. ID UT WA 0... ARMS GA SC C VA lA IL 1"1 MO MD 01 NJ Rl VT MF (a)
-
-
n nJ ~n n n uu u I ill ·~ ~uu · ~ 1-
uu
-Mr WY Sl) "-S N'lll "'V Cl\ OR TX I.A 1\1 F1 INKY MN WI Ml 011 WV I'A NY (I Ml\ Ml NJ) CO NF A7 ID UT WAOK ARMS GA SC NC VA lA ll. IN MOMO OF NJ Rl VT MF
(b)
Figure 9.7 Ratio of the difference in fire emissions between RS technique and AP-42 Table to the emission estimated using AP-42 Table for wildfire (a) and prescribed fires (b)
127

Remote Sensing and Modeling Applications to \cVildland Fires
amounts of emission in these states. Among the states with large emissions, the most significant changes happens in Oregon and Florida, where emissions are reduced by about 80% and increased by about 160%, respectively. Changes in California and Idaho arc less than 20% in magnitude.
Besides wildfires, fuel loading factors for prescribed buming have also been developed using satellite remote sensed fuel types and loading and consumption of individual fuel types (EPA. 2003b). In Florida, a state with the most extensive prescribed burning in the nation, for example, fuel loading factor is increased from 9 ton/acre in the AP-42 Table to 19.7 ton/acre estimated by the RS approach for wildtrre, comparing from 7.1- 17.2 ton/acre for prescribed burning.
Most fir~:: emission inventories, including fire emissions in the EPA NEls, have been developed using the AP-42 Table default fuel loading factors. The remarkable changes in the magnitude of trre emissions between this approach and RS approach, including in some states with large fire emissions such as Oregon and Florida, suggest a large uncertainty in estimating fire emissions in these inventories. The result that the fire emissions are reduced in most Westerns states and increased in most Eastern states with RS approach than the AP-42 approach would lead to a reduced geographic contrast between the two regions. EspeciaUy. it suggests larger importance of prescribed burning for air quality and other smoke-related environmental issues in the Southeast, which is a major region of such burning.
The changes in fire emission estimates can have some important implications for the environmental effects of wildland fires. A recent modeling study using CMAQ model (Byun and Ching, 1999) with fire emissions estimated using the AP-42 Table fuel loading factors indicated significant impacts of Florida prescribed burning on regional air quality (Liu ct al., 2004). The impacts could more serious considering that emissions are about 1.6 times larger if using the RS approach. In addition. a simulation study with a regional climate model indicated the role of wildfires in enhancing drought with emissions estimated using the AP-42 Table fuel loading factors (Liu, 2005b). A better w1derstanding of the role could be achieved by using the RS approach for fuel loading factors.
9.5 Summary and Perspective
Fire emissions arc determined by area burned, consumption efficiency, fuel loading. and emission factor. The ground measurement and recording systems have been traditionally used to obtain burned area and fuel loading information. Satellite RS. a new technique developed rapidly in the past decade, is able to provide highresolution fire and fuel properties. Actual fuel consumption and fire emissions can be determined using modeling and empirical relations.
The U.S. fire emissions estimated using the fuel loading factors recently developed
128
9 Estimates of Wildland Fire Emissions
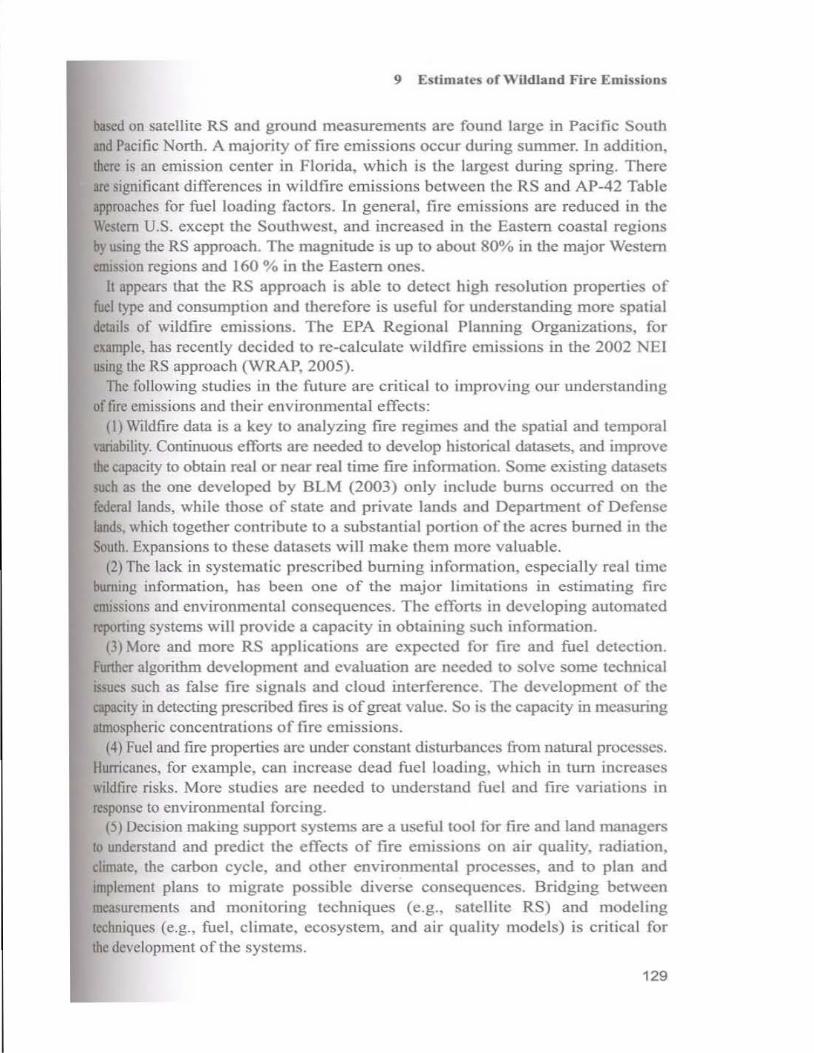
ba~cd on satellite RS and ground measurements arc found large in Pacific South nnd Pacific North. A majority of fire emissions occur during summer. In addition, there ts an emission center in Florida, which is the largest during spring. There are significant differences in wildfire emissions between the RS and AP-42 Table approaches for fuel loading factors. ln general, fire emissions are reduced in the Western U.S. except the Southwest, and increased in the Eastern coastal regions by using the RS approach. The magnitude is up to about 80% in the major Western enusston regions and 160 % in the Eastern ones.
It appears that the RS approach is able to detect high resolution properties of fuel type and consumption and therefore is useful for understanding more spatial detat s of \vildftre emissions. The EPA Regional Planning Organizations, for example, has recently decided to re-calculate wildfire emissions in the 2002 NEI using the RS approach (WRAP, 2005).
The following studies in the future are critical to improving our understanding of fire emissions and their environmental effects:
(I) Wildfire data is a key to analyzing fire regimes and the spatial and temporal \'ariability. Continuous efforts are needed to develop historical datasets, and improve the capacity to obtain real or near real time fire information. Some existing datasets such as the one developed by BLM (2003) only include burns occurred on the federal lands, while those of state and private lands and Department of Defense lands. which together contribute to a substantial portion of the acres burned in the South. Expansions to these datasets will make them more valuable.
(2) The lack in systematic prescribed burning information, especially real time burning information, has been one of the major limitations in estimating fire emissions and environmental consequences. The efforts in developing automated reponing systems will provide a capacity in obtaining such information.
(3) More and more RS applications are expected for fire and fuel detection. Further algorithm development and evaluation are needed to solve some technical 1\~ues such as false fire signals and cloud interference. The development of the capactty in detecting prescribed fires is of great value. So is the capacity in measuring atmospheric concentrations of fire emissions.
(4) Fuel and fire properties arc under constant disturbances from natural processes. Hurricanes, for example, can increase dead fuel loading, which in tum increases wtldlirc risks. More studies are needed to understand fuel and fire variations in rc~ponse to environmental forcing.
p) Decision making support systems are a useful tool for fire and land managers to understand and predict the effects of frre emissions on air quality, radiation, climate. the carbon cycle, and other environmental processes, and to plan and 1mplement plans to migrate possible diverse consequences. Bridging between measurements and monitoring techniques (e.g., satellite RS) and modeling tcchmques (e.g., fuel, climate, ecosystem, and air quality models) is critical for the development of the systems.
129

Re m ote Sensing and '\1od eling Applications to Wild la nd Fir es
Acknowledgements
This study was supported by the USDA Forest Service National Fire Plan (!\'FP) through the Southern High-Resolution Modeling Consortium (SHRMC), the USDA Forest Services Southern Research Station Award (No. SRS 04-CA-11330 136-170), and the US EPA STAR program.
References
Achtemeicr G L, ( 1998), Predicting dispersion and deposition of ash from burning cane. Sugar Cane. J 17 22
Achtcmcicr G, Goodrich S, Liu Y-Q, (2003), The Southern High Resolution Modeling Consortium-A source for research and operational collaboration. Proceedings of the 2nd lnt'l Wildland Fire Ecology and Fire Management Congress. Amer. Meteor. Soc. No\. I 6 20. 2003, Orlando. FL
Ackerman AS. Toon OB, Stevens DE, Heymsfield AJ, Ramanathan V. Welton EJ, (2000). Reduction oftrop1cal cloudiness by soot. Science, 288: 1042 1047
Anderson GK. Sandberg DV, Norheim RA. (2004). Fire Emission Production Simulator (FEPS) User's Gu1de. USDA Forest Sen'ice. 99
Barna \.1G. Fox DG. (2003). Combining wildfire em1ssions from the Community Smoke Emissions \.1odel (CSEM) \\-;th a regional-scale air quality model. Proceedings of the 2na
lnt'l Wildland Fire Ecology and Fire Management Congress Amer Meteor. Soc. ·o, I 6 20. 2003. Orlando. FL
Battye W. Battye R. (2002). Development of emissions inventory methods for wildland fire (final report). Prepared for l.J.S. Environmental Protection Agency. Research Triangle Park. 'IC. USA
BLM (U.S. Bureau of Land Management), (2003). Federal Fire History Internet Map Service User Gu1dc
Burgan RE. llartford RA, ( 1997), Live vegetation moisture calculated from NDVI and used in fire danger rating. 13th Conf. on Fire and For. Met., Lome, Austra lia, Oct. 27-31, 1997. Jason Greenlee, ed. fA WF, Fairfield, W A 99012
Burgan RE. Klaver RW, Klaver JM. ( 1998). Fuel models and fire potential from satellite and surface observations. lnt 'I J. Wildland Fire, 8 : 159 - 170
Byun DW, Ching J, ( 1999), Science algorithms of the EPA Model-3 community mulliscale a1r quality (CMAQ) modeling system. RTP. NC: EPN600/R-99 030
Charlson RJ. Schwartz SE. Hales JM. Cess RD. Coakley JA Jr. Hansen JE. Hoffman OJ. ( 1992). Climate forcmg by anthropogenic sulfate aerosols. Science. 255. 423 - 430
Chuvieco E et at.. (I 999). Short-tenn fire risk: foliage moisture content estimation from satellite data. In: Remote Sensing of Large Wildfires in the European Mediterranean Basin. Chuv1eco E (ed) Springer. I 7-38
Cohen JD. Deemmg JE. (I 995). The National Fire-Danger Rating System: Baste equations USDA Forest Service, Report PSW-82
130

9 Estimates of Wildlan d Fire E m issions
f PA. (1995). Compilation of Aic Pollutant Emission Factors. AP-42, fifth Edition. I: Stationary
Point and Area Sources EPA, (1998), Interim Air Quality Policy on WildJand and Prescribed Fire. Office of Air
Quality Planning and Standards. Research Triangle Park, NC, USA
EPA. (2003a). Documentation for the Draft 1999 1\:arional Emissions Inventory (Version 3.0)
for Critena Air Pollutants and Ammonia (Area Sources) EPA, (2003b), Data Needs and Availability for Wildland Fire Em~ssion Inventories-Short-term
Improvements to the Wildland Fire Component of the National Emissions Inventory.
Prepared by EC/R Fraiser lUI, LiZ, Cihlar J, (2000), Hotspot and NDVI differencing synergy (HANDS): A new
technique for burned area mapping. Rem. Sens. Environ. 74: 362-376
Hansen J, Sato M, Ruedy R, ( 1997), Radiative forcing and chmate response. J. Geophys. Res.,
102: 683 1 - 6864 !lao WM. Ward DE. Babbitt RA, Susott RE, Baker SP, Ottmar R, Vihnanek RE. WadeD, (2002).
Emissions of trace gases and aerosol particles from biomass fires in the southeastern and
central Umted States. USDA Forest Service 6 Hardy CC. Menakis JP, Long DG. Gamer JL, (1998), FMI/Westar Emissions Inventory and
Spatial Data for the Western United States. USDA Forest Service RMS Houyoux M, Vuko' ich J, Seppanen C, Brandmeycr JE, (2002). SMOKE User Manual. MCNC
Environmental Modeling Center Jusuce CO, Kendall JD, Dowty PR, Scholes RJ. (1996), Satellte remote sensing of fires during
the SAFARI campaign using NOAA Advanced Very High Resolution Radiometer data. J.
Geophy. Res 101(23): 851 -863 Justice CO, Giglio L, Korontzi S. Owens J , Morisette IT, Roy D, Descloitres J, Alleaume S,
Petitcolin F, Haufman Y, (2002), The MODIS fire products Rem Se11s. Environ. 83:
244 -262 Kaufinan YJ, ( 1990). Remote sensing ofbiomasss burning in the tropics. Journal ofGeophysical
Research, 95(D7): 9927-9939
Kaufman Y J, Justice C, ( 1998), MODIS fice Products, Algorithm Theoretical Background Documt:lll (ATBO) (http://eospso.gsfc.nasa.gov/atbd/ modistables.html)
Kaufman Y, lchoku C. Giglio L. Korontz:i S. Chu DA, Hao WM. Li R-R. Just ice CO. (2003),
Fires and smoke observed from the Earth Observing System MODIS instrument: products,
validation, and operational use. /111 '/ J. Remote Sensing, 24: 1765 - 1781
Koren 1. Kaufman YJ. Remer LA, Martins JV, (2004), Measurement of the effects of Amazon
smoke on inhibition of cloud formation. Science. 303: 1342 - 1345 L1 Z, Cihlar J, Moreau L. Huang F. Lee B, (1997). Monitoring fire activities in the boreal
ecosystem. J. Geophys. Res. 102: 2961 I -29624 LiZ. Fraser R, Jin J. Abuelgasim AA, Csiszar I, Gong P. PuR. I lao W, (2003), Evaluation of
algorithms for fore detection and mapping across North America from satellite. J. Geoph_1-s.
Res. 108(D2): 4076. 10-J02912001JD001377 Lmdcsay J. Andreae M. Goldammer J. Harris G, Annegarn H. Garstang M. Scholes R, Wilgen
B. (1996). lntemationaJ Geosphere-Biosphere Programme/International Global Atmospheric
Chemistry SAFARI-92 field experiment: Background and overview. J. Geophy. Res.
101(019): 23.521 -23.530
131

Remote Sensing a nd Modeling Applications to Wildland Fires
Liu Y -Q. (2004). Variability of wildland fire emissions across the continuous United States. Atmos Em•iron. 38: 3489 - 3499
Liu Y -Q. Achtemeier G. Goodrick S. (2004). Air quality effects of prescribed fires simulated with CMAQ The 2004 CMAQ Workshop. Chapel Hill. NC. 4
Liu Y -Q. (2005a), Atmospheric response and feedback to radiative forcing from biomass burning in tropical South America. Agri. Forest. lvfeteor. 133: 40 53
Liu Y -Q. (2005b). Enhancement of the 1988 Northern U.S. drought due to wildfires. Geopb}. Res. Ler. 32 (No. 10). L I 08061 0.1029/2005GL022411
Liu Y -Q. Achtemeicr G. Goodrick S. (2006), Simulation and Experiment of air quality effects of prescribed fires in the South. (to be submitted)
Menon S. Hansen JE, Nazarenko L, Luo Y, (2002), Climate efTecls of black carbon aerosols in China and India. Science. 297: 2250 - 2253
NIFC (National Interagency Fire Center) (2002) Wildland Fire Statistics, (2002). NOAA NESDIS (2006) Hazard Mapping System Fire and Smoke Product. (http://www.sS<lnoaa.govt PS/ FIRE/hms.html)
O'Neill SM. Ferguson SA, Peterson J. Wilson R. (2003). The B lueSky Smoke Modeling Framework. Proceedings of the 5th Symposium on Fire and Forest Meteorology, American Meteorological Society, Orlando. FL. November 2003
Ottmar RD. Bums MF. Hall JN. Hanson AD. ( 1993). Consume Users Guide. Version 1.00. Ge. Tech Rep .• PNW-GTR-304. Portland. OR. USDA Forest Service. PNRS. 118
Page SE et al.. (2002), The amount of carbon released from peat and forest fires in Indonesia durmg 1997. 1\farure, 420:61-65
Penner JE. Dickmson RE. O'Neill CS. (1992), Effects of aerosol from biomass burning on the global radiation budget. Science. 256: 1432 - 1434
Peterson JL. Ward DE. (1993), An Inventory of Particulate Mauer and Air Toxics from Prescribed Fires in the USA for 1989. lAG-OW 12934736-0 1-1989
PNW, (2005), Fire Emissions Production Simulator, www.fs.fed.us/pnw/fera/feps Prins EM. Menzel WP ( 1990) Geostationary satellite detection of biomass burning in South
America. Int. J. Rem. Sens. 13: 2783-2799 Quayle B. Lannom K. Finco M, Norton J, Warnick R, (2003), Monitoring wi ldland fire activity
on a national-scale with MODIS imagery. Proceedings of the 2nd Int'l Wildland Fire Ecology and Fire Management Congress. Amer. M eteor. Soc., Nov. 16 20,2003, Orlando, FL
Qu J, Hao X, Kafatos M, Liu Y, Ricbau A, (2003), Estimating Ecosystem System Cbanges
from Space using MODIS measurements. Proc. of IS PRS (CO-publication) Qu J, Hao XJ, Yang RX, Dasgupta S. Bhoi S. Wang WT. Xie Y, Wang LL, Li ZT, Wolf H.
Kafatos M, (2005), A System for Monitoring Fire Characteristics and Fire Danger Potential in the Eastern S tates Using Re mote Sensing Techniques. EastFire Conf. 2005. Fairfax. VA, May II - 13
Reinhardt ED. Keane RE. Brown JK. (I 997), First Order Fire Effects Model: FOFEM 4.0, Users Guide. USDA Forest Service General Technical Report fNT-GTR-344
Riebau AR, Fox 0, (200 I). The new smoke management. /111 'I J. Wildland Fire, 10: 415-4T
Riebau A. Qu JJ, (2004), Application of remote sensing and G IS for analysis of forest fire risk and assessment of forest degradations in the Southwest Pacific Region. Springer-Vergleg (in press)
132

9 Estimates of Wildland Fire E missions
Sandberg DV, Peterson J, ( 1984), A sow-ce-strength model for prescribed fires in coniferous logging slash. In: Proceedings, 21st Annual Meeting of the Air Pollution Control Association,
Pacific Northwest International Section. P ittsbw-gh, PA: Air Pollution Control Association
Sandberg DV. Hardy CC, Ottmar RD, Snell JAK. Acheson A, Peterson JL, Seamon P, Lahm P.
WadeD, {I 999), National strategy plan: Modeling and data systems for wildland fire and
air quality. US Forest Service. PNRS, 60 Sandberg DV, Ottrnar RD, Cushon GH. (2001), Characterizing fuels in the 21st century. btt"! J.
Wildland Fire, 10: 381 - 387
Seiler W. Crutzen PJ, (1980), Estimates of gross and net fluxes of carbon between the
biosphere and the atmosphere from biomass burning. Clim. Change. 2: 207-247 StanturfJA ct al., (2002), Fires in southern forest landscapes, in The Southern Forest Resource
Assessment USDA Forest Service, SRS Twomey S, Piepgrass M, Wolfe TL, (1984), An assessment of the impact of pollution on
global cloud albedo. Teilus, 36B: 356-366 Wade DD, Brock BL, Brose PH et al., (2000). Fire in eastern ecosystems. In: Wildland.fue in
ecosystems: effects of fire on flora, Brown JK, Smith JK (eds), Gen. Tech. Rep. RMRS-42.
Ogden, UT: U.S. Department of Agriculture, Forest Service, Rocky Mountain Research
Station: 53 - 96 Chapter 4. Vol. 2 Wang W, Qu JJ, Liu Y. Hao X. Sommers W, (2006), A preliminary study for improving
MODIS small and cool fire detection over the southeastern United States. Remote sensing
of Environment (in revision) Ward DE, Peterson JL, Hao WM, (1993), An inventory of particulate matter and air toxic
emissions from prescribed fires in the USA for 1989, 93-PM-6.04. Proc. the Air and Waste
Management Association 1993 Annual Meeting and Exhibition, Denver, CO. June 14 - 18 WRAP, (2002}, 1996 Fire Emission Inventory. Prepared by Air Sciences, INC
WRAP, (2005). Inter-PRO National 2002 Wildfire Emissions Inventory (Final Work Plan).
Prepared by Air Sciences and EC/R
133