9 measuring employment and income for low-income ... · low-income and welfare populations at the...
TRANSCRIPT
275
9
Measuring Employment and Income forLow-Income Populations with
Administrative and Survey Data
V. Joseph Hotz and John Karl Scholz
With passage of the Personal Responsibility and Work Opportunity Recon-ciliation Act (PRWORA) of 1996 and the expansions of the Earned Income TaxCredit (EITC) over the past decade, increasing attention has been paid to theemployment experiences, labor market earnings, and transfer income received bydisadvantaged individuals and households. This attention, prompted by explicitperformance goals in PRWORA and implicit goals of the EITC expansions,focuses on whether low-income households can achieve self-sufficiency withoutresorting to Temporary Assistance for Needy Families (TANF) for other publicassistance programs. Although income and employment levels are only partialindicators of the well-being of households, they continue to be ones most oftenused to assess the consequences, intended and unintended, of welfare reform.
More broadly, good measures of income and employment for low-incomefamilies are necessary to (1) assess the well-being and labor market attachment oflow-income and welfare populations at the national, state, and local levels; (2)evaluate welfare reform and learn the effects of specific policies, such as timelimits and sanctions; and (3) meet reporting requirements under TANF and aid inthe administration of welfare programs.
There are two data sources for measuring employment and incomes of thedisadvantaged: survey data and administrative. Surveys have been the mainstayof evaluating welfare programs and of monitoring changes in income and em-ployment for decades. These include national surveys—such as the U.S. Cen-suses of Population, the Current Population Survey (CPS), the Survey of Incomeand Program Participation (SIPP), the National Longitudinal Surveys (NLS), andthe Panel Study of Income Dynamics (PSID)—and more specialized surveys that
276 MEASURING EMPLOYMENT AND INCOME FOR LOW-INCOME POPULATIONS
gather data for targeted groups, such as current or former welfare recipients, andat the state or local level.1 Although survey data continue to be important, the useof administrative data sources to measure income and employment has growndramatically over the past 30 years. Data on wages and salaries from state Unem-ployment Insurance (UI) systems, for example, have been used to measure theearnings and employment of individuals that participated in state AFDC/TANFprograms, manpower training, and other social programs. Data on earnings (andemployment) from Social Security Administration (SSA) records have beenlinked with the records of welfare and social program participants.
What type of data one uses to measure income and employment amongcurrent and past welfare participants and welfare-eligible households may haveimportant consequences for implementing and evaluating recent welfare reforms.Recent debates between the states and the federal government, for example, overemployment targets and associated sanctions mandated under PRWORA hingedcrucially on exactly how the fraction of a state’s caseload that is employed wouldbe measured. Furthermore, the conclusions of several recent assessments of theimpacts of welfare reform and caseload decline appear to depend on how incomeand employment of welfare leavers and welfare-eligible populations are mea-sured.2
In this paper we assess the strengths and weaknesses of using survey oradministrative data to measure the employment and income of low-income popu-lations. We review a number of studies, most of which have been conducted inthe past 10-15 years,3 that assess the comparability of income and employmentmeasures derived from surveys and administrative records. Clearly the primarycriterion for evaluating data sources is their accuracy or reliability. Ideally onewould compare the income and employment measures derived from either sur-veys or administrative data sources with their true values in order to determinewhich source of data is the most accurate.
Unfortunately this ideal is rarely achieved. One seldom, if ever, has access tothe true values for any outcome at the individual level. At best, one only candetermine the relative differences in measures of a particular outcome across datasources. In this paper, we try to summarize the evidence on these relative differ-
1Often these samples are gathered in the context of evaluations of specific welfare or trainingprograms.
2See, for example, studies by Primus et al. (1999), Cancian et al. (1999), and Rolston (1999) for aflavor of how this debate hinges on measurement issues.
3Several earlier studies compared employment measures for low-income populations across alter-native data sources, most notably the study by Greenberg and Halsey (1983) with data from theSIME/DIME Experiments. Given changes over time in such things as Unemployment Insurancecoverage and response rates in surveys, we focus on the most recent studies available to maximizethe relevance of our findings for the measurement of these outcomes for current and future studies.
V. JOSEPH HOTZ AND JOHN KARL SCHOLZ 277
ences and the state of knowledge as to why they differ. These studies point toseveral important dimensions along which surveys and administrative recordsdiffer and, as such, are likely to account for some, if not all, of the differences inthe measures of income and employment derived from each. These include thefollowing:
• Population Coverage: Surveys generally sample the population whileadministrative data typically cover the population of individuals or householdswho are enrolled in some program. In each case issues arise about the sizes ofsamples at state or substate levels and sample designs that may limit the issuesthat can be examined.
• Reporting Units: Different data sources focus on individuals, households,tax-filing units, or case units. Differences in reporting units hinder the ability tomove across data sources to obtain measures of income and complicate efforts toevaluate the differential quality of income data across data sets. Furthermore,differences in reporting units may have important consequences for the compre-hensiveness of income measures, an issue especially relevant when attempting toassess the well-being, and changes in the well-being, of disadvantaged popula-tions.
• Sources of Income: Data sources differ in the breadth of the sources ofindividual or household income they collect. Surveys such as the CPS and, espe-cially, the SIPP, attempt to gather a comprehensive set of income elements,including labor earnings, cash benefits derived from social programs, and incomefrom assets. In contrast, administrative data sources often contain only informa-tion on a single type of income (as in the case of UI earnings) or only thosesources of income needed for the purposes of a particular record-keeping system.
• Measurement Error: Different data sources may be subject to differentsources of measurement problems, including item nonresponse, imputation error,and measurement error with respect to employment and income (by source).Furthermore, issues such as locating respondents, respondent refusals, and sampleattrition are important in conducting surveys on low-income populations.
• Incentives Associated with Data-Gathering Mechanisms: Data sourcesalso may differ with respect to the incentives associated with the gathering ofinformation. In the case of surveys, respondents’ cooperation may depend on acomparison of the financial remuneration for a survey with the respondent “bur-den” associated with completing it. In the case of administrative data, the incen-tives relate to the administrative functions and purposes for which the informa-tion is obtained. What is important is attempting to anticipate the potential for andlikelihood of biases in measures of income and employment that may result fromsuch incentives.
The importance of various strengths and weaknesses of different data sourcesfor measuring employment and income generally will depend on the purpose to

278 MEASURING EMPLOYMENT AND INCOME FOR LOW-INCOME POPULATIONS
which these measures are put. We note five considerations. First, when conduct-ing an experimental evaluation of a program, the criteria for judging data sourcesis whether they yield different estimates of program impact, which generallydepends on differences in income (employment) between treatment and controlgroups. In this case, errors in measuring the level of income between treatmentand control groups could have little effect on the evaluation. Alternatively, sup-pose one’s objective is to describe what happened to households who left welfare.In this case, researchers will be interested in the average levels of postwelfareearnings (or employment). We discuss results from Kornfeld and Bloom (1999)where UI data appear to understate the level of income and employment oftreatments and controls in an evaluation of the Job Training Partnership Act(JTPA), but differences between the two groups appear to give accurate measuresof program impacts. Depending on the question of interest, the UI data may besuitable or badly biased.
Second, surveys, and possibly tax return data, can provide information onfamily resources while UI data provide information on individual outcomes.When assessing the well-being of case units who leave welfare, we often areinterested in knowing the resources available to the family. When thinking aboutthe effects of a specific training program, we often are interested in the effects onthe individual who received training.
Third, data sets differ in their usefulness in measuring outcomes over timeversus at a point in time. UI data, for example, make it relatively straightforwardto examine employment and earnings over time, while it is impossible to do thiswith surveys unless they have a longitudinal design.
Fourth, sample frames differ between administrative data and surveys. Re-searchers can not use administrative data from AFDC/TANF programs, for ex-ample, to examine program take-up decisions because the data only cover fami-lies who already receive benefits. Surveys, on the other hand, generally haverepresentative rather than targeted or “choice-based” samples.
Fifth, data sources are likely to have different costs. These include the costsof producing the data and implicit costs associated with gaining access. The issueof access is often an important consideration for certain sources of administrativedata, particularly data from tax returns.
The remainder of this paper is organized as follows: We characterize thestrengths and weaknesses of income and employment measures derived fromsurveys, with particular emphasis on national surveys, from UI wage records, andfrom tax returns. For each data source, we summarize the findings of studies thatdirectly compare the income and employment measures derived from that sourcewith measures derived from at least one other data source. We conclude the paperby identifying the “gaps” in existing knowledge about the survey and administra-tive data sources for measuring income and employment for low-income and
V. JOSEPH HOTZ AND JOHN KARL SCHOLZ 279
welfare-eligible populations. We offer several recommendations for future re-search that might help to close these gaps.
USING SURVEY DATA TO MEASUREEMPLOYMENT AND INCOME
In this section, we discuss the strengths and weaknesses of measuring in-come and employment status for low-income populations using survey data.Most of our analysis focuses on the use of national surveys—CPS and SIPP inparticular—because of the availability of several high-quality studies that com-pare their income and employment measures to other data sources. Where avail-able, we also summarize studies that assess income and employment measure-ment with more targeted surveys.
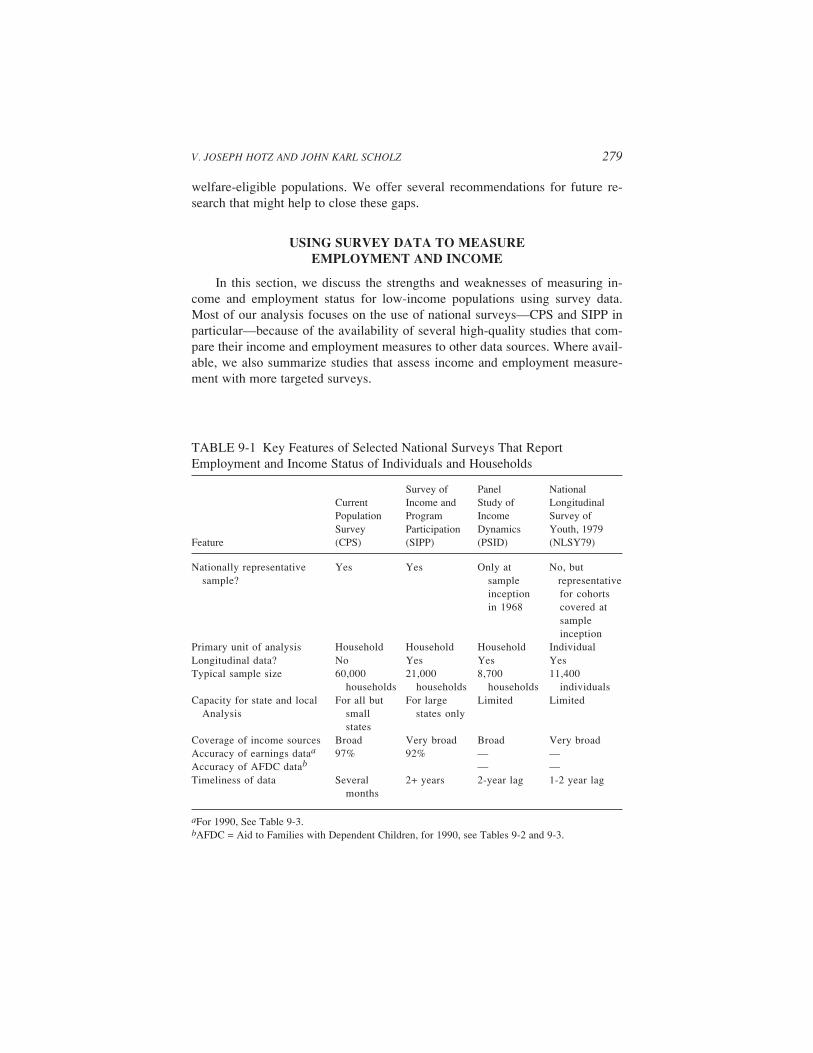
TABLE 9-1 Key Features of Selected National Surveys That ReportEmployment and Income Status of Individuals and Households
Survey of Panel NationalCurrent Income and Study of LongitudinalPopulation Program Income Survey ofSurvey Participation Dynamics Youth, 1979
Feature (CPS) (SIPP) (PSID) (NLSY79)
Nationally representative Yes Yes Only at No, butsample? sample representative
inception for cohortsin 1968 covered at
sampleinception
Primary unit of analysis Household Household Household IndividualLongitudinal data? No Yes Yes YesTypical sample size 60,000 21,000 8,700 11,400
households households households individualsCapacity for state and local For all but For large Limited Limited
Analysis small states onlystates
Coverage of income sources Broad Very broad Broad Very broadAccuracy of earnings dataa 97% 92% — —Accuracy of AFDC datab — —Timeliness of data Several 2+ years 2-year lag 1-2 year lag
months
aFor 1990, See Table 9-3.bAFDC = Aid to Families with Dependent Children, for 1990, see Tables 9-2 and 9-3.

280 MEASURING EMPLOYMENT AND INCOME FOR LOW-INCOME POPULATIONS
The key features of the national surveys for the purposes of this paper aresummarized in Table 9-1.
Potential Strengths
The CPS and SIPP are vital data sets for understanding the functioning oflow-wage labor markets and the effects of antipoverty programs. These data gethigh marks on many of the concerns mentioned in the introduction. They have anational sampling frame covering program participants and nonparticipants thatmake these data valuable for developing a broad perspective on developments inlow-wage labor markets. An example of this type of study is Primus et al. (1999),which uses CPS data to show that AFDC/TANF and Food Stamp Program par-ticipation rates have declined considerably faster than poverty rates between1993 and 1997. They further report that incomes of poor single mothers fellbetween 1995 and 1997 (after rising between 1993 and 1995), and that the safetynet is lifting fewer children from poverty than in the past. Concerns arise with thisstudy, some of which are mentioned in the text that follows. Nonetheless, theCPS and the SIPP are the only data sets that would allow analysts to address theimportant issues that Primus et al. examine on a national scale.
The other national data sets that have been used to analyze the employmentand income status of low-income populations are the National Longitudinal Sur-vey (particularly the National Longitudinal Survey of Youth 1979) and the PSID.Both of these data sets have the additional feature that they are longitudinalsurveys so that one can obtain information on earnings and employment statusover time for the same person (and household).4 The PSID has surveyed, untilvery recently, its respondents and the “splitoffs” of initial respondent householdson an annual basis since 1968. Similarly, until 1994 the NLSY79 conductedannual surveys of a random sample of individuals who were 14-21 years of age in1979. Both of these surveys gathered detailed information on labor market earn-ings and employment status of respondents, earnings and some employmentinformation on other adult household members, and some information on othersources of income, including income from various public assistance programs.One of the advantages of longitudinal data sets such as SIPP, PSID, and NLSY isthat they allow one to monitor the entry into and exit from welfare or other socialprograms and the factors related to welfare dynamics, including changes in earn-ings and family structure.
The CPS, SIPP, and PSID, in addition to having nationally representativesamples, focus on households as the unit of analysis, and include information onall adult household members.5 Given the general presumption that families pool
4Each wave of the SIPP is a longitudinal survey with between 2.5 and 4 years of data on theresidents of a sample housing unit. Surveys to these respondents are asked every 4 months.
5The NLSY79 focuses on the original respondent, but it gathers a considerable amount of informa-tion on the respondent’s spouse and/or cohabiting partner.
V. JOSEPH HOTZ AND JOHN KARL SCHOLZ 281
resources, data sets that focus on families or households (and include informationon cohabiting partners) are valuable. A calculation in Meyer and Cancian (1998)illustrates the usefulness of having data on family, as well as individual, incomes.Their study examines the economic well-being of women in the 5 years afterleaving AFDC. They show that in the first year upon exit from AFDC, 79 percentof the women have incomes below the poverty line, but when family income isconsidered, a smaller number, 55.5, have income below the (correspondinglylarger) poverty line. After 5 years, 64.2 percent of the women still have incomesbelow the poverty line, while only 40.5 percent of the broader family unit hadincome below the poverty line.
The nationally representative surveys provide information on multiplesources of income, especially in the SIPP, either through separate questions orprompting of specific income sources. By asking specific questions about, forexample, welfare receipt or food stamps, the data identify participants and (eli-gible) nonparticipants, so the data can be used to study program entry effects.
The national surveys also measure income and employment in a comparablefashion both over time and across geographical locations, though in January 1994the way that earnings information was elicited in the CPS was changed (Polivka,1997).6
Another strength of the nationally representative surveys is that questionscan be modified to reflect changing circumstances. For example, the U.S. CensusBureau periodically conducts cognitive interviews of respondents to the CPS inorder to assess how they responded to different CPS income- and welfare-relatedquestions. Such studies are used to determine which of the CPS questions wereconfusing and how respondents interpreted questions. Results from these cogni-tive interviews are used to improve the way questions are asked, with the goal ofimproving the quality of the data on key variables such as income and programparticipation.7 Typically, this sort of sophisticated assessment can only be doneon large-scale, national surveys.
To summarize, there are several potential strengths of using survey data tomeasure income and employment. These include the following:
• Surveys can provide representative samples for specific populations andgenerally include data for other family members.
6Previously, earnings had to be reported in weekly amounts, and amounts over $2,000 per weekwere truncated. Now earnings can be reported over any interval and the data (to Bureau of LaborStatistics) are not truncated. Studies that use repeated cross-sections of the CPS that span 1994 riskmisinterpreting results if they fail to account for the redesign. Polivka provides adjustment factors forearnings (at the 10th, median, and 90th percentiles) reported prior to 1994 to make the series compa-rable. She also shows that top-coded values that are imputed using a Pareto distribution do a good jobof fitting the distribution of data that are not top coded.
7See Bogen et al. (1997) and Bogen (1998).

282 MEASURING EMPLOYMENT AND INCOME FOR LOW-INCOME POPULATIONS
• Surveys typically provide demographic data and data on other character-istics of households (such as educational attainment). They also may gather de-tailed information on many distinct income sources.
• National surveys provide consistent information across states and locali-ties.
• Surveys can be flexible, so their developers can control what informationis collected about income and employment, and this information can be improvedover time
Potential Weaknesses
Three general concerns arise with the nationally representative surveys thatkeep them from being the solution, or “core” data, for understanding the effectsof welfare reform. The most important issue is that sample sizes and samplingframes are such that these data cannot be used to examine certain subpopulationsof interest, such as welfare recipients in a particular state (perhaps with theexception of the largest states, such as California, New York, and Texas). Adistinguishing feature of welfare reform is that program responsibility now largelyrests with states and even counties within a state. The nationally representativedata sets do not have sample designs and sample sizes that allow analysts toexamine behavior at a level that corresponds to where program decisions arebeing made.
Second, there appear to be systematic changes in the coverage of low-in-come populations in the CPS. Studies have found that AFDC and Food StampProgram benefits and the number of recipients in the CPS have declined overtime relative to estimates of participants from administrative records. This issueof coverage is a serious concern for studies that use the CPS for measuring theincome of welfare populations.8 In Table 9-2, we reproduce comparisons ofaggregate AFDC/TANF and Food Stamp Benefits Program between CPS andadministrative data sources from the Primus et al. (1999) study. It shows therehas been a sharp decline between 1990 and 1997 in the percentage of AFDC/TANF and Food Stamp Program benefits reported in the CPS compared toamounts reported in administrative data.9 The reduction in coverage of AFDC/
8Roemer (1999) suggests the reduction in coverage could be related to PRWORA—the March1997 survey did not use state-specific labels for TANF benefits in 14 states that had abolishedAFDC. Benefit estimates were 4.5 percentage points lower than the benchmark in states that hadabolished AFDC than in states that had not. The delivery mechanism of benefits in some circum-stances (for example, through employers), an enhanced sense of stigma, and caseload reductions thatexacerbate recall errors may also contribute to underreporting.
9Primus et al. adjust the CPS data proportionately to account for the decline in benefits over time,but the value of this adjustment depends on the patterns of discrepancies in the data. Unfortunately,we know little about the factors associated with the underrepresentation of program participants inthe CPS or the SIPP.
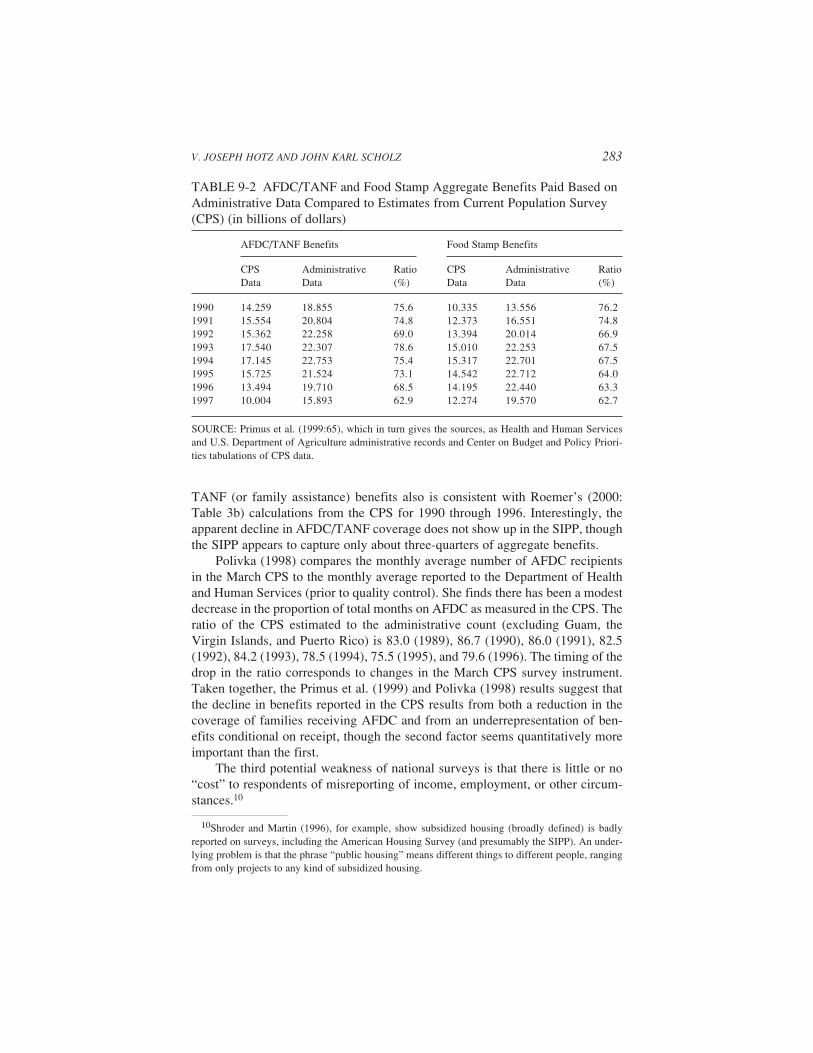
V. JOSEPH HOTZ AND JOHN KARL SCHOLZ 283
TANF (or family assistance) benefits also is consistent with Roemer’s (2000:Table 3b) calculations from the CPS for 1990 through 1996. Interestingly, theapparent decline in AFDC/TANF coverage does not show up in the SIPP, thoughthe SIPP appears to capture only about three-quarters of aggregate benefits.
Polivka (1998) compares the monthly average number of AFDC recipientsin the March CPS to the monthly average reported to the Department of Healthand Human Services (prior to quality control). She finds there has been a modestdecrease in the proportion of total months on AFDC as measured in the CPS. Theratio of the CPS estimated to the administrative count (excluding Guam, theVirgin Islands, and Puerto Rico) is 83.0 (1989), 86.7 (1990), 86.0 (1991), 82.5(1992), 84.2 (1993), 78.5 (1994), 75.5 (1995), and 79.6 (1996). The timing of thedrop in the ratio corresponds to changes in the March CPS survey instrument.Taken together, the Primus et al. (1999) and Polivka (1998) results suggest thatthe decline in benefits reported in the CPS results from both a reduction in thecoverage of families receiving AFDC and from an underrepresentation of ben-efits conditional on receipt, though the second factor seems quantitatively moreimportant than the first.
The third potential weakness of national surveys is that there is little or no“cost” to respondents of misreporting of income, employment, or other circum-stances.10
TABLE 9-2 AFDC/TANF and Food Stamp Aggregate Benefits Paid Based onAdministrative Data Compared to Estimates from Current Population Survey(CPS) (in billions of dollars)
AFDC/TANF Benefits Food Stamp Benefits
CPS Administrative Ratio CPS Administrative RatioData Data (%) Data Data (%)
1990 14.259 18.855 75.6 10.335 13.556 76.21991 15.554 20.804 74.8 12.373 16.551 74.81992 15.362 22.258 69.0 13.394 20.014 66.91993 17.540 22.307 78.6 15.010 22.253 67.51994 17.145 22.753 75.4 15.317 22.701 67.51995 15.725 21.524 73.1 14.542 22.712 64.01996 13.494 19.710 68.5 14.195 22.440 63.31997 10.004 15.893 62.9 12.274 19.570 62.7
SOURCE: Primus et al. (1999:65), which in turn gives the sources, as Health and Human Servicesand U.S. Department of Agriculture administrative records and Center on Budget and Policy Priori-ties tabulations of CPS data.
10Shroder and Martin (1996), for example, show subsidized housing (broadly defined) is badlyreported on surveys, including the American Housing Survey (and presumably the SIPP). An under-lying problem is that the phrase “public housing” means different things to different people, rangingfrom only projects to any kind of subsidized housing.
284 MEASURING EMPLOYMENT AND INCOME FOR LOW-INCOME POPULATIONS
Some specific potential weaknesses associated with the PSID and NLSY79are of potential relevance for obtaining information on the income and employ-ment status of low-income populations. Most notable is the fact that they are not,by design, representative of the general population over time. Both data setsbegan with samples that were representative of their targeted groups—youngadults in the case of the NLSY79 and the national population as of 1968 in thecase of the PSID—but are not designed to be representative of the nationalpopulation, or even of the age group covered in the NLSY79, in subsequentyears. This feature can result in biased measures of summary statistics on incomeand employment vis-à-vis the nation as a whole in more recent years.
The other feature of the NLSY79 and PSID relevant for assessing the incomeand employment status of low-income populations is their respective samplesizes. The original sample for the NLSY79 was 12,686 young men and women,from which approximately 90 percent of the original sample remains today. Theoriginal sample in the PSID was 5,000 U.S. households in 1968 and, because ofits growth through the accumulation of additional households through splitoffsfrom original households, it contained more than 8,700 in 1995. Although theseare not small sample sizes, the sizes of low-income samples at a point in time arerelatively small compared to both the CPS (which contains some 60,000 house-holds at a point in time) and most waves of the SIPP (which, in its larger waves,contains data on 21,000 households). The sizes of the low-income or welfaresubsamples in the NLSY79 and PSID for even the largest states are generally toosmall to derive reliable measures on income and employment, let alone otheroutcomes.
To summarize, there are two primary potential weaknesses with using na-tional survey data to measure income and employment of low-income popula-tions. They are the following:
• Sample sizes in national surveys often are small for studies that focus onwelfare or low-income populations, or that wish to examine specific targetedgroups, such as current or former welfare recipients.
• There appears to be falling coverage (of both recipients and benefits) innational surveys.
Direct Assessments of Income andEmployment Measures from Survey Data
Moore et al. (1997) conducted a general survey of income reporting in theCPS and SIPP, and Roemer (2000) assesses trends in SIPP and CPS incomereporting between 1990 and 1996.11 A central finding in Moore et al. (1997) and
11There are no comprehensive assessments of the quality of income and employment measure-ments for either the NLSY79 or the PSID. Roemer (1999) and Nelson et al. (1998) update the CPS

V. JOSEPH HOTZ AND JOHN KARL SCHOLZ 285
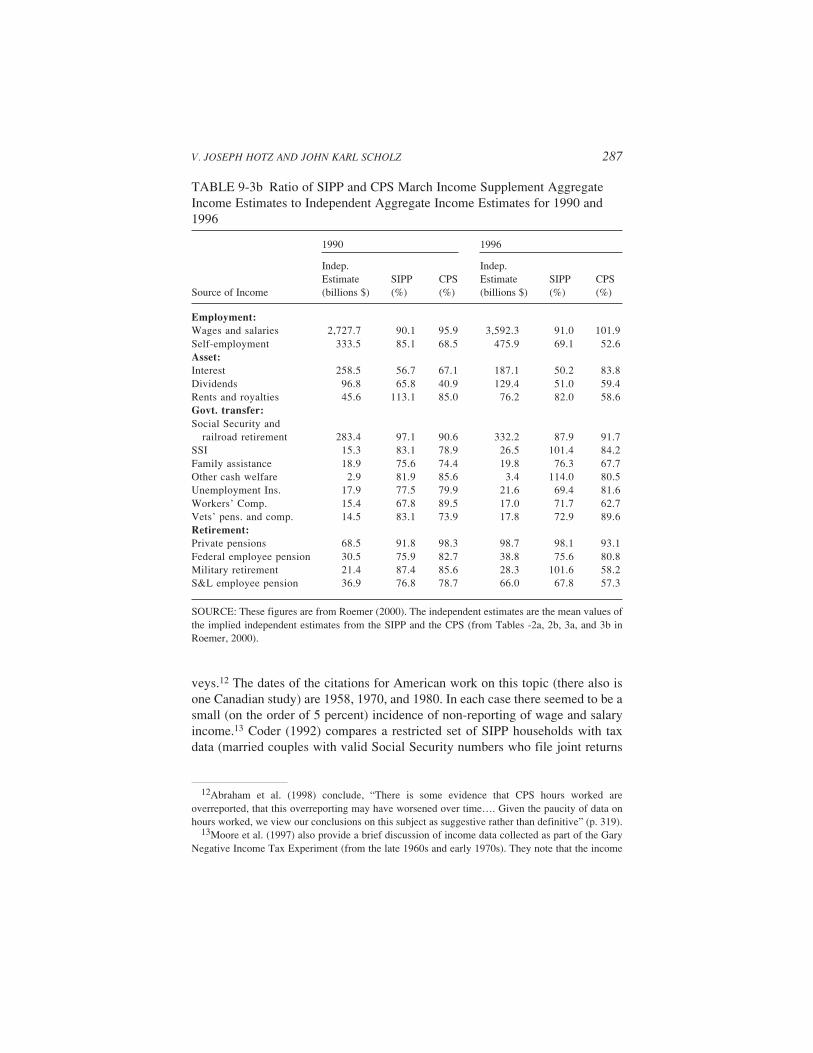
Roemer (2000) is that there is underreporting of many types of income in sur-veys. The reasons for this and, hence, solutions in the design of effective surveysare complex. The magnitudes of CPS and SIPP underreporting for selected yearsare given in Tables 9-3a and 9-3b, taken from the two papers. (Note that differ-ences may be the result of flawed benchmarks rather than flawed surveys.)
Surveys of Income Reporting in the SIPP and CPS
The understatement of certain types of income, such as interest and dividendreceipts, is probably not critical for low-income populations because low-incomefamilies typically receive small amounts of income from these sources. Based onthe evidence presented in Tables 9-3a and 9-3b, it appears that wages and salariesare fairly accurately reported in the CPS, although less accurately in the SIPP.But Moore et al. (1997) note that 26.2 percent (35,205,000 out of 134,135,000total weighted cases) of the wage and salary “responses” in CPS surveys areimputed from cases where the respondent did not give an answer, replied “don’tknow,” or refused to answer the question. They also report that 7 to 8 percent ofhouseholds refuse to participate in the CPS, so imputations and imputation qual-ity is clearly a critical element in survey quality.
The apparent accuracy of wage and salary reporting in Tables 9-3a and 9-3bdoes not fully resolve concerns that we have about data accuracy for low-incomepopulations, because we do not know much about the characteristics of familiesthat underreport their incomes. If, for example, most of the underreporting ofincome occurs among the disadvantaged, the findings of Moore et al. (1997) andRoemer (2000) on wage and salary reporting in the CPS and SIPP may be of littlecomfort. Roemer, for example, shows there are significantly more aggregatedollars reported below family income of $25,000 in the SIPP relative to theMarch CPS. He suggests that the SIPP does a better job than the CPS of capturingthe incomes of low earners and a worse job of capturing the incomes of highearners. Learning more about the nature of underreporting would appear to be ahigh priority for future research.
Matching Studies of Wage and Salary Income
Roemer (2000) examines the accuracy of CPS wage and salary reports bymatching CPS data to Internal Revenue Service (IRS) tax returns in selectedyears for the first half of the 1990s. The sample is limited to nonjoint returns andselected joint returns where each filer matches a March CPS person. The sampleis restricted further to observations with no imputed wages in the CPS. He findsthat in the middle of the income distribution (from $15,000 to $150,000), at least
calculations to 1996. Roemer (2000) also provides a nice discussion of adjustments that need to bemade to compare aggregate SIPP and CPS totals to National Income and Product Account data.

286 MEASURING EMPLOYMENT AND INCOME FOR LOW-INCOME POPULATIONS
TABLE 9-3a Ratio of SIPP and CPS March Income Supplement AggregateIncome Estimates to Independent Aggregate Income Estimates for 1984 and1990
1984 1990
Indep. Indep.Estimate SIPP CPS Estimate SIPP CPS
Source of Income (billions $) (%) (%) (billions $) (%) (%)
Employment:Wages and salaries 1,820.1 91.4 97.3 2,695.6 91.8 97.0Self-employment 192.6 103.1 70.2 341.4 78.4 66.8Asset:Interest 244.8 48.3 56.7 282.8 53.3 61.1Dividends 59.3 65.9 51.8 126.3 46.1 31.3Rents and royalties 19.4 211.3 95.4 44.1 102.9 87.8Govt. transfer:Social Security 160.5 96.2 91.9 225.5 98.3 93.0Railroad retirement 5.6 96.4 71.4 6.9 95.7 66.7SSI 9.9 88.9 84.8 13.6 94.9 89.0AFDC 13.9 83.5 78.4 19.7 70.1 71.6Other cash welfare 2.0 135.0 120.0 2.9 86.2 80.2Unemployment Ins. 16.3 76.1 74.8 17.7 84.2 80.2Workers’ Comp. 14.1 56.7 48.2 14.6 86.3 94.5Vets’ pension and comp. 13.9 82.0 59.7 13.8 84.1 77.5Retirement:Private pensions 65.2 63.8 57.2 70.2 107.1 110.8Federal employee pension 20.3 98.0 84.7 30.4 73.4 82.6Military retirement 15.6 105.1 98.1 20.4 92.2 89.2S&L employee pension 21.9 88.1 71.7 36.1 75.1 80.1Miscellaneous:Alimony 2.7 100.0 81.5 2.5 116.0 124.0
SOURCE: These figures are adapted from Coder and Scoon-Rogers (1996).
half the CPS and tax reports are within 10 percent of each other. Anywhere from60 to 80 percent of the observations are within 15 percent of one another. Dis-crepancies appear much larger in the bottom and very top of the income distribu-tion. Below $10,000 and above $150,000, at least half the observations havediscrepancies exceeding 20 percent, and most are larger than that. Discrepanciesare both positive and negative, though, as expected, CPS incomes tend to belarger than incomes reported on tax returns in the bottom of the income distribu-tion, and CPS incomes tend to be smaller than incomes reported on tax returns inthe top of the income distribution.
Beyond the cited studies, there appears to be little recent work on the accu-racy of the wage and salary income in the SIPP, CPS, or related national sur-
V. JOSEPH HOTZ AND JOHN KARL SCHOLZ 287
veys.12 The dates of the citations for American work on this topic (there also isone Canadian study) are 1958, 1970, and 1980. In each case there seemed to be asmall (on the order of 5 percent) incidence of non-reporting of wage and salaryincome.13 Coder (1992) compares a restricted set of SIPP households with taxdata (married couples with valid Social Security numbers who file joint returns
TABLE 9-3b Ratio of SIPP and CPS March Income Supplement AggregateIncome Estimates to Independent Aggregate Income Estimates for 1990 and1996
1990 1996
Indep. Indep.Estimate SIPP CPS Estimate SIPP CPS
Source of Income (billions $) (%) (%) (billions $) (%) (%)
Employment:Wages and salaries 2,727.7 90.1 95.9 3,592.3 91.0 101.9Self-employment 333.5 85.1 68.5 475.9 69.1 52.6Asset:Interest 258.5 56.7 67.1 187.1 50.2 83.8Dividends 96.8 65.8 40.9 129.4 51.0 59.4Rents and royalties 45.6 113.1 85.0 76.2 82.0 58.6Govt. transfer:Social Security and
railroad retirement 283.4 97.1 90.6 332.2 87.9 91.7SSI 15.3 83.1 78.9 26.5 101.4 84.2Family assistance 18.9 75.6 74.4 19.8 76.3 67.7Other cash welfare 2.9 81.9 85.6 3.4 114.0 80.5Unemployment Ins. 17.9 77.5 79.9 21.6 69.4 81.6Workers’ Comp. 15.4 67.8 89.5 17.0 71.7 62.7Vets’ pens. and comp. 14.5 83.1 73.9 17.8 72.9 89.6Retirement:Private pensions 68.5 91.8 98.3 98.7 98.1 93.1Federal employee pension 30.5 75.9 82.7 38.8 75.6 80.8Military retirement 21.4 87.4 85.6 28.3 101.6 58.2S&L employee pension 36.9 76.8 78.7 66.0 67.8 57.3
SOURCE: These figures are from Roemer (2000). The independent estimates are the mean values ofthe implied independent estimates from the SIPP and the CPS (from Tables -2a, 2b, 3a, and 3b inRoemer, 2000).
12Abraham et al. (1998) conclude, “There is some evidence that CPS hours worked areoverreported, that this overreporting may have worsened over time…. Given the paucity of data onhours worked, we view our conclusions on this subject as suggestive rather than definitive” (p. 319).
13Moore et al. (1997) also provide a brief discussion of income data collected as part of the GaryNegative Income Tax Experiment (from the late 1960s and early 1970s). They note that the income
288 MEASURING EMPLOYMENT AND INCOME FOR LOW-INCOME POPULATIONS
and have positive wage and salary income in either the SIPP or on tax returns)and finds a roughly 5-percent discrepancy in the existence of wage and salaryincome. Moore et al. (1996) examine a sample of SIPP households working forspecific employers and find that respondents sometimes drop months of wageand salary receipt over a 4-month interview cycle, though virtually all accuratelyreported the presence of a job during the wave.
Several other studies assess the quality of income and earnings measurementbased on matching survey data with various types of administrative data. Boundand Krueger (1991) match CPS data from 1977 and 1978 with SSA earningsrecords and find essentially zero net bias in CPS income reports for those whoseincomes did not exceed the SSA’s earnings maximum cutoff. In fact, more than10 percent of the CPS sample matched their Social Security reported earnings tothe dollar, and 40 percent were within 2.5 percent. Second, Rodgers et al. (1993)examine wage records in the PSID for unionized men working fulltime at anhourly rate in one specific durable goods manufacturing firm in 1983 and 1987.These authors examine three common measures of earnings: earnings from theprevious week, from the previous year, and “usual” earnings. They find annualearnings are reported fairly reliably, but this is less true for the other two mea-sures. They also find for each measure that there is a tendency for workers withlower than average earnings to overreport and for workers with higher thanaverage earnings to underreport.14
Studies of Program Participation and Transfer Income
The previous discussion focused on income reporting. There are also severalstudies of transfer program reporting in surveys, though the cited studies are old(dates for the citations are 1940, 1962, 1969, 1969, 1971, 1975, 1978, 1980, and1984). These are not “complete” design studies, in that they typically focus on asample of recipients and examine whether or not they report benefits. Completedesigns also would look at nonrecipients and see if they falsely report receipt.More recent studies do the latter. Most, but not all, of these studies find fairlysubstantial underreporting of transfer program receipt.
data in this experiment, gathered through surveys of respondents, was not very reliable. In the Seattleand Denver Income Maintenance experiments, there was evidence of statistically significantunderreporting of wage and salary amounts. But the magnitude of underreporting was only 2 to 4percent, leading Halsey (1978) to conclude that they were not large enough to be important economi-cally. The correlation between administrator records and reported values was .9, also indicating highreliability.
14They also examine several measurement error assumptions that challenge standard practice inempirical economics.
V. JOSEPH HOTZ AND JOHN KARL SCHOLZ 289
Marquis and Moore (1990), using two waves of the 1994 SIPP panel, did acomprehensive study of the accuracy of reporting of transfer program participa-tion. They discuss evidence of substantial underreporting of program participa-tion among true program participants, on the order of 50 percent for Workers’Compensation and AFDC, 39 percent for UI and 23 percent for food stamps andSupplemental Security Income. Overall participation rates for transfer programs,however, were quite close to what would be expected from administrative con-trols.
Subsequent work by Moore et al. (1996) on a sample of households fromMilwaukee found smaller underreporting among true recipients, and found thatmost error, when it exists, is due to participants’ failures to report the sources ofincome, rather than a failure to report all months of participation.
Bollinger and David (2001) give a detailed examination to food stampunderreporting in the 1984 SIPP panel. They find that the high rate of under-reporting for food stamps arises in part from failures to locate the person legallycertified within the household. About half of the underreports within a householdwere offset by an overreport from another household member. The net effect wasunderreporting of food stamps receipt of 12 to 13 percent in the 1984 SIPP panel.Bollinger and David also (2001) document the important point that nonresponseand false answers are correlated across survey waves in the SIPP.
Finally, Yen and Nelson (1996) examine survey and administrative recordsfrom Washington state and find that 93 percent of the nearly 49,000 person-months are reported correctly, and net overreports roughly equal net underreports.
Assessment of Income and Transfer Program Reporting in National Surveys
Moore et al. (1997:12) conclude their survey of what is known about incomemeasurement in surveys by stating that:
Wage and salary income response bias estimates from a wide variety of studiesare generally small and without consistent sign, and indicators of unreliability(random error) are quite low. Bias estimates for transfer income amount report-ing vary in magnitude but are generally negative, indicating underreporting, andrandom error also is an important problem.
They conclude, “in general we find that the additional data continue to supportthe conclusion of very little bias in survey reports of wage and salary income, andlittle random error as well.” They conclude that studies that match administrativerecords of transfer programs and survey data “suggest a general tendency fortransfer program income to be at least modestly—and in some instances substan-tially—under reported” (p. 16).
Based on our review of available assessments of income and employmentmeasurement in national surveys, we think the above quotation is still correct.The CPS, SIPP, NLS, and PSID surveys provide:

290 MEASURING EMPLOYMENT AND INCOME FOR LOW-INCOME POPULATIONS
• Valuable information on the behavior of the low-income population (andmany other issues). They have national samples, and broad and fairly accuratemeasures of income, and their focus on families as the unit of analysis and theirease of access greatly enhance their value.
• The value of these data sets for evaluating welfare reform is severelylimited, however. With the devolution of responsibility for TANF, the CPS andSIPP sampling frames and sample sizes mean that, at best, they can be onlysupplementary data sources for understanding the effects of welfare reform at thestate and local levels. The apparent decline in program coverage in the CPS isalso worrisome.15
UNEMPLOYMENT INSURANCE WAGE RECORDS DATATO MEASURE INCOME AND EMPLOYMENT
FOR LOW-INCOME POPULATION
We now consider the evidence on using UI wage records to measure theincome and employment status of low-income populations. UI wage recordscontain the earnings reported by employers (on a quarterly basis) to state UIagencies for each employee. As we noted above, UI data often are linked toinformation on targeted samples, such as participants in evaluations of specificwelfare or training programs. Thus, the populations for which UI wage data areused to measure their income and employment varies with the particular investi-gation being conducted. We report on several of these studies, attempting to drawsome general conclusions about the strengths and weaknesses of this data source.
Potential Strengths
Using UI wage records to measure income and employment has severalpotential advantages. The first is that wages reported to state UI programs arethought to include most of the wage earnings of individuals. By law, any em-ployer paying $1,500 in wages during a calendar quarter to one or more employ-ees is subject to a state UI tax and, hence, must report quarterly what is paid toeach employee, including regular earnings, overtime, and tips and bonuses. Agri-cultural employers must report earnings if they have either a quarterly payroll ofat least $20,000 or have hired 10 or more employees in each of 20 or more weeks
15We were not able to find a comparable study of trends in program participation for the SIPP.U.S. Department of Commerce, Bureau of the Census (1998) compiles summaries of an extensive,long-running research program on SIPP quality. It starts with an overview of SIPP design, and thendescribes sample selection, data collection, nonresponse and measurement error, data preparation,weighting, sampling error, evaluation of estimates from the 1984 to 1993 panels, and the 1996redesign of the SIPP.

V. JOSEPH HOTZ AND JOHN KARL SCHOLZ 291
during the preceding calendar year. Employers of paid household help mustreport wages if they pay at least $1,000 in cash wages during any quarter. In astudy of the use of UI wage records to measure the post enrollment earnings ofJTPA recipients, Baj et al. (1991) claim that, “Virtually all jobs that most observ-ers would consider appropriate targets for JTPA terminee placement are coveredby the UI reporting system.” (More on this study follows.)
A second potential advantage of UI wage data is their presumed accuracy.Hill et al. (1999), for example, made the following, perhaps incorrect argument.“Employers are liable for taxes up to an earnings threshold. Because this thresh-old is quite low, there appears to be little incentive for employers to underreportearnings for most employees. Moreover, employers’ reports are used to deter-mine unemployment benefits. Discrepancies between employer and employeereports upon application of unemployment benefits can result in employer sanc-tions.” Baj, Trott and Stevens (1991:10) write, “The accuracy of the reporting ofmoney wages is unknown. However, relatively few corrections occur in the rou-tine processing of individual unemployment insurance claims. In addition elec-tronic payroll processing is increasing, electronic cross-matching capabilities areexpanding, and new revenue quality control practices have been introduced. Thus,there is reason to think that the accuracy of UI data is higher than that of mostself-reported sources of earnings information. Intentional underreporting of wagesconstitutes fraud, which is subject to sanctions. Unintentional misreporting issubject to penalty payments.”
A third presumed advantage of using UI data to measure employment andwage income of individuals is its ready availability, at least for certain authorizedstudies, and the ability to link this data with information from other administra-tive or survey data sources. (Note that state UI authorities control access to UIwage records and the Social Security numbers necessary to link these data toother data sources for individuals, in order to safeguard the confidentiality of thisinformation.) UI wage records are commonly used in state-level evaluations ofwelfare reform and other social programs. As Baj et al. (1991) conclude in theirstudy of the feasibility of using UI wage data from different states to monitor thepost training earnings outcomes of individuals who received training services inJTPA:
The findings from the first phase of this project indicate that JTPA and anyother program [emphasis added] whose goal is to increase the employment andearnings of participants can use UI wage-record data with confidence. Obtain-ing post-program information from state UI systems is not only a viable option,it is far more cost-effective than the current practice of gathering this informa-tion through contact with participants. Furthermore, UI data are of higher qual-ity than corresponding survey-based information. (p. 30)
They found, for example, that the response rate to the survey was 70.2 percent forthose who were employed at termination compared to 49.6 percent for those who

292 MEASURING EMPLOYMENT AND INCOME FOR LOW-INCOME POPULATIONS
were not. Based on these results, they concluded that using UI wage data waspreferred to obtaining data via surveys, especially given the cost of conductingsurveys on this population.
To summarize, using UI wage records to measure income and employmenthas several potential strengths. These include the following:
• UI data are available at the state level and can be matched to individualsin existing samples at relatively low cost (as long as Social Security numbers areavailable).
• It is straightforward to do follow-up analyses on income and employmentfor workers that remain in the state.
• Data are timely in that they become available with roughly a two-quarterlag.
• For most workers the reporting of wage and salary income appears to beaccurate; however, concerns are noted in the following section.
Potential Weaknesses
Relying on UI wage records to measure employment and income for low-income populations has two potentially serious weaknesses. The first arises be-cause UI wage records do not cover all forms of employment. In particular, stateUI systems typically do not cover the employment of self-employed persons,most independent contractors, military personnel, federal government workers,railroad employees, some part-time employees of nonprofit institutions, employ-ees of religious orders, and some students employed by their schools. Therefore,wage earnings from these types of employment are not contained in state UI wagerecords.
The importance of these exemptions is unclear. In at least two places in theliterature, an assertion is made that 90 percent of workers in the U.S. economy arein jobs covered by the UI system (Baj et al., 1991; Kornfeld and Bloom, 1999).16
As noted in the following paragraphs, this statistic is challenged by the results ofBlakemore et al. (1996) and Burgess et al. (1998), but even if true, it is not clearhow comforting it should be if the topic of interest is low-wage labor markets. If,for example, 8 percent of all jobs are missing from UI wage records, but all 8percent are low-income workers (which in turn is a much larger fraction of alllow-income workers), the usefulness of UI data in monitoring the effects ofwelfare reform would be severely eroded.
Blakemore et al. (1996) and Burgess et al. (1998) report results of a fascinat-ing study of 875 Illinois employers from 1987 that were subjected to detailed
16Despite our efforts, we have not found documentation for this particular statistic.
V. JOSEPH HOTZ AND JOHN KARL SCHOLZ 293
audits of their UI reports. As part of the data set, routine information such as theemployment size of the firm, the statutory UI tax rate for each firm, one-digitStandard Industrial Classification codes, and UI reporting punctuality were com-piled. They also have unique audit information on unreported workers, under-reported total and taxable wages, and UI taxes due on these unreported wages.They also merged information on the total number of independent contractorsthat each firm reported to the IRS. The data set does not attempt to identifyemployers who are part of the underground economy.
If the results for Illinois are projected nationally,17 employers failed to reportthe presence of 11.1 million UI-eligible workers and $70.6 billion in wages tostate UI agencies in 1987. This is 13.6 percent of all workers. Some of theundercoverage arose from failure to report casual or part-time workers, and fail-ure to report tips, bonuses, or other types of irregular compensation. By far thelargest problem (accounting for roughly 50 percent of the discrepancy), however,was with independent contractors. Issues surrounding independent contractorsare among the most vexing in tax administration and labor law. In brief (and atthe risk of oversimplification), in tax law there is a somewhat subjective, 20-parttest to define a worker as a regular employee or independent contractor. Elementsof the test include (from IRS Publication 15A: Employer’s Supplemental TaxGuide) whether the business has “behavioral control” of the worker (does thebusiness give instructions and train the worker?); financial control (can the workermake a profit or loss, does the worker have unreimbursed business expenses, ordoes the worker make services available to a broad market?); and type of relation-ship (does the job have benefits, is it permanent, are the tasks a key aspect of theregular business of the company?). If a worker is treated as an independentcontractor, an employer does not have to withhold income taxes, withhold andpay Social Security and Medicare taxes, or pay UI taxes.
It is not clear if the issues raised in the Illinois UI audits are associatedstrictly with independent contractors (in the technical sense) or more broadlywith flexible staffing arrangements. Houseman (1999) provides a nice introduc-tion to issues associated with flexible staffing arrangements. She reports datafrom the February 1997 CPS Supplement on Contingent and Alternative WorkArrangements showing that 6.7 percent of workers were “independent contrac-tors,” 1 percent were “agency temporaries,” 1.6 percent were “on-call or daylaborers,” .6 percent were “contract company workers,” and 2.6 percent were“other direct-hire temporaries.” These categories compose 12.5 percent of theworkforce. The use of flexible staffing arrangements appears to have been grow-
17Clearly strong assumptions are needed to make this projection, but the size and industrial com-position of the Illinois sample is not sharply different from national statistics. The Illinois UI systemis typical of what is observed nationally, and, if anything, Midwestern states tend to have lower ratesof income and payroll tax noncompliance than other states.
294 MEASURING EMPLOYMENT AND INCOME FOR LOW-INCOME POPULATIONS
ing sharply over time, but detailed information on its growth is not available.Houseman (1999) reports that the IRS estimates it loses billions in tax revenueseach year due to misclassification of employees.
Houseman (1999) also reports information on the incomes of “flexible work-ers” drawn from the February 1995 CPS Supplement on Contingent and Alterna-tive Work Arrangements, matched to the March 1995 CPS. Of “regular” employ-ees 7.5 percent had incomes below 125 percent of poverty. The correspondingfigures for agency temporaries was 21.7 percent; 16.2 percent for on-call or daylaborers; 10.8 percent for independent contractors; 11.5 percent for contract com-pany workers; and 15.1 percent for other short-term direct hires. Consequently, afailure of UI data to fully capture workers in flexible staffing arrangements couldbe a major problem for studies that rely exclusively on UI data to measure theincome and employment of low-income workers.
In many industries, employers have considerable flexibility in designatingthe status of workers. At least in the Illinois audit study, employers aggressivelyoverused the independent contractor designation. In all, 45 percent of employersmake some underreporting error. This includes nearly 500,000 cases in whichworkers were excluded erroneously, which resulted in $2.6 billion in wages beingunderreported. Smaller firms were estimated to underreport 14 percent of theirtaxable wages and 56 percent of their UI-covered workforce. In statistical mod-els, the percentage of workers on the payroll who are independent contractors andthe turnover of the firms’ workers are two key explanatory variables. The effec-tive tax rate, while related to turnover, also appears to be positively associatedwith compliance. The characteristics of firms that make errors on UI reportswould appear to be positively correlated with the type of employers who dispro-portionately hire workers with low levels of human capital.
Hence, we view the Blakemore et al. (1996) and Burgess et al. (1998) studiesas raising a serious concern about the coverage of UI data, and hence its suitabil-ity as the exclusive source of data with which to evaluate welfare reform. In ourconclusions, we recommend that at least one additional study be conducted alongthe lines of the Illinois study to assess UI coverage. It is our impression, based oncasual, anecdotal evidence, that the use of independent contractors has increasedfairly substantially over time, and thus the work based on 1987 Illinois data mayunderstate the problem.
The second potentially major weakness with using UI data for evaluatingwelfare reform is that they contain limited accompanying demographic informa-tion on individuals, and, more importantly, may not allow one to form an accuratemeasure of family income. In assessing the impacts of welfare reform, manyargue that it is important to assess how these changes affect the well-being ofchildren and the families in which they reside. As such, families constitute thenatural “unit of analysis” for such assessments and family income often is used asan indicator of this unit’s well-being.

V. JOSEPH HOTZ AND JOHN KARL SCHOLZ 295
The potential problem of relying on earnings data from UI wage recordswhen the objective is to assess the level of family resources in studying theimpact of welfare reform recently has been highlighted by Rolston (1999). Basedon past research, Rolston notes that changes in individual income account foronly 40 to 50 percent of exits from welfare. Thus, to have a complete picture ofthe effects of welfare reform, analysts need information on other economic anddemographic changes occurring in the family. Given this, the problem is clear.Income as reported through UI records fails to include sources of nonemploy-ment income and income of partners that is available to a family. Income sourcesthat are not UI data may result in a family not receiving cash assistance or beingineligible.
The calculations from Meyer and Cancian (1998) suggest the concern raisedby Rolston (1999) is economically important. Recall that Meyer and Cancianfound, for example, that 5 years after leaving welfare, 64.2 percent of the womenstill have incomes below the poverty line, while, when considering the broaderfamily unit, only 40.5 percent have income below the poverty line. In a relatedcalculation, however, Primus et al. (1999) do an analysis that shows “for mostsingle-mother families, including the income of unrelated male individuals doesnot materially change the picture drawn of a decline in overall disposable incomebetween 1995 and 1997.” More needs to be learned about the importance of theissue raised by Rolston in assessing the level and trend in family well-beingfollowing welfare reform.
To summarize, using UI wage records to measure income and employmenthas two potential weaknesses. These are as follows:
• UI data do not cover all workers, including the self-employed, military,federal employees, independent contractors, and other employment arrangements.Some evidence shows that gaps in coverage may be significant.
• UI data follow individuals, so one cannot get information on incomes ofother family members, at least without Social Security numbers of other house-hold members. UI data also provide limited demographic and background infor-mation on workers.
Direct Comparisons of UI Wage (and Employment) Data with Income andEmployment Measures from Surveys
In this section, we review two sets of studies that make direct comparisons ofincome and employment measurements across several data sources for the sameindividual and/or family. We first consider the results of a comparison of mea-sures of income and employment gathered from UI records in 11 states and froma survey for a sample of 42,564 adults who left JTPA programs during the 1986program year. The findings from this study are described in Baj et al. (1991) and
296 MEASURING EMPLOYMENT AND INCOME FOR LOW-INCOME POPULATIONS
Baj et al. (1992).18 Of those terminees, 27,721 responded to all three of thequestions that were mandatory for “terminees” of JTPA-sponsored programs,giving an overall response rate of 65.1 percent. The investigators had access toseparate data files containing UI wage records for the full sample of terminees,where the latter information was drawn from the UI systems for the 11 Midwest-ern states included in this study. Baj et al. (1991) drew the following conclusionsabout estimating the post enrollment incomes of these JTPA terminees with thesetwo alternative data sources:
There are two major conclusions to be drawn from these analyses. First, there isample evidence to suggest that the post-program survey data is substantiallyaffected by the presence of non-response bias. While this conclusion is basedlargely on the examination of post-program employment experiences, it is sus-pected that the same conclusion would hold if the focus was on post-programearnings. The second conclusion is that the major source of this bias, i.e., thedifferent post-program employment experiences of respondents and non-respon-dents who were employed at termination, is not addressed through current non-response adjustment procedures. The implication of these findings is that theestimates of post-program performance based on the information gatheredthrough the post-program survey are not a true reflection of the actual post-program experiences of all JTPA terminees. (p. 35)
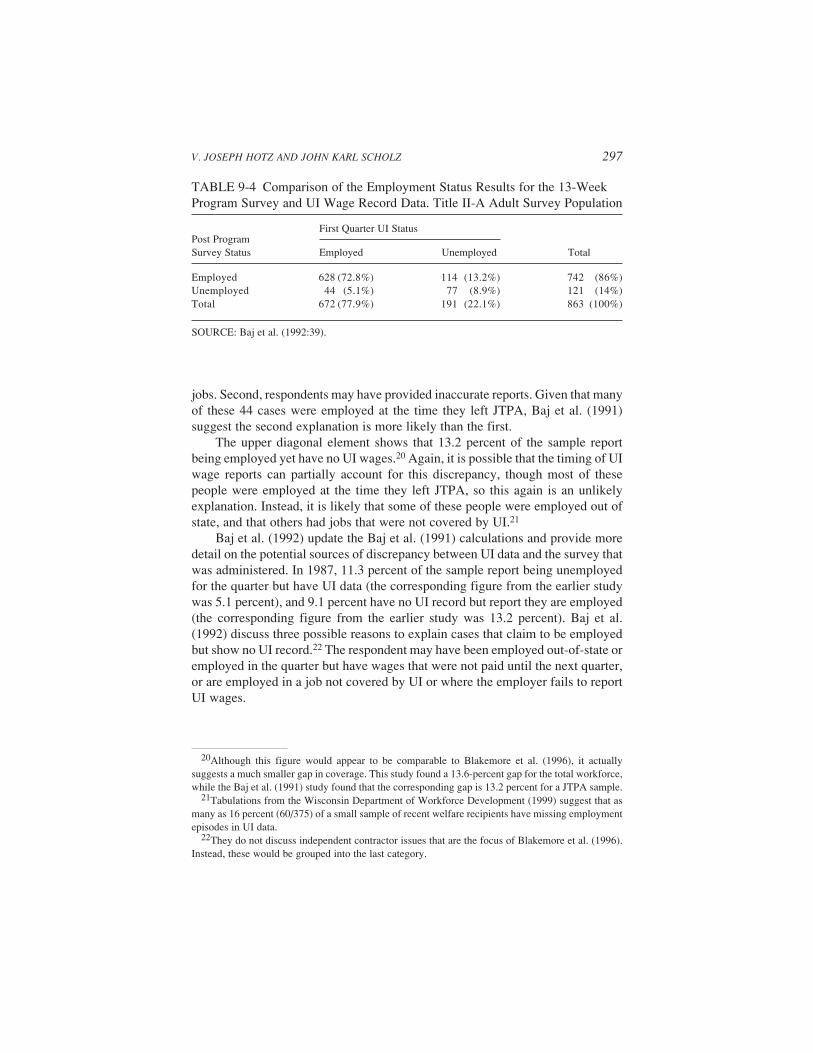
The survey they examined was not constructed in a way that allows compari-sons of earnings reports. Instead, the presence of employment in a given quarterwas compared across the survey and UI data. To do this, they sharply restrict thesample to people leaving Title II-A (JTPA) a week prior to the week containingthe starting date of a fiscal quarter. For data reasons three states also were droppedfrom the sample.19 This left 1,285 participants, of which 863 responded to thesurvey. Even with these sample restrictions, employment comparisons are notcompletely straightforward because UI earnings are reported for the quarter inwhich they are paid, not the quarter in which they are earned. With these issues inmind, Table 9-4 shows the result of the comparisons.
The diagonal elements in Table 9-4 show that 81.7 percent (72.8 percent +8.9 percent) of the UI-survey observations are in agreement on employmentstatus. The lower off diagonal element indicates that 5.1 percent of the matchedsample report that they were unemployed during the quarter, yet they had UIearnings. One might think welfare recipients would be reluctant to report earn-ings, but they were only slightly (5.4 percent) more likely to not report earnings(when they had positive UI earnings) than nonrecipients (4.4 percent). This resulthas two potential explanations. First, respondents may have earned the UI wagesreported for the quarter during the previous quarter and subsequently lost their
18Stevens et al. (1994) is a similar study that focuses on Maryland.19Title II-A is the nation’s employment and training program for low-income adults and out-of-
school youth with significant barriers to employment.
V. JOSEPH HOTZ AND JOHN KARL SCHOLZ 297
jobs. Second, respondents may have provided inaccurate reports. Given that manyof these 44 cases were employed at the time they left JTPA, Baj et al. (1991)suggest the second explanation is more likely than the first.
The upper diagonal element shows that 13.2 percent of the sample reportbeing employed yet have no UI wages.20 Again, it is possible that the timing of UIwage reports can partially account for this discrepancy, though most of thesepeople were employed at the time they left JTPA, so this again is an unlikelyexplanation. Instead, it is likely that some of these people were employed out ofstate, and that others had jobs that were not covered by UI.21
Baj et al. (1992) update the Baj et al. (1991) calculations and provide moredetail on the potential sources of discrepancy between UI data and the survey thatwas administered. In 1987, 11.3 percent of the sample report being unemployedfor the quarter but have UI data (the corresponding figure from the earlier studywas 5.1 percent), and 9.1 percent have no UI record but report they are employed(the corresponding figure from the earlier study was 13.2 percent). Baj et al.(1992) discuss three possible reasons to explain cases that claim to be employedbut show no UI record.22 The respondent may have been employed out-of-state oremployed in the quarter but have wages that were not paid until the next quarter,or are employed in a job not covered by UI or where the employer fails to reportUI wages.
20Although this figure would appear to be comparable to Blakemore et al. (1996), it actuallysuggests a much smaller gap in coverage. This study found a 13.6-percent gap for the total workforce,while the Baj et al. (1991) study found that the corresponding gap is 13.2 percent for a JTPA sample.
21Tabulations from the Wisconsin Department of Workforce Development (1999) suggest that asmany as 16 percent (60/375) of a small sample of recent welfare recipients have missing employmentepisodes in UI data.
22They do not discuss independent contractor issues that are the focus of Blakemore et al. (1996).Instead, these would be grouped into the last category.
TABLE 9-4 Comparison of the Employment Status Results for the 13-WeekProgram Survey and UI Wage Record Data. Title II-A Adult Survey Population
First Quarter UI StatusPost ProgramSurvey Status Employed Unemployed Total
Employed 628 (72.8%) 114 (13.2%) 742 (86%)Unemployed 44 (5.1%) 77 (8.9%) 121 (14%)Total 672 (77.9%) 191 (22.1%) 863 (100%)
SOURCE: Baj et al. (1992:39).

298 MEASURING EMPLOYMENT AND INCOME FOR LOW-INCOME POPULATIONS
To look at these factors, the authors used data from the Illinois JTPA man-agement information system, which gives detailed information on the employ-ment status at termination of the program and compares that to UI status attermination. The analysis focuses on 3,387 cases (13.1 percent of the sample) thatreported that JTPA participants were employed at termination, but there was noUI record for the termination quarter. Table 9-5 suggests some explanations forthe mismatches (at the termination quarter). The table shows that out-of-stateemployment accounts for 15.3 percent of the discrepancies (line 1). Identifiableemployment in uncovered (self-employed and federal appointments) sectors ac-counts for 6.6 percent of the discrepancy (lines 2 and 3). The next three rows ofthe table—the within, first-quarter, and second-quarter UI entries—are supposedto reflect timing differences in the data. Collectively these account for 23.1percent of the discrepancy (lines 4, 5, and 6). Another 15.9 percent of the discrep-ancies seem to result from name mismatches between employers that could bereconciled fairly easily. This still leaves 39.1 percent of the remaining sampleunexplained. Of this group of 1,325 participants, there were 1,108 different em-ployers. The potential explanations for the discrepancy that Baj et al. (1992) offerinclude: errors in reporting the Social Security number on the JTPA or UI datasystems, an employer’s neglect of UI reporting requirements, and reporting er-rors by JTPA operators.
Baj et al. (1991) and Baj et al. (1992) examine the existence of employmentin survey and UI data, but do not provide comparisons of earnings as their surveydid not elicit information on earnings. Kornfeld and Bloom (1999) look at bothemployment and earnings. They describe their study as attempting “to determinewhether wage records reported by employers to state unemployment insuranceagencies provide a valid alternative to more costly retrospective sample surveys
TABLE 9-5 Causes for Mismatches: Participants Employed at TerminationWith No UI Record for the Quarter of Termination, Illinois Program Year1987, Title II-A Adult Population
Reason for Mismatch Number of Cases Percent
Employed out of state 517 15.3Self-employed 51 1.5Federal employment 172 5.1Within program UI record 81 2.41st-quarter UI record 608 18.02nd-quarter UI record 93 2.7No related UI record 1,865 55.0No UI record 1,325 39.1Mismatched employers 540 15.9Total 3,387 100.0
SOURCE: Baj et al.(1992:142).
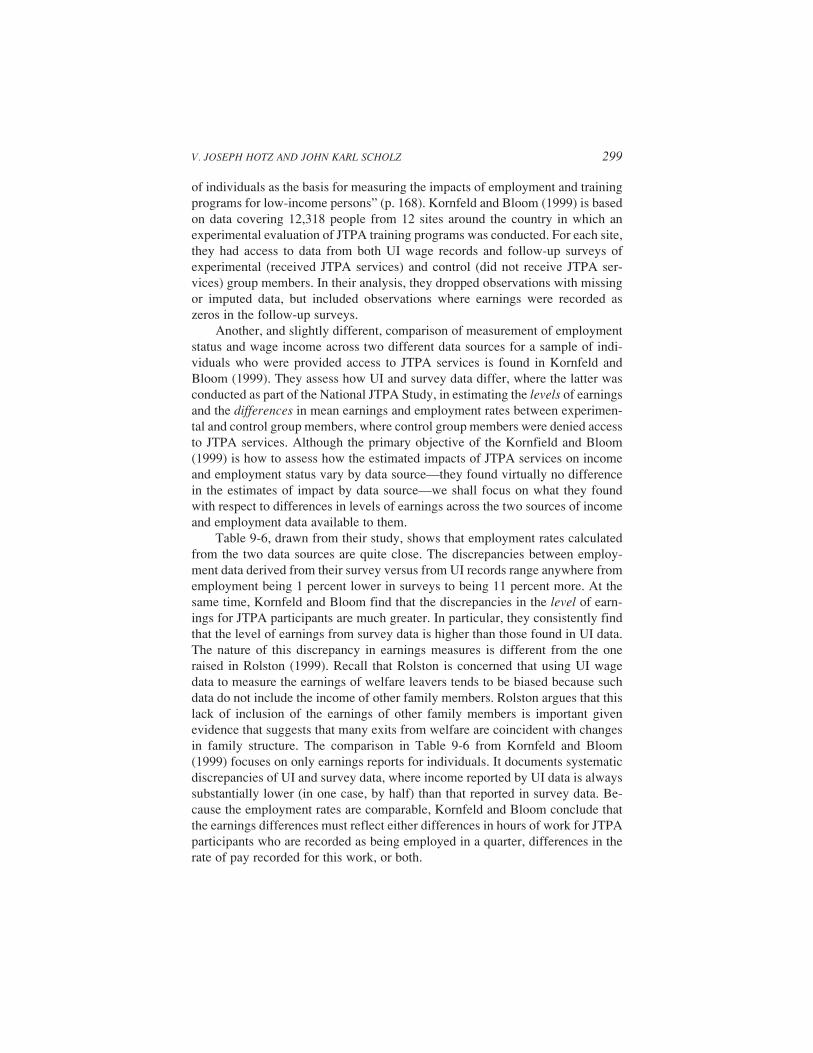
V. JOSEPH HOTZ AND JOHN KARL SCHOLZ 299
of individuals as the basis for measuring the impacts of employment and trainingprograms for low-income persons” (p. 168). Kornfeld and Bloom (1999) is basedon data covering 12,318 people from 12 sites around the country in which anexperimental evaluation of JTPA training programs was conducted. For each site,they had access to data from both UI wage records and follow-up surveys ofexperimental (received JTPA services) and control (did not receive JTPA ser-vices) group members. In their analysis, they dropped observations with missingor imputed data, but included observations where earnings were recorded aszeros in the follow-up surveys.
Another, and slightly different, comparison of measurement of employmentstatus and wage income across two different data sources for a sample of indi-viduals who were provided access to JTPA services is found in Kornfeld andBloom (1999). They assess how UI and survey data differ, where the latter wasconducted as part of the National JTPA Study, in estimating the levels of earningsand the differences in mean earnings and employment rates between experimen-tal and control group members, where control group members were denied accessto JTPA services. Although the primary objective of the Kornfield and Bloom(1999) is how to assess how the estimated impacts of JTPA services on incomeand employment status vary by data source—they found virtually no differencein the estimates of impact by data source—we shall focus on what they foundwith respect to differences in levels of earnings across the two sources of incomeand employment data available to them.
Table 9-6, drawn from their study, shows that employment rates calculatedfrom the two data sources are quite close. The discrepancies between employ-ment data derived from their survey versus from UI records range anywhere fromemployment being 1 percent lower in surveys to being 11 percent more. At thesame time, Kornfeld and Bloom find that the discrepancies in the level of earn-ings for JTPA participants are much greater. In particular, they consistently findthat the level of earnings from survey data is higher than those found in UI data.The nature of this discrepancy in earnings measures is different from the oneraised in Rolston (1999). Recall that Rolston is concerned that using UI wagedata to measure the earnings of welfare leavers tends to be biased because suchdata do not include the income of other family members. Rolston argues that thislack of inclusion of the earnings of other family members is important givenevidence that suggests that many exits from welfare are coincident with changesin family structure. The comparison in Table 9-6 from Kornfeld and Bloom(1999) focuses on only earnings reports for individuals. It documents systematicdiscrepancies of UI and survey data, where income reported by UI data is alwayssubstantially lower (in one case, by half) than that reported in survey data. Be-cause the employment rates are comparable, Kornfeld and Bloom conclude thatthe earnings differences must reflect either differences in hours of work for JTPAparticipants who are recorded as being employed in a quarter, differences in therate of pay recorded for this work, or both.

300 MEASURING EMPLOYMENT AND INCOME FOR LOW-INCOME POPULATIONS
Kornfeld and Bloom (1999) also condition on whether a JTPA participantwas receiving AFDC benefits during a particular quarter and find that, while thelevel of earnings is lower, the discrepancy between survey and UI data is strik-ingly similar. Survey earnings reports for adult women and female youth are 24to 34 percent higher than reported UI earnings levels. There was also wide varia-tion across JTPA sites in the size of earnings discrepancies between survey andUI data, but the survey always yielded larger numbers than did the UI data. The“ratio range” was 1.15 to 1.40 for adult women, 1.16 to 1.72 for adult men, 1.16to 1.76 for female youth and even larger for male youth. Whatever the mecha-nism is generating these discrepancies, it exists across all 12 geographicallydiverse JTPA sites.
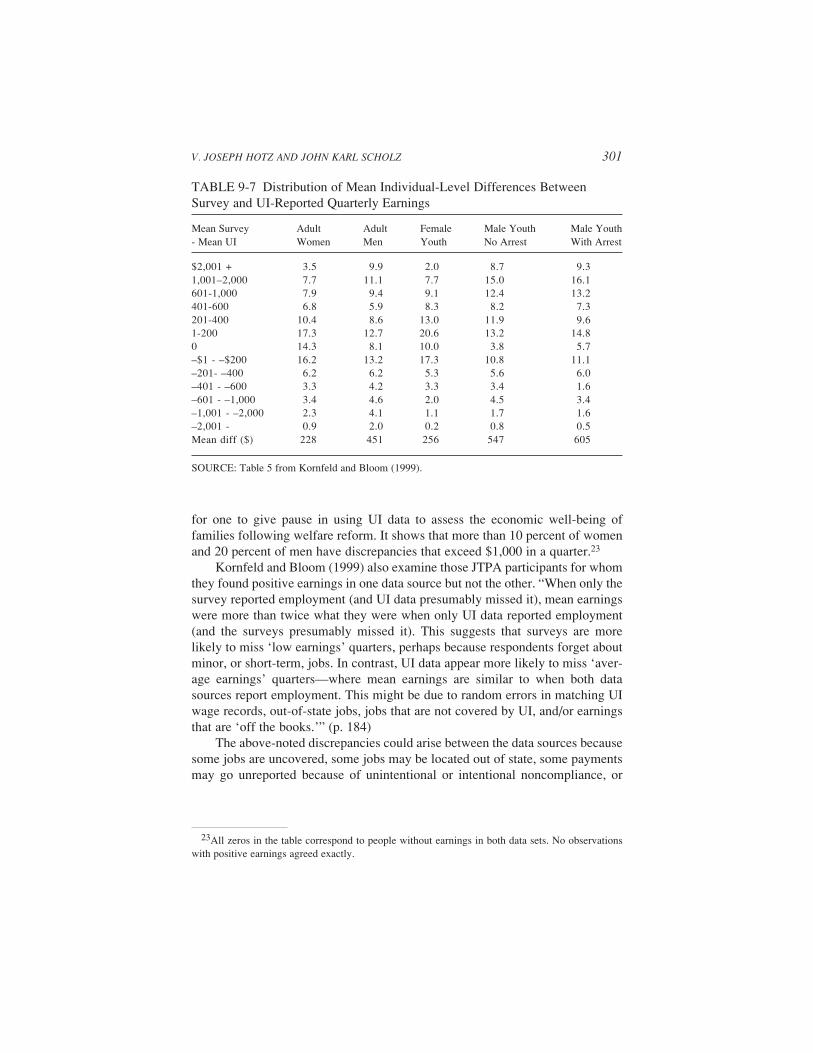
The dispersion of earnings discrepancies is very large, so the means masklarge variations, across earnings reports. We do not know, of course, whichmeasure of earnings more closely resembles the truth. If survey data tend to bemore accurate, however, the discrepancies shown in Table 9-7 would be reason
TABLE 9-6 Comparison of Quarterly Earnings and Employment Rates fromUI and Survey Data
Treatment ControlTreatment Control Employment EmploymentEarnings ($) Earnings ($) Rate (%) Rate (%)
Adult women (4,943; 18,275; 8,916)Survey data 1,294 1,141 59.2 54.5UI data 1,048 922 57.6 54.1Ratio (survey UI) 1.23 1.24 1.03 1.01Adult men (3,651; 13,329; 6,482)Survey data 1,917 1,824 65.8 63.5UI data 1,456 1,398 61.7 60.7Ratio (survey/UI) 1.32 1.30 1.07 1.05Female youth (2,113; 9,452; 4,316)Survey data 951 949 51.3 50.6UI data 701 700 50.6 51.2Ratio (survey/UI) 1.36 1.36 1.01 0.99Male youths without a prior arrest (1,225; 5,009; 2,442)Survey data 1,556 1,655 65.5 69.3UI data 1,015 1,103 61.3 63.2Ratio (survey/UI) 1.53 1.50 1.07 1.10Male youths with a prior arrest (386; 1,646; 705)Survey data 1,282 1,531 58.0 61.3UI data 759 760 52.8 55.0Ratio (survey/UI) 1.69 2.01 1.10 1.11
SOURCE: Kornfeld and Bloom (1999), Tables 1 and 2. Numbers after each panel heading reflect thenumber of persons represented (4,943 adult women) with the number of person-quarters in thetreatment and control groups.
V. JOSEPH HOTZ AND JOHN KARL SCHOLZ 301
for one to give pause in using UI data to assess the economic well-being offamilies following welfare reform. It shows that more than 10 percent of womenand 20 percent of men have discrepancies that exceed $1,000 in a quarter.23
Kornfeld and Bloom (1999) also examine those JTPA participants for whomthey found positive earnings in one data source but not the other. “When only thesurvey reported employment (and UI data presumably missed it), mean earningswere more than twice what they were when only UI data reported employment(and the surveys presumably missed it). This suggests that surveys are morelikely to miss ‘low earnings’ quarters, perhaps because respondents forget aboutminor, or short-term, jobs. In contrast, UI data appear more likely to miss ‘aver-age earnings’ quarters—where mean earnings are similar to when both datasources report employment. This might be due to random errors in matching UIwage records, out-of-state jobs, jobs that are not covered by UI, and/or earningsthat are ‘off the books.’” (p. 184)
The above-noted discrepancies could arise between the data sources becausesome jobs are uncovered, some jobs may be located out of state, some paymentsmay go unreported because of unintentional or intentional noncompliance, or
TABLE 9-7 Distribution of Mean Individual-Level Differences BetweenSurvey and UI-Reported Quarterly Earnings
Mean Survey Adult Adult Female Male Youth Male Youth- Mean UI Women Men Youth No Arrest With Arrest
$2,001 + 3.5 9.9 2.0 8.7 9.31,001–2,000 7.7 11.1 7.7 15.0 16.1601-1,000 7.9 9.4 9.1 12.4 13.2401-600 6.8 5.9 8.3 8.2 7.3201-400 10.4 8.6 13.0 11.9 9.61-200 17.3 12.7 20.6 13.2 14.80 14.3 8.1 10.0 3.8 5.7–$1 - –$200 16.2 13.2 17.3 10.8 11.1–201- –400 6.2 6.2 5.3 5.6 6.0–401 - –600 3.3 4.2 3.3 3.4 1.6–601 - –1,000 3.4 4.6 2.0 4.5 3.4–1,001 - –2,000 2.3 4.1 1.1 1.7 1.6–2,001 - 0.9 2.0 0.2 0.8 0.5Mean diff ($) 228 451 256 547 605
SOURCE: Table 5 from Kornfeld and Bloom (1999).
23All zeros in the table correspond to people without earnings in both data sets. No observationswith positive earnings agreed exactly.

302 MEASURING EMPLOYMENT AND INCOME FOR LOW-INCOME POPULATIONS
Social Security numbers may be misreported. To provide further insight, Kornfeldand Bloom compare the earnings reports that employers make about their em-ployees to state UI systems with those they make to the IRS. Although employershave an incentive to underreport earnings to the UI system (and hence avoidpaying UI taxes), they have no incentive to conceal earnings when reporting tothe IRS, because wages are a business expense that will lower tax payments. Thesample for doing this comparison is smaller than the previous samples becauseeach observation needs to be there for 4 consecutive quarters, corresponding tothe calendar year. The ratio of mean IRS earnings to mean UI earnings rangedfrom 1.14 for adult women to 1.25 for male youth, so UI wage records clearly aremissing earnings from some jobs.
Based on their analysis, Kornfeld and Bloom draw the following conclusionsfrom their investigation.24 Approximately half of the survey-UI earnings differ-ence reflects earnings that are missing from UI wage records (by making use ofthe IRS data). Out-of-state jobs do not explain why UI wage records reportedlower earnings than sample surveys. Uncovered jobs account for only a small partof the survey/UI earnings difference. There is little evidence consistent withrecall bias in the survey data. There is no evidence that large survey discrepanciesresult from survey reports of “unusually good” jobs or weird reports of industryof employment. Survey discrepancies also do not appear to be driven by overtimeor odd pay periods.
From the direct comparisons of the data sources used to measure income andemployment status found in the studies reviewed above, we draw the followingtentative conclusions about the differences between using survey versus UI data:
• Earnings in UI data generally appear be lower than earnings reported insurvey data. The UI data may miss earnings from second or casual jobs. At thesame time, surveys may overstate earnings. Smith (1997) provides a thoroughcomparison of a dataset of JTPA-eligible nonparticipants at 4 of the 16 JTPAtraining centers with data from the SIPP. He provides evidence that his JTPAsurvey may be biased upward, due to nonresponse bias (lower earners are notcovered in the survey) and upward-biased measures of overtime and usual hoursin the survey.
24A third comparative study assessing differences in income and employment across data sourceswas conducted by the Rockefeller Institute of Government (Primus et al., 1999). This study summa-rizes (in its Table 2) six studies that compare UI data and survey data. The studies include five thatwe do not review in this paper and those from Kornfeld and Bloom (1999), which we do review. Theresults from the Rockefeller Institute study differ somewhat from the Kornfeld and Bloom results.One of two other studies finds UI earnings are lower than survey data (though one found them nearlyidentical), like Kornfeld and Bloom. Several other studies suggest that employment rates from sur-veys were significantly higher (on the order of 20 percent) than employment rates from UI data,unlike the Kornfeld and Bloom evidence. We have not assessed the quality of these other studies.

V. JOSEPH HOTZ AND JOHN KARL SCHOLZ 303
• Employment rates derived from UI data are comparable to lower thanthose that result from survey data. We expect UI-based employment rates to belower because of coverage problems with flexible workers and independent con-tractors. Surveys also suffer from nonresponse, however, so undercounts in bothdata sources may be comparable, making the UI-based rates similar to survey-based rates.
Overall Assessment of Using UI Administrative Data toMeasure Income and Employment
Our review of the literature has pointed to three critical concerns that arisewith using UI data to measure the earnings and employment of low-income andwelfare-eligible populations. The concerns are as follows:
• First, earnings are available only for individuals, while changes in familycomposition upon exit from welfare have been shown to have a large bearing oneconomic well-being. UI data do not allow us to track these changes.
• Second, there appears to be a substantial problem with some workersbeing classified as independent contractors, and hence not entering the UI sys-tem. Overall gaps in coverage appear to be at least 13 percent and may besignificantly higher.
• Third, even when wages are reported, they appear to be understated by atleast 11 to 14 percent (based on the Kornfeld and Bloom comparisons with IRSdata) and perhaps more than twice that (based on their comparisons with surveydata). Smith (1997) shows, however, that survey responses also can be biasedupward.
DATA FROM FEDERAL (AND STATE) INCOME TAX RETURNS
Although not widely used in past evaluations, wage and salary data fromfederal and state income tax returns represent an alternative to UI data for mea-suring the income and employment of low-income populations. Here we outlinethe potential strengths and weaknesses of these data sources and briefly summa-rize a recent comparison of UI wage and tax return data for a disadvantagedpopulation drawn from the AFDC caseload in California.
Potential Strengths
Compared to using surveys or UI records, using tax return data for measur-ing the income and employment has at least two potential advantages. These arethe following:

304 MEASURING EMPLOYMENT AND INCOME FOR LOW-INCOME POPULATIONS
• The data are accurate. Taxpayers provide information under the threat ofaudit and there is third-party information reporting, so employers as well asrecipients are reporting wage and salary information.
• The definition of income that is reported is broader than that provided byunemployment insurance data, including, most importantly, self-employment in-come and in cases where a person is married and they file a joint return, spousalincome.25
Potential Weaknesses
Several potential weaknesses are associated with using tax returns data tomeasure income and employment. We summarize several: Note that some ofthese weaknesses apply to the general population, while others are more relevantfor low-income populations. First, the access by researchers to tax returns data isextremely limited and constrained because of Section 6103 of the Internal Rev-enue Code. Section 6103 explicitly states that tax data cannot be released, exceptto organizations specifically designated in Section 6103(j). The exceptions arethe Department of Commerce, but only as it relates to the Census and NationalIncome Accounts, the Federal Trade Commission, the Department of the Trea-sury, and the Department of Agriculture (for conducting the Census of Agricul-ture). Penalties for unauthorized disclosure are severe, including jail terms of upto 5 years.
Second, tax return data also contain only limited information on demographiccharacteristics of taxpayers. For example, the tax system does not collect infor-mation on the race or education of tax filers.
Third, tax-filing units differ from both families and individuals. Marriedcouples can file either a joint return or separate returns (as “married filing sepa-rate”). Cohabiting couples, even if fully sharing resources, will file separatereturns as individuals or head of household (generally meaning the filer is asingle parent with dependents). In general we believe families pool resources sofamilies are the best unit of analysis for assessing economic well-being. Hence,case units probably are the most useful unit of analysis.
Fourth, there also are differences between tax return data and other datasources in the frequency of reporting. Unemployment insurance wages are re-ported quarterly. Transfer program information is reported monthly. Tax returnsare filed annually. Because shorter periods can be aggregated into longer onesand there can be major changes in family composition over time, the annualfrequency of tax reporting is less appealing than monthly or quarterly reporting inother data sets. To the extent that family structure changes over these intervals,problems may arise when trying to link different data sets to assess well-being.
25It also will include interest and dividend income, farm income, capital gains and losses, andgambling winnings, and indicate recipients of government transfers and Social Security benefits.
V. JOSEPH HOTZ AND JOHN KARL SCHOLZ 305
A fifth concern relates to the incidence and accuracy of tax filing by indi-viduals and households, especially among low-income populations. This concerntakes two forms: (1) whether people file any tax return, and (2) if they file,whether they report all sources of income to the IRS (or state taxing authori-ties).26 We consider each in turn.
If large fractions of low-income taxpayers do not file tax returns, then taxreturn data have very limited value. Unfortunately, there is not a lot of informa-tion on the filing propensities of people with low income. Information from theearly 1990s (Scholz, 1994) suggests that 14 to 20 percent of those entitled to theearned income tax credit at the time failed to receive it, meaning that they failedto file tax returns.27 Later, we discuss one recent study on the tax filing propensi-ties of a low-income population that sheds some preliminary light on this issue.
Among filing units, it is also possible that their members do not report all oftheir sources of income on their tax returns. For example, individuals may fail tofile income received as independent contractors. Although firms or individualswho use independent contractors are obligated to report payments to such con-tractors to the IRS, failures to do this generally are difficult to detect. Again, weknow little about the incidence of underreporting of various income sources forlow-income populations.
To summarize, using tax return data to measure income and employment hasseveral potential weaknesses. These are the following:
• Gaining access to tax returns is difficult.• The data provide limited information on demographic and other charac-
teristics.• Some low-income workers may not file, despite being eligible for the
earned income tax credit, or may not report all their income.
Comparison of Income Reporting from UI Wage andIRS Tax Filings Data for a Low-Income Population
In a recent study of the EITC for a sample of assistance units on the Califor-nia caseload, Hill et al. (1999) compared UI wage data with linked data from the
26If one is just interested in enumerating the population (as opposed to knowing incomes associ-ated with families and individuals within the population), IRS data appear to be comprehensive.Sailer and Weber (1999) report that the IRS population count is 95.4 percent of the Census popula-tion count. The consistency is fairly good across gender, age, and state. Unfortunately, for many ofthe people enumerated, the IRS does not know anything about them other than that they exist.
27Cilke (1998) uses a CPS-IRS exact match file to examine the characteristics of people who arenot required to file tax returns and actually did not file tax returns. The entire paper is presented asproportions, however, so it does not provide information on the absolute number of low-incomefamilies with earnings who fail to file.

306 MEASURING EMPLOYMENT AND INCOME FOR LOW-INCOME POPULATIONS
sample members’ IRS tax returns. The study used data from the California WorkPays Demonstration Project (CWPDP), which was conducted in four counties(Alameda, Los Angeles, San Bernardino, and San Joaquin) starting in 1992. Thedata consisted of two sets of assistance units drawn from the caseloads in thesecounties. One set, which is used for the sample in Table 9-8, consisted of arandom sample drawn from a caseload at a particular date in 1992. Although thissample is representative of the caseload at that time, recall that the study by Baneand Ellwood (1983) showed that random samples from the existing caseload ofAFDC are disproportionately made up of assistance units that are “welfare de-pendent.”
The second set of assistance units, which is the sample used for Table 9-9, isa random sample of new entrants to the caseload in 1993. Bane and Ellwood(1983) and others have found that a significant proportion of new entrants remainon welfare for only a relatively short period.28 Furthermore, Gritz and MaCurdy(1991) find that most new entrants exit from AFDC to employment. We alsobreak both samples up into female-headed households (Aid to Families withDependent Children-Family Group AFDC-FG cases) and two-parent households(AFDC-U). We report on annual earnings information for the year after thesamples were drawn, that is, 1993 for the random sample of the caseload and1994 for the new entrants sample.29
The first two lines of each panel of each table give estimates of the employ-ment rates of each sample of AFDC recipients. As expected, employment rates ofthe point-in-time caseload (Table 9-8) are lower than the sample of new entrants(Table 9-9). Employment rates of one-parent cases (AFDC-FG) are lower thanthe employment rates of two-parent cases (Aid to Families with Dependent Chil-dren-Unemployed Parent [AFDC-U]). What is striking and not necessarily ex-pected, however, is that the implied employment rates using UI data and using taxreturn data are nearly identical. From Table 9-8, employment rates of the point-in-time AFDC-FG caseload were 26 percent using UI data and 22 percent usingtax return data. The corresponding rates for AFDC-U cases were 31 percent forboth data sources. Employment rates were 37 percent using UI data for the newentrant sample and 33 percent using tax returns. Employment rates were 48percent using UI data for the AFDC-U new entrants and 49 percent using taxreturns.
28For example, Bane and Ellwood (1983) estimate that 65 percent of new entrants leave thecaseload in 2 years.
29Through an interagency agreement between the California Department of Social Services (CDSS)and the state’s taxing authority, the Franchise Tax Board (FTB), UI wages and wages and adjustedgross income (AGI) from tax returns were merged by the FTB. The researchers were able to specifycomputer runs on these merged files. Assistance units in the study could, and did, leave AFDC afterthey were enrolled in this study. Nonetheless, wage and income data from UI records and tax returnswere available for all of the original assistance units in the CWPDP study.
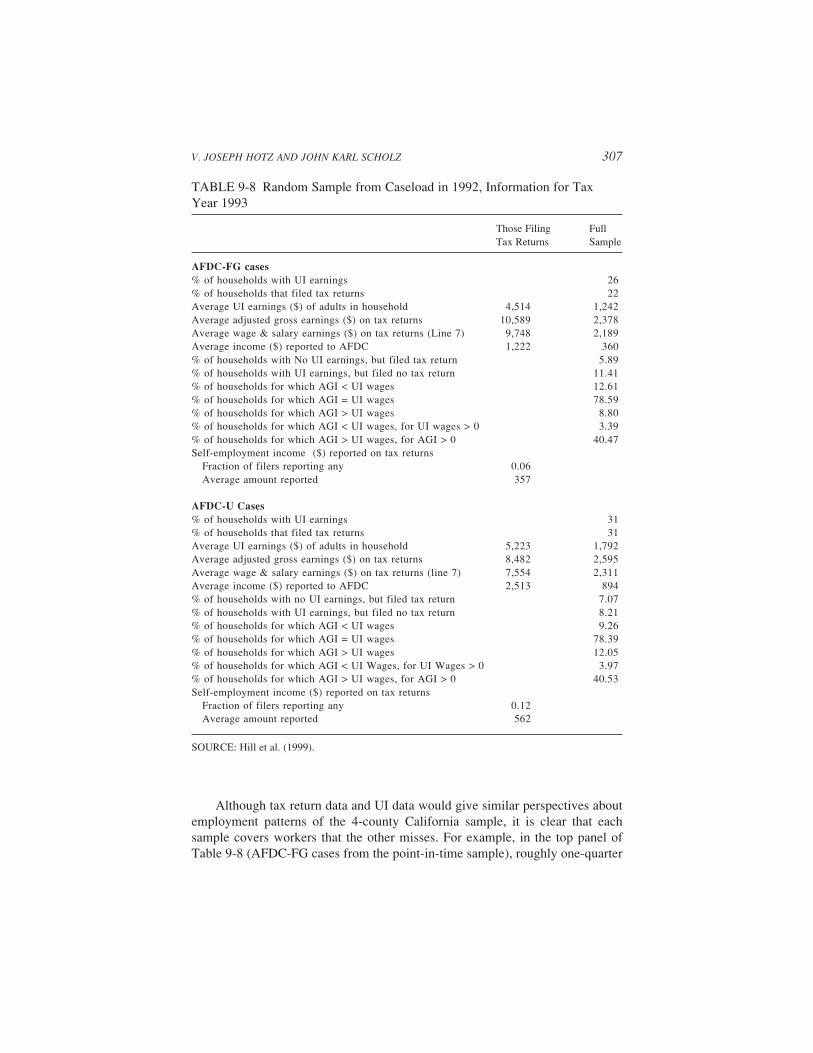
V. JOSEPH HOTZ AND JOHN KARL SCHOLZ 307
Although tax return data and UI data would give similar perspectives aboutemployment patterns of the 4-county California sample, it is clear that eachsample covers workers that the other misses. For example, in the top panel ofTable 9-8 (AFDC-FG cases from the point-in-time sample), roughly one-quarter
TABLE 9-8 Random Sample from Caseload in 1992, Information for TaxYear 1993
Those Filing FullTax Returns Sample
AFDC-FG cases% of households with UI earnings 26% of households that filed tax returns 22Average UI earnings ($) of adults in household 4,514 1,242Average adjusted gross earnings ($) on tax returns 10,589 2,378Average wage & salary earnings ($) on tax returns (Line 7) 9,748 2,189Average income ($) reported to AFDC 1,222 360% of households with No UI earnings, but filed tax return 5.89% of households with UI earnings, but filed no tax return 11.41% of households for which AGI < UI wages 12.61% of households for which AGI = UI wages 78.59% of households for which AGI > UI wages 8.80% of households for which AGI < UI wages, for UI wages > 0 3.39% of households for which AGI > UI wages, for AGI > 0 40.47Self-employment income ($) reported on tax returns
Fraction of filers reporting any 0.06Average amount reported 357
AFDC-U Cases% of households with UI earnings 31% of households that filed tax returns 31Average UI earnings ($) of adults in household 5,223 1,792Average adjusted gross earnings ($) on tax returns 8,482 2,595Average wage & salary earnings ($) on tax returns (line 7) 7,554 2,311Average income ($) reported to AFDC 2,513 894% of households with no UI earnings, but filed tax return 7.07% of households with UI earnings, but filed no tax return 8.21% of households for which AGI < UI wages 9.26% of households for which AGI = UI wages 78.39% of households for which AGI > UI wages 12.05% of households for which AGI < UI Wages, for UI Wages > 0 3.97% of households for which AGI > UI wages, for AGI > 0 40.53Self-employment income ($) reported on tax returns
Fraction of filers reporting any 0.12Average amount reported 562
SOURCE: Hill et al. (1999).

308 MEASURING EMPLOYMENT AND INCOME FOR LOW-INCOME POPULATIONS
of people (5.89/22) who filed tax returns had no corresponding UI record.30 Over40 percent (11.41/26) of those with positive UI earnings did not file taxes.31 Of
TABLE 9-9 Random Sample of New Entrants to AFDC Caseload in 1993,Information for Tax Year 1994
Those Filing FullTax Returns Sample
AFDC-FG cases% of households with UI earnings 37% of households that filed tax returns 33Average UI earnings ($) of adults in household 6,769 2,868Average adjusted gross earnings ($) on tax returns 13,185 4,342Average wage & salary earnings ($) on tax returns (Line 7) 12,575 4,141Average income ($) reported to AFDC 1,625 709% of households with no UI earnings, but filed tax return 8.34% of households with UI earnings, but filed no tax return 13.55% of households for which AGI < UI wages 15.69% of households for which AGI = UI wages 71.31% of households for which AGI > UI wages 13.00% of households for which AGI < UI wages, for UI wages > 0 4.21% of households for which AGI > UI wages, for AGI > 0 39.88Self-employment income ($) reported on tax returns
Fraction of filers reporting any 0.04Average amount reported 95
AFDC-U cases% of households with UI earnings 48% of households that filed tax returns 49Average UI earnings ($) of adults in household 8,516 5,138Average adjusted gross earnings ($) on tax returns 12,970 6,360Average wage & salary earnings ($) on tax returns (Line 7) 11,421 5,601Average income ($) reported to AFDC 3,264 1,831% of households with no UI earnings, but filed tax return 10.45% of households with UI earnings, but filed no tax return 7.94% of households for which AGI < UI wages 11.77% of households for which AGI = UI wages 64.71% of households for which AGI > UI wages 23.51% of households for which AGI < UI wages, for UI Wages > 0 6.12% of households for which AGI > UI wages, for AGI > 0 46.83Self-employment income ($) reported on tax returns
Fraction of filers reporting any 0.11Average amount reported 512
SOURCE: Hill et al. (1999).
30We took great care in the analysis to make sure the comparison samples did not have changes inmarital status and had a full four quarters of UI data (including zero quarters).
31Households with low earnings are not obligated to file tax returns. For example, a married
V. JOSEPH HOTZ AND JOHN KARL SCHOLZ 309
those with both UI and tax return earnings, more than 40 percent reported moreearnings on tax returns than would be expected based on UI data. Similar figuresapply to each other group, though for AFDC-U cases, only about 20 percent ofthe cases with UI earnings do not file tax returns.
The fact that across all four groups (two samples, and AFDC-FG and AFDC-U cases), tax return income exceeded UI income in at least 40 percent of the caseswith positive earnings from both sources, is consistent with households from thiswelfare-based population having earnings that are not from covered employment.The fact does not seem to be explained by people leaving welfare (throughchanges in family structure). Among AFDC-FG cases, only 1 to 13 percent ofthese households had no months on AFDC during the tax reference year andbetween 56 and 83 percent were on welfare for 9 to 12 months during that year.There is also little evidence that self-employment income plays an important rolein earnings differences between tax return and UI income.
Based on comparisons between UI and tax return data, we offer severaltentative conclusions:
• Tax return and UI data appear to give very similar information on em-ployment rates of the four-county California caseload. There are good reasons,however, to think that both data sources will lead to underestimates. UI data willmiss independent contractors and possibly other “flexible workers.” Tax returndata will miss families who do not file tax returns.
• The two data sources appear highly complementary. Each appears to cap-ture a significant number of families that the other misses. Using them together,therefore, should result in more accurate measures of the employment experi-ences of the caseload than using either separately.
• Tax return data have a broader definition of income and, if the householdunit is married, will cover both spouses and hence are likely to offer more accu-rate income information.
• UI data are much easier to access than tax returns.
RECOMMENDATIONS
Taking into account all of the features of a data source, including not only itsaccuracy but also its cost and ease of access, it appears that no single source canbe declared “preferred.” The inability to find a preferred data source is inevitablegiven the differences in the desired uses of data, the constraints imposed bybudgets for data collection, and the access limitations to data. The fact that UI
couple, is not required to file if their income is below the standard deduction and two exemptions($12,200 in 1997), regardless of how many children they have. Hill et al. (1999) also show that mostof these non filers had very low levels of UI earnings ($2,500 or less in annual covered earnings).
310 MEASURING EMPLOYMENT AND INCOME FOR LOW-INCOME POPULATIONS
wage data are inexpensive, timely to obtain, and available at the state level, forexample, implies that they will continue to be a focal data set for state-levelevaluations of welfare reform. But our review raises a number of serious ques-tions about UI data. In the remainder of this paper, we highlight selected issuesthat we believe need further attention in the hopes of encouraging future researchon at least some of them.
Certain questions related to welfare reform can only be answered with na-tionally representative data sets, such as the CPS or SIPP. While Moore et al.(1990) and Roemer (1999a) conclude that income, especially labor earnings, aremeasured well in the CPS and SIPP, there are, in our view, several importantquestions that remain with respect to income and employment measurements forlow-income populations with national surveys. The questions are as follows:
• First, none of these studies, to our knowledge, focus on the reporting ofincome by disadvantaged, welfare-eligible, and/or welfare-prone populations.
• Second, as noted in Primus et al. (1999), participation in welfare pro-grams is underreported in the CPS (and the SIPP). Moreover, this underreportingappears to have increased over time. This is a troubling problem, especially asone looks to the future when TANF programs become state specific, with differ-ent names.
Recommendation 1: We would like to see further work on the sources of anti-poverty program underreporting and its origins in nationally representative sur-vey data.
Plans are under way for some of the needed work. Professor Hotz is aprincipal investigator on a project recently approved by the U.S. Census Bureauto match data from UI wage records and administrative data on AFDC/TANFparticipation for the California subsamples of several waves of the SIPP.32 Thework of this project should yield some more recent information on both thewelfare participation underreporting and income reporting issues. This study—orcomparable ones done with matches of the SIPP with administrative data for thesubsamples from other states— also may provide some insight into the impact ofchanges in family structure on income reporting for welfare leavers by exploitingthe (limited) panel structure of the SIPP.
Further research also is needed on the use of UI wage records to measure theincome of low-income and welfare-prone populations. While the Kornfeld andBloom (1999) evaluation suggested that UI wage data and survey data producedsimilar estimates of the impact of a social program (i.e., JTPA-funded trainingprograms) on earnings and employment, their study also found that averageearnings of JTPA-eligible individuals were consistently lower than those based
32The other investigators on this project are in collaboration with David Card, Andrew Hildreth,and Michael Clune at University of California-Berkeley and Robert Schoeni at RAND.
V. JOSEPH HOTZ AND JOHN KARL SCHOLZ 311
on survey data. Furthermore, the study by Hill et al. (1999) also found that UIwage data produced substantially lower estimates of earnings than did tax returnsdata for a welfare-based population drawn from the California AFDC caseload.Learning more about the quality of this data source for measuring income isextremely important because UI wage data presumably will continue to be a coreresource in state and local evaluations of the effects of welfare reform.
Several issues related to UI wage data appear to need further scrutiny. First,the studies by Burgess and his coauthors raises important concerns about the“coverage” of UI and tax returns, particularly for the low-income population.
Recommendation 2: It would be extremely useful to follow the helpful lead ofthe various Burgess studies to closely examine the coverage and trends in cover-age of low-income populations with UI data. Such an examination could be aidedby using a match of UI data with respondents in a national survey, such as theSIPP, so that one could learn more about the demographic characteristics ofindividuals (and households) that report labor market earnings on a survey thatare not recorded in UI wage records data.
• States may be able to augment UI data used for evaluation of welfarereform by collecting supplemental information on the degree to which employersare designating workers as independent contractors. Additional work at the statelevel to assess the overall coverage of UI data also would be valuable.
Second, more work is needed to understand the extent to which UI wage dataprovide a misleading measure of the earnings available to low-income house-holds. This problem arises in short- and long-term follow-up analyses of earningsfor welfare samples drawn from state caseloads. One can use UI data to measuresubsequent earnings for individuals who were in assistance units as long as theyremain on welfare. However, as noted by Rolston (1999), one may not be able toaccurately measure household income after assistance units leave the rolls be-cause it is difficult to keep track of the identities of household members. Theevidence provided in the Meyer and Cancian (1998) and Hill et al. (1999) studiessuggest that this may be a serious problem.
Recommendation 3: To learn more about family well-being, it will be necessaryto continue to rely on targeted follow-up surveys to monitor samples of welfareleavers. Unfortunately surveys are expensive. We recommend that a pilot studybe undertaken to devise a survey that is designed just to obtain Social Securitynumbers of other adults in a household, which can then be used to obtain UI wageearnings for these family members.
• It might be useful for state TANF agencies to analyze the methods thattheir JTPA agencies use to gather follow-up earnings data on terminees from
312 MEASURING EMPLOYMENT AND INCOME FOR LOW-INCOME POPULATIONS
their programs. Such follow-up assessments are required under JTPA, and manystates have contracted with firms and/or universities to gather these follow-updata.
• Tax returns data also may be useful to learn more about whether thediscrepancies between UI wage data and income measures from tax returns notedin that study are the result of differences in family composition and the “compo-sition” of income reported on tax returns.
A third issue relates to the possibility that wage earnings are missed becauseindividuals move out of the state from which UI wage data are drawn or becauseworkers earn part of their income in other states. Again, comparisons of UI wagedata with data from federal tax returns may help us to assess the importance ofthis problem and, more importantly, the biases that it imparts on measures ofindividual and household income. To learn more, it may be useful to take a closerlook at what is known about the interstate mobility of disadvantaged and welfare-prone populations, such as the work done on movements of welfare populationsin response to “welfare magnets,” as in Meyer (1999) and the citations therein,and the implications this mobility has for the coverage of low-income workers inUI data.
REFERENCES
Abraham, Katherine G., James R. Spletzer, and Jay C. Stuart1998 Divergent trends in alternative wage series. Pp. 293-324 in Labor Statistics Measurement
Issues, J. Haltiwanger, M. Manser, and R. Topel, eds. National Bureau of EconomicResearch Studies in Income and Wealth, Volume 60. University of Chicago Press.
Baj, John, Sean Fahey, and Charles E. Trott1992 Using unemployment insurance wage-record data for JTPA performance management. In
Chapter 4 of Research Report 91-07. Chicago: National Commission for EmploymentPolicy.
Baj, John, Charles E. Trott, and David Stevens1991 A Feasibility Study of the Use of Unemployment Insurance Wage-Record Data as an
Evaluation Tool for JTPA: Report on Project Phase 1 Activities. Chicago: National Com-mission on Employment Policy, January.
Bane, Mary Jo, and David T. Ellwood1983 The Dynamics of Dependence: The Routes to Self-Sufficiency. Prepared for the U.S. De-
partment of Health and Human Services, Office of the Assistant Secretary for Planningand Evaluation. Cambridge, MA: Urban Systems Research and Engineering, Inc.
Blakemore, Arthur E., Paul L. Burgess, Stuart A. Low, and Robert D. St. Louis1996 Employer tax evasion in the unemployment insurance program. Journal of Labor Eco-
nomics 14(2):210-230.Bogen, Karen, Meredith Lee, Julia Klein Griffiths, and Anne Polivka
1997 Income Supplement—Summary and Recommendations from Cognitive Interviews, Un-published paper, Bureau of the Census, Bureau of Labor Statistics, September.

V. JOSEPH HOTZ AND JOHN KARL SCHOLZ 313
Bogen, Karen1998 Once Upon a Time, There Was Welfare Reform: Evaluating the New March CPS Wel-
fare-Related Questions: Results from the 1998 Respondent Debriefing. Unpublished pa-per, Bureau of the Census, June.
Bollinger, Christopher R., and Martin H. David2001 Estimation with response error and non-response: Food stamp participation in the SIPP.
Journal of Business and Economic Statistics 19(a):129-141.Bound, John, and Alan B. Krueger
1991 The extent of measurement error in longitudinal earnings data: Do two wrongs make aright? Journal of Labor Economics 9(1):1-24.
Burgess, Paul L., Arthur E. Blakemore, and Stuart A. Low1996 Using statistical profiles to improve unemployment insurance tax compliance. Research
in Employment Policy 1:243-2711.Cancian, Maria, Robert Haveman, Thomas Kaplan, and Barbara Wolfe
1999 Post-Exit Earnings and Benefit Receipt Among Those Who Left AFDC in Wisconsin.Institute for Research on Poverty, Special Report No. 75. Madison, WI: University ofWisconsin.
Cilke, Jim1998 A Profile of Non-Filers. OTA Paper #78, Office of Tax Analysis, U.S. Department of
Treasury, Washington, DC.Coder, J., and L.S. Scoon-Rogers
1996 Evaluating the Quality Income Data Collection in the Annual Supplement to the MarchCurrent Population Survey and the Survey of Income and Program Participation. SIPPWorking Paper 96-04.
Coder, John1992 Using administrative record information to evaluate the quality of the income data col-
lected in the SIPP. Pp. 295-306 in Proceedings of Statistics Canada Symposium 92:Design and Analysis of Longitudinal Surveys, Ottawa: Statistics Canada.
Goodreau, K., H. Oberheu, and D. Vaughan1984 An assessment of the quality of survey reports of income from the Aid to Families with
Dependent Children (AFDC) program. Journal of Business and Economic Statistics 2:179-186.
Greenberg, David, and Harlan Halsey1983 Systematic misreporting and the effects of income maintenance experiments on work
effort: Evidence from the Seattle-Denver experiment. Journal of Labor Economics 1:380-407.
Gritz, R.M, and T. MaCurdy 1991 Patterns of Welfare Utilization and Multiple Program Participation Among Young
Women. Report to the U.S. Department of Health and Human Services under Grant 88-ASPE 198A.
Halsey, Harlan1978 Validating income data: Lessons from the Seattle and Denver income maintenance ex-
periment, pp. 21-51 in Proceedings of the Survey of Income and Program ParticipationWorkshop, U.S. Department of Health, Education and Welfare, Washington, DC.
Hill, Carolyn, V.J. Hotz, Charles Mullin, and John Karl Scholz1999 EITC Eligibility, Participation and Compliance Rates for AFDC Households: Evidence
from the California Caseload. Report submitted to the California Department of SocialServices, April.

314 MEASURING EMPLOYMENT AND INCOME FOR LOW-INCOME POPULATIONS
Houseman, Susan N.1999 Flexible Staffing Arrangements: A Report on Temporary Help, On-Call, Direct-Hire Tem-
porary, Leased, Contract Company, and Independent Contractors Employment in theUnited States, August. Available: http://www.dol.gov/asp/futurework/conference/staffing/intro.htm [September 7, 2001]
Internal Revenue Service1996 Federal Tax Compliance Research: Individual Income Tax Gap Estimates for 1985, 1988,
and 1992. Publication 1415 (Rev. 4-96). Washington, DC.Kornfeld, Robert, and Howard S. Bloom
1999 Measuring program impacts on earnings and employment: Do unemployment insurancewage reports from employers agree with surveys of individuals? Journal of Labor Eco-nomics 17(January):168-197.
Lamas, E., T. Palumbo, and J. Eargle1996 The Effect of the SIPP Redesign on Employment and Earnings Data. SIPP Working
Paper 9606.Lamas, E., J. Tin, and J. Eargle
1994 The Effect of Attrition on Income and Poverty Estimates from the Survey of Income andProgram Participation (SIPP). SIPP Working Paper 190.
Marquis, K.H., and C.J. Moore1990 Measurement errors in SIPP program reports. Pp. 721-745 in Proceedings of the Bureau
of the Census 1990 Annual Research Conference.Meyer, Daniel R., and Maria Cancian
1998 Economic well-being following an exit from Aid to Families with Dependent Children.Journal of Marriage and the Family 60(2):479-492.
Meyer, Bruce D.1999 Do the Poor Move to Receive Higher Welfare Benefits? Unpublished paper, Northwest-
ern University Economics Department, October.Moore, J., K. Marquis, and K. Bogen
1996 The SIPP Cognitive Research Evaluation Experiment: Basic Results and Documentation.Bureau of the Census, January.
Moore, Jeffrey C., Linda L. Stinson, and Edward J. Welniak, Jr.1997 Income Measurement Error in Surveys: A Review. Statistical Research Report. U.S. Cen-
sus Bureau.Nelson, Charles T., Marc I. Roemer, Daniel H. Weinberg, and Edward J. Welniak, Jr.
1998 Fifty Years of United States Income Data from the Current Population Survey. Unpub-lished paper, Housing and Household Economics Statistics Division, Bureau of the Cen-sus. December.
Polivka, Anne P.1997 Using Earnings Data from the Current Population Survey After the Redesign. Unpub-
lished paper. Bureau of Labor Statistics.1998 Note on the Possible Effects of Welfare Reform on Labor Market Activities: What Can
Be Gleaned from the March CPS. Unpublished paper, Bureau of Labor Statistics. Decem-ber 1.
Primus, Wendell, Lynette Rawlings, Kathy Larin, and Kathryn Porter1998 After Welfare: A Study of Work and Benefit Use After Case Closing in New York State.
Revised interim report submitted to the Office of the Assistant Secretary for Planning andEvaluation, U.S. Department of Health and Human Services, December.
1999 The Initial Impacts of Welfare Reform on the Incomes of Single-Mother Families. Wash-ington, DC: Center for Budget and Policy Priorities.Rockefeller Institute of Government.

V. JOSEPH HOTZ AND JOHN KARL SCHOLZ 315
Rodgers, Willard L., Charles Brown, and Greg J. Duncan1993 Errors in survey reports of earnings, hours worked, and hourly wages. Journal of Ameri-
can Statistical Association 88(December):1208-1218.Roemer, Marc
1999 Assessing the Quality of the March Current Population Survey and the Survey of Incomeand Program Participation Income Estimates, 1990-1996. Unpublished paper, IncomeStatistics Branch, Bureau of the Census, June 16.
2000 Reconciling March CPS Money Income with the National Income and Product Accounts:An Evaluation of CPS Quality. Unpublished paper, Income Statistics Branch, Bureau ofthe Census, August 10.
Rolston, Howard1999 The Income of Former Welfare Recipients. Unpublished paper, Administration on Chil-
dren and Families, U.S. Department of Health and Human Services, September 21.Sailer, Peter, and Michael Weber
1999 The IRS population count: An Update. Pp. 85-89, In Turning Administrative Systems intoInformation Systems.
Scholz, John Karl1994 The earned income tax credit: Participation, compliance and anti-poverty effectiveness.
National Tax Journal (March):59-81.Shroder, Mark, and Marge Martin
1996 New Results from Administrative Data: Housing the Poor, or, What They Don’t KnowMight Hurt Somebody. Unpublished paper, Office of Policy Development and Research,U.S. Department of Housing and Urban Development.
Smith, Jeffrey1997 Measuring Earnings Levels Among the Poor: Evidence from Two Samples of JTPA
Eligibles. Unpublished paper, Department of Economics, University of Western Ontario,June.
Stevens, David W., Liping Chen, and Jinping Shi1994 The Use of UI Wage Records for JTPA Performance Management in Maryland. Unpub-
lished paper, The Jacob France Center at the University of Baltimore, September 19.U.S. Department of Commerce, Bureau of the Census
1998 SIPP Quality Profile, 1998. SIPP Working Paper Number 230, Third Edition.Wisconsin Department of Workforce Development
1999 Differences Between AFDC and W-W Leavers Survey Data for January-March 1998 andWisconsin’s UI Wage Records for 1998. DWD MEP Folio Brief 01-99, October 19.
Yen, W., and H. Nelson1996 Testing the Validity of Public Assistance Surveys with Administrative Records: A Vali-
dation Study of Welfare Survey Data, unpublished manuscript, May 1996.