9. reference tables
TRANSCRIPT

Section 9. Reference Tables - 2019 Page 1 of 15
This publication is available free of charge from: https://doi.org/10.6028/N
IST.IR.6969-2019
9. Reference Tables
Table 9.1 Use of Range to Estimate Standard Deviation
Table 9.2 Z Factors for Two-sided Confidence Intervals
Table 9.3 Student t-Variate (for Two-Sample t-Test for Equal Means)
Table 9.4 Critical Values for the F-test, F0.975
Table 9.5 Critical Values for the F-test, F0.99
Table 9.6 Two-sided Tolerance Interval Factors
Table 9.7 Factors for Computing Two-sided Confidence Intervals for α
Table 9.8 Density of Air-free Water
Table 9.9 Density of Air
Table 9.10 Coefficient of Linear and Cubical Expansion for Materials Commonly Used in Laboratory Apparatus and Standards
Table 9.11 A Short Table of Random Numbers
Table 9.12 Critical Values for the F-test, F0.95
Table 9.13 Critical Values for the F-test, Fmax

Section 9. Reference Tables - 2019 Page 2 of 15
This publication is available free of charge from: https://doi.org/10.6028/N
IST.IR.6969-2019
Table 9.1 Use of Range to Estimate Standard Deviation
Number of Sets of
Replicates k
Factor Degrees of Freedom
Number of Replicates in a Set
2 3 4 5 6
1 *2d υ
1.41 1.00
1.91 1.98
2.24 2.93
2.48 3.83
2.67 4.68
3 *2d υ
1.23 2.83
1.77 5.86
2.12 8.44
2.38 11.1
2.58 13.6
5 *2d υ
1.19 4.59
1.74 9.31
2.10 13.9
2.36 18.4
2.56 22.6
10 *2d υ
1.16 8.99
1.72 18.4
2.08 27.6
2.34 36.5
2.55 44.9
15 *2d υ
1.15 13.4
1.71 27.5
2.07 41.3
2.34 54.6
2.54 67.2
20 *2d υ
1.14 17.8
1.70 36.5
2.07 55.0
2.33 72.7
2.54 89.6
∞ *2d 1.13 1.69 2.06 2.33 2.53
*2d
Rsp =
Intermediate values for d2* and ν may be obtained by interpolation, or from the reference from which this
table was adapted. Example: When using a Range chart for volume calibrations, based on two runs for each unknown test item, the d2
* value is 1.41. If testing 10 points on a tape measure, using 3 runs, the average range value is calculated for all points and d2
* is 1.72. Adapted from Lloyd S. Nelson, J. Qual. Tech. 7 No. 1, January 1975. ©American Society for Quality Control, Reprinted by permission.

Section 9. Reference Tables - 2019 Page 3 of 15
This publication is available free of charge from: https://doi.org/10.6028/N
IST.IR.6969-2019
Table 9.2 Z-Factors for Two-sided Confidence Intervals for the Normal Distribution
Confidence Level
(%) Z Factor
50 0.68
67 1.00
75 1.15
90 1.645
95 1.960
95.28 2.000
99.00 2.575
99.74 3
99.993 4 4
99.999 95 5
100, 10-9 6
100, 10-12 7
100, 10-15 8
100, 10-18.9 9
100, 10-23 10

Section 9. Reference Tables - 2019 Page 4 of 15
This publication is available free of charge from: https://doi.org/10.6028/N
IST.IR.6969-2019
Table 9.3 Student t-Variate
* 80 % 90 % 95 % 98 % 99 % 99.73 %
d.f. t0.90 t0.95 t0.975 t0.99 t0.995 t0.9985
1 3.078 6.314 12.706 31.821 63.657 235.80
2 1.886 2.920 4.303 6.965 9.925 19.207
3 1.638 2.353 3.182 4.541 5.841 9.219
4 1.533 2.132 2.776 3.747 4.604 6.620
5 1.476 2.015 2.571 3.365 4.032 5.507
6 1.440 1.943 2.447 3.143 3.707 4.904
7 1.415 1.895 2.365 2.998 3.499 4.530
8 1.397 1.860 2.306 2.896 3.355 4.277
9 1.383 1.833 2.262 2.821 3.250 4.094
10 1.372 1.812 2.228 2.764 3.169 3.957
11 1.363 1.796 2.201 2.718 3.106 3.850
12 1.356 1.782 2.179 2.681 3.055 3.764
13 1.350 1.771 2.160 2.650 3.012 3.694
14 1.345 1.761 2.145 2.624 2.977 3.636
15 1.341 1.753 2.131 2.602 2.947 3.586
16 1.337 1.746 2.120 2.583 2.921 3.544
17 1.333 1.740 2.110 2.567 2.898 3.507
18 1.330 1.734 2.101 2.552 2.878 3.475
19 1.328 1.729 2.093 2.539 2.861 3.447
20 1.325 1.725 2.086 2.528 2.845 3.422
25 1.316 1.708 2.060 2.485 2.787 3.330
30 1.310 1.697 2.042 2.457 2.750 3.270
40 1.303 1.684 2.021 2.423 2.704 3.199
60 1.296 1.671 2.000 2.390 2.660 3.130
∞ 1.282 1.645 1.960 2.326 2.576 3.00 * Columns to be used in calculating corresponding two-sided confidence interval. From: NIST Handbook 91 p. T-5; Last column from B.J. Joiner, J. Research NIST. (for Two-Sample t-Test for Equal Means)

Section 9. Reference Tables - 2019 Page 5 of 15
This publication is available free of charge from: https://doi.org/10.6028/N
IST.IR.6969-2019
Table 9.4 Critical values for the F-Test, F0.975 n1 = degrees of freedom for numerator n2 = degrees of freedom for denominator
n1 n2
1 2 3 4 5 6 7 8 9 10 12 15 20 24 30 40
1 647.8 799.5 864.2 899.6 921.8 937.1 948.2 956.7 963.3 968.6 976.7 984.9 993.1 997.2 1001 1006
2 38.51 39.00 39.17 39.25 39.30 39.33 39.36 39.37 39.39 39.40 39.41 39.43 39.45 39.46 39.46 39.47
3 17.44 16.04 15.44 15.10 14.88 14.73 14.62 14.54 14.47 14.42 14.34 14.25 14.17 14.12 14.08 14.04
4 12.22 10.65 9.98 9.60 9.36 9.20 9.07 8.98 8.90 8.84 8.75 8.66 8.56 8.51 8.46 8.41
5 10.01 8.43 7.76 7.39 7.15 6.98 6.85 6.76 6.68 6.62 6.52 6.43 6.33 6.28 6.23 6.18
6 8.81 7.26 6.60 6.23 5.99 5.83 5.70 5.60 5.52 5.46 5.37 5.27 5.17 5.12 5.07 5.01
7 8.07 6.54 5.89 5.52 5.29 5.12 4.99 4.90 4.82 4.76 4.67 4.57 4.47 4.42 4.36 4.31
8 7.57 6.06 5.42 5.05 4.82 4.65 4.53 4.43 4.36 4.30 4.20 4.10 4.00 3.95 3.89 3.84
9 7.21 5.71 5.08 4.72 4.48 4.32 4.20 4.10 4.03 3.96 3.87 3.77 3.67 3.61 3.56 3.51
10 6.94 5.46 4.83 4.47 4.24 4.07 3.95 3.85 3.78 3.72 3.62 3.52 3.42 3.37 3.31 3.26
11 6.72 5.26 4.63 4.28 4.04 3.88 3.76 3.66 3.59 3.53 3.43 3.33 3.23 3.17 3.12 3.06
12 6.55 5.10 4.47 4.12 3.89 3.73 3.61 3.51 3.44 3.37 3.28 3.18 3.07 3.02 2.96 2.91
13 6.41 4.97 4.35 4.00 3.77 3.60 3.48 3.39 3.31 3.25 3.15 3.05 2.95 2.89 2.84 2.78
14 6.30 4.86 4.24 3.89 3.66 3.50 3.38 3.29 3.21 3.15 3.05 2.95 2.84 2.79 2.73 2.67
15 6.20 4.77 4.15 3.80 3.58 3.41 3.29 3.20 3.12 3.06 2.96 2.86 2.76 2.70 2.64 2.59
16 6.12 4.69 4.08 3.73 3.50 3.34 3.22 3.12 3.05 2.99 2.89 2.79 2.68 2.63 2.57 2.51
17 6.04 4.62 4.01 3.66 3.44 3.28 3.16 3.06 2.98 2.92 2.82 2.72 2.62 2.56 2.50 2.44
18 5.98 4.56 3.95 3.61 3.38 3.22 3.10 3.01 2.93 2.87 2.77 2.67 2.56 2.50 2.44 2.38
19 5.92 4.51 3.90 3.56 3.33 3.17 3.05 2.96 2.88 2.82 2.72 2.62 2.51 2.45 2.39 2.33
20 5.87 4.46 3.86 3.51 3.29 3.13 3.01 2.91 2.84 2.77 2.68 2.57 2.46 2.41 2.35 2.29
21 5.83 4.42 3.82 3.48 3.25 3.09 2.97 2.87 2.80 2.73 2.64 2.53 2.42 2.37 2.31 2.25
22 5.79 4.38 3.78 3.44 3.22 3.05 2.93 2.84 2.76 2.70 2.60 2.50 2.39 2.33 2.27 2.21
23 5.75 4.35 3.75 3.41 3.18 3.02 2.90 2.81 2.73 2.67 2.57 2.47 2.36 2.30 2.24 2.18
24 5.72 4.32 3.72 3.38 3.15 2.99 2.87 2.78 2.70 2.64 2.54 2.44 2.33 2.27 2.21 2.15
25 5.69 4.29 3.69 3.35 3.13 2.97 2.85 2.75 2.68 2.61 2.51 2.41 2.30 2.24 2.18 2.12
26 5.66 4.27 3.67 3.33 3.10 2.94 2.82 2.73 2.65 2.59 2.49 2.39 2.28 2.22 2.16 2.09
27 5.63 4.24 3.65 3.31 3.08 2.92 2.80 2.71 2.63 2.57 2.47 2.36 2.25 2.19 2.13 2.07
28 5.61 4.22 3.63 3.29 3.06 2.90 2.78 2.69 2.61 2.55 2.45 2.34 2.23 2.17 2.11 2.05
29 5.59 4.20 3.61 3.27 3.04 2.88 2.76 2.67 2.59 2.53 2.43 2.32 2.21 2.15 2.09 2.03
30 5.57 4.18 3.59 3.25 3.03 2.87 2.75 2.65 2.57 2.51 2.41 2.31 2.20 2.14 2.07 2.01
40 5.42 4.05 3.46 3.13 2.90 2.74 2.62 2.53 2.45 2.39 2.29 2.18 2.07 2.01 1.94 1.88
60 5.29 3.93 3.34 3.01 2.79 2.63 2.51 2.41 2.33 2.27 2.17 2.06 1.94 1.88 1.82 1.74
120 5.15 3.80 3.23 2.89 2.67 2.52 2.39 2.30 2.22 2.16 2.05 1.94 1.82 1.76 1.69 1.61
∞ 5.02 3.69 3.12 2.79 2.57 2.41 2.29 2.19 2.11 2.05 1.94 1.83 1.71 1.64 1.57 1.48
For use for a one-tailed test of equality of standard deviation estimate at 2.5 % level of confidence, or for a two-tailed test at 5 % level of confidence.

Section 9. Reference Tables - 2019 Page 6 of 15
This publication is available free of charge from: https://doi.org/10.6028/N
IST.IR.6969-2019
Table 9.5 Critical values for the F-Test, F0.99 υ1 = degrees of freedom for numerator υ2 = degrees of freedom for denominator
υ1 υ2
1 2 3 4 5 6 7 8 9 10
10 10.04 7.56 6.55 5.99 5.64 5.39 5.20 5.06 4.94 4.85 11 9.65 7.21 6.22 5.67 5.32 5.07 4.89 4.74 4.63 4.54 12 9.33 6.93 5.95 5.41 5.06 4.82 4.64 4.50 4.39 4.30 13 9.07 6.70 5.74 5.21 4.86 4.62 4.44 4.30 4.19 4.10 14 8.86 6.51 5.56 5.04 4.69 4.46 4.28 4.14 4.03 3.94 15 8.68 6.36 5.42 4.89 4.56 4.32 4.14 4.00 3.89 3.80 16 8.53 6.23 5.29 4.77 4.44 4.20 4.03 3.89 3.78 3.69 17 8.40 6.11 5.18 4.67 4.34 4.10 3.93 3.79 3.68 3.59 18 8.29 6.01 5.09 4.58 4.25 4.01 3.84 3.71 3.60 3.51 19 8.18 5.93 5.01 4.50 4.17 3.94 3.77 3.63 3.52 3.43 20 8.10 5.85 4.94 4.43 4.10 3.87 3.70 3.56 3.46 3.37 22 7.95 5.72 4.82 4.31 3.99 3.76 3.59 3.45 3.35 3.26 24 7.82 5.61 4.72 4.22 3.90 3.67 3.50 3.36 3.26 3.17 26 7.72 5.53 4.64 4.14 3.82 3.59 3.42 3.29 3.18 3.09 28 7.64 5.45 4.57 4.07 3.75 3.53 3.36 3.23 3.12 3.03 30 7.56 5.39 4.51 4.02 3.70 3.47 3.30 3.17 3.07 2.98 35 7.42 5.27 4.40 3.91 3.59 3.37 3.20 3.07 2.96 2.88 40 7.31 5.18 4.31 3.83 3.51 3.29 3.12 2.99 2.89 2.80 45 7.23 5.11 4.25 3.77 3.45 3.23 3.07 2.94 2.83 2.74 50 7.17 5.06 4.20 3.72 3.41 3.19 3.02 2.89 2.78 2.70 55 7.12 5.01 4.16 3.68 3.37 3.15 2.98 2.85 2.75 2.66 60 7.08 4.98 4.13 3.65 3.34 3.12 2.95 2.82 2.72 2.63 65 7.04 4.95 4.10 3.62 3.31 3.09 2.93 2.80 2.69 2.61 70 7.01 4.92 4.07 3.60 3.29 3.07 2.91 2.78 2.67 2.59 75 6.99 4.90 4.05 3.58 3.27 3.05 2.89 2.76 2.65 2.57 80 6.96 4.88 4.04 3.56 3.25 3.04 2.87 2.74 2.64 2.55 85 6.94 4.86 4.02 3.55 3.24 3.02 2.86 2.73 2.62 2.54 90 6.93 4.85 4.01 3.53 3.23 3.01 2.84 2.72 2.61 2.52 95 6.91 4.84 3.99 3.52 3.22 3.00 2.83 2.70 2.60 2.51
100 6.90 4.82 3.98 3.51 3.21 2.99 2.82 2.69 2.59 2.50 105 6.88 4.81 3.97 3.50 3.20 2.98 2.81 2.69 2.58 2.49 110 6.87 4.80 3.96 3.49 3.19 2.97 2.81 2.68 2.57 2.49 115 6.86 4.79 3.96 3.49 3.18 2.96 2.80 2.67 2.57 2.48 120 6.85 4.79 3.95 3.48 3.17 2.96 2.79 2.66 2.56 2.47 ∞ 6.63 4.61 3.78 3.32 3.02 2.80 2.64 2.51 2.41 2.32
For use for a one-tailed test of equality of standard deviation estimate at 1 % level of confidence, or for a two-tailed test at 2 % level of confidence.

Section 9. Reference Tables - 2019 Page 7 of 15
This publication is available free of charge from: https://doi.org/10.6028/N
IST.IR.6969-2019
Table 9.6 Factors for Two-sided Tolerance Intervals for the Normal Distribution
= 0.95 = 0.99
P n 0.75 0.90 0.95 0.99 0.999 0.75 0.90 0.95 0.99 0.999
2 22.858 32.019 37.674 48.430 60.573 114.363 160.193 188.491 242.300 303.054 3 5.922 8.380 9.916 12.861 16.208 13.378 18.930 22.401 29.055 36.616 4 3.779 5.369 6.370 8.299 10.502 6.614 9.398 11.150 14.527 18.383 5 3.002 4.275 5.079 6.634 8.415 4.643 6.612 7.855 10.260 13.015 6 2.604 3.712 4.414 5.775 7.337 3.743 5.337 6.345 8.301 10.548 7 2.361 3.369 4.007 5.248 6.676 3.233 4.613 5.488 7.187 9.142 8 2.197 3.136 3.732 4.891 6.226 2.905 4.147 4.936 6.468 8.234 9 2.078 2.967 3.532 4.631 5.899 2.677 3.822 4.550 5.966 7.600 10 1.987 2.839 3.379 4.433 5.649 2.508 3.582 4.265 5.594 7.129 11 1.916 2.737 3.259 4.277 5.452 2.378 3.397 4.045 5.308 6.766 12 1.858 2.655 3.162 4.150 5.291 2.274 3.250 3.870 5.079 6.477 13 1.810 2.587 3.081 4.044 5.158 2.190 3.130 3.727 4.893 6.240 14 1.770 2.529 3.012 3.955 5.045 2.120 3.029 3.608 4.737 6.043 15 1.735 2.480 2.954 3.878 4.949 2.060 2.945 3.507 4.605 5.876 16 1.705 2.437 2.903 3.812 4.865 2.009 2.872 3.421 4.492 5.732 17 1.679 2.400 2.858 3.754 4.791 1.965 2.808 3.345 4.393 5.607 18 1.655 2.366 2.819 3.702 4.725 1.926 2.753 3.279 4.307 5.497 19 1.635 2.337 2.784 3.656 4.667 1.891 2.703 3.221 4.230 5.399 20 1.616 2.310 2.752 3.612 4.614 1.860 2.659 3.168 4.161 5.312 21 1.599 2.286 2.723 3.577 4.567 1.833 2.620 3.121 4.100 5.234 22 1.584 2.264 2.697 3.543 4.523 1.808 2.584 3.078 4.044 5.163 23 1.570 2.244 2.673 3.512 4.484 1.785 2.551 3.040 3.993 5.098 24 1.557 2.225 2.651 3.483 4.447 1.764 2.522 3.004 3.947 5.039 25 1.545 2.208 2.631 3.457 4.413 1.745 2.494 2.972 3.904 4.985 26 1.534 2.193 2.612 3.432 4.382 1.727 2.469 2.941 3.865 4.935 27 1.523 2.178 2.595 3.409 4.353 1.711 2.446 2.914 3.828 4.888 From: NBS Handbook 91, p T-11

Section 9. Reference Tables - 2019 Page 8 of 15
This publication is available free of charge from: https://doi.org/10.6028/N
IST.IR.6969-2019
Table 9.7 Factors for Computing Two-sided Confidence Limits for α (Part 1)
Degrees of
Freedom
α = 0.05 α = 0.01 α = 0.001
SU SL SU SL SU SL
1 17.79 0.3576 86.31 0.2969 844.4 0.2480
2 4.859 0.4581 10.70 0.3879 33.29 0.3291
3 3.183 0.5178 5.449 0.4453 11.65 0.3824
4 2.567 0.5590 3.892 0.4865 6.938 0.4218
5 2.248 0.5899 3.175 0.5182 5.085 0.4529
6 2.052 0.6143 2.764 0.5437 4.128 0.4784
7 1.918 0.6344 2.498 0.5650 3.551 0.5000
8 1.820 0.6513 2.311 0.5830 3.167 0.5186
9 1.746 0.6657 2.173 0.5987 2.894 0.5348
10 1.686 0.6784 2.065 0.6125 2.689 0.5492
11 1.638 0.6896 1.980 0.6248 2.530 0.5621
12 1.598 0.6995 1.909 0.6358 2.402 0.5738
13 1.564 0.7084 1.851 0.6458 2.298 0.5845
14 1.534 0.7166 1.801 0.6549 2.210 0.5942
15 1.509 0.7240 1.758 0.6632 2.136 0.6032
16 1.486 0.7808 1.721 0.6710 2.073 0.6116
17 1.466 0.7372 1.688 0.6781 2.017 0.6193
18 1.448 0.7430 1.658 0.6848 1.968 0.6266
19 1.432 0.7484 1.632 0.6909 1.925 0.6333
20 1.417 0.7535 1.609 0.6968 1.886 0.6397
21 1.404 0.7582 1.587 0.7022 1.851 0.6457
22 1.391 0.7627 1.568 0.7074 1.820 0.6514
23 1.380 0.7669 1.550 0.7122 1.791 0.6568
24 1.370 0.7709 1.533 0.7169 1.765 0.6619
25 1.360 0.7747 1.518 0.7212 1.741 0.6668
From: NBS Handbook 91, p T-34
Section 9. Reference Tables - 2019 Page 9 of 15
This publication is available free of charge from: https://doi.org/10.6028/N
IST.IR.6969-2019
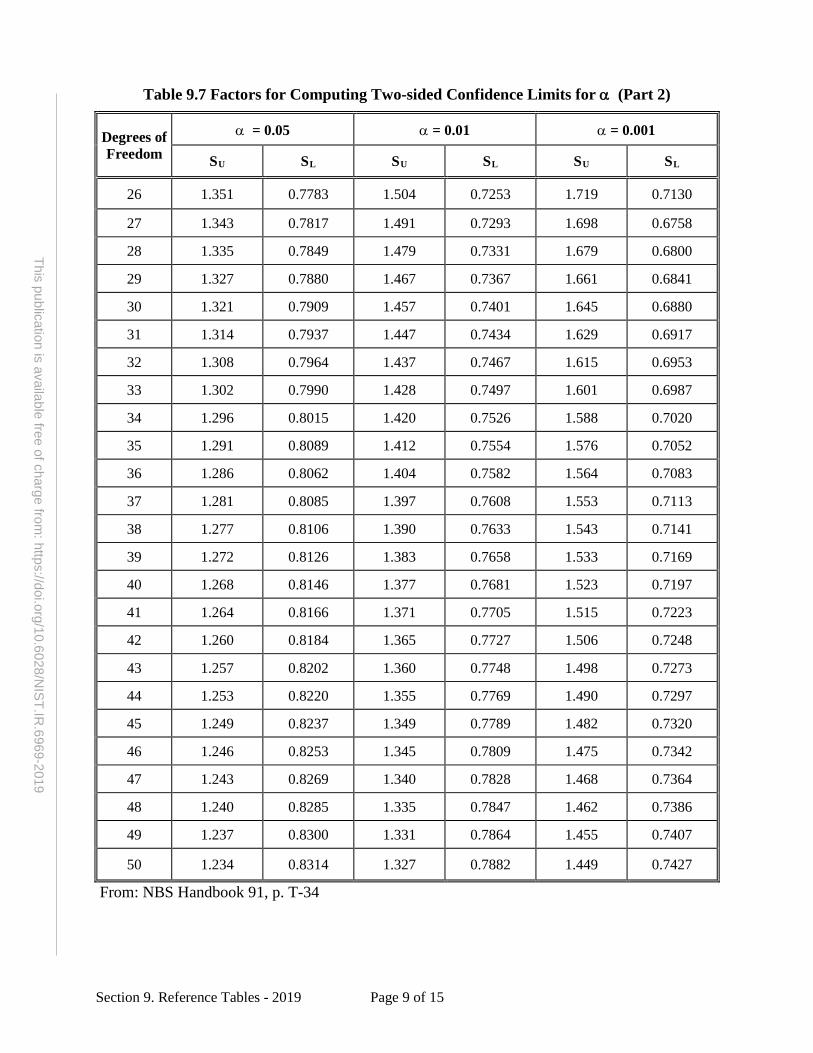
Table 9.7 Factors for Computing Two-sided Confidence Limits for α (Part 2)
Degrees of Freedom
α = 0.05 α = 0.01 α = 0.001
SU SL SU SL SU SL
26 1.351 0.7783 1.504 0.7253 1.719 0.7130
27 1.343 0.7817 1.491 0.7293 1.698 0.6758
28 1.335 0.7849 1.479 0.7331 1.679 0.6800
29 1.327 0.7880 1.467 0.7367 1.661 0.6841
30 1.321 0.7909 1.457 0.7401 1.645 0.6880
31 1.314 0.7937 1.447 0.7434 1.629 0.6917
32 1.308 0.7964 1.437 0.7467 1.615 0.6953
33 1.302 0.7990 1.428 0.7497 1.601 0.6987
34 1.296 0.8015 1.420 0.7526 1.588 0.7020
35 1.291 0.8089 1.412 0.7554 1.576 0.7052
36 1.286 0.8062 1.404 0.7582 1.564 0.7083
37 1.281 0.8085 1.397 0.7608 1.553 0.7113
38 1.277 0.8106 1.390 0.7633 1.543 0.7141
39 1.272 0.8126 1.383 0.7658 1.533 0.7169
40 1.268 0.8146 1.377 0.7681 1.523 0.7197
41 1.264 0.8166 1.371 0.7705 1.515 0.7223
42 1.260 0.8184 1.365 0.7727 1.506 0.7248
43 1.257 0.8202 1.360 0.7748 1.498 0.7273
44 1.253 0.8220 1.355 0.7769 1.490 0.7297
45 1.249 0.8237 1.349 0.7789 1.482 0.7320
46 1.246 0.8253 1.345 0.7809 1.475 0.7342
47 1.243 0.8269 1.340 0.7828 1.468 0.7364
48 1.240 0.8285 1.335 0.7847 1.462 0.7386
49 1.237 0.8300 1.331 0.7864 1.455 0.7407
50 1.234 0.8314 1.327 0.7882 1.449 0.7427
From: NBS Handbook 91, p. T-34

Section 9. Reference Tables - 2019 Page 10 of 15
This publication is available free of charge from: https://doi.org/10.6028/N
IST.IR.6969-2019
Table 9.8 Density of Air-free Water in g/cm3 as a Function of Celsius Temperature
T 0.0 °C 0.1 °C 0.2 °C 0.3 °C 0.4 °C 0.5 °C 0.6 °C 0.7 °C 0.8 °C 0.9 °C
0.0 0.999 840 0.999 846 0.999 853 0.999 859 0.999 865 0.999 871 0.999 877 0.999 883 0.999 888 0.999 893
1.0 0.999 899 0.999 903 0.999 908 0.999 913 0.999 917 0.999 921 0.999 925 0.999 929 0.999 933 0.999 937
2.0 0.999 940 0.999 943 0.999 946 0.999 949 0.999 952 0.999 954 0.999 956 0.999 959 0.999 961 0.999 963
3.0 0.999 964 0.999 966 0.999 967 0.999 968 0.999 969 0.999 970 0.999 971 0.999 971 0.999 972 0.999 972
4.0 0.999 972 0.999 972 0.999 972 0.999 971 0.999 971 0.999 970 0.999 969 0.999 968 0.999 967 0.999 965
5.0 0.999 964 0.999 962 0.999 960 0.999 958 0.999 956 0.999 954 0.999 951 0.999 949 0.999 946 0.999 943
6.0 0.999 940 0.999 937 0.999 933 0.999 930 0.999 926 0.999 922 0.999 918 0.999 914 0.999 910 0.999 906
7.0 0.999 901 0.999 896 0.999 892 0.999 887 0.999 881 0.999 876 0.999 871 0.999 865 0.999 860 0.999 854
8.0 0.999 848 0.999 842 0.999 835 0.999 829 0.999 822 0.999 816 0.999 809 0.999 802 0.999 795 0.999 787
9.0 0.999 780 0.999 773 0.999 765 0.999 757 0.999 749 0.999 741 0.999 733 0.999 725 0.999 716 0.999 707
10.0 0.999 699 0.999 690 0.999 681 0.999 672 0.999 662 0.999 653 0.999 643 0.999 634 0.999 624 0.999 614
11.0 0.999 604 0.999 594 0.999 583 0.999 573 0.999 562 0.999 552 0.999 541 0.999 530 0.999 519 0.999 507
12.0 0.999 496 0.999 485 0.999 473 0.999 461 0.999 449 0.999 437 0.999 425 0.999 413 0.999 401 0.999 388
13.0 0.999 376 0.999 363 0.999 350 0.999 337 0.999 324 0.999 311 0.999 297 0.999 284 0.999 270 0.999 256
14.0 0.999 243 0.999 229 0.999 215 0.999 200 0.999 186 0.999 172 0.999 157 0.999 142 0.999 128 0.999 113
15.0 0.999 098 0.999 083 0.999 067 0.999 052 0.999 036 0.999 021 0.999 005 0.998 989 0.998 973 0.998 957
16.0 0.998 941 0.998 925 0.998 908 0.998 892 0.998 875 0.998 858 0.998 841 0.998 824 0.998 807 0.997 890
17.0 0.998 773 0.998 755 0.998 738 0.998 720 0.998 702 0.998 684 0.998 666 0.998 648 0.998 630 0.998 612
18.0 0.998 593 0.998 575 0.998 556 0.998 537 0.998 519 0.998 500 0.998 480 0.998 461 0.998 442 0.998 422
19.0 0.998 403 0.998 383 0.998 364 0.998 344 0.998 324 0.998 304 0.998 284 0.998 263 0.998 243 0.998 222
20.0 0.998 202 0.998 181 0.998 160 0.998 139 0.998 118 0.998 097 0.998 076 0.998 055 0.998 033 0.998 012
21.0 0.997 990 0.997 968 0.997 947 0.997 925 0.997 903 0.997 881 0.997 858 0.997 836 0.997 814 0.997 791
22.0 0.997 768 0.997 746 0.997 723 0.997 700 0.997 677 0.997 654 0.997 630 0.997 607 0.997 584 0.997 560
23.0 0.997 536 0.997 513 0.997 489 0.997 465 0.997 441 0.997 417 0.997 392 0.997 368 0.997 344 0.997 319
24.0 0.997 294 0.997 270 0.997 245 0.997 220 0.997 195 0.997 170 0.997 145 0.997 119 0.997 094 0.997 068
25.0 0.997 043 0.997 017 0.996 991 0.996 966 0.996 940 0.996 913 0.996 887 0.996 861 0.996 835 0.996 808
26.0 0.996 782 0.996 755 0.996 728 0.996 702 0.996 675 0.996 648 0.996 621 0.996 593 0.996 566 0.996 539
27.0 0.996 511 0.996 484 0.996 456 0.996 428 0.996 401 0.996 373 0.996 345 0.996 316 0.996 288 0.996 260
28.0 0.996 232 0.996 203 0.996 175 0.996 146 0.996 117 0.996 088 0.996 060 0.996 031 0.996 001 0.995 972
29.0 0.995 943 0.995 914 0.995 884 0.995 855 0.995 825 0.995 795 0.995 765 0.995 736 0.995 706 0.995 676
30.0 0.995 645 0.995 615 0.995 585 0.995 554 0.995 524 0.995 493 0.995 463 0.995 432 0.995 401 0.995 370
31.0 0.995 339 0.995 308 0.995 277 0.995 246 0.995 214 0.995 183 0.995 151 0.995 120 0.995 088 0.995 056
32.0 0.995 024 0.994 992 0.994 960 0.994 928 0.994 896 0.994 864 0.994 831 0.994 799 0.994 766 0.994 734
33.0 0.994 701 0.994 668 0.994 635 0.994 602 0.994 569 0.994 536 0.994 503 0.994 470 0.994 436 0.994 403
34.0 0.994 369 0.994 336 0.994 302 0.994 268 0.994 234 0.994 201 0.994 167 0.994 132 0.994 098 0.994 064
35.0 0.994 030 0.993 995 0.993 961 0.993 926 0.993 891 0.993 857 0.993 822 0.993 787 0.993 752 0.993 717
36.0 0.993 682 0.993 647 0.993 611 0.993 576 0.993 541 0.993 505 0.993 469 0.993 434 0.993 398 0.993 362
37.0 0.993 326 0.993 290 0.993 254 0.993 218 0.993 182 0.993 146 0.993 109 0.993 073 0.993 036 0.993 000
38.0 0.992 963 0.992 926 0.992 889 0.992 852 0.992 815 0.992 778 0.992 741 0.992 704 0.992 667 0.992 629
39.0 0.992 592 0.992 554 0.992 517 0.992 479 0.992 442 0.992 404 0.992 366 0.992 328 0.992 290 0.992 252 Based on the work of H. Wagenbreth and W. Blanke, PTB - Mitteilingen 6-71. Reference equations for CIPM adopted, air-saturated distilled water should be used and are provided in GLP 10 as published in NISTIR 7383, see latest edition.

Section 9. Reference Tables - 2019 Page 11 of 15
This publication is available free of charge from: https://doi.org/10.6028/N
IST.IR.6969-2019
Table 9.9 Density of Air, g/cm3, as Function of Temperature and Air Pressure*
Barometric Pressure Temperature ( °C)
kPa mbar mmHg 18 20 22 24 26 28
77.33 773 580 0.000 92 0.000 92 0.000 91 0.000 91 0.000 90 0.000 90
79.99 800 600 0.000 95 0.000 95 0.000 94 0.000 93 0.000 93 0.000 92
82.66 827 620 0.000 99 0.000 98 0.000 97 0.000 96 0.000 96 0.000 95
85.33 853 640 0.001 02 0.001 01 0.001 00 0.001 00 0.000 99 0.000 98
87.99 880 660 0.001 05 0.001 04 0.001 03 0.001 03 0.001 02 0.001 01
90.66 907 680 0.001 08 0.001 07 0.001 07 0.001 06 0.001 05 0.001 04
93.33 933 700 0.001 11 0.001 10 0.001 10 0.001 09 0.001 08 0.001 07
95.99 960 720 0.001 14 0.001 14 0.001 13 0.001 12 0.001 12 0.001 10
98.66 987 740 0.001 18 0.001 17 0.001 16 0.001 15 0.001 14 0.001 13
101.32 1013 760 0.001 21 0.001 20 0.001 19 0.001 18 0.001 17 0.001 17
103.99 1040 780 0.001 24 0.001 23 0.001 22 0.001 21 0.001 21 0.001 20
106.66 1067 800 0.001 27 0.001 26 0.001 25 0.001 24 0.001 24 0.001 23
Computed for air at 50 % relative humidity using Option A in SOP 2. Conversions of barometric pressure are not exact. See NIST Special Publication 811 for exact conversions. *Equations to compute the density of air at any pressure, temperature, and relative humidity are given in Section 8 of the Appendix to SOP No. 2 and Option B is preferred for all precision mass and volume calibrations.

Section 9. Reference Tables - 2019 Page 12 of 15
This publication is available free of charge from: https://doi.org/10.6028/N
IST.IR.6969-2019
Table 9.10 Density and Coefficient of Expansion
Material Density (g/cm3)
Coefficient of Expansion Linear ( / °C) Cubical ( / °C) Cubical ( / °F)
Aluminum (not suitable for provers)
2.7 0.000 024 0.000 069 0.000 038
Brass 8.4 at 0 °C
8.3909 at 20 °C 0.000 019 0.000 054
Cast iron 7.0 7.2 0.000 010 0.000 030
Copper 0.000 017 0.000 050 Diamond 0.000 001 18 0.000 003 5 Fused silica (quartz) 0.000 000 5 0.000 001 6 Glass, borosilicate (T1CA) 0.000 010 Glass, borosilicate (T1CB) 0.000 015 Glass, soda-lime 0.000 025 Gold 18.0 0.000 043 Invar 0.000 000 4 0.000 001 2 Lead 11.34 0.000 029 0.000 087 Length bench 0.000 010 6 Mercury 0.000 018 Nichrome 8.39 0.000 039 Nichrome V 8.5 0.000 039 Platinum 0.000 011 0.000 027 Polycarbonate plastic 0.000 45 Polypropylene plastic 0.000 24 Polystyrene plastic 0.000 21 Steel, stainless (mass) 7.84, 7.95, 8.0, 8.03 0.000 045 Steel, stainless (provers) 0.000 047 7 0.000 026 5 Steel, 304 stainless (provers) 0.000 051 8 0.000 028 8 Steel, tape, mild 0.000 0116 0.000 033 5 Steel, pressure vessel, low carbon 0.000 028 8 0.000 016 Steel, prover, low carbon 0.000 012 0.000 033 5 0.000 018 6 Steel, terne plate 0.000 012 0.000 035 0.000 019 5 Tantalum 16.6 0.000 020 Water (20 °C) 0.000 21
Reference values for cubical coefficient of expansion given in per °F are provided as reference for prover calibrations used for petroleum products where the reference temperature is 60 °F.

Section 9. Reference Tables - 2019 Page 13 of 15
This publication is available free of charge from: https://doi.org/10.6028/N
IST.IR.6969-2019
Table 9.11 A Short Table of Random Numbers
46 96 85 77 27 92 86 26 45 21 89 91 71 42 64 64 58 22 75 81 74 91 48 46 18 44 19 15 32 63 55 87 77 33 29 45 00 31 34 84 05 72 90 44 27 78 22 07 62 17 34 39 80 62 24 33 81 67 28 11 34 79 26 35 34 23 09 94 00 80 55 31 63 27 91 74 97 80 30 65 07 71 30 01 84 47 45 89 70 74 13 04 90 51 27 61 34 63 87 44 22 14 61 60 86 38 33 71 13 33 72 08 16 13 50 56 48 51 29 48 30 93 45 66 29 40 03 96 40 03 47 24 60 09 21 21 18 00 05 86 52 85 40 73 73 57 68 36 33 91 52 33 76 44 56 15 47 75 78 73 78 19 87 06 98 47 48 02 62 03 42 05 32 55 02 37 59 20 40 93 17 82 24 19 90 80 87 32 74 59 84 24 49 79 17 23 75 83 42 00 11 02 55 47 48 84 74 36 22 67 19 20 15 92 53 37 13 75 54 89 56 73 23 39 07 10 33 79 26 34 54 71 33 89 74 68 48 23 17 49 18 81 05 52 85 70 05 73 11 17 67 59 28 25 47 89 11 65 65 20 42 23 96 41 64 20 30 89 87 64 37 93 36 96 35 93 50 75 20 09 18 54 34 68 02 54 87 23 05 43 36 98 29 97 93 87 08 30 92 98 24 43 23 72 80 64 34 27 23 46 15 36 10 63 21 59 69 76 02 62 31 62 47 60 34 39 91 63 18 38 27 10 78 88 84 42 32 00 97 92 00 04 94 50 05 75 82 70 80 35 74 62 19 67 54 18 28 92 33 69 98 96 74 35 72 11 68 25 08 95 31 79 11 79 54 91 03 35 60 81 16 61 97 25 14 78 21 22 05 25 47 26 37 80 39 19 06 41 02 00 42 57 66 76 72 91 03 63 48 46 44 01 33 53 62 28 80 59 55 05 02 16 13 17 54 06 36 63 06 15 03 72 38 01 58 25 37 66 48 56 19 56 41 29 28 76 49 74 39 50 92 70 96 70 89 80 87 14 25 49 25 94 62 78 26 15 41 39 48 75 64 69 61 06 38 91 08 88 53 52 13 04 82 23 00 26 36 47 44 04 08 84 80 07 44 76 51 52 41 59 68 85 97 74 47 53 90 05 90 84 87 48 25 01 11 05 45 11 43 15 60 40 31 84 59 59 54 13 09 13 80 42 29 63 03 24 64 12 43 28 10 01 65 62 07 79 83 05 59 61 39 18 32 69 33 46 58 19 34 03 59 28 97 31 02 65 47 47 70 39 74 17 30 22 65 67 43 31 09 12 60 19 57 63 78 11 80 10 97 15 70 04 89 81 78 54 84 87 83 42 61 75 37 19 56 90 75 39 03 56 49 92 72 95 27 52 87 47 12 52 54 62 43 23 13 78 10 91 11 00 63 19 63 74 58 69 03 51 38 60 36 53 56 77 06 69 03 89 91 24 93 23 71 58 09 78 08 03 07 71 79 32 25 19 61 04 40 33 12 06 78 91 97 88 95 37 55 48 82 63 89 92 59 14 72 19 17 22 51 90 20 03 64 96 60 48 01 95 44 84 62 13 11 71 17 23 29 25 13 85 33 35 07 69 25 68 57 92 57 11 84 44 01 33 66 29 89 97 47 03 13 20 86 22 45 59 98 64 53 89 64 94 81 55 87 73 81 58 46 42 16 94 85 82 89 07 17 30 29 89 89 80 98 36 25 36 53 02 49 14 34 03 52 09 20 04 93 10 59 75 12 98 84 60 93 68 16 87 60 11 50 46 56 58 45 88 72 50 46 11 95 71 43 68 97 18 85 17 13 08 00 50 77 50 46 92 45 26 97 21 48 22 23 08 32 86 05 39 14 35 48 68 18 36 57 09 62 40 28 87 08 74 79 91 08 27 12 43 32 03 59 30 60 10 41 31 00 69 63 77 01 89 94 60 19 02 70 88 72 33 38 88 20 60 86 05 45 35 40 54 03 98 96 76 27 77 84 80 08 64 60 44 34 54 24 85 20 85 77 32 71 85 17 74 66 27 85 19 55 56 51 36 48 92 32 44 40 47 10 38 22 52 42 29 96 80 20 32 80 98 00 40 92 57 51 52 83 14 55 31 99 73 23 40 07 64 54 44 99 21 13 50 78 02 73 39 66 82 01 28 67 51 75 66 33 97 47 58 42 44 88 09 28 58 06 67 92 65 41 45 36 77 96 46 21 14 39 56 36 70 15 74 43 62 69 82 30 77 28 77 72 56 73 44 26 04 62 81 15 35 79 26 99 57 28 22 25 94 80 62 95 48 98 23 86 28 86 85 64 94 11 58 78 45 36 34 45 91 38 51 10 68 36 87 81 16 77 30 19 36 69 57 40 80 44 94 60 82 94 93 98 01 48 50 57 69 60 77 69 60 74 22 05 77 17 71 20 03 30 79 25 74 17 78 34 54 45 04 77 42 59 75 78 64 99 37 03 18 03 36 89 98 55 98 22 45 12 49 82 71 57 33 28 69 50 59 15 09 25 79 39 42 84 18 70 58 74 82 81 14 02 01 05 77 94 65 57 70 39 42 48 56 84 31 59 18 70 41 74 60 50 54 73 81 91 07 81 26 25 45 49 61 22 88 41 20 00 15 59 93 51 60 65 65 63 49 33 72 90 10 20 65 28 44 63 95 86 75 78 69 24 41 65 86 10 34 10 32 00 93 11 85 01 43 65 02 85 69 56 88 34 29 64 35 48 15 70 11 77 83 01 34 82 91 04 34 22 46 41 84 74 27 02 57 77 47 93 72 02 95 63 75 74 69 69 61 34 31 92 13
From: NBS Handbook 91, p T-82

Section 9. Reference Tables - 2019 Page 14 of 15
This publication is available free of charge from: https://doi.org/10.6028/N
IST.IR.6969-2019
Table 9.12 Percentiles of the F Distribution F0.95 (n1, n2)
n1 = degrees of freedom for numerator n2 = degrees of freedom for denominator
n1
n2 1 2 3 4 5 6 7 8 9 10 20 40 60 120 ∞ 1 161.4 199.5 215.7 224.6 230.2 234.0 236.8 238.9 240.5 241.9 248.0 251.1 252.2 253.3 254.3
2 18.51 19.00 19.16 19.25 19.30 19.33 19.35 19.37 19.38 19.40 19.45 19.47 19.48 19.49 19.50
3 10.13 9.55 9.28 9.12 9.01 8.94 8.89 8.85 8.81 8.79 8.66 8.59 8.57 8.55 8.53
4 7.71 6.94 6.59 6.39 6.26 6.16 6.09 6.04 6.00 5.96 5.80 5.72 5.69 5.66 5.63
5 6.61 5.79 5.41 5.19 5.05 4.95 4.88 4.82 4.77 4.74 4.56 4.46 4.43 4.40 4.36
6 5.99 5.14 4.76 4.53 4.39 4.28 4.21 4.15 4.10 4.06 3.87 3.77 3.74 3.70 3.67
7 5.59 4.74 4.35 4.12 3.97 3.87 3.79 3.73 3.68 3.64 3.44 3.34 3.30 3.27 3.23
8 5.32 4.46 4.07 3.84 3.69 3.58 3.50 3.44 3.39 3.35 3.15 3.04 3.01 2.97 2.93
9 5.12 4.26 3.86 3.63 3.48 3.37 3.29 3.23 3.18 3.14 2.94 2.83 2.79 2.75 2.71
10 4.96 4.10 3.71 3.48 3.33 3.22 3.14 3.07 3.02 2.98 2.77 2.66 2.62 2.58 2.54
11 4.84 3.98 3.59 3.36 3.20 3.09 3.01 2.95 2.90 2.85 2.65 2.53 2.49 2.45 2.40
12 4.75 3.89 3.49 3.26 3.11 3.00 2.91 2.85 2.80 2.75 2.54 2.43 2.38 2.34 2.30
13 4.67 3.81 3.41 3.18 3.03 2.92 2.83 2.77 2.71 2.67 2.46 2.34 2.30 2.25 2.21
14 4.60 3.74 3.34 3.11 2.96 2.85 2.76 2.70 2.65 2.60 2.39 2.27 2.22 2.18 2.13
15 4.54 3.68 3.29 3.06 2.90 2.79 2.71 2.64 2.59 2.54 2.33 2.20 2.16 2.11 2.07
16 4.49 3.63 3.24 3.01 2.85 2.74 2.66 2.59 2.54 2.49 2.28 2.15 2.11 2.06 2.01
17 4.45 3.59 3.20 2.96 2.81 2.70 2.61 2.55 2.49 2.45 2.23 2.10 2.06 2.01 1.96
18 4.41 3.55 3.16 2.93 2.77 2.66 2.58 2.51 2.46 2.41 2.19 2.06 2.02 1.97 1.92
19 4.38 3.52 3.13 2.90 2.74 2.63 2.54 2.48 2.42 2.38 2.16 2.03 1.98 1.93 1.88
20 4.35 3.49 3.10 2.87 2.71 2.60 2.51 2.45 2.39 2.35 2.12 1.99 1.95 1.90 1.84
21 4.32 3.47 3.07 2.84 2.68 2.57 2.49 2.42 2.37 2.32 2.10 1.96 1.92 1.87 1.81
22 4.30 3.44 3.05 2.82 2.66 2.55 2.46 2.40 2.34 2.30 2.07 1.94 1.89 1.84 1.78
23 4.28 3.42 3.03 2.80 2.64 2.53 2.44 2.37 2.32 2.27 2.05 1.91 1.86 1.81 1.76
24 4.26 3.40 3.01 2.78 2.62 2.51 2.42 2.36 2.30 2.25 2.03 1.89 1.84 1.79 1.73
25 4.24 3.39 2.99 2.76 2.60 2.49 2.40 2.34 2.28 2.24 2.01 1.87 1.82 1.77 1.71
26 4.23 3.37 2.98 2.74 2.59 2.47 2.39 2.32 2.27 2.22 1.99 1.85 1.80 1.75 1.69
27 4.21 3.35 2.96 2.73 2.57 2.46 2.37 2.31 2.25 2.20 1.97 1.84 1.79 1.73 1.67
28 4.20 3.34 2.95 2.71 2.56 2.45 2.36 2.29 2.24 2.19 1.96 1.82 1.77 1.71 1.65
29 4.18 3.33 2.93 2.70 2.55 2.43 2.35 2.28 2.22 2.18 1.94 1.81 1.75 1.70 1.64
30 4.17 3.32 2.92 2.69 2.53 2.42 2.33 2.27 2.21 2.16 1.93 1.79 1.74 1.68 1.62
40 4.08 3.23 2.84 2.61 2.45 2.34 2.25 2.18 2.12 2.08 1.84 1.69 1.64 1.58 1.51
60 4.00 3.15 2.76 2.53 2.37 2.25 2.17 2.10 2.04 1.99 1.75 1.59 1.53 1.47 1.39
120 3.92 3.07 2.68 2.45 2.29 2.18 2.09 2.02 1.96 1.91 1.66 1.50 1.43 1.35 1.25
∞ 3.84 3.00 2.60 2.37 2.21 2.10 2.01 1.94 1.88 1.83 1.57 1.39 1.32 1.22 1.00
Created with Excel function: =ROUND(F.INV(0.95, Numerator,Denominator),2); validated with NBS Handbook 91.

Section 9. Reference Tables - 2019 Page 15 of 15
This publication is available free of charge from: https://doi.org/10.6028/N
IST.IR.6969-2019
Table 9.13 Critical Values for the F-test, Fmax 0.0 5
Number of treatments, levels, groups
n-1 2 3 4 5 6 7 8 9 10 11 12 2 39.00 87.50 142.00 202.00 266.00 333.00 403.00 475.00 550.00 626.00 704.00 3 15.40 27.80 39.20 50.70 62.00 72.90 83.50 93.90 104.00 114.00 124.00 4 9.60 15.50 20.60 25.20 29.50 33.60 37.50 41.10 44.60 48.00 51.40 5 7.20 10.80 13.70 16.30 18.70 20.80 22.90 24.70 26.50 28.20 29.90 6 5.82 8.38 10.40 12.10 13.70 15.00 16.30 17.50 18.60 19.70 20.70 7 4.99 6.94 8.44 9.70 10.80 11.80 12.70 13.50 14.30 15.10 15.80 8 4.43 6.00 7.18 8.12 9.03 9.78 10.50 11.10 11.70 12.20 12.70 9 4.03 5.34 6.31 7.11 7.80 8.41 8.95 9.45 9.91 10.30 10.70
10 3.72 4.85 5.67 6.34 6.92 7.42 7.87 8.28 8.66 9.01 9.34 12 3.28 4.16 4.75 5.30 5.72 6.09 6.42 6.72 7.00 7.25 7.43 15 2.86 3.54 4.01 4.37 4.68 4.95 5.19 5.40 5.59 5.77 5.95 20 2.46 2.95 3.29 3.54 3.76 3.94 4.10 4.24 4.37 4.49 4.59 30 2.07 2.40 2.61 2.78 2.91 3.02 3.12 3.21 3.29 3.36 3.39 60 1.67 1.85 1.96 2.04 2.11 2.17 2.22 2.26 2.30 2.33 2.36
∞ 1.00 1.00 1.00 1.00 1.00 1.00 1.00 1.00 1.00 1.00 1.00
If the F-ratio is close to 1 in the calculations, the variation among the samples/replicates is not statistically different. Look up the number of levels and the degrees of freedom (number of items in each level minus 1) in the Fmax table. For example, if there were 11 replicate observations (n = 11), then the degrees of freedom is 11 – 1 or 10 and with two treatments (replicates) for a k of 2 (k is the number of levels/groups and not the coverage factor used for uncertainties), the table shows an Fmax value of 3.72.