9.1 introduction to statistics - bigideasmath.com · 390 chapter 9 statistical measures 9.1...
TRANSCRIPT
390 Chapter 9 Statistical Measures
Introduction to Statistics9.1
How can you tell whether a question
is a statistical question?
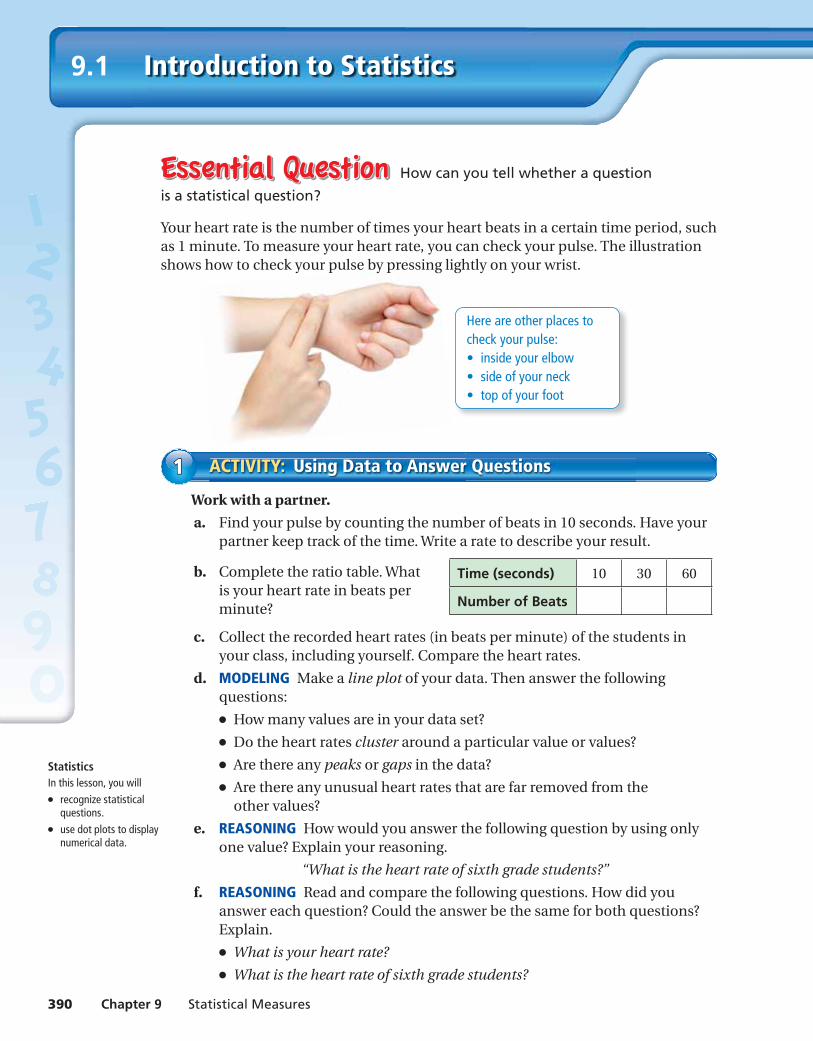
Your heart rate is the number of times your heart beats in a certain time period, such as 1 minute. To measure your heart rate, you can check your pulse. The illustration shows how to check your pulse by pressing lightly on your wrist.
Work with a partner.
a. Find your pulse by counting the number of beats in 10 seconds. Have your partner keep track of the time. Write a rate to describe your result.
b. Complete the ratio table. What Time (seconds) 10 30 60
Number of Beatsis your heart rate in beats per minute?
c. Collect the recorded heart rates (in beats per minute) of the students in your class, including yourself. Compare the heart rates.
d. MODELING Make a line plot of your data. Then answer the following questions:
● How many values are in your data set?
● Do the heart rates cluster around a particular value or values?
● Are there any peaks or gaps in the data?
● Are there any unusual heart rates that are far removed from the other values?
e. REASONING How would you answer the following question by using only one value? Explain your reasoning.
“What is the heart rate of sixth grade students?”
f. REASONING Read and compare the following questions. How did you answer each question? Could the answer be the same for both questions? Explain.
● What is your heart rate?
● What is the heart rate of sixth grade students?
ACTIVITY: Using Data to Answer Questions11
Here are other places to check your pulse:• inside your elbow• side of your neck• top of your foot
Statistics In this lesson, you will● recognize statistical
questions.● use dot plots to display
numerical data.
ms_green pe_0901.indd 390ms_green pe_0901.indd 390 1/28/15 3:49:35 PM1/28/15 3:49:35 PM
Section 9.1 Introduction to Statistics 391
4. REASONING What do you think “statistics” means?
5. IN YOUR OWN WORDS How can you tell whether a question is a statistical question? Give examples to support your explanation.
6. Find the least and the greatest heart rates in your class. How can you use these two values to answer the question in Activity 1(e)?
7. Create a one-question survey. Explain why your question is a statistical question. Then conduct your survey and organize your results in a line plot. Make three observations about your data set.
Work with a partner.
a. Answer each question below on your own. Then compare your answers with your partner’s answers. For which questions should your answers be the same? For which questions might your answers be different?
1. What is your shoe size?
2. How many states are in the United States?
3. How many brothers and sisters do you have?
4. How many U.S. presidents have been in offi ce?
5. What is your favorite type of movie?
6. How tall are you?
b. CONJECTURE Some of the questions above are considered statistical questions. Which ones do you think they are? Why?
ACTIVITY: Identifying Types of Questions22
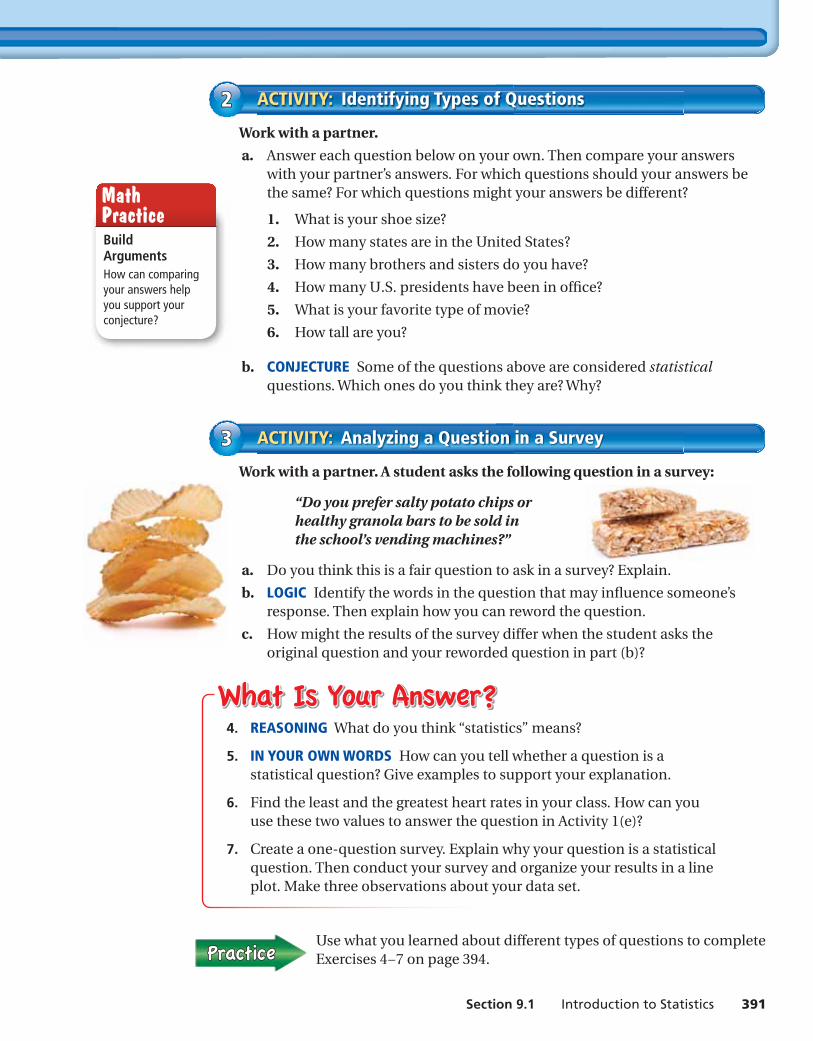
Work with a partner. A student asks the following question in a survey:
“Do you prefer salty potato chips or healthy granola bars to be sold in the school’s vending machines?”
a. Do you think this is a fair question to ask in a survey? Explain.
b. LOGIC Identify the words in the question that may infl uence someone’s response. Then explain how you can reword the question.
c. How might the results of the survey differ when the student asks the original question and your reworded question in part (b)?
ACTIVITY: Analyzing a Question in a Survey33
Use what you learned about different types of questions to complete Exercises 4−7 on page 394.
Build ArgumentsHow can comparing your answers help you support your conjecture?
Math Practice
ms_green pe_0901.indd 391ms_green pe_0901.indd 391 1/28/15 3:49:44 PM1/28/15 3:49:44 PM
392 Chapter 9 Statistical Measures
Lesson9.1
EXAMPLE Answering a Statistical Question11You conduct a science experiment on house mice. Your teacher asks you, “What is the weight of a mouse?”
a. Is this a statistical question? Explain.
Because you can anticipate that the weights of mice will vary, it is a statistical question.
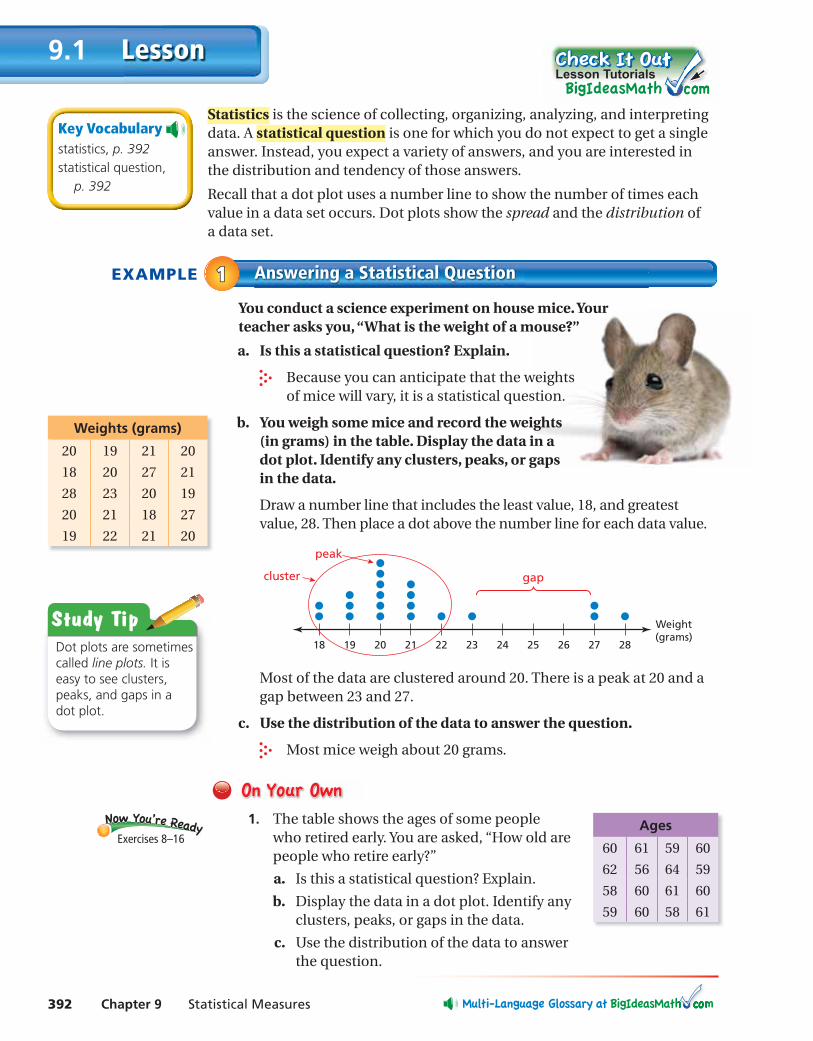
b. You weigh some mice and record the weights (in grams) in the table. Display the data in a dot plot. Identify any clusters, peaks, or gaps in the data.
Draw a number line that includes the least value, 18, and greatest value, 28. Then place a dot above the number line for each data value.
18 19 20 22 24 2621 23 25 27 28
Weight(grams)
peak
gapcluster
Most of the data are clustered around 20. There is a peak at 20 and a gap between 23 and 27.
c. Use the distribution of the data to answer the question.
Most mice weigh about 20 grams.
1. The table shows the ages of some people who retired early. You are asked, “How old are people who retire early?”
a. Is this a statistical question? Explain.
b. Display the data in a dot plot. Identify any clusters, peaks, or gaps in the data.
c. Use the distribution of the data to answer the question.
Exercises 8–16
Lesson Tutorials
Statistics is the science of collecting, organizing, analyzing, and interpreting data. A statistical question is one for which you do not expect to get a single answer. Instead, you expect a variety of answers, and you are interested in the distribution and tendency of those answers.
Recall that a dot plot uses a number line to show the number of times each value in a data set occurs. Dot plots show the spread and the distribution of a data set.
Key Vocabularystatistics, p. 392statistical question, p. 392
Weights (grams)
20 19 21 20
18 20 27 21
28 23 20 19
20 21 18 27
19 22 21 20
Ages
60 61 59 60
62 56 64 59
58 60 61 60
59 60 58 61
Study TipDot plots are sometimes called line plots. It is easy to see clusters, peaks, and gaps in a dot plot.
ms_green pe_0901.indd 392ms_green pe_0901.indd 392 1/28/15 3:49:53 PM1/28/15 3:49:53 PM
Section 9.1 Introduction to Statistics 393
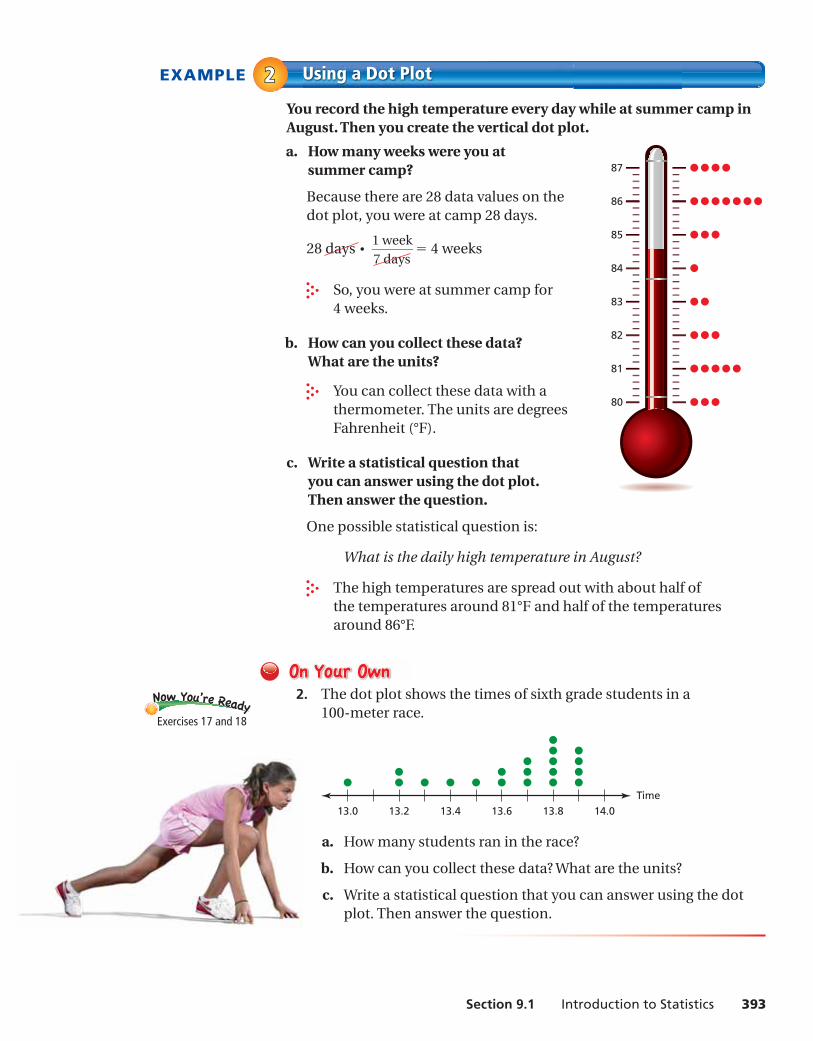
EXAMPLE Using a Dot Plot22You record the high temperature every day while at summer camp in August. Then you create the vertical dot plot.
a. How many weeks were you at summer camp?
Because there are 28 data values on thedot plot, you were at camp 28 days.
28 days ⋅ 1 week —
7 days = 4 weeks
So, you were at summer camp for 4 weeks.
b. How can you collect these data? What are the units?
You can collect these data with a thermometer. The units are degrees Fahrenheit (°F).
c. Write a statistical question that you can answer using the dot plot. Then answer the question.
One possible statistical question is:
What is the daily high temperature in August?
The high temperatures are spread out with about half of the temperatures around 81°F and half of the temperatures around 86°F.
2. The dot plot shows the times of sixth grade students in a 100-meter race.
13.0 13.2 13.4 13.6 13.8 14.0Time
a. How many students ran in the race?
b. How can you collect these data? What are the units?
c. Write a statistical question that you can answer using the dot plot. Then answer the question.
Exercises 17 and 18
80
81
82
83
84
85
86
87
ms_green pe_0901.indd 393ms_green pe_0901.indd 393 1/28/15 3:49:56 PM1/28/15 3:49:56 PM
Exercises9.1
394 Chapter 9 Statistical Measures
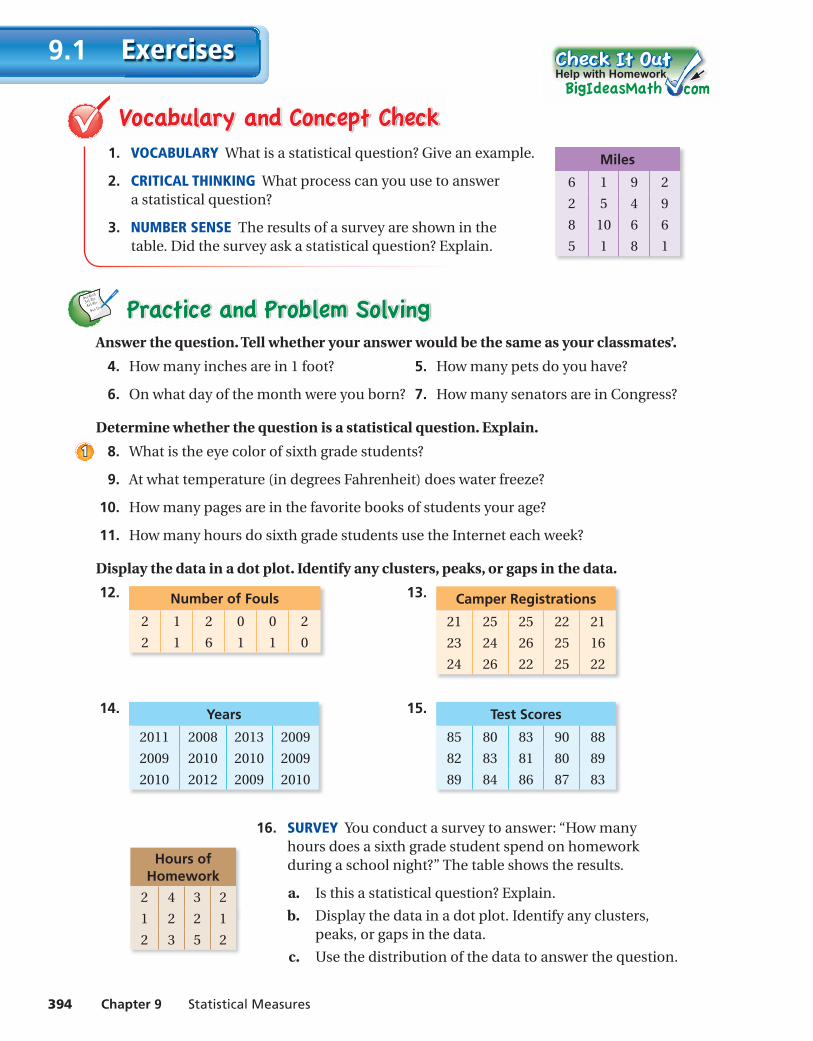
1. VOCABULARY What is a statistical question? Give an example.
2. CRITICAL THINKING What process can you use to answer a statistical question?
3. NUMBER SENSE The results of a survey are shown in the table. Did the survey ask a statistical question? Explain.
9+(-6)=3
3+(-3)=
4+(-9)=
9+(-1)=
Answer the question. Tell whether your answer would be the same as your classmates’.
4. How many inches are in 1 foot? 5. How many pets do you have?
6. On what day of the month were you born? 7. How many senators are in Congress?
Determine whether the question is a statistical question. Explain.
8. What is the eye color of sixth grade students?
9. At what temperature (in degrees Fahrenheit) does water freeze?
10. How many pages are in the favorite books of students your age?
11. How many hours do sixth grade students use the Internet each week?
Display the data in a dot plot. Identify any clusters, peaks, or gaps in the data.
12. Number of Fouls
2 1 2 0 0 2
2 1 6 1 1 0
13. Camper Registrations
21 25 25 22 21
23 24 26 25 16
24 26 22 25 22
14. Years
2011 2008 2013 2009
2009 2010 2010 2009
2010 2012 2009 2010
15. Test Scores
85 80 83 90 88
82 83 81 80 89
89 84 86 87 83
16. SURVEY You conduct a survey to answer: “How many hours does a sixth grade student spend on homework during a school night?” The table shows the results.
a. Is this a statistical question? Explain.
b. Display the data in a dot plot. Identify any clusters, peaks, or gaps in the data.
c. Use the distribution of the data to answer the question.
Help with Homework
Miles
6 1 9 2
2 5 4 9
8 10 6 6
5 1 8 1
Hours of Homework
2 4 3 2
1 2 2 1
2 3 5 2
11
ms_green pe_0901.indd 394ms_green pe_0901.indd 394 1/28/15 3:49:59 PM1/28/15 3:49:59 PM
Section 9.1 Introduction to Statistics 395
Tell whether the ordered pair is a solution of the equation. (Section 7.4)
26. y = 4x; (2, 8) 27. y = 3x + 5; (3, 15) 28. y = 6x − 15; (4, 9)
29. MULTIPLE CHOICE A point is refl ected in the x-axis. The refl ected point is (4, −3). What is the original point? (Section 6.5)
○A (−3, 4) ○B (−4, 3) ○C (−4, −3) ○D (4, 3)
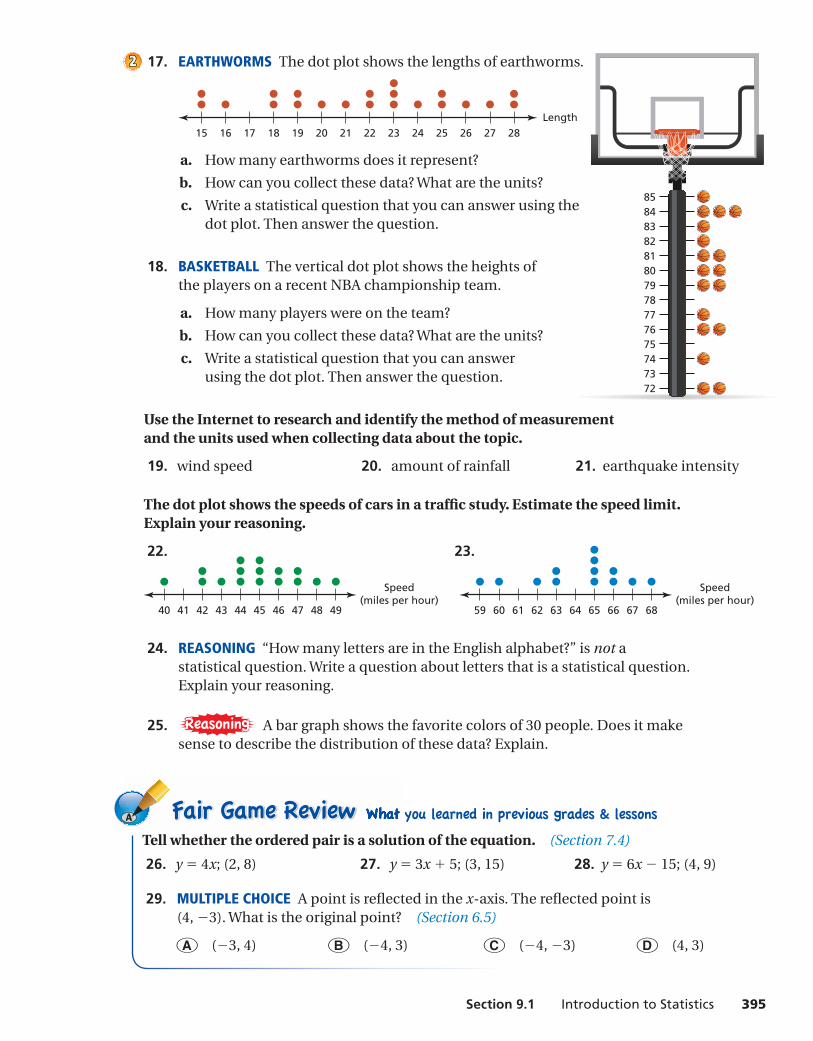
17. EARTHWORMS The dot plot shows the lengths of earthworms.
1615 17 201918 22 24 2621 23 25 27 28Length
a. How many earthworms does it represent?
b. How can you collect these data? What are the units?
c. Write a statistical question that you can answer using the dot plot. Then answer the question.
18. BASKETBALL The vertical dot plot shows the heights of the players on a recent NBA championship team.
a. How many players were on the team?
b. How can you collect these data? What are the units?
c. Write a statistical question that you can answer using the dot plot. Then answer the question.
Use the Internet to research and identify the method of measurement and the units used when collecting data about the topic.
19. wind speed 20. amount of rainfall 21. earthquake intensity
The dot plot shows the speeds of cars in a traffi c study. Estimate the speed limit. Explain your reasoning.
22. 23.
40 41 42 43 44 45 46 47 48 49
Speed(miles per hour)
59 60 61 62 63 64 65 66 67 68
Speed(miles per hour)
24. REASONING “How many letters are in the English alphabet?” is not a statistical question. Write a question about letters that is a statistical question. Explain your reasoning.
25. A bar graph shows the favorite colors of 30 people. Does it make sense to describe the distribution of these data? Explain.
22
7273747576777879808182838485
ms_green pe_0901.indd 395ms_green pe_0901.indd 395 1/28/15 3:50:00 PM1/28/15 3:50:00 PM