(916)286-5129 yuliya hall b - gateway community charters
TRANSCRIPT
Principals Gateway Community Charters
Larissa Gonchar 5726 Dudley Boulevard, McClellan, CA 95652 (916)286-5129
Yuliya Hall Website: www.gcccharters.org
Contact: [email protected]
Board of Trustees Twin Rivers Unified School District Lillie Campbell 5115 Dudley Boulevard, McClellan, CA 95652 (916)566-1600
Bruce Mangerich Website: www.twinriversusd.org
Mark Anderson Contact: [email protected]
Jack Turner
Harry Block
Superintendent/CEO Dr. Cindy Petersen
Every school in California is required by state law to publish a School Accountability Report Card (SARC) by
February 1 of each year. The SARC contains information about the condition and performance of each California
public school. Under the Local Control Funding Formula (LCFF) all local educational agencies (LEAs) are required
to prepare a Local Control Accountability Plan (LCAP), which describes how they intend to meet annual school-
specific goals for all pupils, with specific activities to address state and local priorities. Additionally, data reported
in an LCAP is to be consistent with data reported in the SARC.
For more information about SARC requirements, see the California Department of Education (CDE) SARC
Web page at http://www.cde.ca.gov/ta/ac/sa/
View this SARC online at the school and/or LEA web sites.
For more information about the LCFF or LCAP, see the CDE LCFF Web page at
http://www.cde.ca.gov/fg/aa/lc/
For additional information about the school, parents and community members should contact the school
principal or the GCC Central Office.
DataQuest
DataQuest is an online data tool located on the CDE DataQuest Web page that contains additional information about
this school and comparisons of the school to the district, the county, and the state. Specifically, DataQuest is a
dynamic system that provides reports for accountability (e.g., test data, enrollment, high school graduates, dropouts,
course enrollments, staffing, and data regarding English learners.
California Department of Education
School Accountability Report Card
Reported Using Data from the 2015-2016 School Year
Published During 2016-2017
Community Outreach Academy (Elementary)
5640 Dudley Blvd., McClellan, CA 95652 (916)286-5199
Community Outreach Academy (Middle School)
3800 Bolivar Avenue, North Highlands, CA 95660 (916)286-1908
Website: www.outreachacademy.org
CDS Code: 34765050101766
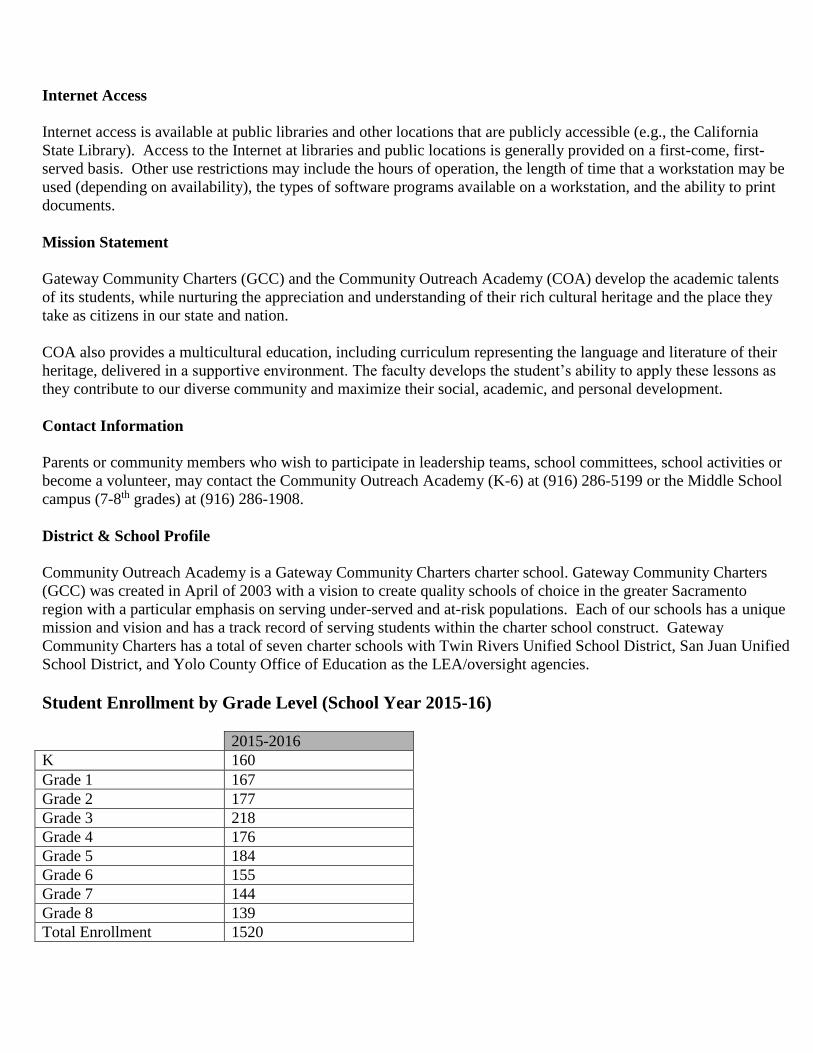
Internet Access
Internet access is available at public libraries and other locations that are publicly accessible (e.g., the California
State Library). Access to the Internet at libraries and public locations is generally provided on a first-come, first-
served basis. Other use restrictions may include the hours of operation, the length of time that a workstation may be
used (depending on availability), the types of software programs available on a workstation, and the ability to print
documents.
Mission Statement
Gateway Community Charters (GCC) and the Community Outreach Academy (COA) develop the academic talents
of its students, while nurturing the appreciation and understanding of their rich cultural heritage and the place they
take as citizens in our state and nation.
COA also provides a multicultural education, including curriculum representing the language and literature of their
heritage, delivered in a supportive environment. The faculty develops the student’s ability to apply these lessons as
they contribute to our diverse community and maximize their social, academic, and personal development.
Contact Information
Parents or community members who wish to participate in leadership teams, school committees, school activities or
become a volunteer, may contact the Community Outreach Academy (K-6) at (916) 286-5199 or the Middle School
campus (7-8th grades) at (916) 286-1908.
District & School Profile
Community Outreach Academy is a Gateway Community Charters charter school. Gateway Community Charters
(GCC) was created in April of 2003 with a vision to create quality schools of choice in the greater Sacramento
region with a particular emphasis on serving under-served and at-risk populations. Each of our schools has a unique
mission and vision and has a track record of serving students within the charter school construct. Gateway
Community Charters has a total of seven charter schools with Twin Rivers Unified School District, San Juan Unified
School District, and Yolo County Office of Education as the LEA/oversight agencies.
Student Enrollment by Grade Level (School Year 2015-16)
2015-2016
K 160
Grade 1 167
Grade 2 177
Grade 3 218
Grade 4 176
Grade 5 184
Grade 6 155
Grade 7 144
Grade 8 139
Total Enrollment 1520
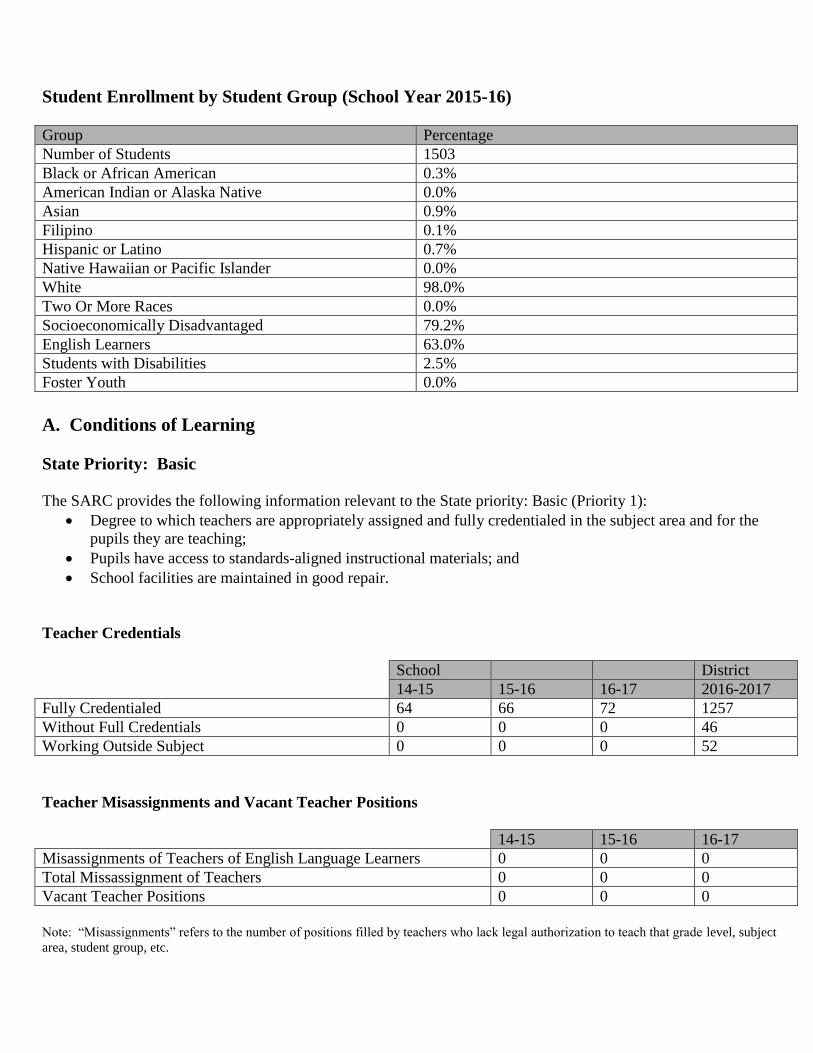
Student Enrollment by Student Group (School Year 2015-16)
Group Percentage
Number of Students 1503
Black or African American 0.3%
American Indian or Alaska Native 0.0%
Asian 0.9%
Filipino 0.1%
Hispanic or Latino 0.7%
Native Hawaiian or Pacific Islander 0.0%
White 98.0%
Two Or More Races 0.0%
Socioeconomically Disadvantaged 79.2%
English Learners 63.0%
Students with Disabilities 2.5%
Foster Youth 0.0%
A. Conditions of Learning
State Priority: Basic
The SARC provides the following information relevant to the State priority: Basic (Priority 1):
Degree to which teachers are appropriately assigned and fully credentialed in the subject area and for the
pupils they are teaching;
Pupils have access to standards-aligned instructional materials; and
School facilities are maintained in good repair.
Teacher Credentials
School District
14-15 15-16 16-17 2016-2017
Fully Credentialed 64 66 72 1257
Without Full Credentials 0 0 0 46
Working Outside Subject 0 0 0 52
Teacher Misassignments and Vacant Teacher Positions
14-15 15-16 16-17
Misassignments of Teachers of English Language Learners 0 0 0
Total Missassignment of Teachers 0 0 0
Vacant Teacher Positions 0 0 0
Note: “Misassignments” refers to the number of positions filled by teachers who lack legal authorization to teach that grade level, subject
area, student group, etc.
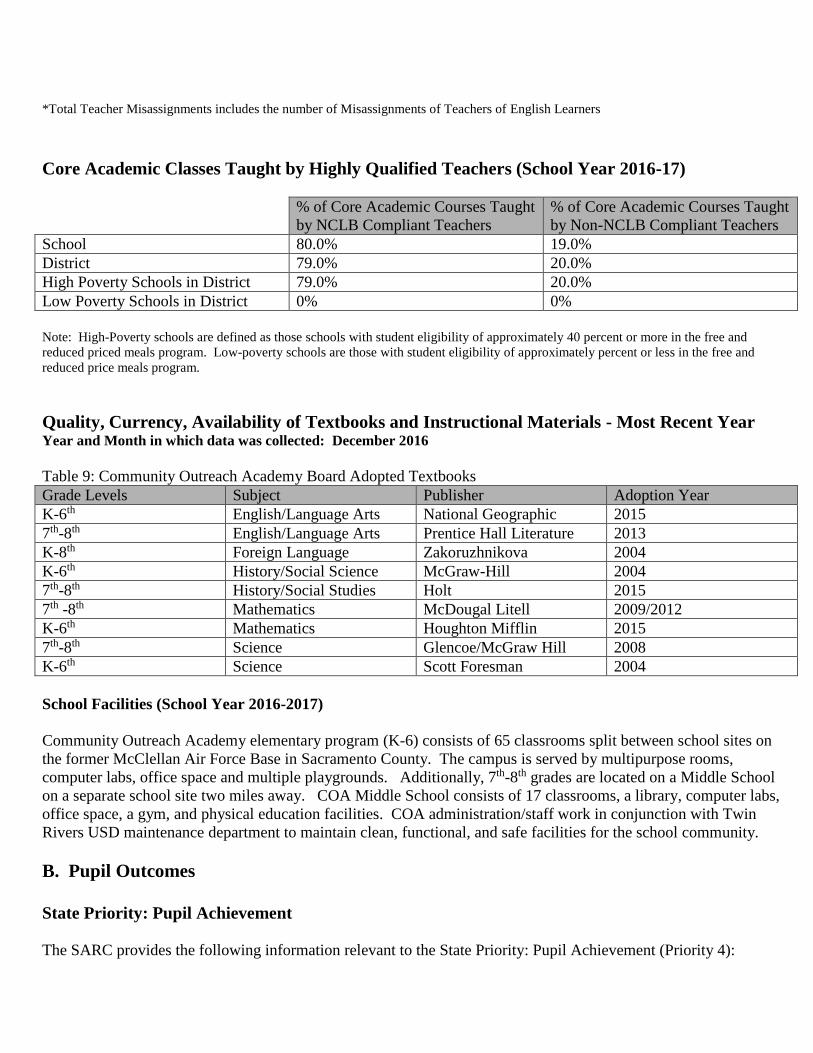
*Total Teacher Misassignments includes the number of Misassignments of Teachers of English Learners
Core Academic Classes Taught by Highly Qualified Teachers (School Year 2016-17)
% of Core Academic Courses Taught
by NCLB Compliant Teachers
% of Core Academic Courses Taught
by Non-NCLB Compliant Teachers
School 80.0% 19.0%
District 79.0% 20.0%
High Poverty Schools in District 79.0% 20.0%
Low Poverty Schools in District 0% 0%
Note: High-Poverty schools are defined as those schools with student eligibility of approximately 40 percent or more in the free and
reduced priced meals program. Low-poverty schools are those with student eligibility of approximately percent or less in the free and
reduced price meals program.
Quality, Currency, Availability of Textbooks and Instructional Materials - Most Recent Year Year and Month in which data was collected: December 2016
Table 9: Community Outreach Academy Board Adopted Textbooks
Grade Levels Subject Publisher Adoption Year
K-6th English/Language Arts National Geographic 2015
7th-8th English/Language Arts Prentice Hall Literature 2013
K-8th Foreign Language Zakoruzhnikova 2004
K-6th History/Social Science McGraw-Hill 2004
7th-8th History/Social Studies Holt 2015
7th -8th Mathematics McDougal Litell 2009/2012
K-6th Mathematics Houghton Mifflin 2015
7th-8th Science Glencoe/McGraw Hill 2008
K-6th Science Scott Foresman 2004
School Facilities (School Year 2016-2017)
Community Outreach Academy elementary program (K-6) consists of 65 classrooms split between school sites on
the former McClellan Air Force Base in Sacramento County. The campus is served by multipurpose rooms,
computer labs, office space and multiple playgrounds. Additionally, 7th-8th grades are located on a Middle School
on a separate school site two miles away. COA Middle School consists of 17 classrooms, a library, computer labs,
office space, a gym, and physical education facilities. COA administration/staff work in conjunction with Twin
Rivers USD maintenance department to maintain clean, functional, and safe facilities for the school community.
B. Pupil Outcomes
State Priority: Pupil Achievement
The SARC provides the following information relevant to the State Priority: Pupil Achievement (Priority 4):
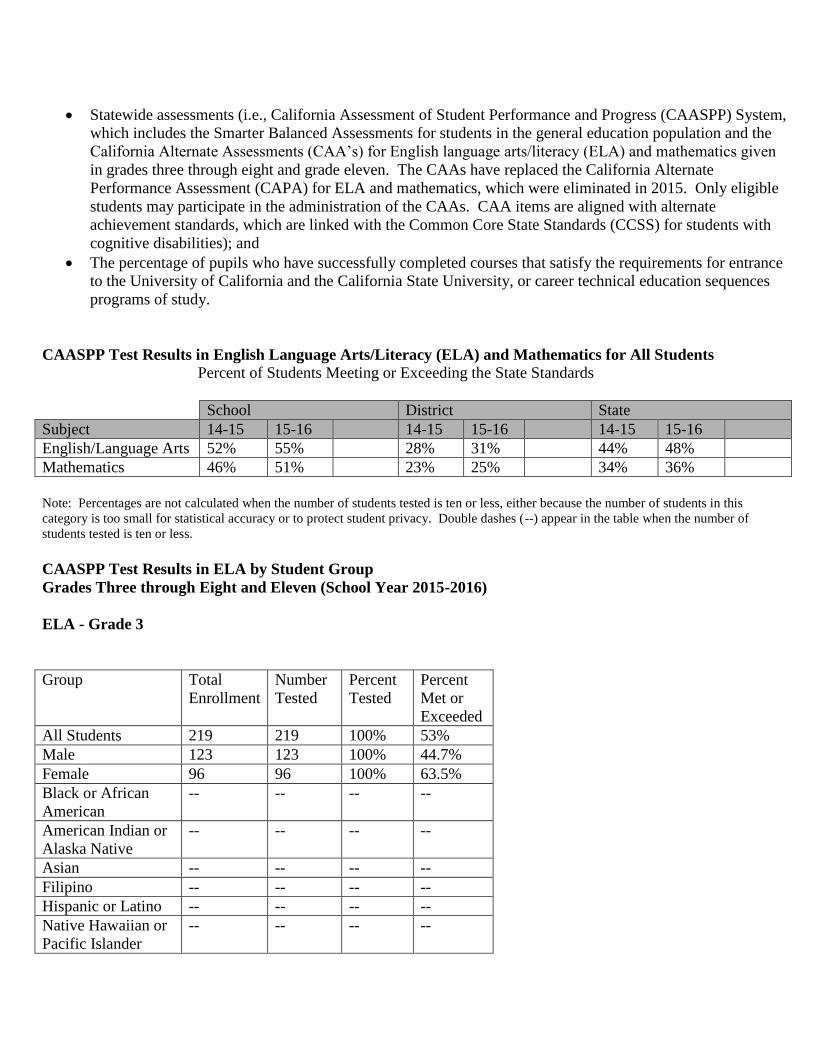
Statewide assessments (i.e., California Assessment of Student Performance and Progress (CAASPP) System,
which includes the Smarter Balanced Assessments for students in the general education population and the
California Alternate Assessments (CAA’s) for English language arts/literacy (ELA) and mathematics given
in grades three through eight and grade eleven. The CAAs have replaced the California Alternate
Performance Assessment (CAPA) for ELA and mathematics, which were eliminated in 2015. Only eligible
students may participate in the administration of the CAAs. CAA items are aligned with alternate
achievement standards, which are linked with the Common Core State Standards (CCSS) for students with
cognitive disabilities); and
The percentage of pupils who have successfully completed courses that satisfy the requirements for entrance
to the University of California and the California State University, or career technical education sequences
programs of study.
CAASPP Test Results in English Language Arts/Literacy (ELA) and Mathematics for All Students
Percent of Students Meeting or Exceeding the State Standards
School District State
Subject 14-15 15-16 14-15 15-16 14-15 15-16
English/Language Arts 52% 55% 28% 31% 44% 48%
Mathematics 46% 51% 23% 25% 34% 36%
Note: Percentages are not calculated when the number of students tested is ten or less, either because the number of students in this
category is too small for statistical accuracy or to protect student privacy. Double dashes (--) appear in the table when the number of
students tested is ten or less.
CAASPP Test Results in ELA by Student Group
Grades Three through Eight and Eleven (School Year 2015-2016)
ELA - Grade 3
Group Total
Enrollment
Number
Tested
Percent
Tested
Percent
Met or
Exceeded
All Students 219 219 100% 53%
Male 123 123 100% 44.7%
Female 96 96 100% 63.5%
Black or African
American
-- -- -- --
American Indian or
Alaska Native
-- -- -- --
Asian -- -- -- --
Filipino -- -- -- --
Hispanic or Latino -- -- -- --
Native Hawaiian or
Pacific Islander
-- -- -- --
White 215 215 100% 53.5%
Two or More Races -- -- -- --
Socioeconomically
Disadvantaged
163 163 100% 45.4%
English Learners 159 159 100% 100%
Students with
Disabilities
-- -- -- --
Students Receiving
Migrant Education
Services
-- -- -- --
Foster Youth -- -- -- --
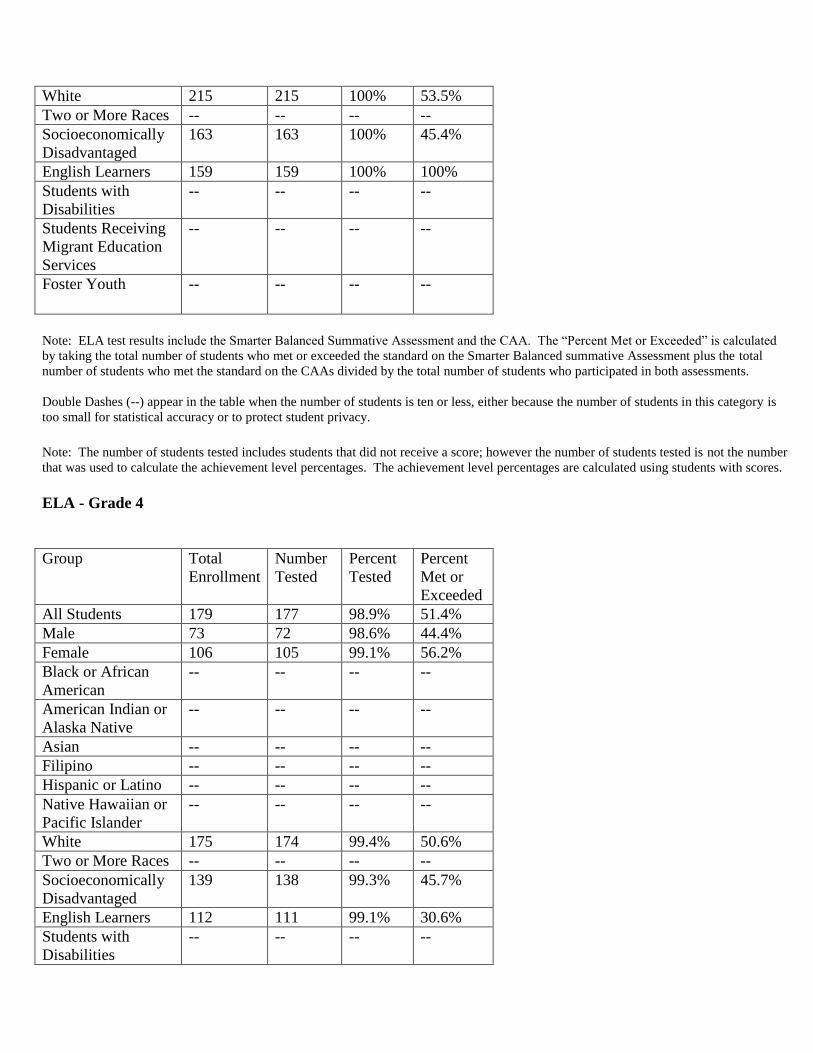
Note: ELA test results include the Smarter Balanced Summative Assessment and the CAA. The “Percent Met or Exceeded” is calculated
by taking the total number of students who met or exceeded the standard on the Smarter Balanced summative Assessment plus the total
number of students who met the standard on the CAAs divided by the total number of students who participated in both assessments.
Double Dashes (--) appear in the table when the number of students is ten or less, either because the number of students in this category is
too small for statistical accuracy or to protect student privacy.
Note: The number of students tested includes students that did not receive a score; however the number of students tested is not the number
that was used to calculate the achievement level percentages. The achievement level percentages are calculated using students with scores.
ELA - Grade 4
Group Total
Enrollment
Number
Tested
Percent
Tested
Percent
Met or
Exceeded
All Students 179 177 98.9% 51.4%
Male 73 72 98.6% 44.4%
Female 106 105 99.1% 56.2%
Black or African
American
-- -- -- --
American Indian or
Alaska Native
-- -- -- --
Asian -- -- -- --
Filipino -- -- -- --
Hispanic or Latino -- -- -- --
Native Hawaiian or
Pacific Islander
-- -- -- --
White 175 174 99.4% 50.6%
Two or More Races -- -- -- --
Socioeconomically
Disadvantaged
139 138 99.3% 45.7%
English Learners 112 111 99.1% 30.6%
Students with
Disabilities
-- -- -- --
Students Receiving
Migrant Education
Services
-- -- -- --
Foster Youth -- -- -- --
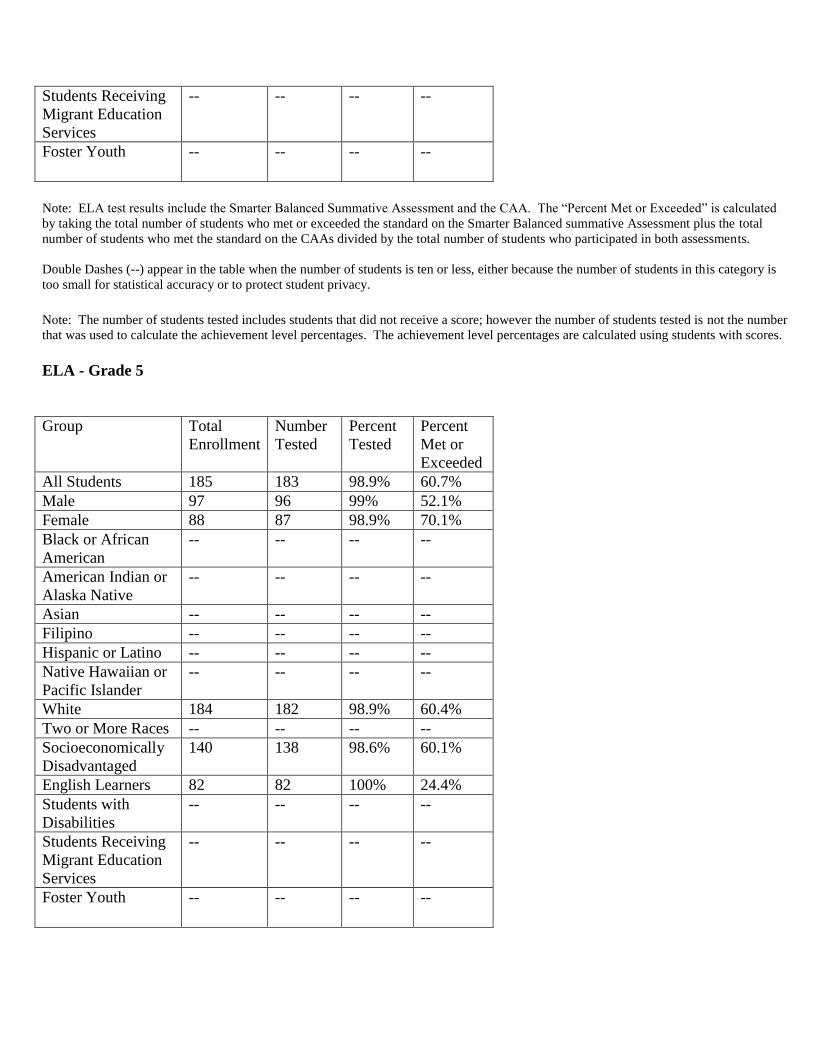
Note: ELA test results include the Smarter Balanced Summative Assessment and the CAA. The “Percent Met or Exceeded” is calculated
by taking the total number of students who met or exceeded the standard on the Smarter Balanced summative Assessment plus the total
number of students who met the standard on the CAAs divided by the total number of students who participated in both assessments.
Double Dashes (--) appear in the table when the number of students is ten or less, either because the number of students in this category is
too small for statistical accuracy or to protect student privacy.
Note: The number of students tested includes students that did not receive a score; however the number of students tested is not the number
that was used to calculate the achievement level percentages. The achievement level percentages are calculated using students with scores.
ELA - Grade 5
Group Total
Enrollment
Number
Tested
Percent
Tested
Percent
Met or
Exceeded
All Students 185 183 98.9% 60.7%
Male 97 96 99% 52.1%
Female 88 87 98.9% 70.1%
Black or African
American
-- -- -- --
American Indian or
Alaska Native
-- -- -- --
Asian -- -- -- --
Filipino -- -- -- --
Hispanic or Latino -- -- -- --
Native Hawaiian or
Pacific Islander
-- -- -- --
White 184 182 98.9% 60.4%
Two or More Races -- -- -- --
Socioeconomically
Disadvantaged
140 138 98.6% 60.1%
English Learners 82 82 100% 24.4%
Students with
Disabilities
-- -- -- --
Students Receiving
Migrant Education
Services
-- -- -- --
Foster Youth -- -- -- --
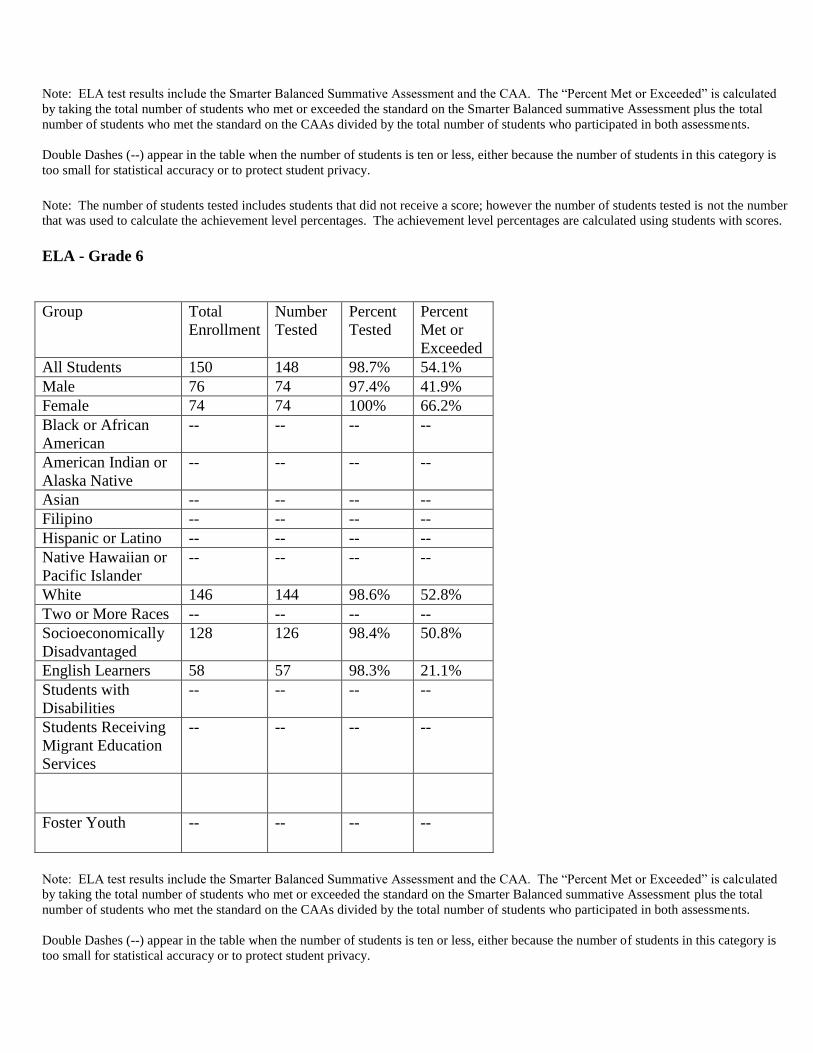
Note: ELA test results include the Smarter Balanced Summative Assessment and the CAA. The “Percent Met or Exceeded” is calculated
by taking the total number of students who met or exceeded the standard on the Smarter Balanced summative Assessment plus the total
number of students who met the standard on the CAAs divided by the total number of students who participated in both assessments.
Double Dashes (--) appear in the table when the number of students is ten or less, either because the number of students in this category is
too small for statistical accuracy or to protect student privacy.
Note: The number of students tested includes students that did not receive a score; however the number of students tested is not the number
that was used to calculate the achievement level percentages. The achievement level percentages are calculated using students with scores.
ELA - Grade 6
Group Total
Enrollment
Number
Tested
Percent
Tested
Percent
Met or
Exceeded
All Students 150 148 98.7% 54.1%
Male 76 74 97.4% 41.9%
Female 74 74 100% 66.2%
Black or African
American
-- -- -- --
American Indian or
Alaska Native
-- -- -- --
Asian -- -- -- --
Filipino -- -- -- --
Hispanic or Latino -- -- -- --
Native Hawaiian or
Pacific Islander
-- -- -- --
White 146 144 98.6% 52.8%
Two or More Races -- -- -- --
Socioeconomically
Disadvantaged
128 126 98.4% 50.8%
English Learners 58 57 98.3% 21.1%
Students with
Disabilities
-- -- -- --
Students Receiving
Migrant Education
Services
-- -- -- --
Foster Youth -- -- -- --
Note: ELA test results include the Smarter Balanced Summative Assessment and the CAA. The “Percent Met or Exceeded” is calculated
by taking the total number of students who met or exceeded the standard on the Smarter Balanced summative Assessment plus the total
number of students who met the standard on the CAAs divided by the total number of students who participated in both assessments.
Double Dashes (--) appear in the table when the number of students is ten or less, either because the number of students in this category is
too small for statistical accuracy or to protect student privacy.
Note: The number of students tested includes students that did not receive a score; however the number of students tested is not the number
that was used to calculate the achievement level percentages. The achievement level percentages are calculated using students with scores.
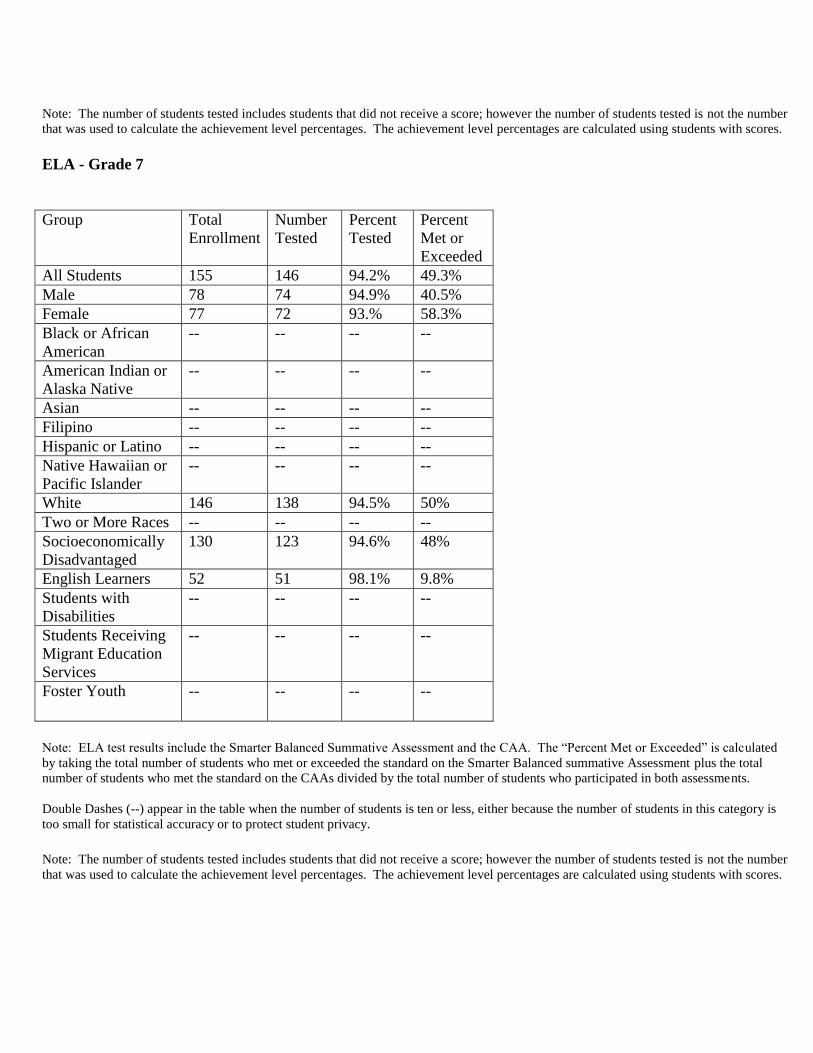
ELA - Grade 7
Group Total
Enrollment
Number
Tested
Percent
Tested
Percent
Met or
Exceeded
All Students 155 146 94.2% 49.3%
Male 78 74 94.9% 40.5%
Female 77 72 93.% 58.3%
Black or African
American
-- -- -- --
American Indian or
Alaska Native
-- -- -- --
Asian -- -- -- --
Filipino -- -- -- --
Hispanic or Latino -- -- -- --
Native Hawaiian or
Pacific Islander
-- -- -- --
White 146 138 94.5% 50%
Two or More Races -- -- -- --
Socioeconomically
Disadvantaged
130 123 94.6% 48%
English Learners 52 51 98.1% 9.8%
Students with
Disabilities
-- -- -- --
Students Receiving
Migrant Education
Services
-- -- -- --
Foster Youth -- -- -- --
Note: ELA test results include the Smarter Balanced Summative Assessment and the CAA. The “Percent Met or Exceeded” is calculated
by taking the total number of students who met or exceeded the standard on the Smarter Balanced summative Assessment plus the total
number of students who met the standard on the CAAs divided by the total number of students who participated in both assessments.
Double Dashes (--) appear in the table when the number of students is ten or less, either because the number of students in this category is
too small for statistical accuracy or to protect student privacy.
Note: The number of students tested includes students that did not receive a score; however the number of students tested is not the number
that was used to calculate the achievement level percentages. The achievement level percentages are calculated using students with scores.

ELA - Grade 8
Group Total
Enrollment
Number
Tested
Percent
Tested
Percent
Met or
Exceeded
All Students 141 134 95% 59%
Male 63 57 90.5% 52.6%
Female 78 77 98.7% 63.6%
Black or African
American
-- -- -- --
American Indian or
Alaska Native
-- -- -- --
Asian -- -- -- --
Filipino -- -- -- --
Hispanic or Latino -- -- -- --
Native Hawaiian or
Pacific Islander
-- -- -- --
White 132 127 96.2% 58.3%
Two or More Races -- -- -- --
Socioeconomically
Disadvantaged
107 103 96.3% 57.3%
English Learners 38 36 94.7% 22.2%
Students with
Disabilities
-- -- -- --
Students Receiving
Migrant Education
Services
-- -- -- --
Foster Youth -- -- -- --
Note: ELA test results include the Smarter Balanced Summative Assessment and the CAA. The “Percent Met or Exceeded” is calculated
by taking the total number of students who met or exceeded the standard on the Smarter Balanced summative Assessment plus the total
number of students who met the standard on the CAAs divided by the total number of students who participated in both assessments.
Double Dashes (--) appear in the table when the number of students is ten or less, either because the number of students in this category is
too small for statistical accuracy or to protect student privacy.
Note: The number of students tested includes students that did not receive a score; however the number of students tested is not the number
that was used to calculate the achievement level percentages. The achievement level percentages are calculated using students with scores.
CAASPP Test Results in Mathematics by Student Group
Grades Three through Eight and Eleven (School Year 2015-16)
Mathematics - Grade 3
Group Total Number Percent Percent
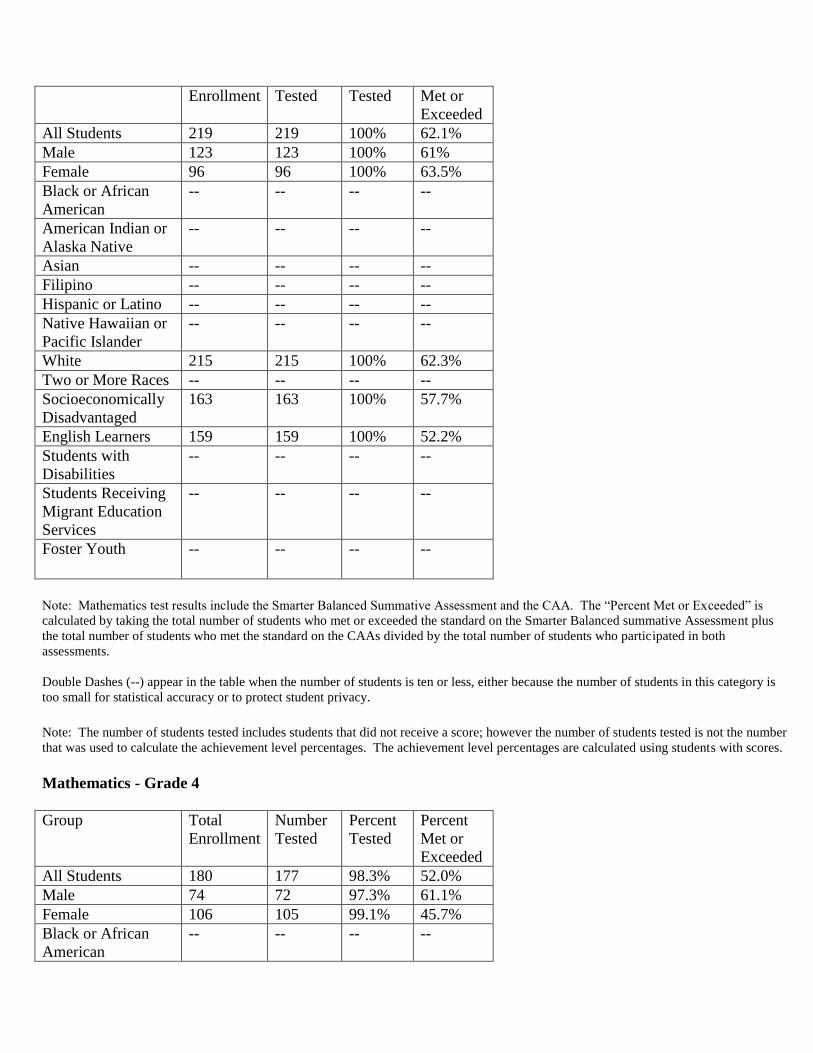
Enrollment Tested Tested Met or
Exceeded
All Students 219 219 100% 62.1%
Male 123 123 100% 61%
Female 96 96 100% 63.5%
Black or African
American
-- -- -- --
American Indian or
Alaska Native
-- -- -- --
Asian -- -- -- --
Filipino -- -- -- --
Hispanic or Latino -- -- -- --
Native Hawaiian or
Pacific Islander
-- -- -- --
White 215 215 100% 62.3%
Two or More Races -- -- -- --
Socioeconomically
Disadvantaged
163 163 100% 57.7%
English Learners 159 159 100% 52.2%
Students with
Disabilities
-- -- -- --
Students Receiving
Migrant Education
Services
-- -- -- --
Foster Youth -- -- -- --
Note: Mathematics test results include the Smarter Balanced Summative Assessment and the CAA. The “Percent Met or Exceeded” is
calculated by taking the total number of students who met or exceeded the standard on the Smarter Balanced summative Assessment plus
the total number of students who met the standard on the CAAs divided by the total number of students who participated in both
assessments.
Double Dashes (--) appear in the table when the number of students is ten or less, either because the number of students in this category is
too small for statistical accuracy or to protect student privacy.
Note: The number of students tested includes students that did not receive a score; however the number of students tested is not the number
that was used to calculate the achievement level percentages. The achievement level percentages are calculated using students with scores.
Mathematics - Grade 4
Group Total
Enrollment
Number
Tested
Percent
Tested
Percent
Met or
Exceeded
All Students 180 177 98.3% 52.0%
Male 74 72 97.3% 61.1%
Female 106 105 99.1% 45.7%
Black or African
American
-- -- -- --
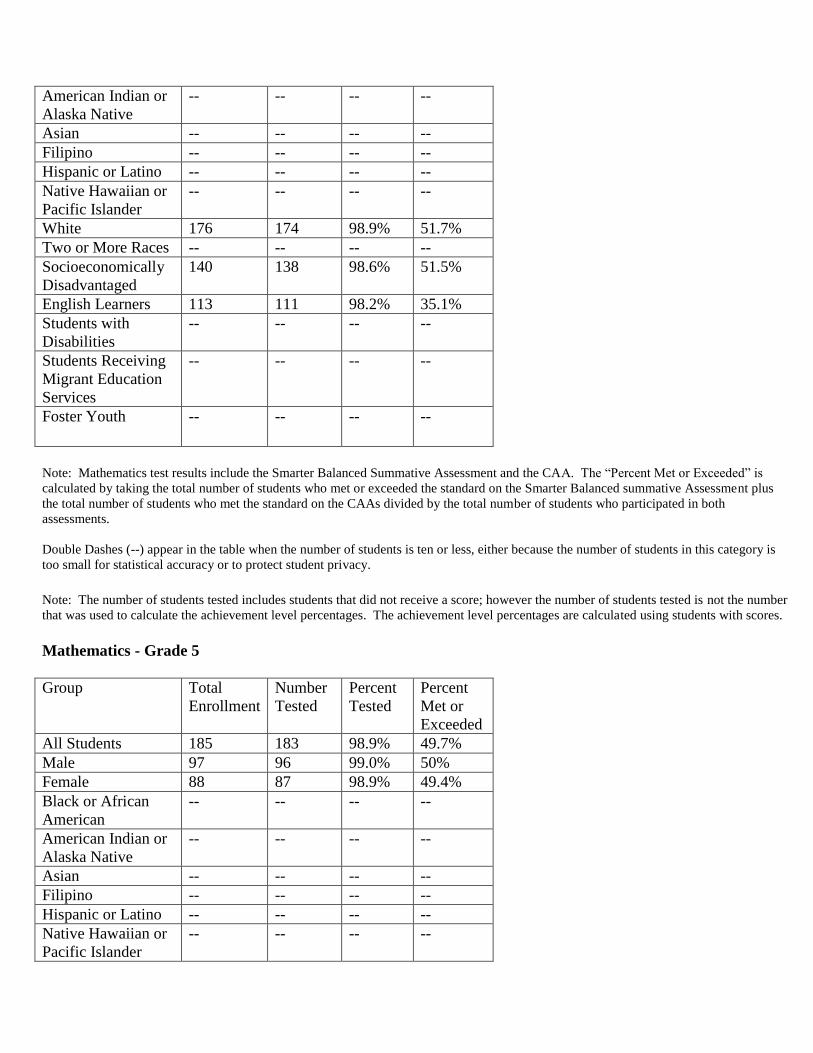
American Indian or
Alaska Native
-- -- -- --
Asian -- -- -- --
Filipino -- -- -- --
Hispanic or Latino -- -- -- --
Native Hawaiian or
Pacific Islander
-- -- -- --
White 176 174 98.9% 51.7%
Two or More Races -- -- -- --
Socioeconomically
Disadvantaged
140 138 98.6% 51.5%
English Learners 113 111 98.2% 35.1%
Students with
Disabilities
-- -- -- --
Students Receiving
Migrant Education
Services
-- -- -- --
Foster Youth -- -- -- --
Note: Mathematics test results include the Smarter Balanced Summative Assessment and the CAA. The “Percent Met or Exceeded” is
calculated by taking the total number of students who met or exceeded the standard on the Smarter Balanced summative Assessment plus
the total number of students who met the standard on the CAAs divided by the total number of students who participated in both
assessments.
Double Dashes (--) appear in the table when the number of students is ten or less, either because the number of students in this category is
too small for statistical accuracy or to protect student privacy.
Note: The number of students tested includes students that did not receive a score; however the number of students tested is not the number
that was used to calculate the achievement level percentages. The achievement level percentages are calculated using students with scores.
Mathematics - Grade 5
Group Total
Enrollment
Number
Tested
Percent
Tested
Percent
Met or
Exceeded
All Students 185 183 98.9% 49.7%
Male 97 96 99.0% 50%
Female 88 87 98.9% 49.4%
Black or African
American
-- -- -- --
American Indian or
Alaska Native
-- -- -- --
Asian -- -- -- --
Filipino -- -- -- --
Hispanic or Latino -- -- -- --
Native Hawaiian or
Pacific Islander
-- -- -- --
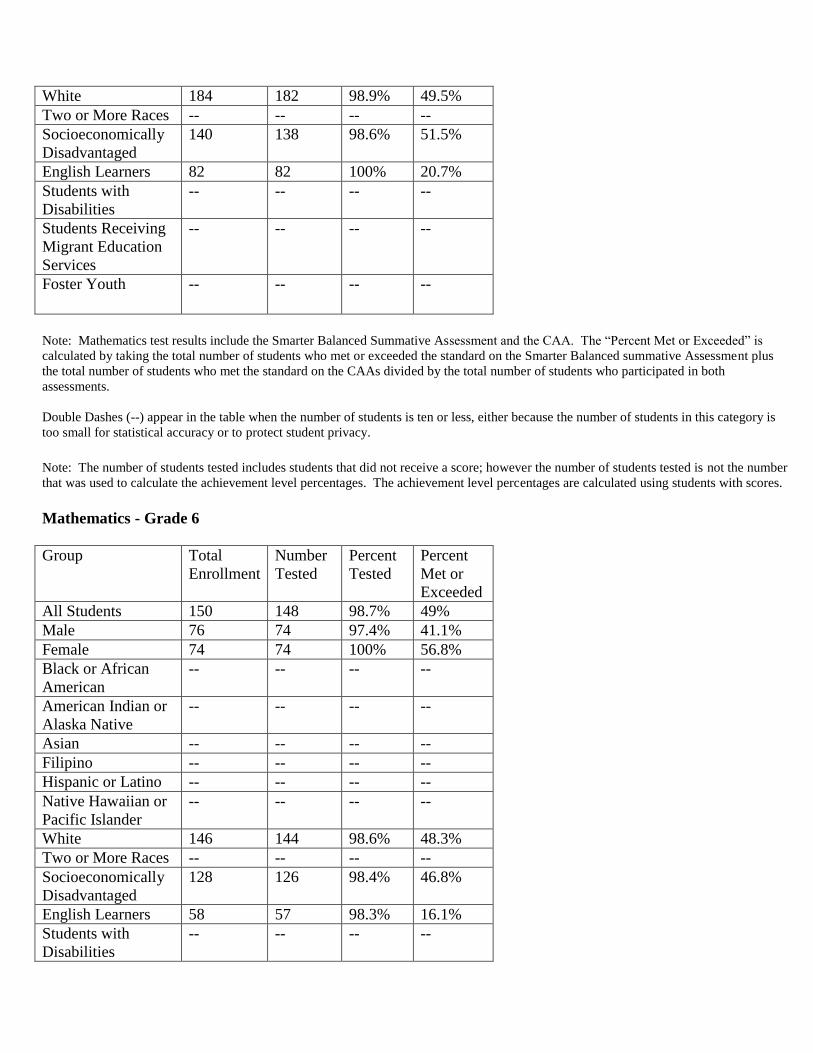
White 184 182 98.9% 49.5%
Two or More Races -- -- -- --
Socioeconomically
Disadvantaged
140 138 98.6% 51.5%
English Learners 82 82 100% 20.7%
Students with
Disabilities
-- -- -- --
Students Receiving
Migrant Education
Services
-- -- -- --
Foster Youth -- -- -- --
Note: Mathematics test results include the Smarter Balanced Summative Assessment and the CAA. The “Percent Met or Exceeded” is
calculated by taking the total number of students who met or exceeded the standard on the Smarter Balanced summative Assessment plus
the total number of students who met the standard on the CAAs divided by the total number of students who participated in both
assessments.
Double Dashes (--) appear in the table when the number of students is ten or less, either because the number of students in this category is
too small for statistical accuracy or to protect student privacy.
Note: The number of students tested includes students that did not receive a score; however the number of students tested is not the number
that was used to calculate the achievement level percentages. The achievement level percentages are calculated using students with scores.
Mathematics - Grade 6
Group Total
Enrollment
Number
Tested
Percent
Tested
Percent
Met or
Exceeded
All Students 150 148 98.7% 49%
Male 76 74 97.4% 41.1%
Female 74 74 100% 56.8%
Black or African
American
-- -- -- --
American Indian or
Alaska Native
-- -- -- --
Asian -- -- -- --
Filipino -- -- -- --
Hispanic or Latino -- -- -- --
Native Hawaiian or
Pacific Islander
-- -- -- --
White 146 144 98.6% 48.3%
Two or More Races -- -- -- --
Socioeconomically
Disadvantaged
128 126 98.4% 46.8%
English Learners 58 57 98.3% 16.1%
Students with
Disabilities
-- -- -- --
Students Receiving
Migrant Education
Services
-- -- -- --
Foster Youth -- -- -- --
Note: Mathematics test results include the Smarter Balanced Summative Assessment and the CAA. The “Percent Met or Exceeded” is
calculated by taking the total number of students who met or exceeded the standard on the Smarter Balanced summative Assessment plus
the total number of students who met the standard on the CAAs divided by the total number of students who participated in both
assessments.
Double Dashes (--) appear in the table when the number of students is ten or less, either because the number of students in this category is
too small for statistical accuracy or to protect student privacy.
Note: The number of students tested includes students that did not receive a score; however the number of students tested is not the number
that was used to calculate the achievement level percentages. The achievement level percentages are calculated using students with scores.
Mathematics - Grade 7
Group Total
Enrollment
Number
Tested
Percent
Tested
Percent
Met or
Exceeded
All Students 155 151 97.4% 50.3%
Male 78 76 97.4% 55.3%
Female 77 75 97.4% 45.3%
Black or African
American
-- -- -- --
American Indian or
Alaska Native
-- -- -- --
Asian -- -- -- --
Filipino -- -- -- --
Hispanic or Latino -- -- -- --
Native Hawaiian or
Pacific Islander
-- -- -- --
White 146 143 98% 51.1%
Two or More Races -- -- -- --
Socioeconomically
Disadvantaged
130 128 98.5% 48.4%
English Learners 52 52 100% 13.5%
Students with
Disabilities
-- -- -- --
Students Receiving
Migrant Education
Services
-- -- -- --
Foster Youth -- -- -- --
Note: Mathematics test results include the Smarter Balanced Summative Assessment and the CAA. The “Percent Met or Exceeded” is
calculated by taking the total number of students who met or exceeded the standard on the Smarter Balanced summative Assessment plus
the total number of students who met the standard on the CAAs divided by the total number of students who participated in both
assessments.
Double Dashes (--) appear in the table when the number of students is ten or less, either because the number of students in this category is
too small for statistical accuracy or to protect student privacy.
Note: The number of students tested includes students that did not receive a score; however the number of students tested is not the number
that was used to calculate the achievement level percentages. The achievement level percentages are calculated using students with scores.
Mathematics - Grade 8
Group Total
Enrollment
Number
Tested
Percent
Tested
Percent
Met or
Exceeded
All Students 141 137 97.2% 34.3%
Male 63 59 93.7% 32.2%
Female 78 78 100% 35.0%
Black or African
American
-- -- -- --
American Indian or
Alaska Native
-- -- -- --
Asian -- -- -- --
Filipino -- -- -- --
Hispanic or Latino -- -- -- --
Native Hawaiian or
Pacific Islander
-- -- -- --
White 132 130 98.5% 34.6%
Two or More Races -- -- -- --
Socioeconomically
Disadvantaged
107 106 99.1% 33%
English Learners 38 37 97.4% 13.5%
Students with
Disabilities
-- -- -- --
Students Receiving
Migrant Education
Services
-- -- -- --
Foster Youth -- -- -- --
Note: Mathematics test results include the Smarter Balanced Summative Assessment and the CAA. The “Percent Met or Exceeded” is
calculated by taking the total number of students who met or exceeded the standard on the Smarter Balanced summative Assessment plus
the total number of students who met the standard on the CAAs divided by the total number of students who participated in both
assessments.
Double Dashes (--) appear in the table when the number of students is ten or less, either because the number of students in this category is
too small for statistical accuracy or to protect student privacy.
Note: The number of students tested includes students that did not receive a score; however the number of students tested is not the number
that was used to calculate the achievement level percentages. The achievement level percentages are calculated using students with scores.
CAASPP Test Results in Science for All Students
Percent of Students Scoring at Proficient or Advanced (meeting or exceeding the state standards)
Note: Science test results include California Standards Tests (CSTs), California Modified Assessment (CMA), and California Alternate
Performance Assessment (CAPA) in grades five, eight and ten.
Note: Scores are not shown when the number of students tested is ten or less, either because the number of students in this category is too
small for statistical accuracy or to protect student privacy.
CAASPP Test Results in Science by Student Group
Grades Five, Eight and Grade 10 (School Year 2015-2016)
Group Total Enrollment # Valid Scores % Valid Scores % Prof/Advanced
All Students 326 319 97.9% 73.4%
Male 160 155 96.9% 68.4%
Female 166 164 98.8% 78.1%
Black or African American -- -- -- --
American Indian or Alaska
Native
0 0 0% 0%
Asian -- -- -- --
Filipino 0 0 0% 0%
Hispanic or Latino -- -- -- --
Native Hawaiian or Pacific
Islander
0 0 0% 0%
White 316 311 98.4% 73.0%
Two or More Races 0 0 0% 0%
Socioeconomically
Disadvantaged
247 243 98.4% 73.7%
English Learners 120 118 98.3% 45.8%
Students with Disabilities 11 9 81.8% 22.2%
Students Receiving Migrant
Education Services
0 0 0% 0%
Foster Youth -- -- -- --
Note: Science test results include CST’s, CMA, and CAPA in grades five, eight, and ten. The “Proficient or Advanced” is calculated by
taking the total number of students who scored at Proficient or Advanced on the science assessment divided by the total number of students
with valid scores.
School District State
Subject 13-14 14-15 15-16 13-14 14-15 15-16 13-14 14-15 15-16
Science (Grades 5, 8, 10) 78% 69% 73% 47% 43% 40% 60% 56% 54%

Note: Scores are not shown when the number of students tested is ten or less, either because the number of students in this category is too
small for statistical accuracy or to protect student privacy. Double dashes (--) appear in the table when the number of students tested is ten
or less.
Career Technical Education Participation (School Year 2015-16)
Measure CTE Program Participation
Number of pupils participating in CTE --
Percent of pupils completing a CTE program and earning a high school diploma --
Percent of CTE courses sequenced or articulated between the school and institutions
of postsecondary education
--
Courses for University of California and/or California State University Admission
UC/CSU Course Measure Percent
2015-16 Students Enrolled in Courses required for UC/CSU Admission --
2014-15 Graduates Who Completed All Courses Required for UC/CSU Admission --
State Priority: Other Pupil Outcomes
The SARC provides the following information relevant to the State priority: Other Pupil Outcomes (Priority 8):
Pupil outcomes in the subject areas of English, mathematics, and physical education.
California Physical Fitness Test Results (School Year 2015-2016)
Grade Level Four of Six Standards Five of Six Standards Six of Six Standards
5th 88.9% 75.1% 48.6%
7th 92.7% 83.3% 68.5%
Note: Percentages are not calculated when the number of students tested is ten or less, either because the number of students in this
category is too small for statistical accuracy or to protect student privacy.
C. Engagement
State Priority: Parental Involvement
The SARC provides the following information relevant to the State priority: Parental Involvement (Priority 3):
Efforts the school district makes to seek parent input in making decisions for the school district and each
school site.
Opportunities for Parental Involvement (School Year 2014-2015)
Parent Involvement
Community Outreach Academy continues to build solid relationships between the school and the home. Parents play
an important role in COA through active participation and involvement in the Parent Teacher Organization, English
Language Advisory Council (ELAC) and School Site Council (SSC). Parents on SSC provide critical feedback
regarding the school’s Single School District and LCAP plans. Community Outreach Academy offers parent
nights and skill building workshops to give parents tools to help their children succeed. Parents are also strongly
encouraged to attend parent teacher conferences at all grade levels. A Parent Liaison also helps to reach out to
parents and involves them in supporting students. For more information about parent involvement opportunities at
the school, please contact the school office at 916.286.5199 (Grades K-6) and 916.286.1908 (Grades 7-8).
State Priority: Pupil Engagement
The SARC provides the following information relevant to the State priority: Pupil Engagement (Priority 5):
High School dropout rates; and
High School graduation rates.
Note: Community Outreach Academy is a K-8 school and none of the above indicators are applicable.
State Priority: School Climate
The SARC provides the following information relevant to the State priority: School Climate (Priority 6):
Pupil suspension rates;
Pupil expulsion rates; and
Other local measures on the sense of safety.
Suspensions and Expulsions
School District State
Rate 13-14 14-15 15-16 13-14 14-15 15-16 13-14 14-15 15-16
Suspensions 2.7% 1.8% 2.6% 8.8% 7.7% 7.8% 4.4% 3.8% 3.7%
Expulsions 0.0% 0.0% 0.0% 0.0% 0.0% 0.0% 0.1% 0.1% 0.1%
School Safety Plan
Gateway Community Charters, in conjunction with Community Outreach Academy, has adopted a Comprehensive
School Safety Plan that is reviewed and revised in February and board-adopted by March 1 each year. The plan
addresses required elements such as campus safety and security, emergency preparedness, disaster plans, school
uniform policy, student discipline, anti-discrimination and harassment, anti-bullying, etc.
School safety is a primary concern of Community Outreach Academy. The school strives to be in compliance with
all laws, rules, and regulations pertaining to hazardous materials and state earthquake standards. Each classroom and
office area has an Emergency Preparedness Guide. The school at large has regular fire, earthquake and lockdown
drills. The safety plan is updated each year and reviewed with staff every fall. A school site representative
participates on the Gateway Community Charters Safety Committee. Visitors to the school must first check in at the
front office. All students must be signed out at the end of the day.
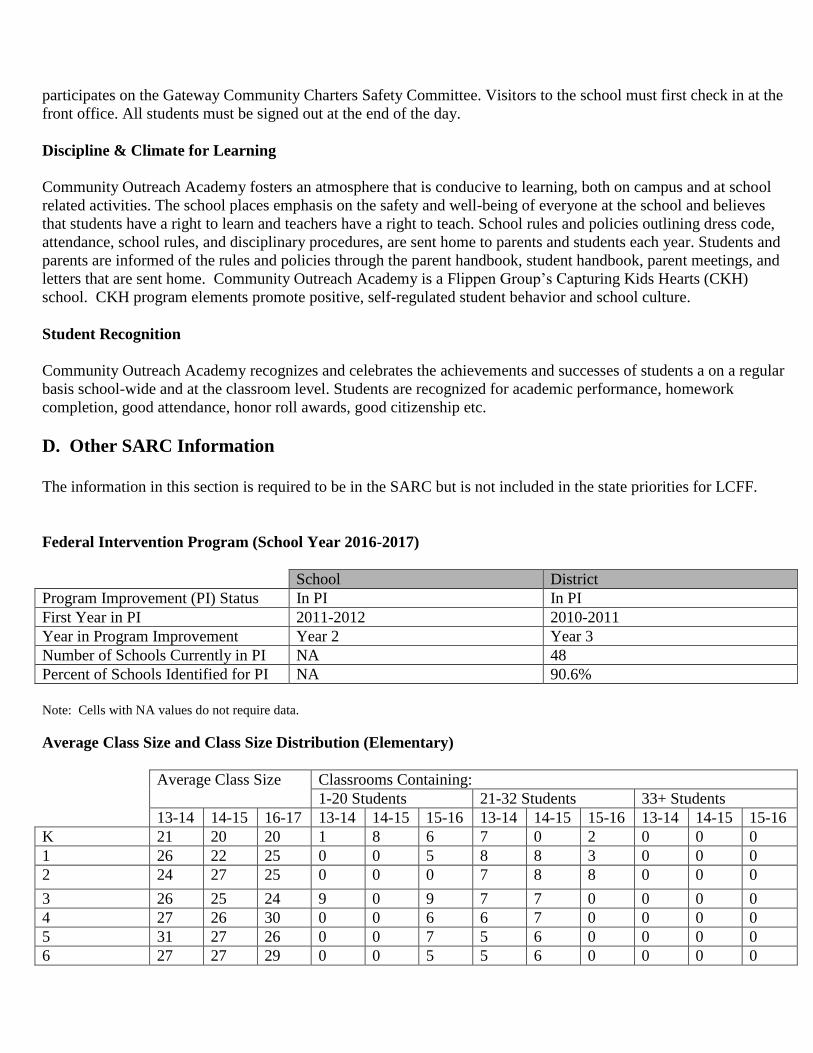
Discipline & Climate for Learning
Community Outreach Academy fosters an atmosphere that is conducive to learning, both on campus and at school
related activities. The school places emphasis on the safety and well-being of everyone at the school and believes
that students have a right to learn and teachers have a right to teach. School rules and policies outlining dress code,
attendance, school rules, and disciplinary procedures, are sent home to parents and students each year. Students and
parents are informed of the rules and policies through the parent handbook, student handbook, parent meetings, and
letters that are sent home. Community Outreach Academy is a Flippen Group’s Capturing Kids Hearts (CKH)
school. CKH program elements promote positive, self-regulated student behavior and school culture.
Student Recognition
Community Outreach Academy recognizes and celebrates the achievements and successes of students a on a regular
basis school-wide and at the classroom level. Students are recognized for academic performance, homework
completion, good attendance, honor roll awards, good citizenship etc.
D. Other SARC Information
The information in this section is required to be in the SARC but is not included in the state priorities for LCFF.
Federal Intervention Program (School Year 2016-2017)
School District
Program Improvement (PI) Status In PI In PI
First Year in PI 2011-2012 2010-2011
Year in Program Improvement Year 2 Year 3
Number of Schools Currently in PI NA 48
Percent of Schools Identified for PI NA 90.6%
Note: Cells with NA values do not require data.
Average Class Size and Class Size Distribution (Elementary)
Average Class Size Classrooms Containing:
1-20 Students 21-32 Students 33+ Students
13-14 14-15 16-17 13-14 14-15 15-16 13-14 14-15 15-16 13-14 14-15 15-16
K 21 20 20 1 8 6 7 0 2 0 0 0
1 26 22 25 0 0 5 8 8 3 0 0 0
2 24 27 25 0 0 0 7 8 8 0 0 0
3 26 25 24 9 0 9 7 7 0 0 0 0
4 27 26 30 0 0 6 6 7 0 0 0 0
5 31 27 26 0 0 7 5 6 0 0 0 0
6 27 27 29 0 0 5 5 6 0 0 0 0
* Number of classes indicates how many classes fall into each size category (a range of total students per class).
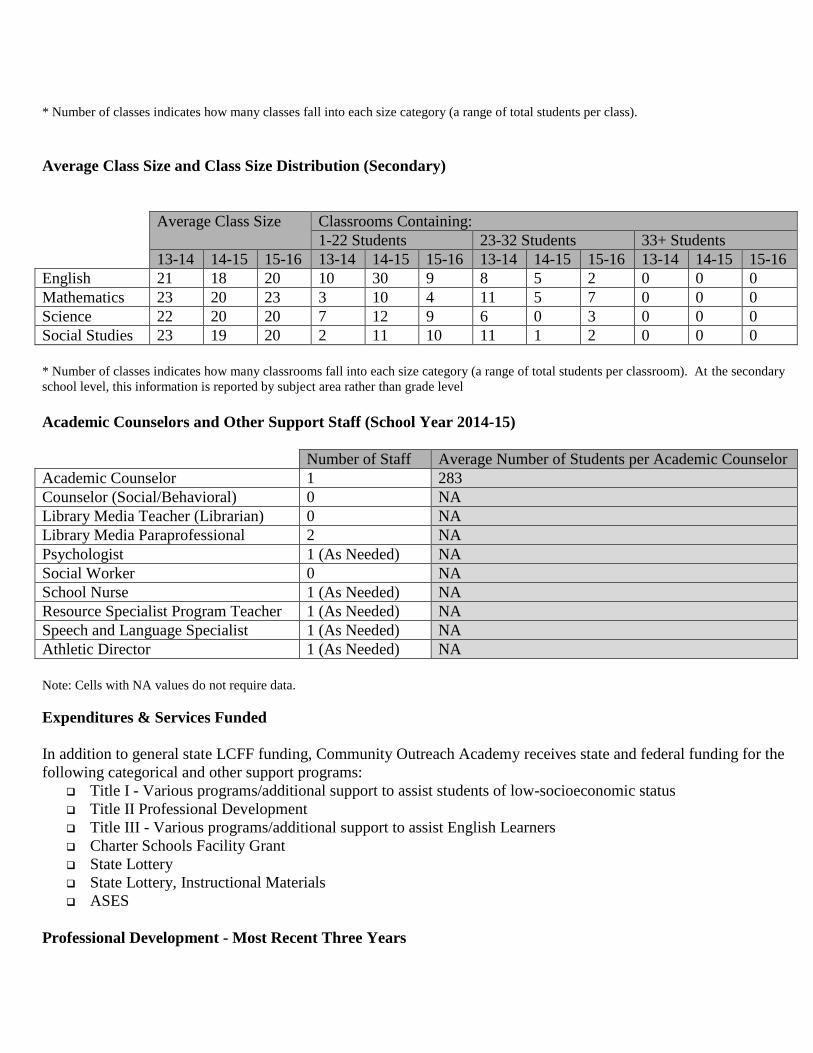
Average Class Size and Class Size Distribution (Secondary)
Average Class Size Classrooms Containing:
1-22 Students 23-32 Students 33+ Students
13-14 14-15 15-16 13-14 14-15 15-16 13-14 14-15 15-16 13-14 14-15 15-16
English 21 18 20 10 30 9 8 5 2 0 0 0
Mathematics 23 20 23 3 10 4 11 5 7 0 0 0
Science 22 20 20 7 12 9 6 0 3 0 0 0
Social Studies 23 19 20 2 11 10 11 1 2 0 0 0
* Number of classes indicates how many classrooms fall into each size category (a range of total students per classroom). At the secondary
school level, this information is reported by subject area rather than grade level
Academic Counselors and Other Support Staff (School Year 2014-15)
Number of Staff Average Number of Students per Academic Counselor
Academic Counselor 1 283
Counselor (Social/Behavioral) 0 NA
Library Media Teacher (Librarian) 0 NA
Library Media Paraprofessional 2 NA
Psychologist 1 (As Needed) NA
Social Worker 0 NA
School Nurse 1 (As Needed) NA
Resource Specialist Program Teacher 1 (As Needed) NA
Speech and Language Specialist 1 (As Needed) NA
Athletic Director 1 (As Needed) NA
Note: Cells with NA values do not require data.
Expenditures & Services Funded
In addition to general state LCFF funding, Community Outreach Academy receives state and federal funding for the
following categorical and other support programs:
Title I - Various programs/additional support to assist students of low-socioeconomic status
Title II Professional Development
Title III - Various programs/additional support to assist English Learners
Charter Schools Facility Grant
State Lottery
State Lottery, Instructional Materials
ASES
Professional Development - Most Recent Three Years
Staff members at COA participate in a comprehensive program of professional development. The primary focus of
professional development at COA in recent years has been transition to Common Core State Standards, Next
Generation Science Standards, new benchmark assessments, and the CAASPP system. Furthermore, in order to
address the needs of the large number of English Learners at the school, COA is a Project Guided Language
Acquisition and Development (GLAD) school, and significant professional development is required. Finally, COA
is a Capturing Kids’ Hearts (CKH) school - CKH is a comprehensive program designed to enhance school culture as
well as build self-regulated behavior among students. The program requires frequent staff development and
collaboration.
The school offers five staff development days annually and holds weekly collaboration meetings where teachers are
offered a broad based variety of professional growth opportunities in curriculum, teaching strategies, and
methodologies. Friday afternoon collaboration is also utilized for review of school-wide and student specific data to
create critical intervention and support strategies to ensure ongoing student growth and success.