93-30883 in - apps.dtic.mil · or ice, are fairly high at ... friction requirements.text 1 october...
TRANSCRIPT
AD-A274 242
* Final ReportAgreement T9233, Task 1, Subtask 8
TRAC Special Projects
EVALUATION OF SURFACE FRICTIONGUIDELINES FOR WASHINGTON
STATE HIGHWAYS
TI,
by *t
Patricia CorselloLT, CEC, USN ; . •'•-University of Washington ..
Washington State Transportation Center (TRAC)University of Washington, JD- 10
The University District Building, Suite 5351107 N.E. 45th St.
Seattle, Washington 98105-4631
Washington State Department of TransportationTechnical Monitor
Newt JacksonPavement and Soils Engineer, WSDOT
Prepared for
Washington State Transportation CommissionDepartment of Transportation
pro -.a d. -a in nili1 93-30883
93 j2 21. 2 1 2October 1993
ABSTRACT
The Washington State Department of Transportation (WSDOT) determines wet-
pavement surface friction characteristics by conducting skid-tests in accordance with
American Society for Testing and Materials (ASTM) Method E-274. The results of the
skid-tests, Friction Number (FN), are used as one of several variables in programming
safety improvements.
This report examines literature from the United States and abroad on friction
number guidelines for highways. On the basis of an analysis of the literature, a revised
friction number guideline was developed. The new guideline is consistent with other
highway departments that have recently reviewed their minimum friction number
guidelines. Most importantly, the new guideline provides WSDOT pavement engineers
with a realistic parameter for assessment of highway pavements.
NTIS CRA&I
DTIC TAB
J , t ----.:--tQ-----2- --
By -_---------
"LJJT< [T "ALE'f L ."" ) 3
TECHNICAL REPORT STANDARD TITLE PAGEI. REPORT NO. 2. GOVER.NMK.r ACcE.SION NO3. RECLPLENTSCATLOG NO
WA-RD 312.1
.4 TITLE AND SUBITTLE 5. REPORT DATE
EVALUATION OF SURFACE FRICTION GUIDELINES FOR October 1993WASHINGTON STATE HIGHWAYS f. PERFORMNG ORGANA,•oN CODE
7. AUTHOR(S) 8. PERFORMING ORGAIZATION REPORT NO.
Patricia Corsello
9. PERFORMING ORGANIZATION NAME A.ND ADDRESS 10. WORK UNIT NO.
Washington State Transportation Center (TRAC)University of Washington, JD-10 11. CO•cRT OR GRANT NO.
University District Building; 1107 NE 45th Street, Suite 535 Agreement T9233, Task 1-08Seattle, Washington 98105-463112. SPONSORING AGENCY NAME AND ADDRESS 11. TYPE OF REPORT AND PERIOD COVE=ED
Washington State Department of Transportation Final ReportTransportation Building, MS 7370Olympia, Washington 98504-7370 14. SPONSORING AGENCY CODE
15. SUPPLEMENTARY NOTES
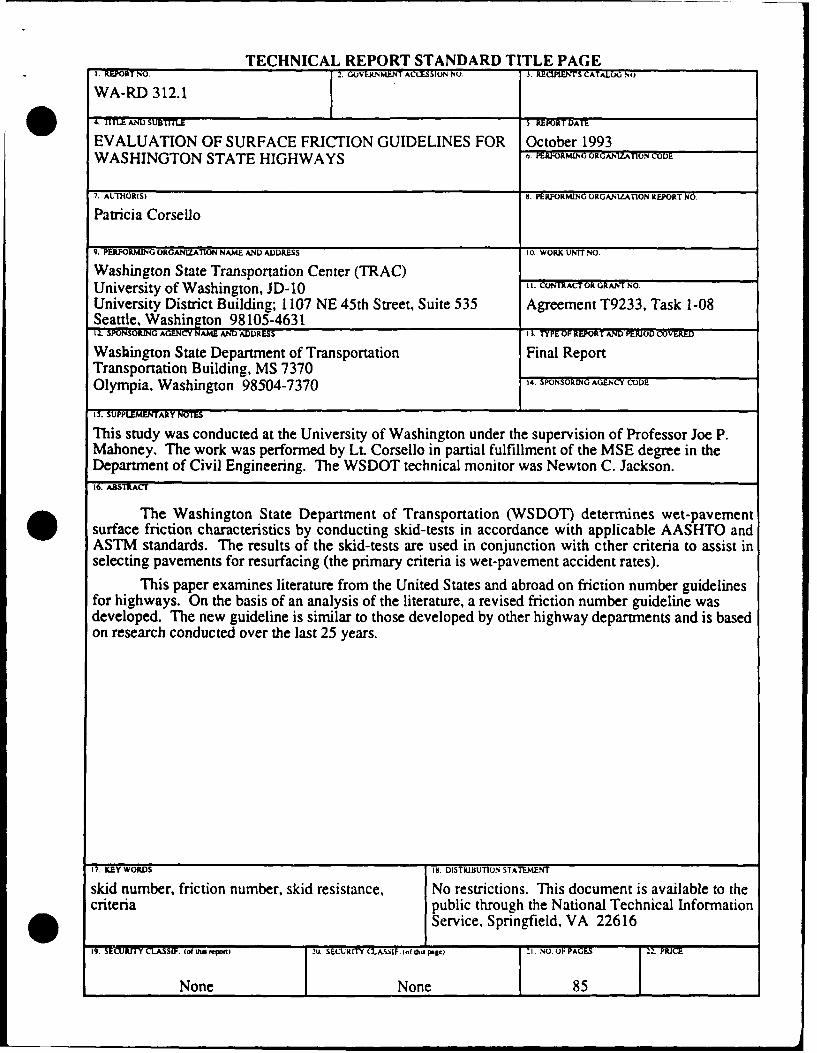
This study was conducted at the University of Washington under the supervision of Professor Joe P.Mahoney. The work was performed by LL Corsello in partial fulfillment of the MSE degree in theDepartment of Civil Engineering. The WSDOT technical monitor was Newton C. Jackson.16. ARSTRACT
The Washington State Department of Transportation (WSDOT) determines wet-pavementsurface friction characteristics by conducting skid-tests in accordance with applicable AASHTO andASTM standards. The results of the skid-tests are used in conjunction with ether criteria to assist inselecting pavements for resurfacing (the primary criteria is wet-pavement accident rates).
This paper examines literature from the United States and abroad on friction number guidelinesfor highways. On the basis of an analysis of the literature, a revised friction number guideline wasdeveloped. The new guideline is similar to those developed by other highway departments and is basedon research conducted over the last 25 years.
I?. KEY WORDS 18. DISTRIBUTION STATEMENT
skid number, friction number, skid resistance, No restrictions. This document is available to thecriteria public through the National Technical Information
Service, Springfield, VA 22616
9 SECI RITrYCLASSIF. (oam" I repom 2u. SEURIT(1.ASSLF. Iot•ha og 21. NO. O PAGES 22. PRICE
None None 85

* DISCLAIMER
The contents of this report reflect the views of the author, who is responsible for
the facts and the accuracy of the data presented herein. The contents do not necessarily
reflect the official views or policies of the Washington State Transportation Commission,
Department of Transportation, or the University of Washington. This report does not
constitute a standard, specification, or regulation.
0
0

TABLE OF CONTENTS
Section E
C hapter 1. Introduction ............................................................................................ I
Background ...................................................................................................... ISkid Resistance ............................................................................................... 3The Skid Environment and Wet Weather Accidents ....................................... 4
Friction Dem and Versus Friction Supply ............................................ . 5Friction Dem ands of Traffic ................................................................. 6Friction Supply A vailable .................................................................... 6
V ariability of Skid Resistance ......................................................................... 8Skid Resistance Testing ................................................................................... 8
Skid-Testing M ethodology ................................................................... 8Skid Testing A broad ............................................................................. 9Skid Testing in the U nited States ......................................................... 9
Detection of Slippery Conditions by Skid-Testing .......................................... I 1Calibration and Correlation .............................................................................. 12
Field Test and Evaluation Centers ....................................................... 13Calibration Procedures ......................................................................... 13O perating Procedures ........................................................................... 14
C hapter 2. Literature Search .................................................................................. 16
The W SDO T Skid-Testing Program ................................................................ 16U nited States Literature .................................................................................... 20
Federal G uidelines ................................................................................ 20Federal and State Research ................................................................. 20
International Literature .................................................................................... 22
Chapter 3. Methodology and Results ...................................................................... 27
Friction G uidelines for M ain Rural H ighw ays ................................................. 27The 1967 Recommended Minimum Skid Number .......................................... 27
Step 1 .................................................................................................... 28Step 2 .................................................................................................... 30Step 3 .................................................................................................... 31Step 4 .................................................................................................... 31Step 5 .................................................................................................... 32
Recommended Changes to the 1967 Minimum Skid Number ........................ 34Pavem ent Tem perature Effects ........................................................... 34M achine Error Effects ......................................................................... 40Speed G radient ..................................................................................... 41
Revised Skid N um ber ....................................................................................... 41
C hapter 4. Sum m ary ................................................................................................ 42
G uideline ......................................................................................................... 42Use of Smooth and Ribbed Standard Test Tires for Network Testing ............ 42Limitations of Using FN Alone for Pavement Management Decisions ........... 43
iii

TABLE OF CONTENTS (CONTINUED)
Sen EagnAcknow ledgm ents ....................................................................................................... 44
R eferences ................................................................................................................... 45
Appendix A. Summary of Factors in Skid Resistance Measurement ................. A-i
Appendix B. WSDOT Memorandum Regarding Pavement Friction Inventory B-I
Appendix C. Dynamic Calibration Run-Skid Tester Output and Graph ofFriction Number vs. Test Number ........................................................... C-I
Appendix D. Great Britain Skid Resistance Policy for Different Categoriesof Site ............................................................................................................... D-1
Appendix E. Maryland Report - Correlation Between Pavement Temperatureand Friction Number and Graphs of Friction Numbers vs. PavementTem perature ................................................................................................... E-1
Appendix F. Pennsylvania Report - Skid Resistance by Days for Floridaand Texas ...................................................................................................... F. F I
Appendix G. Pennsylvania Report - Skid Resistance Graphs and Data Sets forFlorida, New York, Pennsylvania, and Texas .............................................. G-1
Appendix H. Estimate of Error in Skid-Testing ................................................... H-I
Appendix I. Friction Test Regression and Speed Correction Formulas Based onCalibration at TTI (Left Wheel) ................................................................... I-1
Appendix J. Model Skid Accident Reduction Plan .............................................. J-I
iv
LIST OF FIGURES
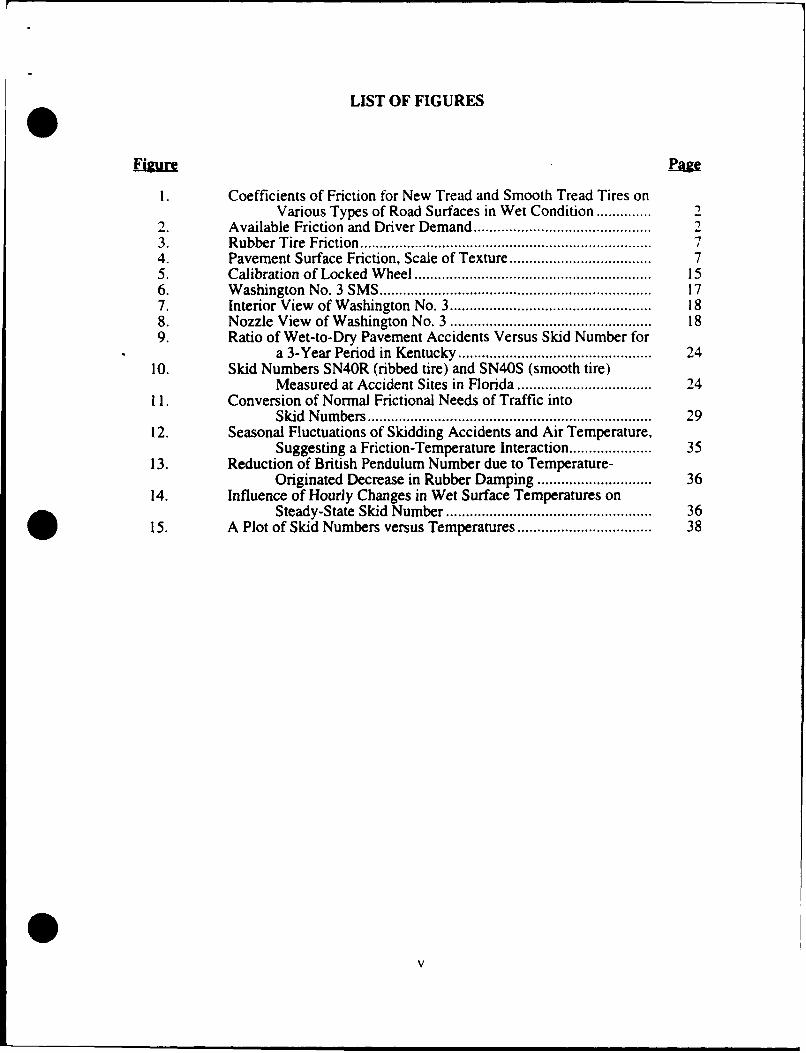
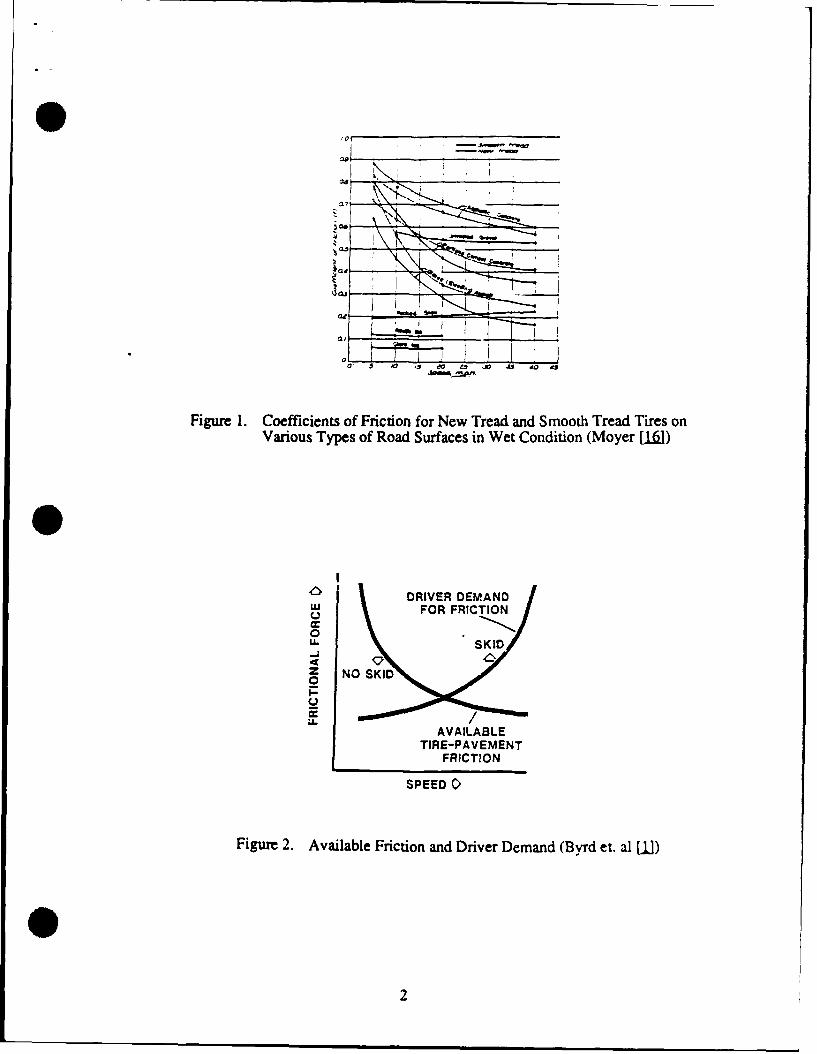
1. Coefficients of Friction for New Tread and Smooth Tread Tires onVarious Types of Road Surfaces in Wet Condition ............ 2
-. Available Friction and Driver Demand ............................................. 23. R ubber Tire Friction ........................................................................ 74. Pavement Surface Friction, Scale of Texture .................................... 75. Calibration of Locked W heel ........................................................... 156. W ashington No. 3 SM S .................................................................... 177. Interior View of Washington No. 3 .................................................. 188. Nozzle View of Washington No. 3 ................................................... 189. Ratio of Wet-to-Dry Pavement Accidents Versus Skid Number for
a 3-Year Period in Kentucky ................................................. 2410. Skid Numbers SN40R (ribbed tire) and SN40S (smooth tire)
Measured at Accident Sites in Florida ................................. 2411. Conversion of Normal Frictional Needs of Traffic into
Skid N um bers ........................................................................ 2912. Seasonal Fluctuations of Skidding Accidents and Air Temperature,
Suggesting a Friction-Temperature Interaction .................... 3513. Reduction of British Pendulum Number due to Temperature-
Originated Decrease in Rubber Damping ............................. 3614. Influence of Hourly Changes in Wet Surface Temperatures on
Steady-State Skid Number .................................................... 3615. A Plot of Skid Numbers versus Temperatures ................................. 38
V
* LIST OF TABLES
Tabl Eau
1. The Factors of Skid Resistance ....................................................... 52. Summary of Friction Guidelines for State Highway Departments ... 233. Conversion of Friction Numbers that Satisfy the Normal Need of
Traffic into Skid Num bers .................................................... 294. Recommended Minimum Interim Skid Numbers ............................. 33
vi

CHAPTER 1
INTRODUCTION
BACKGROUND
The earliest research report on the skid resistance of rubber tires on various road surfaces
was presented at the 1933 annual meeting of the Highway Research Board by Ralph A. Moyer.
(15.) The report gave a true indication of the many variable factors that influence tire and road
friction, especially the hazardous, slippery conditions of certain road surfaces when wet. Moyer
discovered that coefficients of friction for all slippery surfaces, except those covered with snow
or ice, are fairly high at low speeds, but drop sharply as the speeds of vehicles increase, as shown
in Figure 1. Furthermore, Moyer noted that the seriousness of the hazard created by slippery
road surfaces becomes more apparent when attention is directed to the fact that the friction
requirements for driving operations, such as acceleration and braking, increase approximately
with the square of the speed. (JW These concepts are shown graphically in Figure 2. (1)
The phenomenal increase in the volume and speed of highway traffic after World War 11
was accompanied by a similar increase in the occurrence of highway accidents. Since World
War II, many factors believed to contribute to these accidents have been studied. Most
researchers agree that these factors fall into three major categories: (a) the driver's behavior, (b)
the roadway and its environment, and (c) the vehicle and its characteristics. (3) Highway
departments concentrate on the roadway and its environment, with safety and economics among
their highest priorities. This report focuses on wet-pavement skid resistance. It specifically
examines the issue of minimum skid resistance guidelines for highways. These guidelines are
designated to ensure that adequate friction is available in wet conditions.
Minimum skid resistance guidelines have been the focus of intensive research efforts
since the National Highway Safety Act of 1966, which requires states and jurisdictions to
maintain the skid resistance of public highways and streets. "Maintain" includes correction of
excessive slipperiness. U).)
Friction Requirements.Text 1 October 15, 1993
az
0~ .1 , ' . Z 4 ow.o,
Figure 1. Coefficients of Friction for New Tread and Smooth Tread Tires onVarious Types of Road Surfaces in Wet Condition (Moyer L1.])
DRIVER DEMAND
LUQ FOR FRICTION
SSKID
Z NO SKID0I--
AVAILABLETIRE-PAVEMENT
FRICTION
SPEED 0ý
Figure 2. Available Friction and Driver Demand (Byrd et. al W)
2
In the mid-1960s, Kummer and Meyer (.L.) performed a landmark study to deterrmne
frictional requirements for main rural highways. The study was published in 1967 by the
Highway Research Board (HRB) as National Cooperative Highway Research Program (NCHRP)
Report 37. The report recommended a minimum skid number of 37 for the national road
network, as measured with a skid trailer in accordance with ASTM Method E-274. The HRB
emphasized that the recommended skid number was minimum and tentative and that specific
frictional requirements needed to be determined for each given set of road, vehicle, operator, and
weather conditions. The HRB suggested continued research to develop a more refined skid
resistance requirement. (12,)
Since 1967. researchers have made significant progress in field and laboratory methods of
measuring road surface friction, comparison and correlation of the different measuring methods,
relationships of road surface properties to skidding accidents, and several other aspects of the
tire-pavement interaction. This report idjusts the skid number recommended by HRB in 1967 to
* reflect these research developments.
Before analyzing specific adjustments to the minimum skid number, basic principles are
briefly discussed.
SKmI RESISTANCE
When a pavement is wet, quick braking or turning maneuvers may cause a vehicle's tires
to slide because of the lower friction between the tires and the pavement. In this report "friction"
is understood to be the force developed at the tire-pavement interface that prevents the tires from
sliding on pavement surfaces under fast braking or cornering. The term "skid resistance" has
also been used to describe this tire-pavement interaction. The two terms (friction and skid
resistance) are used interchangeably in this report, as they are in the literature.
Skid resistance can be stated several ways: coefficient of friction (pi), Friction Number
(FN), or Skid Number (SN). Each is defined as follows:
3

a. Coefficient of Friction (4)
F
F = frictional resistance to motion in the plane of intertace.
L = load perpendicular to the interface.
b. Skid Number (SN)
SN = 10O() = 100(F
F = measured friction obtained with a locked-wheel standardized tire at aconstant speed (usually 40 mph) along an aruficiallv wetted pavement(in accordance with ASTM E-274 or AASHTO T-242).
L = vertical load on a locked wheel.
c. Friction Number (FN)
FN = defined by NCHRP Report 37 as the critical coefficient of friction whichthe tire develops before skidding occurs.
Note: It is often used interchangeably with SN in other literature to representthe measured value of skid resistance.
It is important to note that a pavement is not given a certain coefficient of friction because
friction involves two bodies, the pavement and the tire. Each is extremely variable because of
factors such as pavement wetness and vehicle speed. (1)
THE SKID ENVIRONMENT AND WET WEATHER ACCIDENTS
As already stated, the factors that contribute to highway skidding accidents fall into three
major categories, known as the three components of skidding accidents:
* The Driver - driving habits and capabilities
The Pavement - surface characteristics
The Vehicle - tires and suspension
The external environment, mainly wet weather, can affect each of these components
either directly or indirectly. For instance, rainfall affects the friction available from the pavement
* surface: the tire tread affects the capacity of the tire to remove water at the tire-pavement
4
interface: and wet roads can produce headlight reflection and spray, which can reduce the driver s
perceptual vision and sight distance. Wet conditions produce low and variable friction values.
Under dry conditions. skid resistance is good and uniform values are obtained for a wide range of
surfaces. Therefore. pavement engineers concentrate their efforts regarding skidding accidents to
wet conditions.
The occurrence or avoidance of a skidding accident is a function of the three interrelated
components. A deficiency in any one of these components. that is. the driver, the pavement, or
the vehicle, can be the cause of a skidding accident. (19
Pavement engineers strive to understand the factors involved in skid resistance and their
interrelationships. This is an extremely complex subject. and. therefore, is often outlined in
terms of friction demand and supply.
Friction Demand Versus Friction Sun1lv
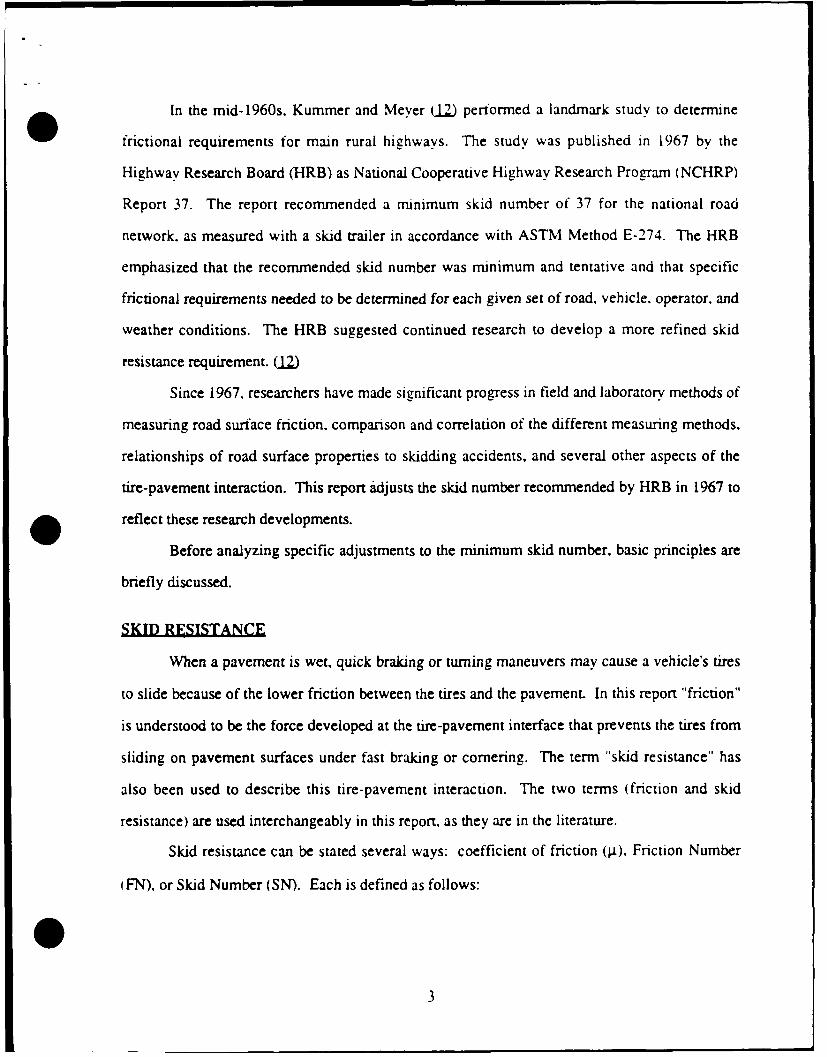
Skid resistance can be thought of in terms of the margin of safety between the friction
supply available and the friction demand generated at any particular time and for a particular
driving maneuver. The basic skid resistance equation is as follows: skid resistance equals
friction supply minus friction demand. Table 1 lists the major factors that affect the skid
equation.Table 1. The Factors of Skid Resistance (from Byrd, et al. [Ii)
FRICTION DEMAND FRICTION SUPPLY
"* Speed • Speed
"* Acceleration and braking • Tire
"* Vehicle characteristics * Pavement surfaceMicrotexture
"* Weather related MacrotextureWind DrainageSpray Cross slopeSight
Weather related" Roadway geometrics Rainfall
Curvature TemperatureSuperelevation Cyclic Effects
.Tracking Seasonal
5

Note that certain factors affect both demand and supply and can therefore have a
significant influence on skid resistance. Obvious examples are speed and weather related
factors. (_)
Friction Demands of Traffic
For a vehicle to follow a desired course the tires must be capable of developing definite
friction factors. Friction factors vary with speed. tire type, weather conditions. roadway
geometrics and, most importantly, with the maneuvers that drivers impose on their vehicles
(changes in direction and rate of acceleration).
The large dependence of available friction on speed arises from the fact that on wet
pavements the tire-pavement contact area is determined by the efficiency with which the tire can
expel water from that area. Water viscosity and other effects cause this efficiency to degrade at
higher speeds-consequently, the tire is unable to maintain a dry contact area. (-1)
Friction Sunnlv Available
Whether enough friction is produced in the tire-pavement interface under certain
conditions, for example, high speed, depends on the properties of the tire, the pavement surface,
and weather related factors.
The two principle factors responsible for rubber tire friction are adhesion and hysteresis;
a high level of each is desirable for skid resistance. Adhesion is the product of interface shear
strength and contact area. Hysteresis is caused by damping losses within the rubber when it is
"flowing" over and around the mineral particle. Both are illustrated in Figure 3. (.1)
The two principle factors responsible for pavement surface friction are microtexture and
macrotexture; both are needed to provide the pavement surface with an adequate level of friction.
The microtexture, provided by the small surface asperities, affects the level of friction in the
tire-pavement contact area. The macrotexture. provided by the larger surface asperities. provides
escape channels for the surface water from the tire-pavement contact area. Microtexture varies
from harsh to polished, and macrotexture varies from rough to polished, as shown in Figure 4. A
high drainage potential is also desirable for the pavement surface, as it allows water to escape by
6

ROADWAY
HYSTERESIS ADHESION
Figure 3. Rubber Tire Friction (Byrd et. al [)
MACRO MICRO(large) (fine)
06
Figure 4. Pavement Surface Friction, Scale of Texture (Byrd et al. WU)
7

gravity; this potential reduces the water film thickness at the interface and increases available
friction. l)
Weather related factors are key to the amount of available friction. Again, in dry
conditions friction is generally not a concern. Available friction is known to vary with season.
Normally, available friction is relatively low in summer and fall because of contamination (oil
and dirt) buildup in pavement asperities, it is relatively high in winter and spring because rainfall
cleans the contamination from the asperities. (W) A drop in available friction often occurs when
it rains following a period of dry days.
VARIABILITY OF SKID RESISTANCE
Identifying the major factors of skid resistance highlights an important point-a
significant number of wet weather accidents are related to factors other than a slick pavement.
Because of the number of contributing factors, wet-pavement skid resistance is said to have a
large degree of variability. W.)
Wet-pavement skid resistance is a major concern of highway departments. However, it is
a relatively small factor in relation to all accidents:
Reported studies have indicated that most accidents, perhaps more than 80percent. may be attributed to human factors, and only 3 to 5 percent may beattributed to vehicular characteristics or failures, with the exception of tirecondition. The remaining 10 to 15 percent of accidents may be related to theroadway and its environme.nt. (3.)
To prevent skidding accidents, most states have initiated skid resistance programs that include
means of measuring wet-pavement skid resistance.
SKID RESISTANCE TESTING
Skid-TestinLg Methodologv
Since the origin of testing in the 1930s, two major methods of skid-testing have
developed around the world. Although a number of devices are available for performing the
tests, common methods measure either the braking-force coefficient (BFC) or the sideways-force
8

coefficient (SFC). The United States uses the braking-force coefficient method, whereas Europe
and many other parts of the world use the sideways-force coefficient method.
The BFC is a calculation of the braking force divided by the vertical force, measured
when the vehicle is braking in a straight line and the tire is actually skidding. The SFC describes
the sideways force divided by the vertical force, measured when the vehicle is braking in a turn
and the tire is actually skidding. Measured BFC values are usually somewhat lower than SFC
values.
Skid-Testing Abroad
In Europe and other parts of the world, the skid resistance is measured by a machine
appropriately referred to as the Sideways-Force Coefficient Routine Investigation Machine
(SCRIM). SCRIM is based on the contention that the critical maneuver related to skidding is
cornering. The test wheel is set at a 20-degree angle in relation to the direction of travel, and the
sideways force acting normally to the plane of the wheel is measured. The sideways-force
coefficient is then defined as the ratio of the sideways force to the vertical load. The vehicle uses
a smooth tire in its measurements. The test wheel has its own deadweight, spring, and shock
absorber to give a known static reaction between the tire and road. In the hib is an electrical
load cell to provide the sideways-force input to the recording system. A speed input is provided
from the vehicle transmission system. (1)
Skid-Testing in the United States
Skid-testing in the United States is almost universally conducted in accordance with
ASTM Method E-274 (AASHTO T-242). This method uses a locked-wheel braking mechanism
to measure the braking-force coefficient. The measurement represents a steady state friction
force on a locked test wheel as the tire is dragged over a wetted pavement surface under constant
speed. The locked test wheel's major plane is parallel to its direction of motion and
perpendicular to the pavement.
The vast majority of skid measurement systems consist of a towing vehicle and a two-
wheel trailer. Most commonly, the left wheel is locked during testing. The skid measurement
9

system must have the following: (a) a transducer associated with each test wheel that senses the
force developed between the sliding wheel and the pavement during testing, (b) electronic signal
conditioning equipment to receive the transducer output signal and modify it as required, and (c)
suitable analog and/or digital readout equipment to record either the magnitude of the developed
force or the calculated value of the resulting Skid Number (SN).
The system must include a means to transport a supply of water - usually 200 to 500
gallons - and the necessary apparatus to deliver approximately 4 gallons of water per minute,
per wetted inch of pavement at 40 mph within specified limits in front of the test wheel. The
system must be able to measure the speed at which the test is conducted.
A standard tire is used in the test so that the skid resistance of different pavements can be
compared. The standardized skid-test tire, a tubeless, bias-ply G78xl5 tire with seven
circumferential grooves, is defined by ASTM E-501 (AASHTO M-261). The standard rigidly
prescribes the rubber composition. Thus, the tire type and design are eliminated as variables in
the measurement of pavement skid resistance.
To take a measurement, the trailer is towed at a speed of 40 mph over the dry pavement,
while water is applied in front of the test wheel. The test wheel is then locked up by a suitable
brake. After the test wheel has been sliding on the pavement for a certain distance, the force that
the friction in the tire contact patch produces and transmits as torque on the test wheel is
measured and recorded for a specified length of time. The result of such a test is reported as the
Skid Number (SN).
It is essential that operators adhere to this standardized procedure. Although
measurements are essentially fixed, as far as skid resistance is concerned, surface characteristics
change with time and are frequently far from uniform. Unless the test is repeated and
measurements made in an identical manner, the operators may conclude that changes occurred
when they really did not and distort the magnitude of real changes. (1,)
The possibility of some uncertainty in the measurements remains. Seasonal variations
exist, as shown by several studies. In addition, temperature effects exist because of tire friction's
10

dependence on temperature. Operators must also consider a complicated interplay that involves
air, pavement, and water temperatures, as well as the heating of the tire structure by flexing and
the heating of the tire tread by friction. (J.) No universally accepted method of correcting skid
number for temperature exists yet: however, researchers are finding that the effect of reasonable
air temperatures (25°F-700F) on pavement surface friction is insignificant.
There are other potential sources of error. Some sources affect the repeatability of a test
made with the same tester, while others cause different testers to produce different results on the
same surface under the same conditions. A potentially large source of error is position of the
wheel in the wheelpath.
However, these imperfections do not diminish the usefulness of ASTM E-274 for most
purposes, such as (a) determining whether pavement friction could be a governing factor at
highway accident locations, (b) making surveys of a road system for the purpose of identifying
low friction sections and setting priorities for remedial programs, and (c) determining the relative
in-service skid number of different types of construction, aggregates, and surface treatments.
Difficulties arise only when high precision is needed, as when engineers must determine whether
a particular surface meets a mandated level of skid resistance. (.L)
DETECTION OF SLIPPERY CONDITIONS BY SKID.TESTING
Skid-testing may be performed for a wide variety of reasons, however, the primary reason
is to detect low friction pavements that may be corrected to prevent accidents. For researchers to
use the skid-test equipment to detect slippery pavement conditions, the term "slippery" must be
translated into skid numbers. For skid-testing to be used as an effective tool, decisions have to
be made. at least within a transportation department, as to acceptable or reasonable skid numbers.
This decision making becomes further complicated when variation in friction demand is taken
into consideration, as discussed in a previous section. (J)
Many states have developed their own ranges of skid resistance values. The ranges may
vary by classification of road, by traffic volume, or by any other valid reason. Many other states
11
* use the skid values from NCHRP Report 37 (1967). which recommends a minimum skid number
of 37 for highways. Wi)
CALIBRATION AND CORRELATION
As with any other measurement, skid resistance measurements are of limited value, or
may even be totally useless, unless the measuring system obtains data that fall within acceptable
limits of accuracy and precision. Accuracy refers to the measurement's degree of agreement with
an accepted reference level. Precision refers to the degree of agreement among repeat
measurements. To ensure accuracy and precision the system must be calibrated periodically.
Because skid resistance is a performance measure, that is, the force required to drag a
specified tire over a wetted pavement under specified conditions, no absolute standard exists to
which the measured values may be compared or related. To address this problem, correlation
studies were conducted in which the results, obtained with different skid resistance testers, were
compared with each other. These correlation studies resulted in significant improvements in the
accuracy and precision of skid resistance measurements.
However, the correlation studies did not solve the problem. When different skid-testers
were correlated, the mean of the results of all testers was used as a reference level. This method
proved to be unsatisfactory because in all correlation studies the difference among the
measurements of several testers, under presumably identical conditions, was found to be
statistically significant. This meant that systematic errors were much larger than random ones.
The method of applying the water in front of the test tire is an example of a systematic error,
while placement in the wheel track is an example of a random error.
NCHRP Report 151 (13) summarized the factors in skid resistance measurement in terms
of the type and magnitude of error that each factor introduces. The summary is provided in
Appendix A. Report 151. in conjunction with more recent findings on error, has been used to
upgrade ASTM E-274: in particular the report specified the limits within which tester
components and instruments must perform. These limits are compromises between what is
12
permissible and what is practical. Every operator must periodically calibrate the tester to assure
that it conforms to the requirements of ASTM E-274. (1)
Field Test and Evaluation Centers
To aid users of skid resistance testers and to assure that reported skid numbers were
related to a common basis, Field Test and Evaluation Centers (FT & EC) were established at the
Texas Transportation Institute (College Station, Texas) and Ohio State University (East Liberty,
Ohio). At the centers, skid-testers are dynamically calibrated, correlated, and evaluated while
operating personnel are instructed on proper test procedures.
Researchers at the centers calibrate a user's tester against a standard tester. The standard
tester is in turn calibrated against a primary reference tester maintained by the National Bureau
of Standards.
"Standard surfaces" are used for the calibration runs, which span the range of skid
resistance values that are typically encountered in fieldwork. The surfaces are subjected to use
and weather skid resistance variations similar to those experienced by highway pavements.
Because the surfaces are subjected to such conditions, researchers cannot calibrate a tester
directly on them by running a series of skid-tests and making appropriate adjustments until the
mean of the measured values agrees with the skid resistance of the standard test surfaces.
Instead, correlation tests with the secondary tester are made. (.)
Calibration Procedures
There is no way to predict how long a tester will stay calibrated. For practical and
economic reasons a tester may be taken to a field test and evaluation center only occasionally;
tester checks are recommended once every two years. Hence, the user must recalibrate and
maintain the tester between visits to a national center. As a minimum, the following items
require attention:
Speed Measurement - The skid resistance of common pavements is a strongfunction of speed. It is therefore essential that test speeds are accuratelymeasured.
13

O Water Application - The water application process involves the properfunctioning of the water nozzle and its correct positioning. In addition, thedischarge rate of the nozzle must be within specifications.
Wheel Load - As long as no changes have been made on the trailer, the wheelload may be assumed to be unchanged.
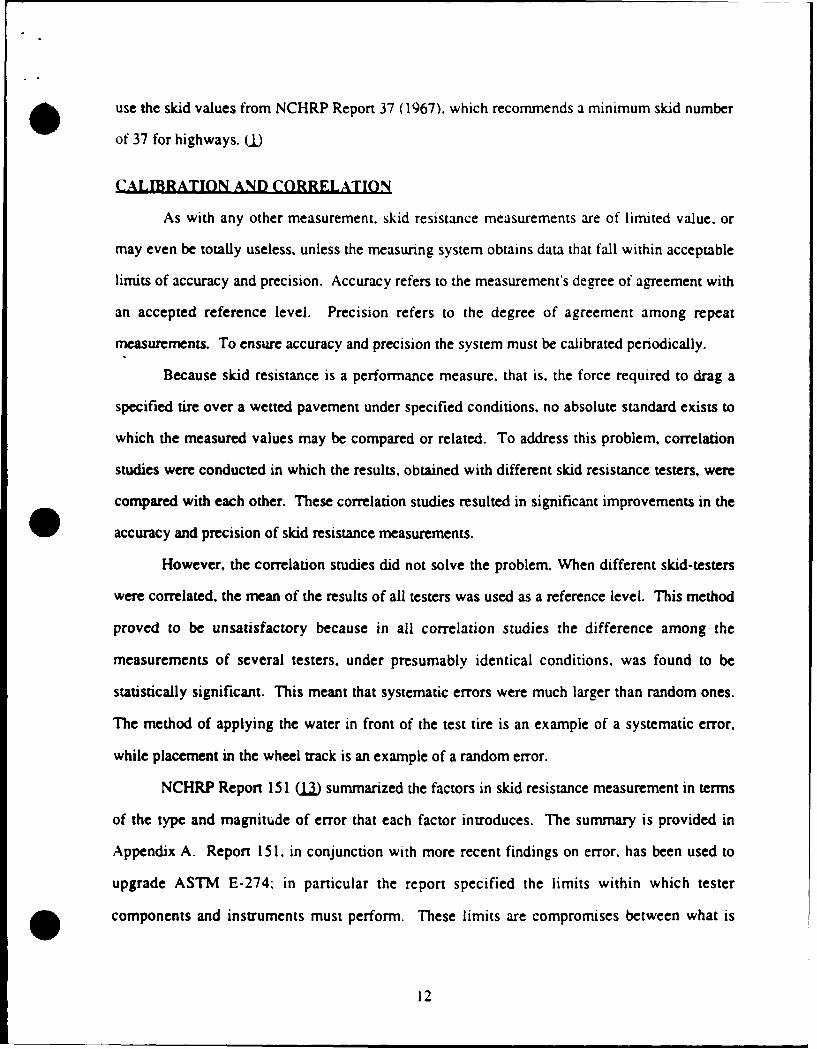
Skid Resistance - A static calibration of the wheel force is performed to simulatethe traction force between the tire and the pavement. The calibration systemconsists of a calibration platform, a horizontal drive mechanism, and a forcetransducer. The calibration platform consists of a bearing that is frictionless in alldirections of the horizontal plane; the horizontal plane supports a rigid plate witha high friction surface. With the test wheel placed on the calibration platform, atractive force is applied to the platform by a horizontal drive mechanism (seeFigure 5). The applied force is measured by a force transducer and compared tothe test wheel transducer output. The force is applied in 100 lbf increments up to80 percent of the wheel load or until the plate starts to slip under the tire.whichever occurs first. At each increment, the indicators of the platformtransducer and the test wheel transducer are allowed to come to rest and forcereadings are recorded. The recommended accuracy is 1 percent or better.Mechanical or electronic adjustments are made until the force readings are equal.Alternatively, calibration curves or tables may be prepared to be used ascorrections to measured results. This calibration procedure is performed inaccordance with ASTM Method E-556 (AASHTO Method T-282) and ASTMMethod F-377. (2Q& 3)
O Test Tires - Although test tires in the past have shown remarkable uniformity,this uniformity cannot be assumed to be true-especially if a tire has been storedor has seen considerable use. The break-in and conditioning proceduresprescribed by ASTM E-501 should be followed meticulously. Because inflationpressure is an important variable, it should be measured with a calibrated gauge.
General - All components and functions that have any effect on the validity ofthe measured skid resistance values should be checked and corrected as needed.This may include the cycle timer, brake system performance, and wheelbalance. W)
Operating Procedures
Operating and data evaluation procedures must also conform to certain limits and
standards. The ASTM E-274 method provides some guidance in performing these procedures;
however, to a large extent, operator performance is a matter of skill, experience, and an
understanding of the skid resistance measuring process. 1W)
14
LOCKED WHEELPLATFORM
FORCETRANSDUCER
Figure 5. Calibration of Locked Wheel (ASTM [aD.])
15

CHAPTER 2
LITERATURE SEARCH
A literature search was conducted for research reports pertinent to this paper and for
written guidelines on the WSDOT's skid resistance program. Although a substantial amount of
literature was available on pavement skid resistance, only a portion of it was useful for the
examination of minimum skid resistance guidelines.
THE WSDOT SKID-TESTING PROGRAM
The current WSDOT guideline for skid resistance is based, in part, on NCHRP Report 37,
which designates SN = 37 as the recommended minimum skid number (tentative and interim) for
highways. The WSDOT guideline agrees with a 1986 report by Wambolt, et al. that states,
"Based on the experience from many states, it is generally agreed that a skid number of 35 or
greater gives adequate skid resistance under most conditions." (2I.)
The WSDOT skid-testing program meets the national standards (ASTM) for testing and
calibration. The WSDOT skid-test equipment, calibration, and data storage techniques are
discussed in this section. In addition, the FN inventory and its role in the WSDOT Pavement
Management System database are addressed.
WSDOT has been involved in pavement friction testing with locked-wheel equipment
since 1968. The WSDOT Materials Laboratory, Special Projects Section, is responsible for the
skid-testing program. The intent of the program is to point out those areas that have a potential
problem regarding skidding accidents. WSDOT operates one Cox & Sons Model CS 9000
Locked-Wheel Skid-Tester, in accordance with ASTM Method E-274(80), and uses a ribbed test
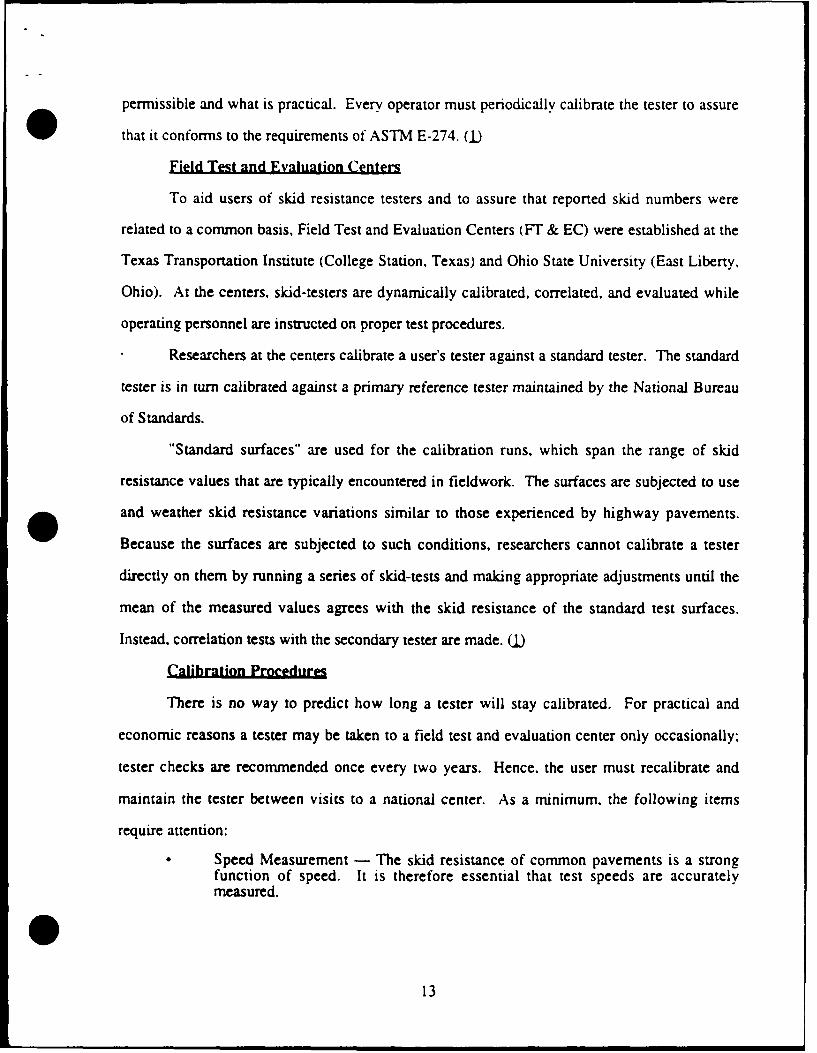
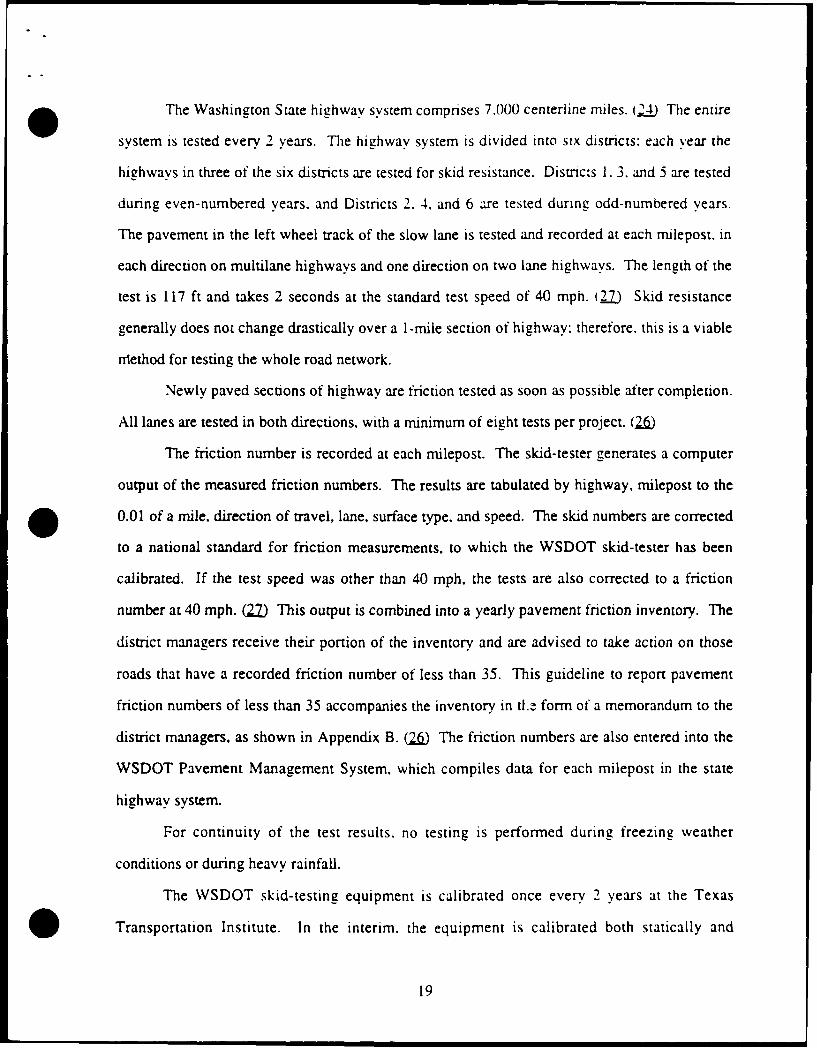
tire, in accordance with ASTM E-501. (2.5) A picture of the WSDOT skid measurement system
is provided in Figure 6, an interior view in Figure 7, and a nozzle view in Figure 8. (2 The
WSDOT is due to receive a new test trailer in late 1993. The new trailer will meet ASTM E-
274(90) and will introduce many improvements, including more accurate calibration.
16
.TA?6ACKVMM0wSFOS
Figure 6. Washington No. 3 SMS (Texas Transportation Institute 2)
17
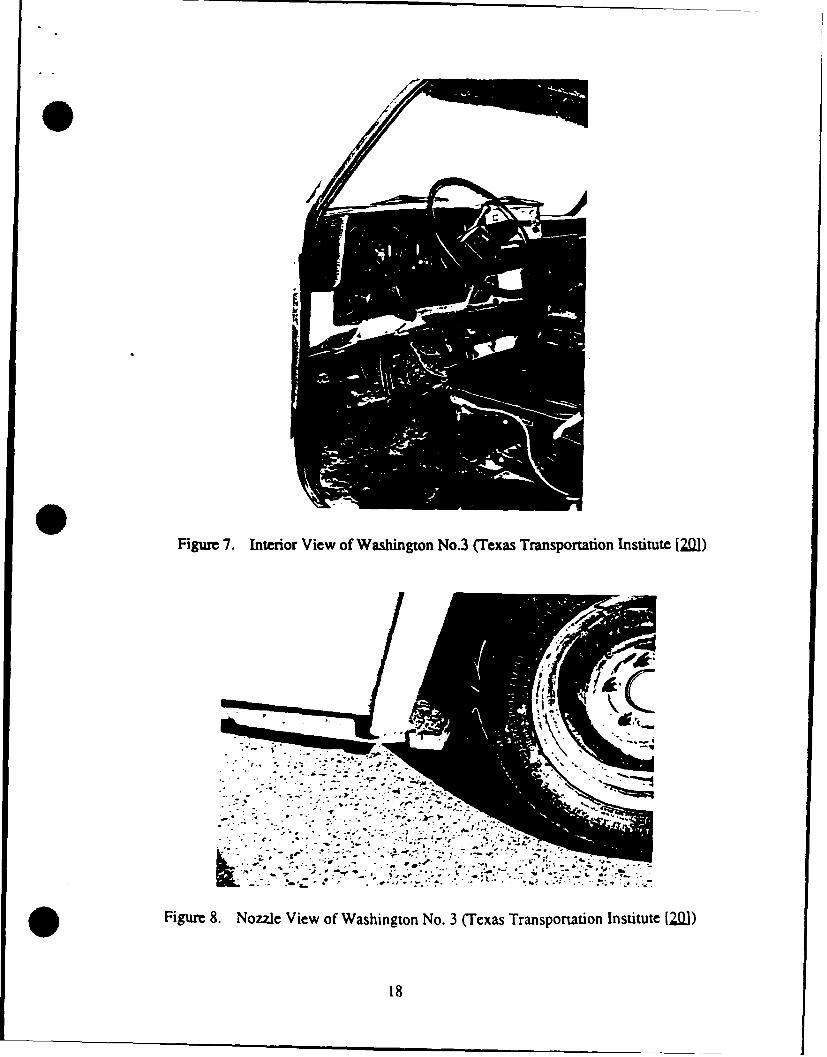
Figure 7. Interior View of Washington No.3 (Texas Transportation Institute I2]
Figure 8. Nozzle View of Washington No. 3 (Texas Transportation Institute[2)
18
The Washington State highway system comprises 7.000 centerline miles. (24. The entire
system is tested every 2 years. The highway system is divided into six districts: each year the
highways in three of the six districts are tested for skid resistance. Districts 1. 3. and 5 are tested
during even-numbered years. and Districts 2. 4, and 6 are tested during odd-numbered years.
The pavement in the left wheel track of the slow lane is tested and recorded at each milepost, in
each direction on multilane highways and one direction on two lane highways. The length of the
test is 117 ft and takes 2 seconds at the standard test speed of 40 mph. (27.) Skid resistance
generally does not change drastically over a 1-mile section of highway: therefore, this is a viable
Mrethod for testing the whole road network.
Newly paved sections of highway are friction tested as soon as possible after completion.
All lanes are tested in both directions, with a minimum of eight tests per project. (2m)
The friction number is recorded at each milepost. The skid-tester generates a computer
output of the measured friction numbers. The results are tabulated by highway, milepost to the
0.01 of a mile, direction of travel, lane, surface type, and speed. The skid numbers are corrected
to a national standard for friction measurements, to which the WSDOT skid-tester has been
calibrated. If the test speed was other than 40 mph, the tests are also corrected to a friction
number at 40 mph. (202) This output is combined into a yearly pavement friction inventory. The
district managers receive their portion of the inventory and are advised to take action on those
roads that have a recorded friction number of less than 35. This guideline to report pavement
friction numbers of less than 35 accompanies the inventory in ttl. form of a memorandum to the
district managers, as shown in Appendix B. (2.. The friction numbers are also entered into the
WSDOT Pavement Management System. which compiles data for each milepost in the state
highway system.
For continuity of the test results, no testing is performed during freezing weather
conditions or during heavy rainfall.
The WSDOT skid-testing equipment is calibrated once every 2 years at the Texas
Transportation Institute. In the interim, the equipment is calibrated both statically and
19

dynamically by WSDOT personnel. Because skid-testers operate at relatively high speeds, the
ultimate calibration is a "dynamic" test conducted on a surface of known and near constant
friction properties. The WSDOT skid trailer undergoes this dynamic test an average of once a
month at three specified pavement sections near the WSDOT Materials Laboratory in Olympia.
Washington. Two of the dynamic test sites are asphalt concrete pavements (ACP. SR101 MP
365.00 and SR5 MP 92.00. The third site. SR5 MP 111.00. is a portland cement concrete
pavement (PCCP). At each site 10 tests are run at intervals of 0. 10 mile for I mile. The results
are generated and later plotted, as shown in Appendix C. After each testing cycle, the results are
compared to previous cycle results for the corresponding pavement in order to ensure the skid-
test equipment is operating consistently during similar environmental conditions. Precipitation
data from the Olympia weather station are also plotted and used along with the friction number
data to evaluate tester performance. The next best alternative to the dynamic test is a "static"
test, which WSDOT also performs once per month. This "static" test is usually performed on the
same day as the dynamic test. The WSDOT follows the standard procedures for conducting the
static tests (see Calibration Procedures section, Chapter 1, for details).
UNITED STATES LITERATURE
Federal Guidelines
The primary sources for the national position on skid resistance guidelines are the
National Cooperative Highway Research Program (NCHRP) Reports. The NCHRP Report 37
(1967) set SN = 37 as the minimum, tentative, and interim skid resistance requirement for the
national road network. (,2.) The NCHRP Report 151 (1974) investigated locked-wheel
pavement skid-tester correlation and calibration techniques and acceptable windows of error.
(j.1) The NCHRP Report 154 (1974) set tentative minimum skid resistance requirements at
intersections. (A)
Federal and State Research
The NCHRP Synthesis of Highway Practice 14 (1972) assembled information on skid
resistance from many highway departments and agencies. (2) The NCHRP Synthesis of
20

Highway Practice 158 (1990) surveyed highway departments throughout the U.S. and provided
information regarding their wet-pavement safety programs. (3)
Federal and state sponsored research reports were essential for analyzing the interim skid
resistance requirements recommended in 1967 and for the proposal of new guidelines. Research
studies sponsored by Maryland. Pennsylvania. California. and Illinois are referenced in this
report. These studies further supported (a) the conclusion that skid numbers can only be used as
a guideline and not as a rigid requirement because of the number and variability of factors
involved. (b) specific conclusions regarding areas of pavement temperature and skid-tester
-correlation/calibration, and (c) ideas for the format and range of the proposed skid resistance
euidelines. The Maryland and Pennsylvania reports are discussed in great detail later in the
Methodology and Results section.
The California Department of Transportation (CALTRANS) report studied wet accident
rates and found that
Curves have the highest accident rate followed by weave sections andintersections. As one would expect. these rates are substantially higher atlocations having skid numbers less than 25. The accident rate is nearly constanton pavements with skid numbers greater than 26. but it increases substantially asthe skid numbers decrease from 25 to 17. (1.L)
Furthermore, the report stated.
Nationwide, several studies have been completed in an attempt to establishcriteria that would minimize wet-pavement accidents by establishing minimumskid numbers. In the past. when a minimum value has been proposed by anotheragency, an in-house investigation by CALTRANS Traffic Engineers has shownthat many locations have skid numbers less than the proposed value with norecord of a wet-pavement accident problem. Therefore. it has been consideredinappropriate to adopt minimum skid number levels because of the difficulty inestablishing justifiable values and because the adoption of a value higher thannecessary would require utilization of limited highway improvement funds thatshould be used to improve known problem areas. (IL)
The Illinois Department of Transportation guidelines were more conservative than
CALTRANS. but still set friction guidelines significantly lower than those recommended in
NCHRP Report 37. The Illinois tentative guidelines for evaluating friction at high wet accident
sites after 1987 included the following:
21
ka) if the FN is less than or equal to 30. friction is probably a factor contributing towet-pavement accidents.
kb) if the FN is ereater than 31 but less than 35. uncertainty exists as to whetherpavement friction is the primary factor, and
(c) if the FN is greater than or equal to 36. some condition other than pavement
friction is probably the primary factor causing wet-pavement accidents. (M
Practically every state has a skid-testing program. Each program was summarized in
NCHRP Synthesis of Highway Practice 158 (1991). The states were asked to report their criteria
for evaluating skid-tests: state answers ranged from NCHRP Report 37's recommended minimum
skid number of 37 to a variety of acceptable. marginal, and unacceptable skid numbers. The
state guidelines similar to those recommended in this paper are provided in Table 2. (3)
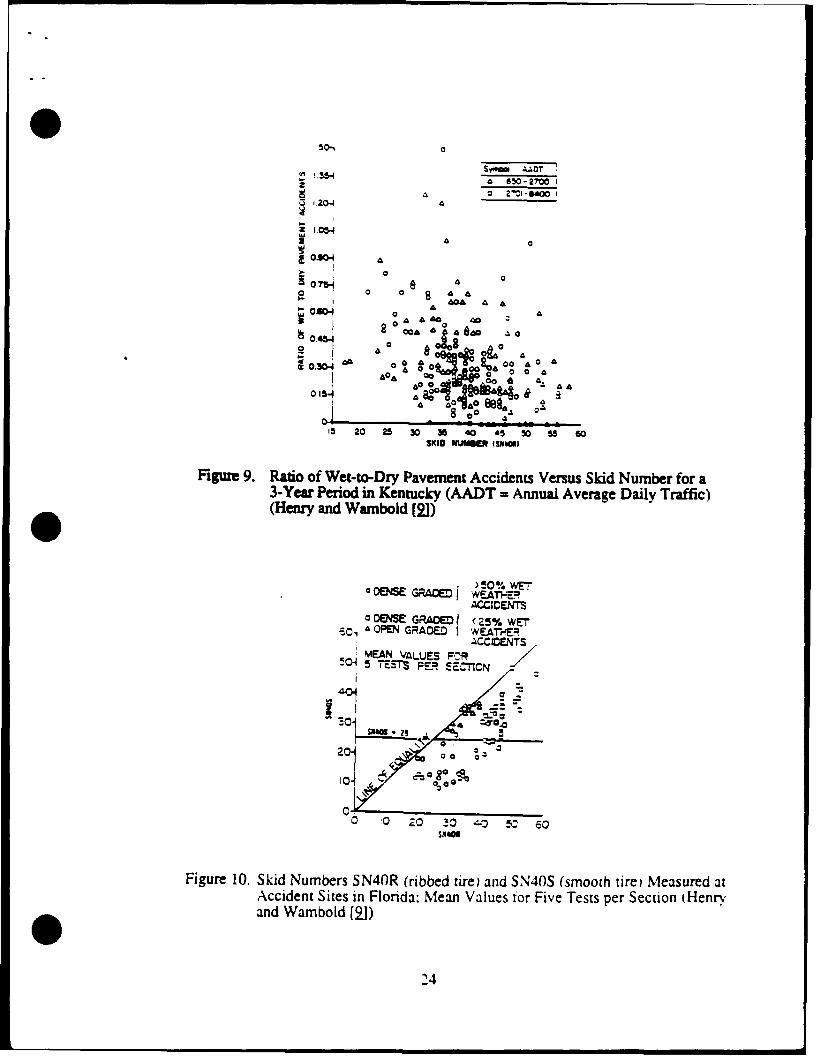
Most of the recent literature on skid-testing encouraged highway departments to use the
smooth tire procedure (ASTM E-524 or AASHTO M-286) for routine measurement. The
literature suggested that if only one tire is to be used, it ought to be the smooth tire; this is
because the smooth tire is equally sensitive to micro- and macro-texture, whereas the ribbed tire
responds primarily to the microtexture. Furthermore, early attempts to relate accident data to
skid resistance measured with a ribbed tire were frustrating. Figure 9 shows that there is a
minimal correlation between the measure of wet-pavement safety and the skid number when
measurements are made with the ribbed tire. Figure 10 compares the measured skid number with
a ribbed tire (SN40R) to that of a smooth tire (SN40S). One notices that the level on the vertical
axis that separates most of the high wet accident rate sites from the low wet accident rate sites
is 25. On the other hand, no obvious value on the horizontal axis separates the high- and low-
accident sites. This absence of a value results in an "unclear" level of SN40R that separates the
high- and low-accident sites. (B)
INTERNATIONAL LITERATURE
The international arena. particularly Great Britain and Italy, provide a comparison of skid
resistance ranges. The standard in Italy for minimum highway skid resistance is surprisingly
similar to the results in this report. The Great Britain standard, on the other hand. is somewhat
22

Table 2. Summary of Friction Guidelines for State Highway Departments (GuidelinesSimilar to This Papers Recommendation) (Dahir. et al. [3j, updated bv Ref.[to] for Illinois)
STATE CRITERIA TO THRESHOLDS AND ACTIONSEVALUATE TESTS
California Office of traffic safety notified when VariesSN40 is below 30.
Idaho Change or range in numbers. At 35 section is listed. At 30 section isrecommendable.
Illinois Less than FN40 = 35. FNN • 30 - friction is probably afactor contributing towet-pavement accidents.
31 _< FN _ 35 - uncertainty existsas to whether pavement friction isthe primary factor, and
FNN _> 36 - some condition otherthan pavement friction is probablythe primary factor causing wetpavement accidents.
Indiana Trends from past data and 30 as a FN40 = 30minimum friction number.
Louisiana SN equal to or over 35 for new Not clearly established (below SN 30construction. with high ADT).
Michigan Comparison with past results. Special attention given to investigate
surfaces with SN at 30 or below.
Ohio Below 30 - poor: Some type of correction likely where30 to 40 - adequate. depending on SN = 30.traffic and geometry
over 40 - satisfactory
South Dakota Action taken below FN 31. Action taken below FN 31.
Tennessee Above FN 35 - acceptable: Above FN 35 - acceptable:FN 30 to 35 - questionable: FN 30 to 35 - questionable:below 30 - unsatisfactory. below 30 - unsatisfactory.
Vermont Monitor area if SN is 40 or below:inform proper personnel of problemwhen SN is below 30.
Virginia Based on bald tire FN40 minimum ofapproximately 20.
23
U5-4SvOi.0zA 650-2700 I
U [20-4 3IS0
2 A o
E0.-304O A,
0
2 00
A.
0.304 a& 0,06 00Ao
A 0A 00 A
IS 20 25 36 35 40 45 50 5 5SKID MUAIME (SNOIt)
Figure 9. Ratio of Wet-to-Dry Pavement Accidents Versus Skid Number for a3-Year Period in Kentucky (AADT = Annual Average Daily Traffic)(Henry and Wambold [91)
oOE•-•)!0 Gr i=°WE70 OES GRAOEDWETf' -WE.ATH,•.
,CC=CENTS*OENSE GRAODD < 25% WE7
A~. &OPEN GRADE:)WOrEACCID.NTS
MEAN VALUES ":R5 TE0TS•-T• PE, SE.T'CN
SUN~ -2
20-
10. Fb
0 0 20 !0 -j !C 60
Figure 10. Skid Numbers SN40R (ribbed tre) and SN40S (smooth tirei Measured atAccident Sites in Florida: Mean Values for Five Tests per Section (Henryand Wambold [21)
24

higher. In order to compare a SCRIM measurement to a U.S. locked-wheei trailer measurement.
the SCRIM measurement must be converted from a sideways-torce coerficient to a braking-force
coefficient. Typically.
BFC = SFCx0.80 102)
It is also important to note that SCRIM measures SFC at 50 krrvhr (30 mph). (J1) To
convert this value to an SN at 40 mph. using gradient = 0.2 SN/mph. the calculation is as
follows:
SN = (BFC x 100) + 0.2 SN/mph (30-40)
SN = (BFCx100)-2SN
In Italy a pavement is considered slippery when SFC is less than 0.30 on highways. (2_)
Comparing this value to a U.S. measured SN:
SN = (SFC X 0.8 x 100) - 2
SN = (0.3 x 0.8 x 100) - 2
SN = 22
This SN is much lower than the U.S. guideline (recommended in 1967) of SN = 37.
The Great Britain skid resistance policy sets investigatory levels of Mean Summer
SCRIM Coefficient (MSSC) at 13 different site categories, which are thought to cover the whole
trunk-road network, as shown in Appendix D. This new policy was introduced in 1988 by
England's Minister for Roads and Traffic. It is important to note that the Great Britain policy is
stated in terms of MSSC. which is the friction ratio (SFC) multiplied by a factor of 0.78. as
follows:
MSSC = SFC x 0.78 (5_)
To compare the MSSC values in Appendix E to SN values, the equation is amended as
follows:
`5
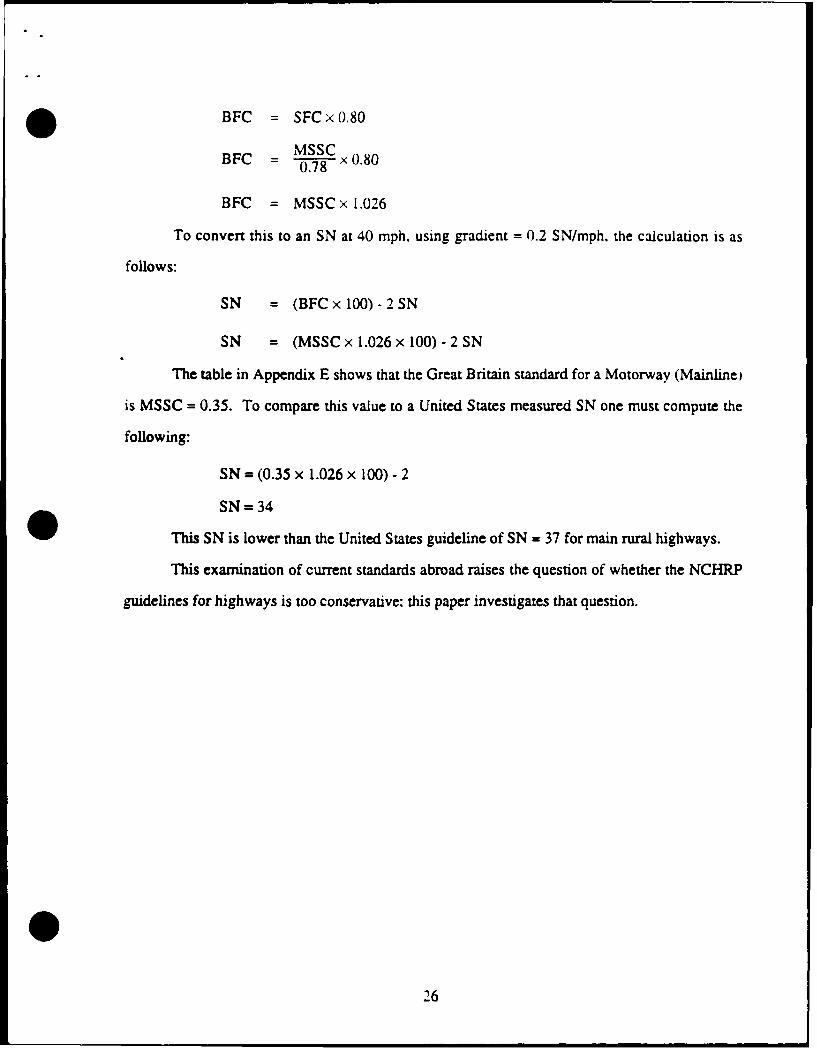
BFC = SFCx0.80
BFC = MSSC0.78 x 0.80
BFC = MSSC x 1.026
To convert this to an SN at 40 mph. using gradient = 0.2 SN/mph. the calculation is as
follows:
SN = (BFC x 100)- 2 SN
SN = (MSSC x 1.026 x 100) - 2 SN
The table in Appendix E shows that the Great Britain standard for a Motorway (Mainline)
is MSSC = 0.35. To compare this value to a United States measured SN one must compute the
following:
SN = (0.35 x 1.026 x 100) - 2
SN = 34
This SN is lower than the United States guideline of SN = 37 for main rural highways.
This examination of current standards abroad raises the question of whether the NCHRP
guidelines for highways is too conservative: this paper investigates that question.
26

CHAPTER 3
* METHODOLOGY AND RESULTS
FRICTION GUIDELINES FOR MAIN RURAL HIGHWAYS
It is important to recognize that the skid resistance value of SN = 37 recommended in
NCHRP Report 37 is not a standard and is based on 1967 knowledge. Various jurisdictions have
adopted or prescribed minimum skid resistance values based on their own considerations. These
considerations have included intuition and experience. Sometimes jurisdictions have included
provisions for higher SN values at specified locatio.Is.
In their report (NCHRP Report 37), Kummer and Meyer developed the minimum skid
resistance requirements by establishing friction factors based on traffic needs. They then tackled
the problem of defining minimum skid resistance requirements. The next section provides a
detailed review of their methodology, followed by an application of up-to-date changes to
determine the effect of temperature and calibration accuracy on skid resistance values. The
purpose of updating the skid resistance guideline is to prevent the use of an excessively high
minimum SN. An artificially high SN increases the total cost of skid-proofing a highway system
without providing a significant benefit to traffic and accident prevention. The NCHRP Report 37
states. "In the author's view excessive minimum skid resistance requirements are
self-defeating." (12)
THE 1967 RECOMMENDED MINIMUM SKID NUMBER
The NCHRP Report 37 showed that a friction number of 40 satisfied the normal frictional
needs of traffic on main rural highways, and, hence, on any road that carried traffic at lower
speeds. Skidding accident studies and a comparison of driver deceleration patterns during
braking and cornering proved that a friction number of 40 satisfied the frictional needs of all
normal vehicle maneuvers during acceleration, driving, cornering, and deceleration.
27

Furthermore, the studies showed that a friction number of 40 did this over a wide speed range
(except toward the .nd of braking maneuvers that lead to a full stop).
Under ideal conditions-that is, in the absence of other friction components (laterally
during acceleration and braking, and fore and aft during cornering) and wheel load fluctuations
(caused either by tire runout, wheel imbalance, or pavement irregularities)--a friction number of
40 would satisfy the normal frictional needs of traffic. However, in actual conditions, a higher
friction number is needed to account for other friction components and wheel load fluctuations
that are present in all driving.
To convert friction numbers that satisfy the normal needs of traffic into skid numbers.
Kummer and Meyer made reasonable allowances for the following:
a. other friction components.b. wheel inad fluctuations,c. K-factors,d. wet pavement temperature, ande. machine error of present skid trailers.
Accordingly, they had five steps in the conversion process. Each step was broken down
into lines, as summarized in Table 3 and Figure 11. These steps are examined for opportunities
to adjust variables and thus produce a new skid number. It is helpful to follow Table 3 as the
steps are reviewed.
The minimum required resultant friction number, FN , is determined. The FN assures
the availability of friction for the principal vehicle maneuver under ideal conditions (FNo), and
also allows for an additional friction component in the fore and aft or the lateral direction.
Line 1: FNo = 40 is the minimum friction number for the speed range 40 mph to
80 mph; this number was established by a driver behavior study. The FNo
increases linearly to FNo = 50 at 0 mph because of the higher decelerations
required at the end of a stop.
28

Table 3. Conversion of Friction Numbers that Satisfy the Normal Need ofTraffic into Skid Numbers (Kummer and Meyer U12])
SKID NUMBER FOR MEAN TRAFFIC SPEED, V. OF
CONVERSION 0 10 20 R0 40 50 60 0 80LINE sTEPS MPH MPH MPH MPH MPH MPH MPH MPH MPH
STEP I< FN, 50 47.5 45 42.5 40 40 -:0 -0 40
2 CSN - - 1.6 3.6 6.4 10.0 14.4 196 25.5
3 F-N 50 475 45 42.7 40.4 41.1 -:2.4 -4_5 47.0STEP2 < 4 iLIL(% - - 2.5 5.0 7.5 10.0 12.5 15.0 18.5
5 FN, 50 47.5 -46.1 44.8 43.5 45.0 47.7 51.2 55.2
S 3 6 K-factor 1 1.3 1.6 1.8 2.0 2.2 2.4 2.6 2.8S 7 SN, 50 37.5 2-3.8 25 21.8 20.5 20 19.7 19.8
STEP4 -" 8 SN. 56 43.5 3.4.8 31 27.8 26.5 26 25.7 25.89 SN 6 1 48.5 39.8 36 32.8 31.5 31 30.7 30.8
STEP5 < 10 SN(rounded) 60 50 40 35 33" 32 31 31 31
80N Fd Allowing for Additional Friction 2
Component and Wheel Load
Fluctuations
SFN Allowing for Additional Friction
z Component in Fore and Aft or4 z 'Lateral Direction
2 U0 TRO• 0 - FN Satisfying Normal Traffic Needs START
under Ideal Conditions
SSN Minimum Skid Number, Allowing
for Temperature Effects andMachine Errors
20 SN Minimum Skid Number, Allowing 4for Temperature Effects
SN Minimum Skid Number which 30 Satisfies Normal Frictional
00 Needs of Traffic unoer Ideal
0 20 40 60 80 Test Conditions of ConstantMEAN TRAFFIC SPEED, V, mph Temperature and Zero Machine
Error
Figure 11. Conversion of Normal Frictional Needs of Traffic into Skid Numbers(Kummer and Meyer [12])
29
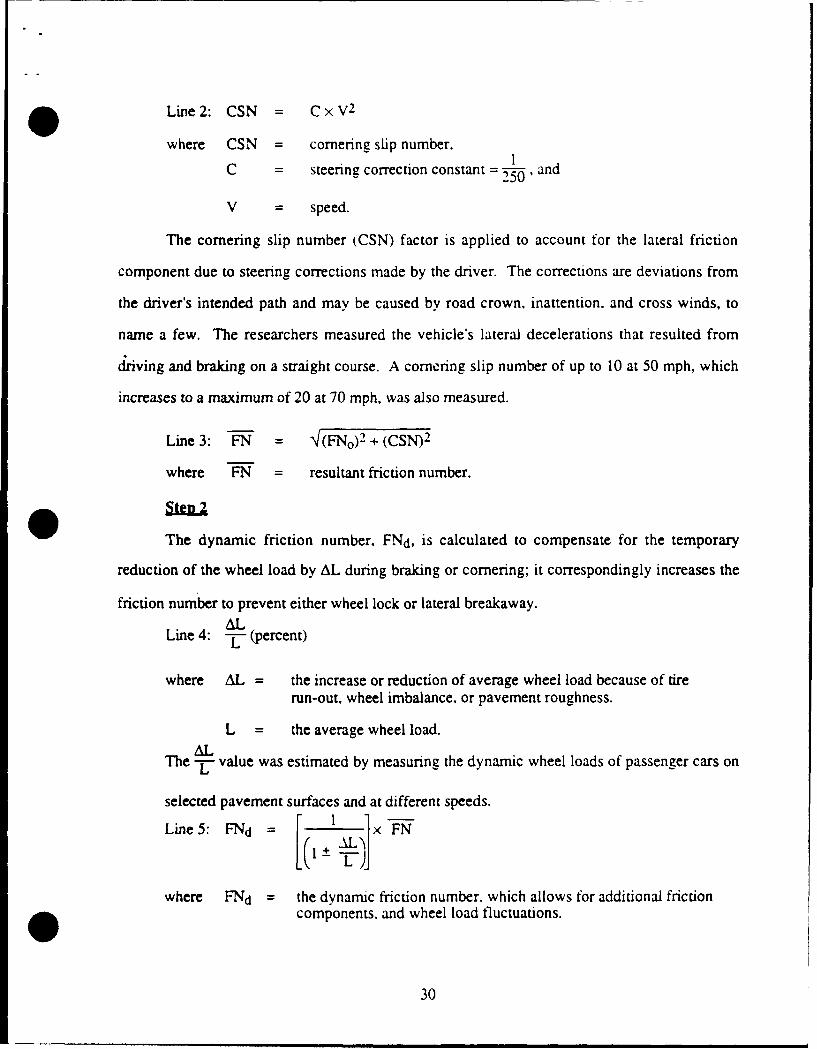
Line 2: CSN = CXV 2
where CSN = cornering slip number.
C = steering correction constant =-25o , and
V = speed.
The cornering slip number (CSN) factor is applied to account for the lateral friction
component due to steering corrections made by the driver. The corrections are deviations from
the driver's intended path and may be caused by road crown, inattention, and cross winds, to
name a few. The researchers measured the vehicle's lateral decelerations that resulted from
driving and braking on a straight course. A cornering slip number of up to 10 at 50 mph, which
increases to a maximum of 20 at 70 mph, was also measured.
Line 3: FN (FN0 )2 + (CSN)2
where FN = resultant friction number.
The dynamic friction number, FNd, is calculated to compensate for the temporary
reduction of the wheel load by AL during braking or cornering; it correspondingly increases the
friction number to prevent either wheel lock or lateral breakaway.ALLine 4: "L" (percent)
where AL = the increase or reduction of average wheel load because of tirerun-out, wheel imbalance. or pavement roughness.
L = the average wheel load.
The AL value was estimated by measuring the dynamic wheel loads of passenger cars on
selected pavement surfaces and at different speeds.
Line 5: FNd = ,ýýjxF
where FNd = the dynamic friction number. which allows for additional frictioncomponents. and wheel load fluctuations.
30

To convert the dynamic friction number, FNd, into a corresponding skid number, SNo, a
K-factor is used. The K-factor accounts for the fact that vehicles "see" transient critical friction
numbers before skidding occurs, whereas pavement skid resistance is measured under quasi-
steady-state conditions. These critical friction numbers are higher than skid tester obtained skid
numbers, which, in part. are due to lower tire temperatures during testing (thus higher friction
levels). Thus, the K-factor, which accounts for typically used tread designs, rubber
compositions, and surface types, is used to convert the needed pavement friction to a measured
pavement friction.
F'NLine 6: K = N
where FN = the transient friction number, and
SN = the steady-state skid number.
Line 7: SN 0 FNd
where SNo = the minimum skid number that satisfies the normal frictional needsof traffic under the ideal test conditions of constant temperature andzero machine error.
The K-factors used in NCHRP Report 37 were obtained from results reported by Maycock and
are shown in Table 3. (2Q) They are mean ratio's of BSN (Brake Skid Number-measured under
transient conditions) divided by SN (Skid Number-measured under steady-state conditions).
The SNo is adjusted for pavement temperature effects, resulting in SNt. In 1967
pavement temperature was thought to have a significant effect on skid number. However, it was
impractical in routine skid resistance surveys to ,-onstantly monitor wet pavement temperature in
order to correct the data. Therefore, the researchers developed a correction factor in the
laboratory by measuring the British Pendulum Number (BPN) with natural rubber sliders on aSN
bituminous concrete surface. The authors chose a conservative gradient of 0.3 -N, which was
much higher than the results of other researchers at the time. This experiment suggested that
31
further work was needed to establish a reliable correction factor. The temperature correction
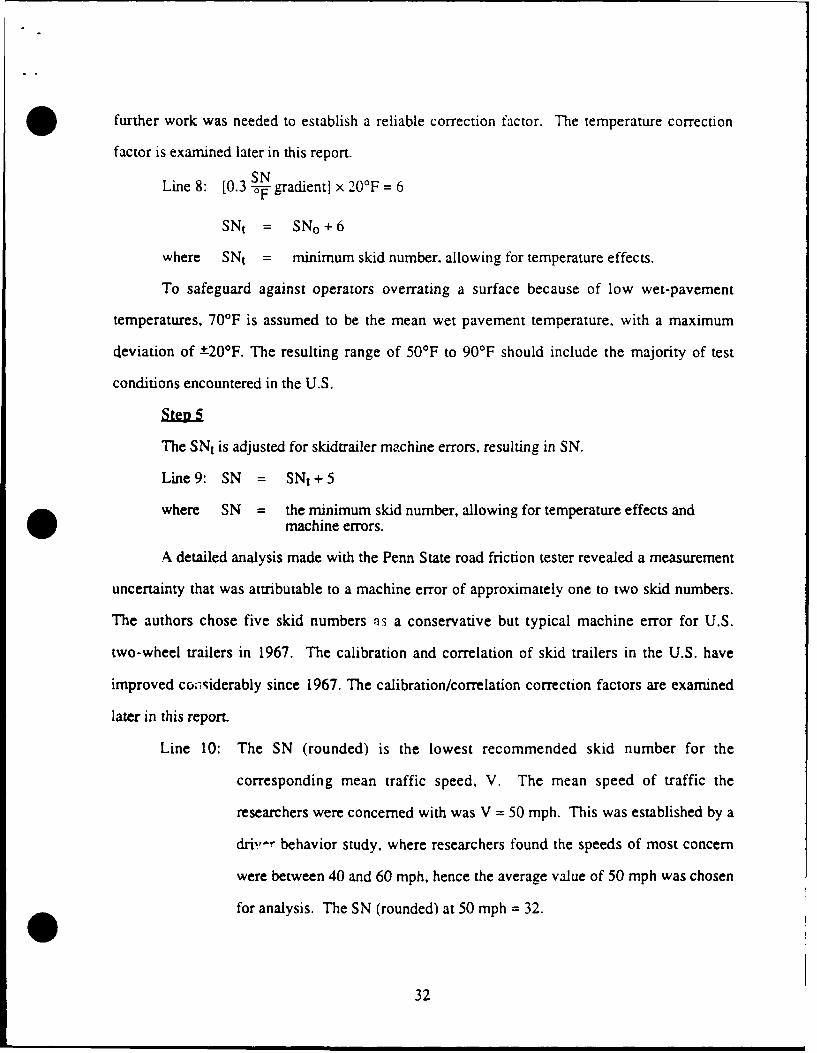
factor is examined later in this report.SN
Line 8: [0.3 gradient] x 20OF = 6
SNt = SNo +6
where SNt = minimum skid number, allowing for temperature effects.
To safeguard against operators overrating a surface because of low wet-pavement
temperatures, 70'F is assumed to be the mean wet pavement temperature, with a maximum
deviation of ±20°F. The resulting range of 50'F to 90'F should include the majority of test
conditions encountered in the U.S.
The SNt is adjusted for skidtrailer machine errors, resulting in SN.
Line 9: SN = SNt + 5
where SN = the minimum skid number, allowing for temperature effects andmachine errors.
A detailed analysis made with the Penn State road friction tester revealed a measurement
uncertainty that was attributable to a machine error of approximately one to two skid numbers.
The authors chose five skid numbers as a conservative but typical machine error for U.S.
two-wheel trailers in 1967. The calibration and correlation of skid trailers in the U.S. have
improved coi-.iderably since 1967. The calibration/correlation correction factors are examined
later in this report.
Line 10: The SN (rounded) is the lowest recommended skid number for the
corresponding mean traffic speed, V. The mean speed of traffic the
researchers were concerned with was V = 50 mph. This was established by a
dri,," behavior study, where researchers found the speeds of most concern
were between 40 and 60 mph, hence the average value of 50 mph was chosen
for analysis. The SN (rounded) at 50 mph = 32.
32
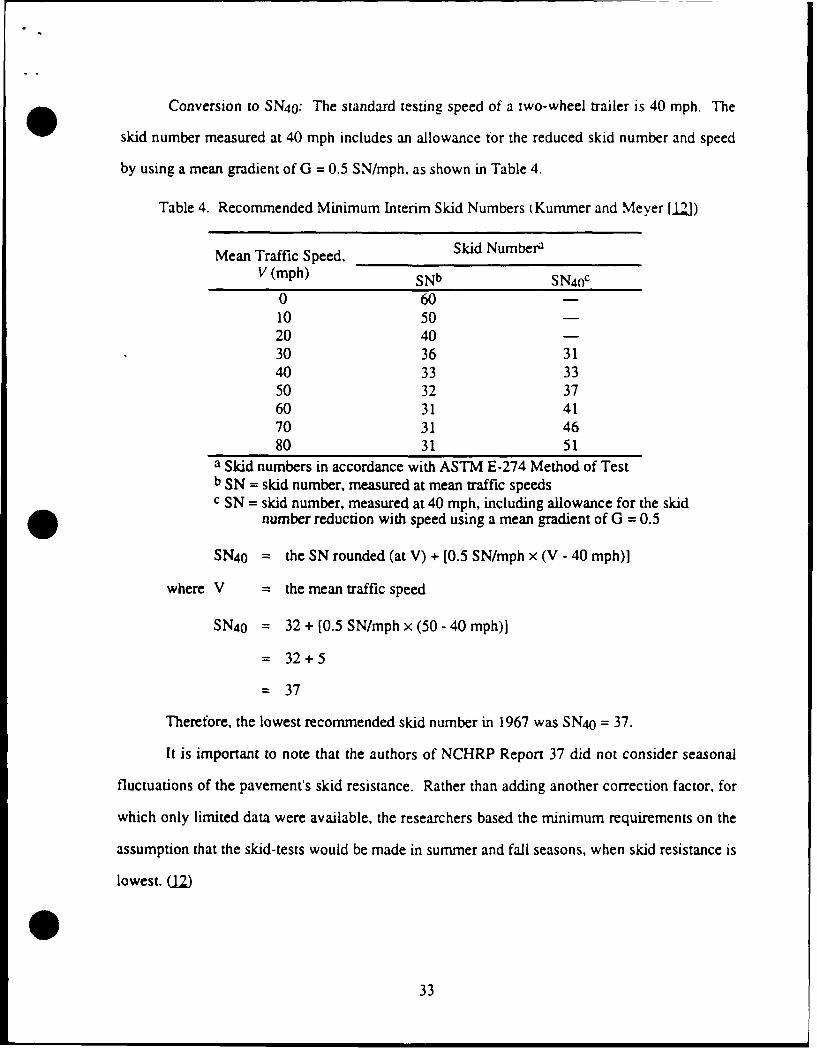
Conversion to SN 40 : The standard testing speed of a two-wheel trailer is 40 mph. The
skid number measured at 40 mph includes an allowance for the reduced skid number and speed
by using a mean gradient of G = 0.5 SN/mph. as shown in Table 4.
Table 4. Recommended Minimum Interim Skid Numbers (Kummer and Meyer L12])
Mean Traffic Speed, Skid Numbera
V (mph) SNb SN4flC
0 6010 5020 4030 36 3140 33 3350 32 3760 31 4170 31 4680 31 51
a Skid numbers in accordance with ASTM E-274 Method of Testb SN = skid number, measured at mean traffic speedsc SN = skid number, measured at 40 mph, including allowance for the skid
number reduction with speed using a mean gradient of G = 0.5
SN40 = the SN rounded (at V) + [0.5 SN/mph x (V - 40 mph)]
where V = the mean traffic speed
SN40 = 32 + [0.5 SN/mph x (50 - 40 mph)]
= 32+5
= 37
Therefore, the lowest recommended skid number in 1967 was SN 40 = 37.
It is important to note that the authors of NCHRP Report 37 did not consider seasonal
fluctuations of the pavement's skid resistance. Rather than adding another correction factor, for
which only limited data were available, the researchers based the minimum requirements on the
assumption that the skid-tests would be made in summer and fall seasons, when skid resistance is
lowest.
33
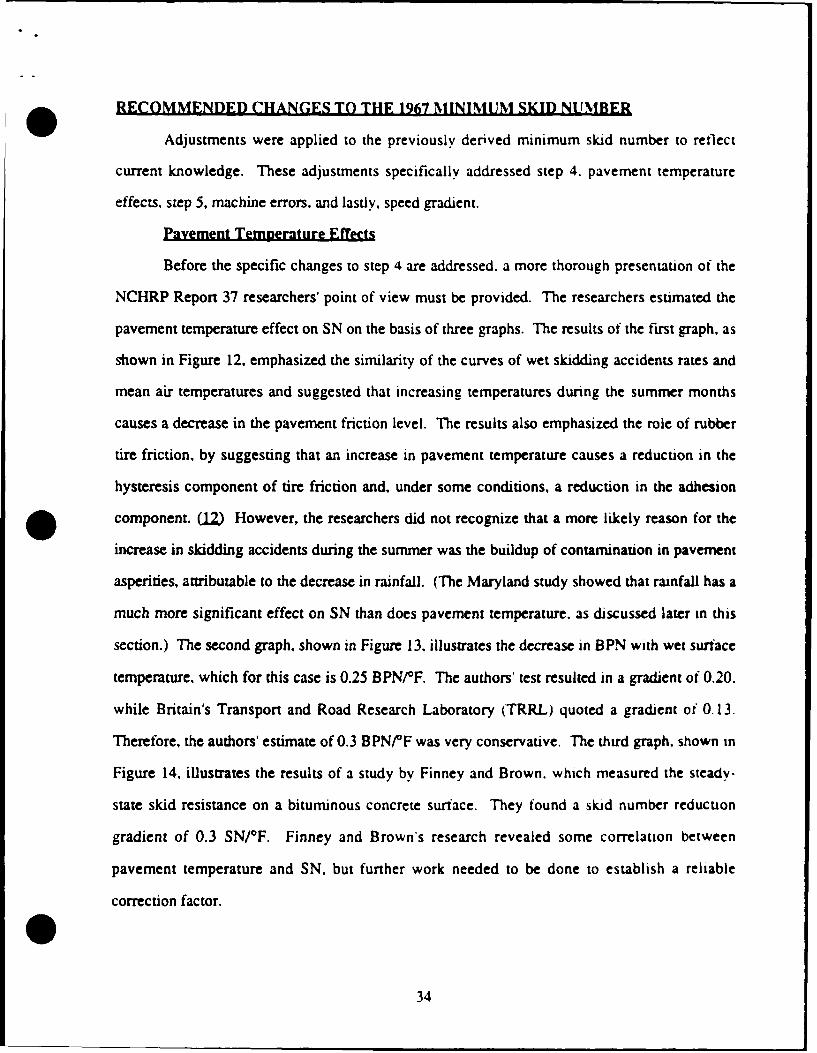
. RECOMMENDED CHANGES TO THE 1967 MINIMUM SKID NUMBER
Adjustments were applied to the previously derived minimum skid number to reflect
current knowledge. These adjustments specifically addressed step 4. pavement temperature
effects, step 5, machine errors, and lastly, speed gradient.
Pavement Temperature Effects
Before the specific changes to step 4 are addressed, a more thorough presentation of the
NCHRP Report 37 researchers' point of view must be provided. The researchers estimated the
pavement temperature effect on SN on the basis of three graphs. The results of the first graph, as
shown in Figure 12, emphasized the similarity of the curves of wet skidding accidents rates and
mean air temperatures and suggested that increasing temperatures during the summer months
causes a decrease in the pavement friction level. The results also emphasized the role of rubber
tire friction, by suggesting that an increase in pavement temperature causes a reduction in the
hysteresis component of tire friction and, under some conditions, a reduction in the adhesion
component. (2) However, the researchers did not recognize that a more likely reason for the
increase in skidding accidents during the summer was the buildup of contamination in pavement
asperities, attributable to the decrease in rainfall. (The Maryland study showed that rainfall has a
much more significant effect on SN than does pavement temperature. as discussed later in this
section.) The second graph, shown in Figure 13. illustrates the decrease in BPN with wet surface
temperature, which for this case is 0.25 BPN/0 F. The authors' test resulted in a gradient of 0.20.
while Britain's Transport and Road Research Laboratory (TRRL) quoted a gradient of 0.13.
Therefore, the authors' estimate of 0.3 BPNPF was very conservative. The third graph. shown in
Figure 14, illustrates the results of a study by Finney and Brown, which measured the steady-
state skid resistance on a bituminous concrete surface. They found a skid number reduction
gradient of 0.3 SN/0 F. Finney and Brown's research revealed some correlation between
pavement temperature and SN, but further work needed to be done to establish a reliable
correction factor.
34

so
- --- - -
JAlIL Il JAIL 9 J#A.
Figure 12. Seasonal Fluctuations of Skidding Accidents and AirTemperature, Suggesting a Friction-Temperature Interaction(Kummer and Meyer L12J)
35

aw 0
CEMENT CONCRETEC- 40 NATURALRUBSER
30 50 70 90WET SURFACE TEMPERATURE, T, F
Figure 13. Reduction of British Pendulum Number due to Temperature-OriginatedDecrease in Rubber Damping (Kummer and Meyer [2,])
z 'IUIO~ II '
40ITCONCRETE 10
3• 0 , V4mh -- 90 w
C II I I-2 1C0 V a40 mph -4----50 wI I it
U)' i ,
0 5 9 t 5 9 i 5
TIME OF TEST, hrs
Figure 14. Influence of Hourly Changes in Wet Surface Temperatures onSteady-State Skid Number (Kummer and Meyer [12.)
36
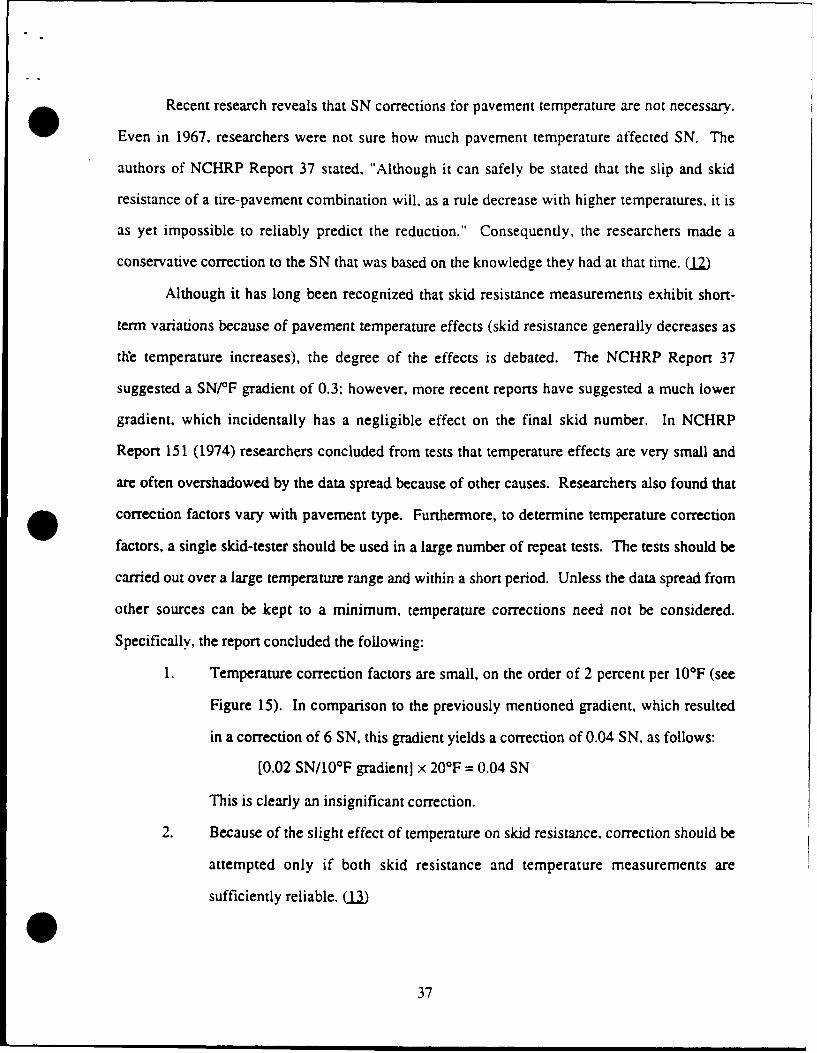
Recent research reveals that SN corrections for pavement temperature are not necessary.
Even in 1967, researchers were not sure how much pavement temperature affected SN. The
authors of NCHRP Report 37 stated, "Although it can safely be stated that the slip and skid
resistance of a tire-pavement combination will, as a rule decrease with higher temperatures, it is
as yet impossible to reliably predict the reduction." Consequently, the researchers made a
conservative correction to the SN that was based on the knowledge they had at that time. (12)
Although it has long been recognized that skid resistance measurements exhibit short-
term variations because of pavement temperature effects (skid resistance generally decreases as
the temperature increases), the degree of the effects is debated. The NCHRP Report 37
suggested a SN/°F gradient of 0.3; however, more recent reports have suggested a much lower
gradient, which incidentally has a negligible effect on the final skid number. In NCHRP
Report 151 (1974) researchers concluded from tests that temperature effects are very small and
are often overshadowed by the data spread because of other causes. Researchers also found that
correction factors vary with pavement type. Furthermore, to determine temperature correction
factors, a single skid-tester should be used in a large number of repeat tests. The tests should be
carried out over a large temperature range and within a short period. Unless the data spread from
other sources can be kept to a minimum, temperature corrections need not be considered.
Specifically, the report concluded the following:
1. Temperature correction factors are small, on the order of 2 percent per 10F (see
Figure 15). In comparison to the previously mentioned gradient, which resulted
in a correction of 6 SN, this gradient yields a correction of 0.04 SN, as follows:
[0.02 SN/10 0 F gradient] x 20°F = 0.04 SN
This is clearly an insignificant correction.
2. Because of the slight effect of temperature on skid resistance, correction should be
attempted only if both skid resistance and temperature measurements are
sufficiently reliable. (.3.)
37

d d
0
o-CI
.2r
, a my i
P0
3-8
:E <0w
(ot >
93Un MIS L
In 03-

Researchers have also concluded from recent studies that pavement temperature does not
appreciably affect skid resistance. The Maryland Department of Transportation sponsored a
research study in 1986 to investigate seasonal variations of friction numbers. It concluded,
Researchers are divided when it comes to conclusions relative to the effects ofpavement temperature on friction numbers. Graphs of the data derived from thisstudy [as shown in Appendix El leave little doubt as to where Maryland will standon this issue. As can be seen, there is no discernible relationship between the twoparameters. Collaboration of this can be obtained by scrutinizing the dataresulting from regression analyses (as shown in Appendix El. Not only are thecoefficients virtually zero, but the slopes of the lines show that friction numbersare not effected [sic] by the pavement temperature. (1-4)
Researchers agree that in both northern and southern states, short-term variations in skid
resistance appear to be the result of variations in local weather conditions, specifically rainfall
and temperature. In 1989. rainfall was shown to have a more pronounced effect on skid
resistance than pavement temperature in a research report by the Pennsylvania Transportation
Institute, in coordination with the Federal Highway Administration. The report stated, "It is
evident in a series of measurements from Florida that SN 4 0 decreases to a minimum value by
about midyear and then increases, as contrasted with Texas during a dry year, when there is very
little, if any, time-of-year effect [see Appendix Fl." (22)
The effect of pavement temperature on skid number can be further analyzed by a model
developed by the Pennsylvania researchers. The researchers developed and validated procedures
for normalizing pavement friction measurements for seasonal and short-term variations. A
generalized predictor model was developed from the statistical analysis of skid resistance
measurements taken frequently during the season in three geographic areas. With realistic
temperature variations, this model resulted in only slight and inconsistent variations of SN 40 with
pavement temperature. This slight variation was evident from graphs of the data from Florida,
New York, Pennsylvania, and San Angelo. Texas (see Appendix F). (2Z) Therefore, this
research supports the conclusion that pavement temperature does not significantly affect
pavement skid resistance.
39

A statement by Kennedy. et al. from Britain, partially supports the position that a
temperature correction factor is not necessary for skid-testing in the U.S. (in accordance with
ASTM Method E-274). Kennedy stated.
Increasing the (pavement) temperature reduces SFC by about 0.003 units per 'Cbut surfacings with a higher coefficient of friction tend to suffer a greaterreduction. The effect is not particularly significant over the normal working rangeof temperatures in a particular area, but can be significant when equipment withnoncontinuous types of operation is used: systems with continuous measurementof skid resistance need only to ensure that equilibrium working temperatures havebeen reached, normally by testing for about 500 m (1640 ft), prior to recording onthe survey lengths. (M,)
The testing method in the U.S. is not continuous; however, because the locked test wheel
is allowed to slide on the pavement for a certain distance to permit the temperature in the contact
area to stabilize, it could be argued that equilibrium temperatures are reached and a correction
factor is not necessary.
Furthermore, when the pavement temperature is high, it is brought down to an
equilibrium temperature by the ambient temperature of the water that is applied to the pavement
ahead of the wheel before and during wheel lockup. This is further justification for not applying
a correction factor for pavement temperature.
Machine Error Effects
In 1967, when NCHRP Report 37 was published, the national Field Test and Evaluation
Centers (FT & EC) had not yet been established. Not until 1971 did the Federal Highway
Administration (FHWA) establish the centers to calibrate and correlate locked-wheel skid trailers
in order to reduce interstate variations in locked-wheel skid measurements of pavement
surfaces. (20)
In NCHRP Report 151 (1974), "Locked-Wheel Pavement Skid-Tester Correlation and
Calibration Techniques," the standard deviation of mean skid numbers was reduced from 4.08 to
1.04 after corrective measures, including calibrations, were applied. The factors thought to be
most responsible for the initially poor correlation were, in order of decreasing effect, force
calibration and wheel load errors, chart interpretation and evaluation, watering systems, and
temperature effects. Because of NCHRP Report 15 l's findings, significant improvements were
40

made in methods that could be controlled-these methods included all those stated above except
temperature.
The NCHRP Report 151 listed the error sources in skid-testing and the estimated error
bands at 40 mph (as shown in Appendix H. Table 1). From these estimates, the predicted total
error band for inventory testing by a single tester was calculated to be 2.4 SN for the "reduced"
condition (as shown in Appendix H, Table 2). Reduced refers to the decrease in errors resulting
from improved procedures, correction of data, and improved equipment. U.3.)
Furthermore, the allowable machine error stated in ASTM E-274 is a standard deviation
of*2 SN. Using a one-sided 95 percent confidence interval, the calculated machine error is
(2) (1.645) = 3.29 (or approximately 3).
Given the improved and standardized calibration procedures described above, the
machine error correction factor can safely be decreased to 3 SN.
Speed Gradient
The WSDOT mean speed gradient (G) is 0.2 SN/mph versus the G = 0.5 SN/mph in
NCHRP Report 37. This is based on calibration equations developed at TII (as shown in
Appendix 1).
REVISED SKID NUMBER
On the basis of the findings discussed above, the correction factor for temperature effects
(6 SN) can be deleted and the correction factor for machine errors (5 SN) can be decreased to
3 SN. The result is as follows:
SN = SNo+3
SN(atV= 50mph) = 20.5+3 = 23.5
SN (rounded) = 24
SN 40 = SN (rounded) + [0.2 SN/mph x (V - 40 mph)]
SN40 = 24 + [0.2 SN/mph x (50 - 40 mph)]
SN40 = 24+2=26
The revised minimum skid number is SN4 0 = 26 (revised in that it is derived using the NCHRP
. methodology with improved inputs).
41

CHAPTER 4
SUMMARY
CIU1DELINEThis paper examined NCHRP Report 37 (1967), which set a recommended minimum
skid number guideline of 37 for highways. Adjustments were made to the NCHRP Report 37
methodology for current knowledge in the areas of pavement temperature and machine errors
and their effect on pavement skid resistance. The resulting minimum skid number guideline was
calculated to be 26.
WSDOT uses AASHTO terminology, which assigns friction number (FN) to represent
the identical measured value of skid resistance as SN. Therefore, the recommended minimum
friction number guideline for WSDOT is 26. A CALTRANS report (.a) concluded that the
accident rate was nearly constant on pavements with friction numbers greater than 26, but
0 increased substantially as the friction numbers decreased from 25 to 17. This supports the
suggested guideline.
State DOT's have generally not assigned a single minimum friction value as policy for
highway skid resistance. The issue is difficult because of the number of factors affecting the
availability of skid resistance (as described in the Background section, Chapter 1) and sensitive
because highway departments should be concerned with pavements in real need of surface
friction improvement. Consequently, state DOT's generally prefer to use a range of friction
values.
USE OF SMOOTH AND RIBBED STANDARD TEST TIRES FOR NETWORK
TESTING
Given the research results by Henry and Wambolt (8) on the smooth tire procedure for
routine skid-testing (ASTM E-524 or AASHTO M-286), this measurement process appears
* promising. Their research demonstrated that if only one tire is used, it should be the smooth tire
42

because of its equal sensitivity to micro- and macro-texture. Adjustments must be made to the
recommendations of this report if a smooth tire is used.
LIMITATIONS OF USING FN ALONE FOR PAVEMENT MANAGEMENT
It is essential to remember that roads should not be ranked by friction number only.
Consider the example of a long, straight road with a friction number of 25 and an ADT of 1.
This road should not be a concern if many other roads have high ADT values, curves,
intersections, etc., and have the same or even higher FN values. These roads would be more
lik'ely to have wet weather accidents.
In fact, WSDOT must analyze wet-pavement accident rates first, before skid resistance
data, when preparing the list of hazardous sites by priority order. This is recommended by
FHWA Technical Advisory T5040.17 (as shown in Appendix J). (11.)
Finally, to fully evaluate the risk of a wet-pavement accident, all factors that influence
demand for friction and available friction must be considered. This is difficult because wet-
pavement accidents are caused by complex interactions among many roadway, vehicle, human,
and environmental factors. Accidents also occur because of unpredictable factors such as
inattentiveness, misjudgment, recklessness, and random variables such as unforeseeable events
or obstacles. Realizing this, pavement engineers do their best to provide reasonably safe
highways through routine skid-testing and experience. (I)
43

* ACKNOWLEDGMENTS
I wish to thank Newton Jackson, Keith Anderson and Linda Pierce of the Washington
State Department of Transportation (WSDOT) for their cooperation and assistance in conducting
this research. Also instrumental was Jeffrey Donahue, the Transportation Engineer in charge of
operation and maintenance of WSDOT's skid trailer, and his crew.
I also wish to thank Professor Joe Mahoney for his role as advisor.
44
REFERENCES
1. Byrd, Tallamy, MacDonald and Lewis. "Training Course: Skid ResistanceMeasurements and Design, Instructor Notebook." U.S. Department ofTransportation, Federal Highway Administration, and National HighwayInstitute Contract DTFH61-80-C-00023 FHWA, 1981.
2. Camomilla, G. and M. Malgarini, G. Peroni "High-Performance Measurementsfor Programming and Controlling Maintenance of Surface Characteristics:Operational Systems in Use on Italian Motorways." SurfaceCharacteristics of Roadways: International Research and Technologies,ASTM STP 1031, W.E. Meyer and J. Reichert, Eds., American Society forTesting and Materials, Philadelphia, pp. 305-326, 1990.
3. Dahir, S.H.M. and W.L. Gramling. "Wet-Pavement Safety Programs," NationalCooperative Highway Research Program (NCHRP) Report 158,Washington, D.C., Transportation Research Board, July, 1990.
4. Farber, E. and M.S. Janoff, S. Cristinzio, J.G. Blubaugh, W. Reisener, W.Dunning. "Determining Pavement Skid-Resistance Requirements atIntersections and Braking Sites," National Cooperative Highway ResearchProgram (NCHRP) Report 154, Washington, D.C., TransportationResearch Board, 1974.
5. Gargett, T. "The Introduction of a Skidding-Resistance Policy in Great Britain."Surface Characteristics of Roadways: International Research andTechnologies, ASTM STP 1031, W.E. Meyer and J. Reichert, Eds.,American Society for Testing and Materials, Philadelphia, pp. 30-38,1990.
6. Hall, J.P. and D.D. Bernardin, J.G. Gehler. "Overview of Smooth- and Treaded-Tire Friction Testing by Illinois Department of Transportation." PavementDesign, Management, and Performance, Transportation Research Record1348, Washington, D.C., Transportation Research Board, pp. 43-48, 1992.
7. Henry, J.J. "Tire Wet-Pavement Traction Measurement: A State-of-the-ArtReview." The Tire Pavement Interface, ASTM STP 929, M.G. Pottingerand T.J. Yager, Eds., American Society for Testing and Materials,Philadelphia, pp. 3-25, 1986.
8. Henry, J.J. and J.C. Wambold. "Use of Smooth-Treaded Test Tire in EvaluatingSkid Resistance." Pavement Design, Management, and Performance,Transportation Research Record 1348, Washington, D.C., TransportationResearch Board, pp. 35-42, 1992.
9. Highway Research Board. "Skid Resistance," National Cooperative HighwayResearch Program (NCHRP) Synthesis of Highway Practice 14,Washington, D.C., Highway Research Board, 1972.
45

10. Kennedy, C.K., and A.E. Young, I.A. Butler. "Measurement of SkiddingResistance and Surface Texture and the Use of Results in the UnitedKingdom." Sutface Characteristics of'Roadways: International Researchand Technologies. ASTM STP 1031, W.E. Meyer and J. Reichert, Eds.,American Society for Testing and Materials, Philadelphia, pp. 87-102,1990.
11. Kulakowski, B.T. and J.C. Wambold, C.E. Antle, C. Lin, J.M. Mason."Development of a Methodology to Identify and Correct SlipperyPavements." The Pennsylvania Transportation Institute Research Project88-06, Pennsylvania Department of Transportation, Harrisburg, PA., Nov.1990.
12. Kummer, H.W. and W.E, Meyer. "Tentative Skid-Resistance Requirements forMain Rural Highways," National Cooperative Highway ResearchProgram (NCHRP) Report 37, Washington, D.C., Highway ResearchBoard, 1967.
13. Meyer, W.E. and R.R. Hegmon, T.D. Gillespie. "Locked-Wheel Pavement SkidTester Correlation and Calibration Techniques," National CooperativeHighway Research Program (NCHRP) Report 151, Washington, D.C.,Transportation Research Board, 1974.
14. Mitchell, J.C. and M.I. Phillips, G.N. Shah. "Seasonal Variation of FrictionNumbers." Maryland Department of Transportation, Baltimore, Maryland,February 1986.
15. Moyer, R.A. "Motor Vehicle Operating Costs, Road Roughness and Slipperinessof Various Bituminous and Portland Cement Concrete Surfaces."Highway Research Board, Proceedings of the Twenty-Second AnnualMeeting, National Research Council, Washington, D.C., pp. 13-52, 1942.
16. Moyer, R.A. "Road Surface Properties, Report of the Committee on AntiskidProperties of Road Surfaces." Bulletin No. 27, Road Surface Properties.Highway Research Board, National Research Council, Washington, D.C.,pp. 1-6, 1949.
17. Oglesby, C.H. and R.G. Hicks. Highway Engineering, Fourth Edition. JohnWiley & Sons, Inc., New York, 1982.
18. Page, B.G. and L.F. Butas. "Evaluation of Friction Requirements for CaliforniaState Highways in Terms of Highway Geometrics." FHWA/CA/TL-86/01, U.S. Department of Transportation, Federal HighwayAdministration, Washington, D.C., January 1986.
19. Rogers, M.P. and T. Gargett. "A Skidding Resistance Standard for the NationalRoad Network." Highways and Transportation Vol. 38, Institution ofHighways and Transportation, London, England, pp. 10-13, April 1991.
20. Texas Transportation Institute. "Central/Western Field Test and EvaluationCenter Report No. TC-220 for Washington State Department ofTransportation System No. 3." The Texas A&M University System,College Station, Texas, November 1989.
46

21. Wambold, J.C. and J.J. Henry, R.R. Hegmom. "Skid Resistance of Wet-WeatherAccident Sites." The Tire Pavement Interface, ASTM STP 929. M.G.Pottinger and T.J. Yager, Eds., American Society for Testing andMaterials, Philadelphia. pp. 47-60, 1986.
22. Wambold, J.C. and J.J. Henry, C.E. Antle, B.T. Kulakowski, W.E. Meyer, A.J.Stocker, J.W. Button, D.A. Anderson. "Pavement Friction MeasurementNormalized for Operational, Seasonal, and Weather Effects." FHWA-RD-88-069, U.S. Department of Transportation, Federal HighwayAdministration, Washineton, D.C., June 1989.
23. Wambold, J.C. and B.T. Kulakowski. "Limitations of Using Skid Number inAccident Analysis and Pavement Management." Pavement Design,Management, and Performance, Transportation Research Record 1311,Washington, D.C., Transportation Research Board, pp. 43-50, 1991.
24. Washington State Department of Transportation and Washington StateTransportation Center, IVSDOT Pavement Guide, Olympia, WA., January1993.
25. Washington State Department of Transportation, CS 9000 Pavement Skid Tester,Olympia, WA.
26. Washington State Department of Transportation, Statewide Friction TestingInventory, Olympia, WA.
27. Washington State Department of Transportation, Questions and Answers AboutFriction Testing, Olympia, WA.
28.- -, "Skid Resistance of Paved Surfaces Using a Full-Scale Tire, (Designation: E274-90)," 1992 Annual Book of ASTM Standards, Philadelphia,Pennsylvania, American Society for Testing and Materials, Volume 09.02,pp. 615-619, 1992.
29.- -, "Standard Test Method for Calibrating a Wheel Force or Torque TransducerUsing a Calibration Platform (User Level), Designation: E 556-89)," 1992Annual Book of ASTM Standards, Philadelphia, Pennsylvania, AmericanSociety for Testing and Materials, Volume 09.02, pp. 640-642, 1992.
30.-----, "Calibration of Braking Force for Testing of Pneumatic Tires, (Designation:F 377-86)," 1992 Annitl Book of ASTM Standards, Philadelphia,Pennsylvania, American Society for Testing and Materials, Volume 03.01,pp. 513-516, 1992.
31.---... "FHWA Technical Advisory T 5040-17." December 23. 1980. SkidAccident Reduction Program.
32. Maycock. G.. "Studies on the Skidding Resistance of Passenger-Car Tires on WetSurfaces," Proceedings. Institute of Mechanical Engineers, AutomobileDivision, Vol. 180. Part 2A (4), 1965-66.
047
APPENDIX A
SUMMARY OF FACTORS IN SKID RESISTANCE MEASUREMENT(FROM MEYER, ET / L. LU2)
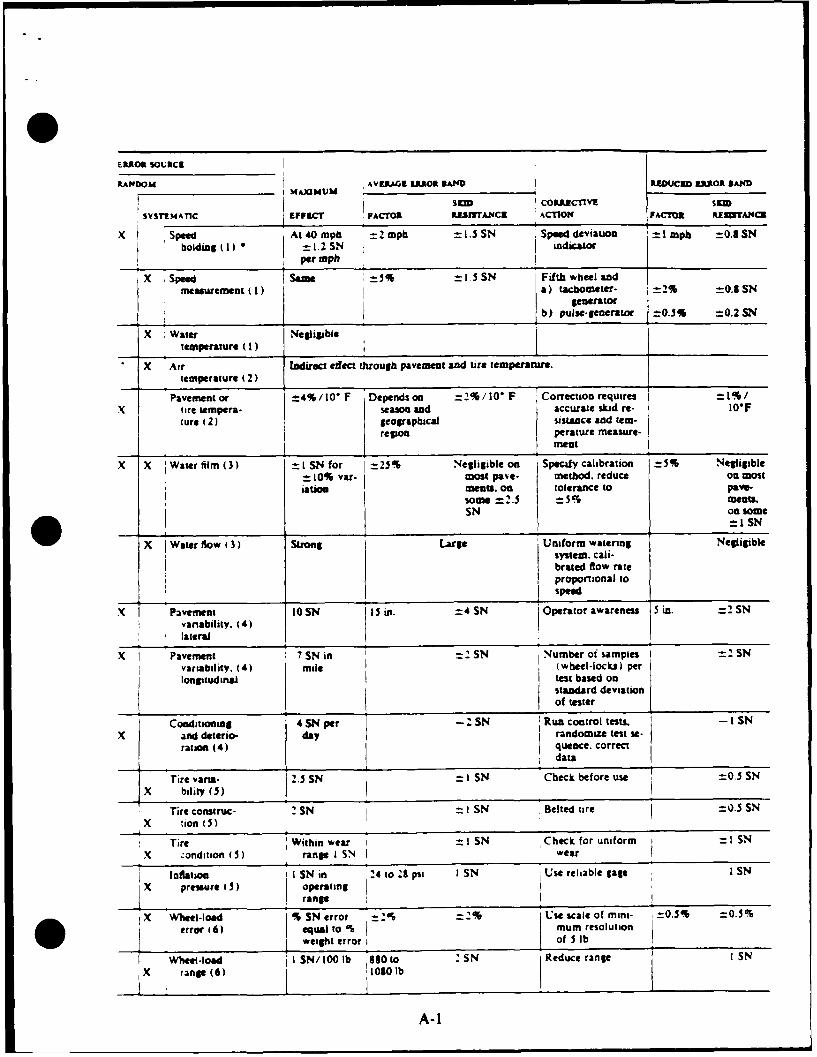
ERROR SORCE I
RANDOM AVERAGl EEROR lA" REDU•ED ERR*OR DAND
S13Dm COIUUZCTIIE S13D
SYSTEMATIC EFFECT FACTOR RUSWtTANCR ACTION FACTOR RzTANCK
X Speed At 40 mph -'2 mph = 1.5 SN Speed deviauon "1 mph =0.8 SNbolding (1) = 1.2 SN indicator
per mph I
X Speed Same =5% = 15 SN Fifth wheel andmeasurement (1) a) tachometer- =2% =0.8 SN
generator
b) pulse-generator =0.5% =0.25 N
"X I Water Negligibletemperature (I)
X Air Indirect effect through pavement and tire temperature.temperature 2)
Pavement or =4%/10' F Depends on =2%/10' F CorTection requires =1%/X tire tempera- season and accurate skid re- WOF
lure (2) geograplhical sistance and term-region peratre measure-mentnl I_______ __
X X Water film (3) =1 SN for =25% Negligible on Specify calibration =5% Negligible- 10% var- most pave- method, reduce on mostiation menm, on tolerance to pave-
some =2.5 =5% menr.SN on some
I ± ISN
X Water flow 13) Strong Large Uniform watering Negligiblsystem, cali-brated flow rateproportional to
X Pavement 10 SN Is in. =4 SN Operator awareness 15 in. =2 SNvariability. (4)lateral
x Pavement 7 SN in =2 SN .Number oi samples =2 SNvariablity, (4) mile (wheel-lockSs) per
- longitudinal test based onstandard deviationof tester
Conditioning 4 SN per -SN Run control tests. I SNx and deterio- day I randomize test se-
ratton (4) quence. correctdata
Tire vara- 2.5 SN =I SN Check before use =0.5 SN
X bility (5)
Tire construc- 2 SN = I SN Belted tire =0.5 SNX tion 05)
Tire Within wear I I SN Check for uniform =1 SN
X zondition ( 5) range I SN I wear
tnflation I SN in 24 to 218 psi I SN Use reliable gage I SN
X prewure ( 5) operating
range
X Wheel-load S SN error =2% =2% Use scale of mini- =0.5% =0.5%
error (6) equal to %I mum resolutionweight error i of 5 Ib
Wheel-load I 100 lb 80 to :SN Reduce range I SNX range (6) 10110lOb
A-1
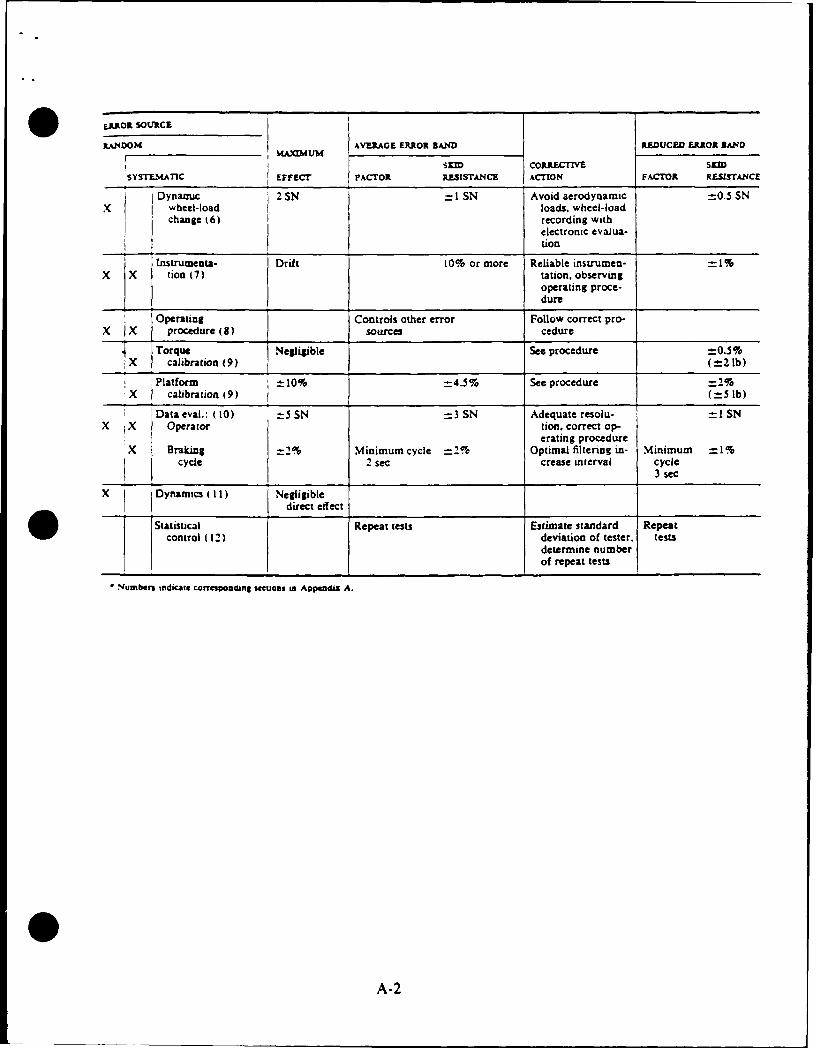
ERROR SOURCE
RANDOM i AVERAGE ERROR BAND REDUCED ERROR BAND________ . Q:M4UM
SKID CORRECTIVE SKIDSYSTEMATIC EFFECT FACTOR RESISTANCE ACTION FACTOR RE-ISTANCE
Dynamic 2 SN =1 SN Avoid aerodynamic =0.5 SNX wheel-load loads, wheel-load
change t6) recording withelectronic evalua-tion
Instrumenta- Drift 10% or more Reliable instrumen-X X tion (7) tation. observing
operating proce-dure
Operating Controls other error Follow correct pro-X X procedure (8) sources cedure
Torque Negligible See procedure =0.5%Scalibration 19) (=2 lb)
Platform ±L 10% =4.5% See procedure =2%!X calibration (9) (±5 lb)
=Dataeval.: (10) -5SN 3 SN Adequate resolu- -1 SNX Operator tion. correct op-
erating procedureX Braking =2% Minimum cycle =2% Optimal filtering in- Minimum =1%
cycle 2 sec crease interval cycle3 sec
X Dynamics ( I1) NegligibleI direct effect
Statistical Repeat tests Estimate standard Repeatcontrol (12) deviation of tester, tests
determine numberof repeat tests
"Numbenr indicate corrapondng iecuons in Appendix A.
A-2

APPENDIX B
WSDOT MEMORANDUM REGARDING PAVEMENT FRICTION INVENTORY(FROM WSDOT STATEWIDE FRICTION INVENTORY [2.kJ)
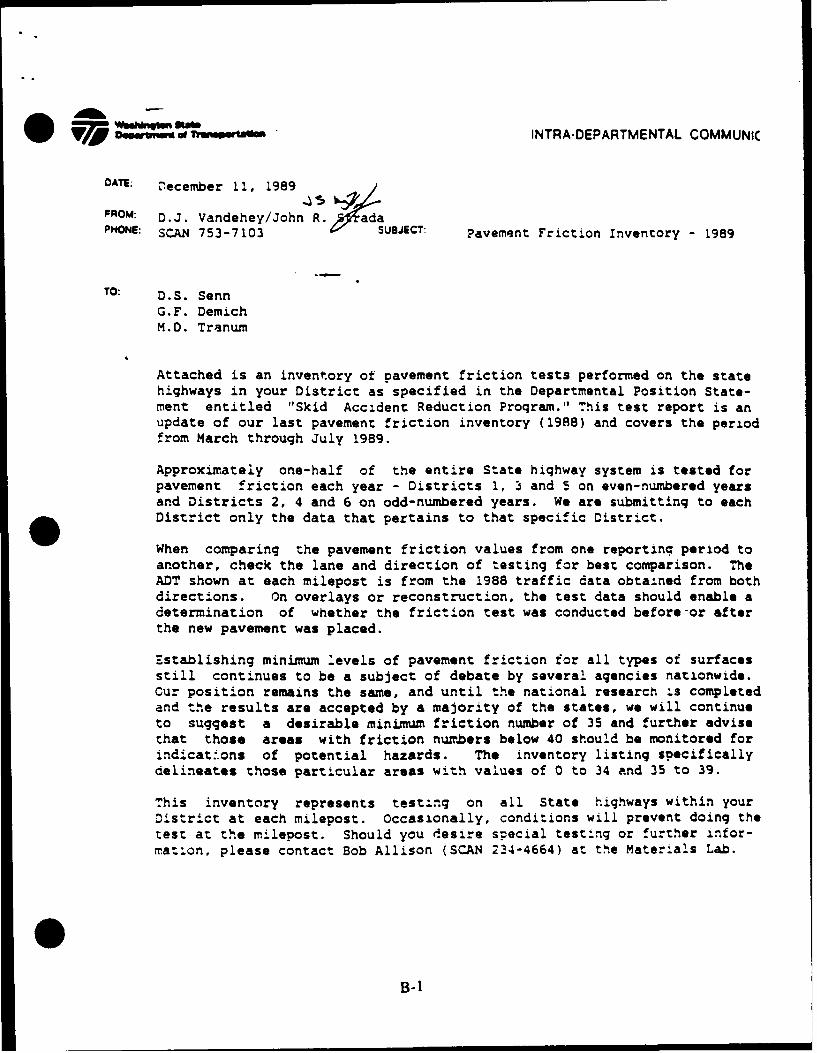
T Dow 0~4 Go T"W1'r ' NTRAODEPARTMENTAL COMMUNIC
OATE: December 11, 1989
FROM: D.J. Vandehey/John R. *adaPHONE: SCAN 753-7103 SUBJECT: Pavement Friction Inventory - 1989
TO: D.S. Senn
G.F. DemichM.D. Tranum
Attached is an inventory of pavement friction tests performed on the statehighways in your District as specified in the Departmental Position State-ment entitled "Skid Accident Reduction Program." This test report is anupdate of our last pavement friction inventory (1988) and covers the periodfrom March through July 1989.
Approximately one-half of the entire State highway system is tested forpavement friction each year - Districts 1, 3 and 5 on even-numbered yearsand Districts 2, 4 and 6 on odd-numbered years. We are submitting to eachDistrict only the data that pertains to that specific District.
When comparing the pavement friction values from one reporting period toanother, check the lane and direction of testing for best comparison. TheADT shown at each milepost is from the 1988 traffic data obtained from bothdirections. On overlays or reconstruction, the test data should enable adetermination of whether the friction test was conducted before-or afterthe new pavement was placed.
Establishing minimum levels of pavement friction for all types of surfacesstill continues to be a subject of debate by several agencies nationwide.Cur position remains the same, and until the national research is completedand the results are accepted by a majority of the states, we will continueto suggest a desirable minimum friction number of 35 and further advisethat those areas with friction numbers below 40 should be monitored forindicati.ons of potential hazards. The inventory listing specificallydelineates those particular areas with values of 0 to 34 and 35 to 39.
This inventory represents testilng on all State highways within yourDistrict at each milepost. Occasionally, conditions will prevent doing thetest at the milepost. Should you desire special test:ng or further infor-mation, please contact Bob Allison (SCAN 234-4664) at the Materlals Lab.
B-I
APPENDIX C
DYNAMIC CALIBRATION RUN-SKID TESTER OUTPUT WITH DATADEFINITIONS AND GRAPH OF FRICTION NUMBER VS. TEST NUMBER
(FROM TEXAS TRANSPORTATION INSTITUTE (1M)
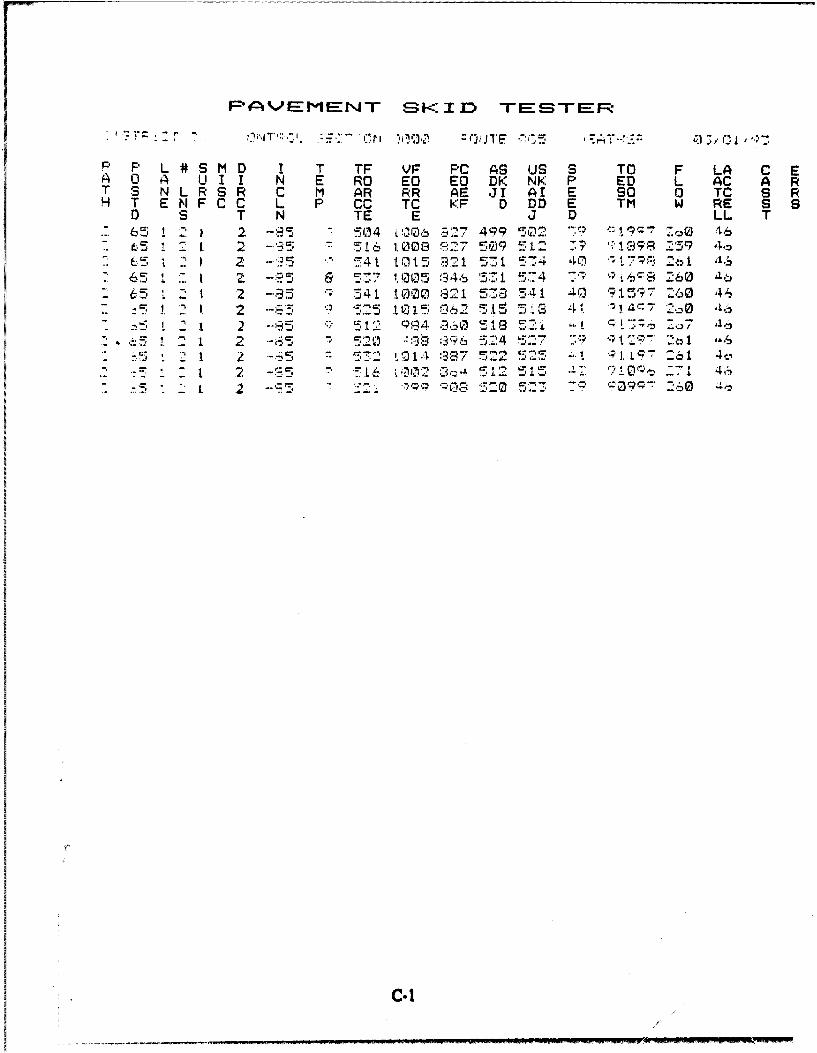
FAVEMEN-T si-: I D TESTER
S'?" ._"7 - :..T!;.- : =-{- or :•T.2 ~ :rflE -< ,-T<'-'-:. rj , ' t, 3
P L # S M D I T TF VF PC AS US S TO F LA C Eb A U I I N E RO EO EO DK NK P ED L AC A R
T S N L R S R C M AR RR AE JI Al E So 0 TC S RH T E N F C C L P CC TC KF D DD E TM W RE S 9
D S T N TE E 3 D LL T"65 1- 2 -- 5 504 03060 :!7 499 53 "22 ' '::' -o 46
1 2, -2 %`516 1.00G -" '277 5- f2)9 S12 7 1 0 9 2;5's9"f 6-5 2. z I 2 -15, 5t t5 8-7. 1 -7t 174 40 n t7• 21 .5
65 2I Z - '5 0- 0 5 '346 531 T. 4 7,668 2b0 4:,
6 5 2 1 2 -85 541 1000 ý• 1 5 _ 541 40 915 Z0 4,,.2 15o 2 5'3 4.; 157 2,0 A
=-~- •. 2 i 2 :-3=, 4 52-:•. 7 :14 5217 q -- ' ,5 ,'1 -6. _-., - 0 =3 :9 - .. 4 5 -, ": "• 2 7 =• ,
"I .5 '- Z 1 2 -,15 - .6 :,,7 c,-4 '312 515 '. "'I0%........... .. . .. T, -- , :7 4,
c-1

PAVEMENT SKID TESTER DATA DEFINITIONS
The Pavement Skid Tester generates printed reports and records test data onto a digital
cassette. This data includes parameters that are operator entered as well as values that are
derived from the test instrumentation. Below is a tabulation of these parameters and their
meanings.
Parameter Definition
District Departmental district: 0-99
Control Section Control section number: 0-9999
Route Hiehwav route number: 0-999
Weather Weather code:0 = clear1 = cloudy2 = rain3 = windy
Month Month: 1- 12
Day Day: 1-31
Year Last digits of year: 0-99
Wheel Path Wheel path: I = right 2 = left
Posted Speed Posted speed limit
Lane Lane number: 0-9
Total Lanes Total number of lanes: 0-9
Surface Surface description number: 0-90 = patchI = dense graded AC2 = open graded AC3 = chip seal4 = PCC5 = PCC grooved6 = epoxy7 = slurry seal8 = non aggregate seal9 = all others
Misc Miscellaneous: 0-9
C-2

Parameter Definition
Direction Direction:I = north (incrementing)2 = south (decrementing.3 = east (incrementing)4 = west (decrementine)
Inclination Inclination of trailer in degrees. Blue momentarycontroller cabinet button selects transverseinclinometer. Otherwise reads longzitudinalinclination. Readings are updated only whentesting is not active. Very closely spaced testsmay cause this value to lag quickly changingconditions.
Temperature Measured temperature in degrees C
Tract Force Measured traction force in pounds
Wheel Load Measured vertical force in pounds
Adj Skid Skid number = traction / vertical x 100adjusted by calibration equation
Unadj Skid Skid number = traction / vertical x 100
Test Speed Measured test speed
Test Odom Odometer at the center of the data averagingsegment
Flow Rate Average measured flow rate during test
Lateral Accel Lateral Acceleration in Gs from accelerometer
C-3
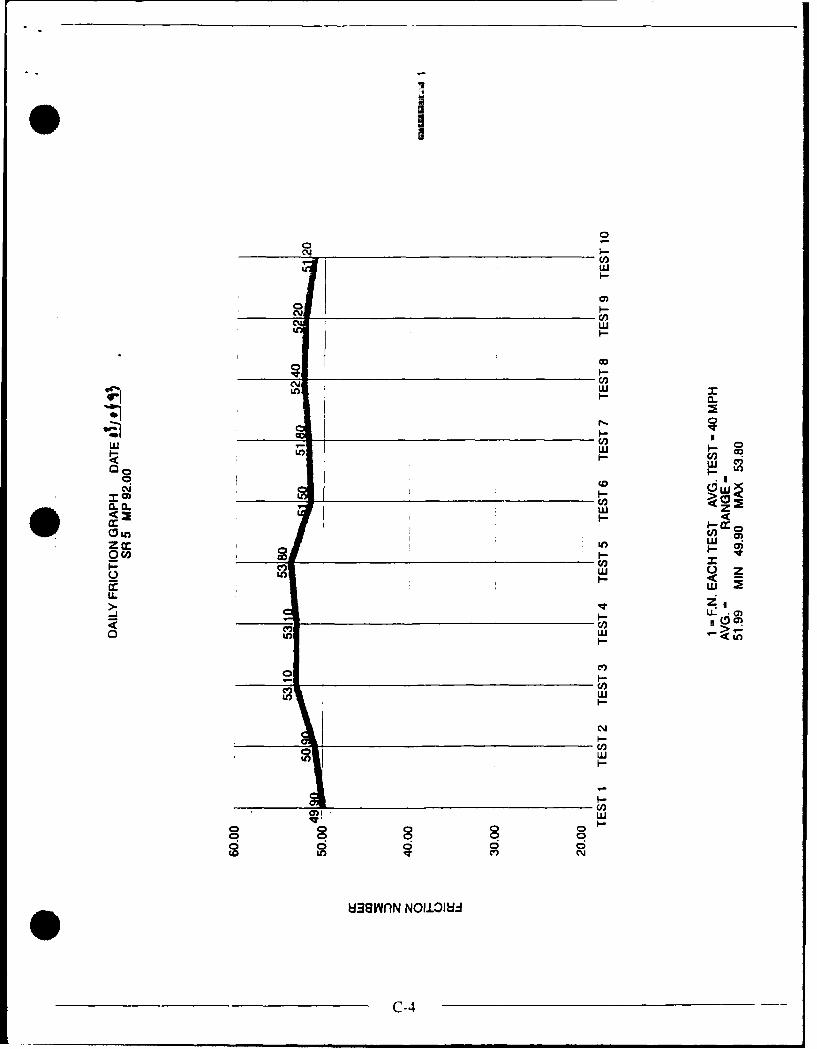
CY,
LO LU
CJ)J
0 U) LU
LU,
(00 LUC
Ito LU 1CV ~
C-4-
APPENDIX D
GREAT BRITAIN SKID RESISTANCE POLICY FOR DIFFERENTCATEGORIES OF SITE (FROM GARGETT [SI)
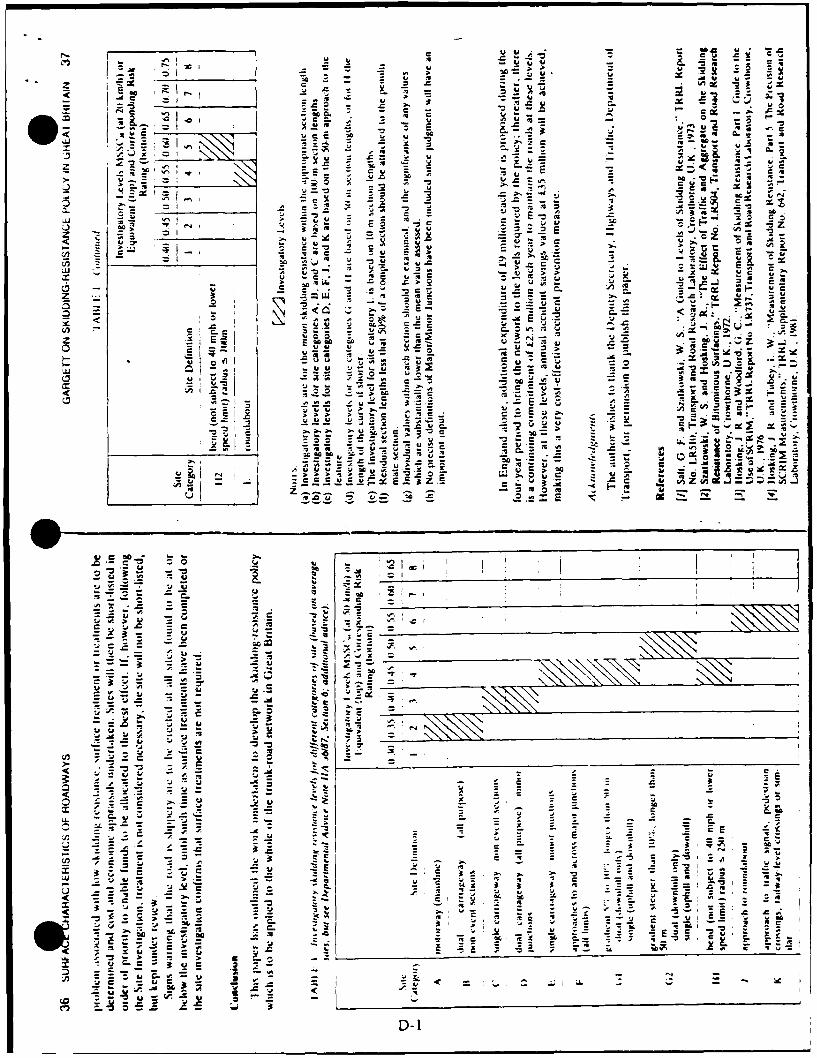
7c ~ .
it it Zu 4 C
Z -- _ =-- Z
a: C
TII r -. 4~
(1 Z.- ., S-; .N. - .1 -
<5 'a 3
> 'u 'Q~- > C - :.I- -
S- >0 --. I.- -. --:-i c to,.
3 W0. >
z- se ýco
72 c 4 .
Z~ ~~~ 5, E0 ~ ~
01 - .
LO . .to
D-1~

APPENDIX E
MARYLAND REPORT - CORRELATION BETWEENPAVEMENT TEMPERATURE AND FRICTION NUMBER
ANDGRAPHS OF FRICTION NUMBER VS. PAVEMENT TEMPERATURE
(FROM MITCHELL, ET AL. [1-4])

CORRELATION BETWEEN PAVEMENT TEMPERATURE
AN! FRICT'.'N NUMBERS
Site Pavement Correlation4umner rype Coefficient ,R) slope
JRCP .2060 -. 03302 jRCP .0801 .01503 JRCP .0049 .0007
Average .0970 -. 0058
4 CRC? .2174 .03785 CRCP .1280 .0173
15 CRCP .0527 -. 016016 CRC? .1025 .027319 CRCP .0041 -. 000920 CRC? .i031 .0191
Average .1013 +.0141
6 DGBC .0150 -. 00047 DGBC .0861 .0205a DGBC .0144 .00299 DG9C .2425 -. 0417
10 DGBC .2076 .045711 DGBC .1141 .030112 DGAC .0911 -. 0264
Average .1104 ÷..0044
13 OGBC .0773 .028914 OGBC .0863 .046717 OGSC .1577 .055518 OGGC .0223 .0072
Averace .0859 4..0346
Jointed Reinforced Concrete Pavement UJRCP)
Continuoustv Reitnorced Concrete Pavement iCRCP'
Dense Graded Bituminous Concrete Pavement iDGBC•
Open Graded Bitumunous Concrete Pavement iOGBC•
E-1

'49
14IT No 2
0 9b
E-

a1 I eMo. 2
00
-4 4 0
P000 K .0PCnrn cc.) *
0 * 0 0 0 *E-3

aI TC No. c
49
49.
4ncw U * **40C C
E-
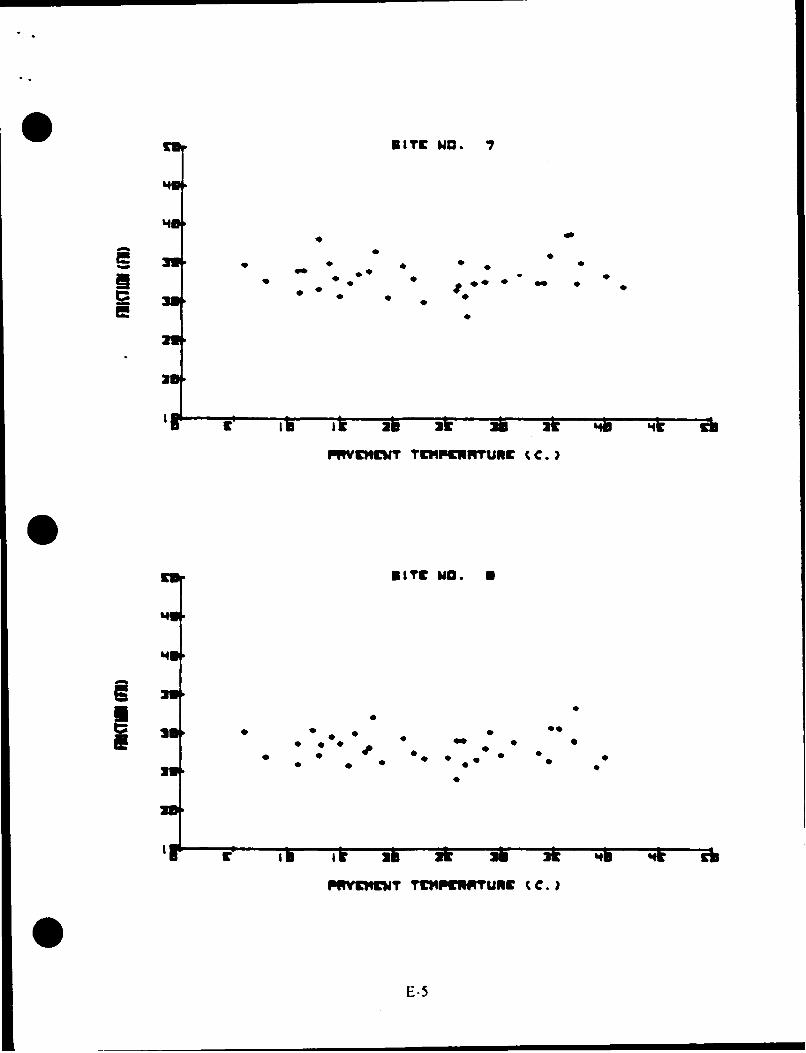
NIE O. 7
aft
M4
is It S V4 1 4
44CHN 4CP F NCtC
I p 2* is i t fo ;
4. "C~ nom"4n C.*
E-

46- N.
IS li 2l A A E q
PRYEMIEWT 1CICMRTURC (C.)
IITC WCO. IN
2.4
3.4
V S 1 4 r
PUCW CCPTOCC
E-6
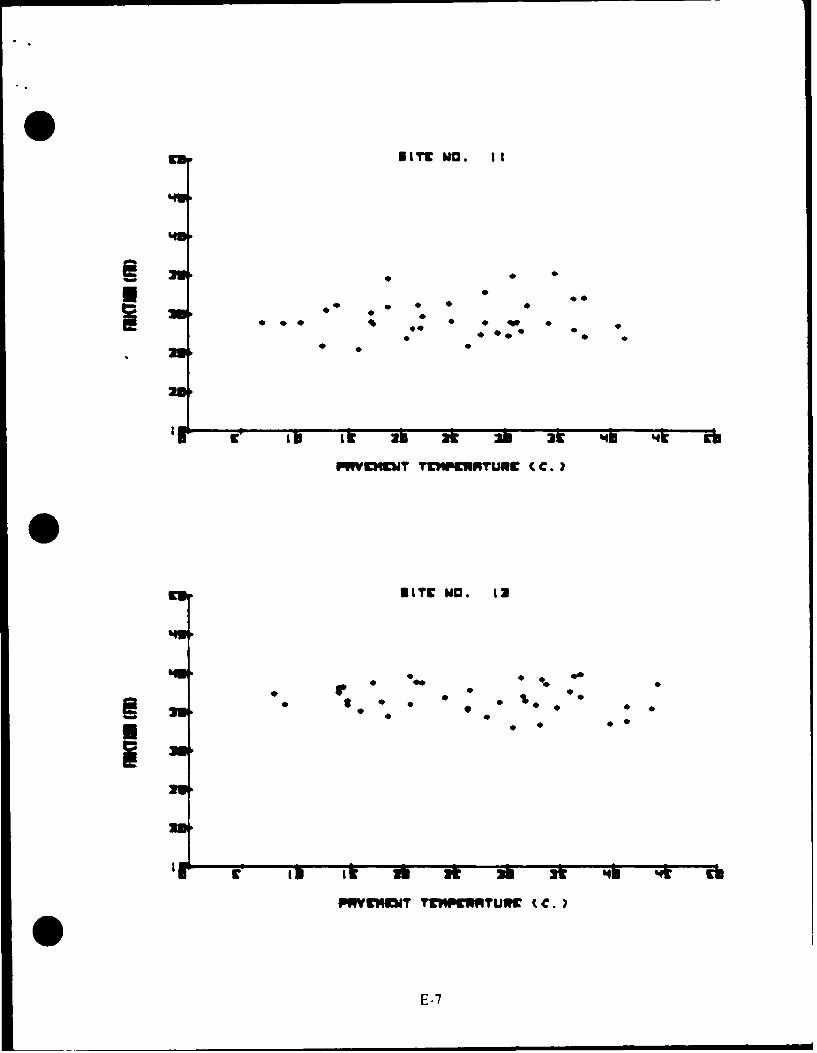
U 9.
2k 4! 4i9
~YD1ET TEMPNTURCC C.*
KIE-75.

40
go - *9 Mo 1
* 90.
140-O 9
PflYEMEbT TOIPPENAU*E CC.
E-9

Li aKI TZ No. I c
49o .
Lfs w4 0
Lit U 3 2 t i 4
PHvEIaff TEHMctpunc CC.)3
KITEC No. to
300
E -9
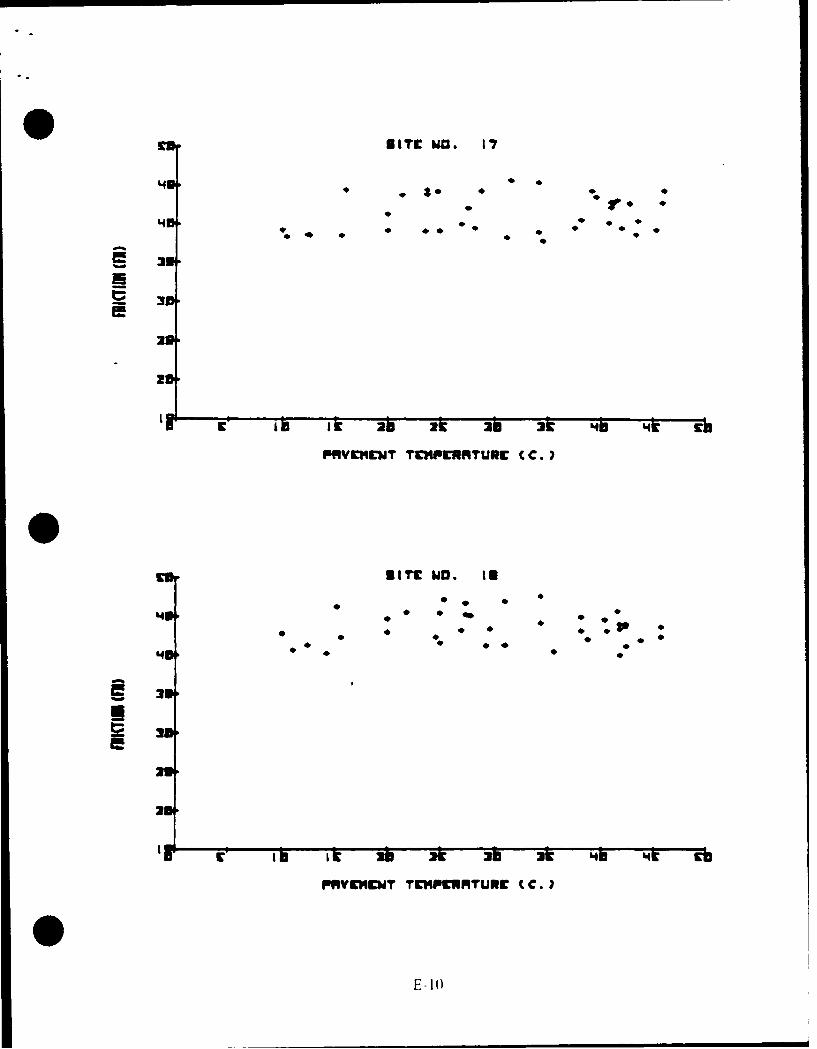
LID* - N *N. 17
39
29
20
E 1 k 29 A 32 3E '46
PRRVL*MENT TEMPEUNPTUREC CC.)
8 1TE NJo. to
490
'4 0
it A *i 06
* MC"U T. * * U0 CC.
* ~ E 11)
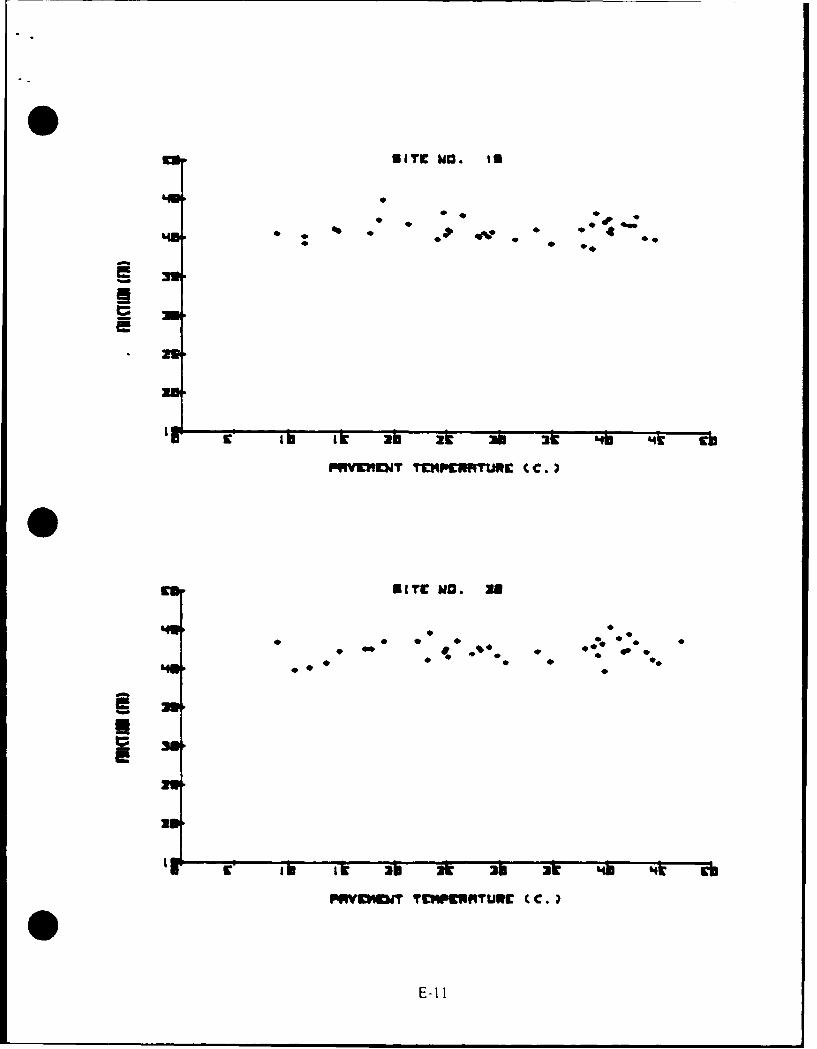
M...
FMVL""iENT TEMPNWITUREC CC.
ce -KI TE No. RU
010
.0.0.
* w.%
PRYDNCIT TCV4MPETUE C C.)
E-11I

APPENDIX F
PENNSYLVANIA REPORT - SKID RESISTANCE BY DAYS FORFLORIDA AND TEXAS (FROM WAMBOLT. ET AL. [221)
0
0

0o
6 .
* z
CI,
U-
CLC
0-0
F I

460
0 -Z
2 -0
o 0
ITJ
%PPENDIX (;
PENNSYLVANIA REPORT - SKID RESISTANCE GRAPHS AND DATA SETSFOR FLORIDA. NEW YORK. PENNSYLVANIA. AND TEXAS
(FROM WAMBOLT. ET AL. L=I)

0
S = skid resistance (rib tir,
A = 0.2 x air temperature
3 = 0.2 x T30
T30 = average temperature for prior 30 days
DSFN = dry spell factor (number of days since rainfall of 0. 1 inch or more)
0
0

00
<C.
'00
000
II 00
w 0"" 0
00
-0a0)
0 A 0 4 0 0 4 4A in.

SKID DATA FOR FLORIDA
------------- SITE=I.................
DAY SN AIRTEMP DSFN r30
280 31.9 58 2 75.0311 28.1 78 4 72.0343 27.3 62 7 65.3374 31.0 50 0 50.7402 28.4 70 0 53.8409 29.9 42 2 54.8430 25.5 40 2 55.9462 24.2 75 7 64.0492 23.3 88 7 67.6526 25.4 80 5 76.8560 23.2 85 0 79.1584 27.5 97 2 80.3616 30.4 75 3 78.3644 28.2 78 6 75.7708 34.6 70 2 65.3
SSITE=2----------------
DAY SN AIRTEMP DSFN T30
280 44.8 58 2 75.0ill 42.0 78 4 72.0
343 43.8 62 7 65.3374 44.2 50 0 50.7402 41.9 70 0 53.8409 44.6 42 2 54.8430 39.7 40 2 55.9462 40.1 75 7 64.0492 39.3 88 7 67.6526 38.7 90 5 76.8560 38.4 85 0 79.1584 40.3 97 2 80.3616 42.5 75 3 78.3
644 43.2 78 6 75.7708 45.4 70 2 65.3
G-3

00
0
00
w 0
0
U- L<~ Ul
0 y
z
0 o
o 1 0 if C ) 0 4 d 0 in 4 Q*) *1~ N, N

SKID DATA FOR NEW YORK
- SITE= ------------
SN DSFN AIRTEMP T30 DAY
536.7 0 62 53.71 '13557.7 2 63 63.97 1695e.ý 3 62 65.56 1.97
53.9 3 79 68.69 226
57.0 6 57 61.90 254
52.3 2 47 53.93 28952.1 7 39 38.84 322
---- --- --- --- SITE=2 - - - - - - - -
SN DSFN AIRTEMP T30 DAY
54.7 0 62 53.71 13555.8 2 63 63.97 16951.2 3 62 65.56 19752.8 3 79 68.69 22651.0 6 79 61.90 25452.4 2 48 53.93 28950.4 7 39 38.84 322
---- --- --- --- SITE=3 - - - - - - - -
SSN DSFN AIRTEMP T30 DAY
36.8 0 62 53.71 13540.8 2 63 63.97 16940.9 3 63 65.56 19737.6 3 80 68.69 22637.2 6 83 61.90 25436.8 2 48 53.93 28936.0 7 39 38.84 322
---- --- --- --- SITE*4 - - - - - - - -
SN DSFN AIRTEMP T30 DAY
45.1 0 62 53.71 13545.0 2 65 63.97 16947.1 3 64 65.56 19745.1 3 81 68.69 22639.5 6 80 61.90 25444.3 2 49 53.93 28942.2 7 40 38.84 322
G-5

<_za
Z
>='
*z zLJ H
a..<
CL<U
U0,0 QU) VIP
V))*
Ct2C
cow
M
J)
0~~~ a
r4 N
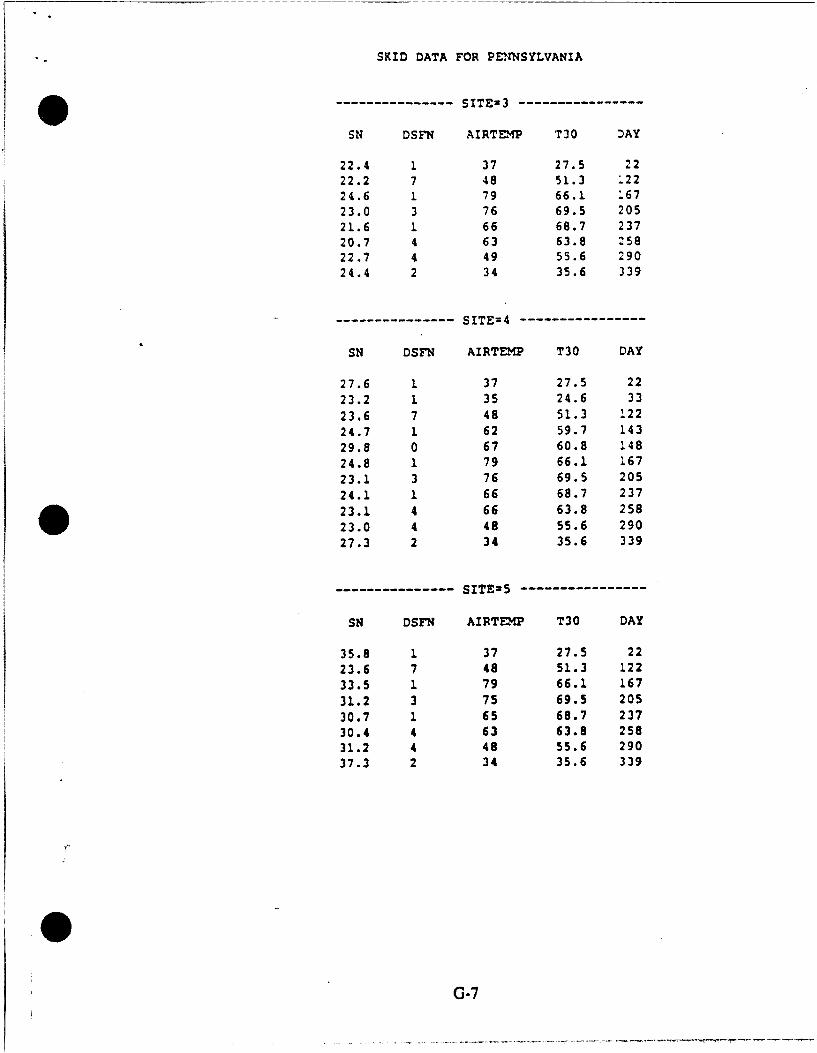
SKID DATA FOR PENNSYLVANIA
- - - SITEu3 -
SN DSFN AIRTE24P T30 DAY
22.4 1 37 27.5 2222.2 7 48 51.3 .2224.6 1 79 66.1 :67
23.0 3 76 69.5 20521.6 1 66 68.7 23720.7 4 63 63.8 25822.7 4 49 55.6 290
24.4 2 34 35.6 339
----------------SITE=4-----------------
SN DSFN AIRTEMP T30 DAY
27.6 1 37 27.5 2223.2 1 35 24.6 3323.6 7 48 51.3 12224.7 1 62 59.7 14329.8 0 67 60.8 14824.8 1 79 66.1 16723.1 3 76 69.5 20524.1 1 66 68.7 23723.1 4 66 63.8 25823.0 4 48 55.6 29027.3 2 34 35.6 339
----------------SITE25-----------------
SN DSFN AIRTEMP T30 DAY
35.8 1 37 27.5 2223.6 7 48 51.3 12233.5 1 79 66.1 16731.2 3 75 69.5 20530.7 1 65 68.7 23730.4 4 63 63.8 25831.2 4 48 55.6 29037.3 2 34 35.6 339
G-7
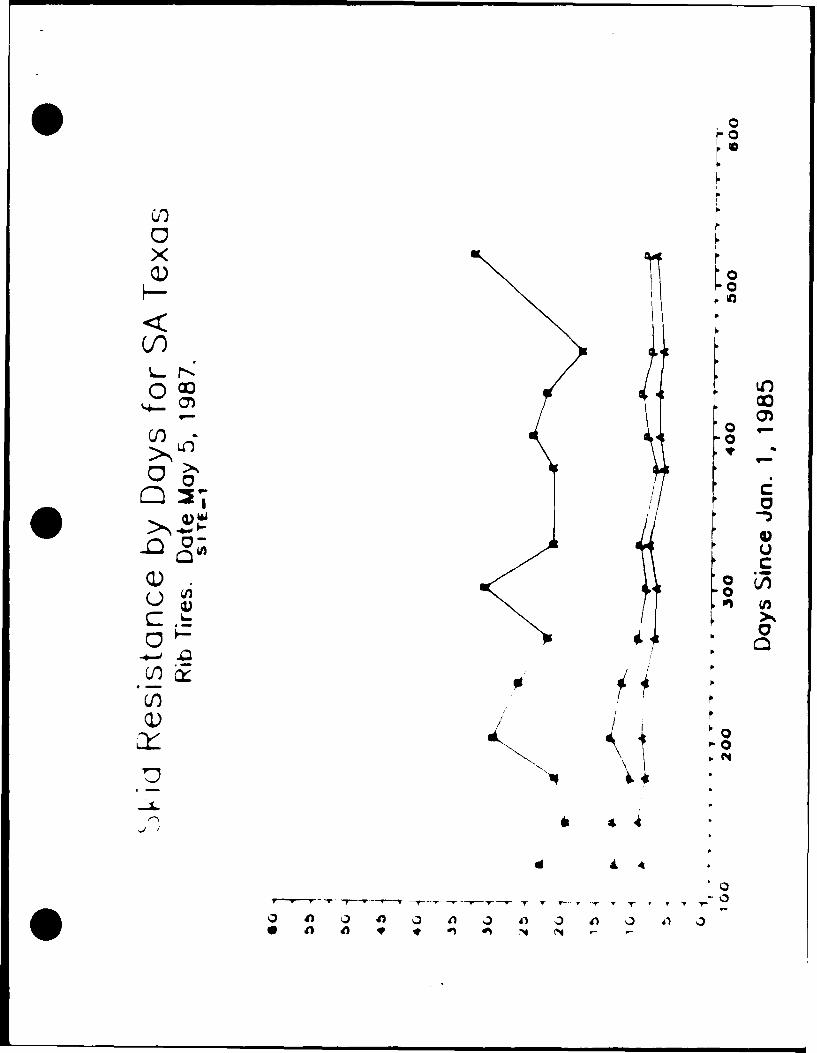
Q•
0 *,
>) ./ -
Q.Q• -(

SKID DATA FOR SAN ANGELO
S--- - -- - ----------------- SITE=I -
SN DSFN AIRTEMP T30 DAY
22.90 2 86 66.2 12019.40 6 93 72.4 14820.98 7 83 78.2 17729.68 0 88 78.1 20326.28 0 86 78.1 239
22.10 7 72 75.5 268
31.08 3 70 65.4 30121.46 7 81 56.6 329
----------------------------------SITE-2
SN DSFN AIRTEMP T30 DAY
31.18 2 85 66.2 120
32.84 6 92 72.4 148
34.94 7 83 78.2 177
37.74 0 88 78.1 203
34.34 0 86 78.1 239
32.62 7 71 75.5 268
36.46 3 68 65.4 301
29.96 7 80 56.6 329
----------------------------------SITE=3
SN DSFN AIRTEMP T30 DAY
35.84 2 86 66.2 120
32.84 6 94 72.4 14839.12 7 81 78.2 177
36.64 0 81 78.1 203
31.86 0 85 78.1 239
29.10 7 71 75.5 268
30.38 3 69 65.4 301
27.60 7 80 56.6 329
-----------------------------------SITE4
SN DSFN AIRTEMP T30 DAY
40.54 1 87 66.2 120
37.90 5 96 72.4 14844.52 7 0a 78.2 17746.84 0 88 78.1 203
43.50 0 92 78.1 239
40.34 7 71 75.5 268
40.92 7 71 65.4 301
38.04 7 81 56.6 329
G-9

%PPENDIX If
ESTIMATE ()F ERROR IN SKID-TESTIN; iFROM NIEVER. ET AL. LUJ)

APPENDIX I
FRICTION TEST REGRESSION AND SPEED CORRE(7TI(FORMULAS BASED NC (ALIBRATI(% AT TTI (LEFT WHEEL.i
iFROM TEXAS rRASPORTATI0% INSTITITE I=)fiI

0 ~FRICTION TEST RE-GRESSION AND SPEED CORREL'TION FORMULAS B ASED O'sCALIBrAION AT TTI (LEFTr WHEEL~ ( FROM TEXA~S TRANSPORTATION
1982 FNAd1 10 J21 ( SP .4) + FN(rvajli(H)7 . 1
1985 FN= 10 16 (Sp 40) + i-NI ~j( QQ~ I *
1987 FN' d 1023 Sp- 401 +F\N 1 ~~(~X *
1989 =~d 02 P-40 N 4M
MIODEL SKID Ut(IDUF %1 R )1 4 TIO)% I 'l Ri~ W AI
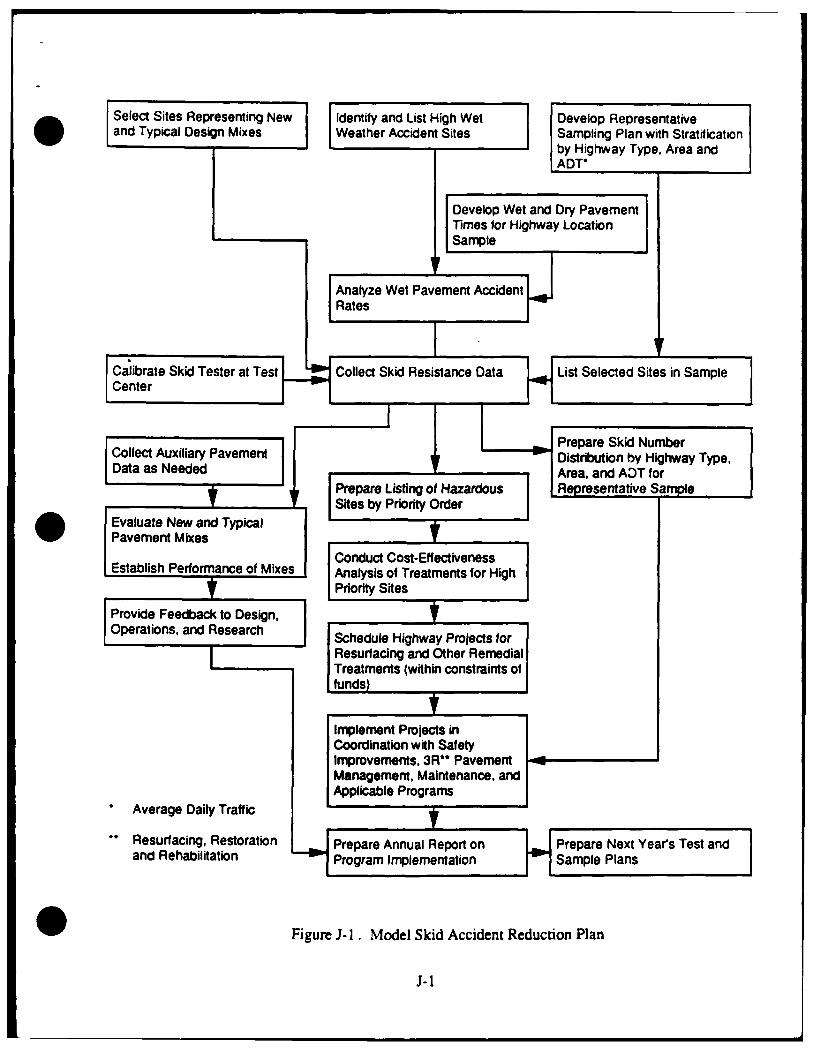
* Sites Representing New Identify and List High Wet Develop Representativeand Typical Design Mixes Weather Accident Sites Sampling Plan with Stratification
by Highway Type. Area andADT°
Develop Wet and Dry PavementTimes for Highway LocationSample
Analyze Wet Pavement AccidentRates
S T t Conduct o ist-Efetaveness
P[Peporrt Sitesube
Co land Raesea DistrSbceuon by Highway Type,Data as Needed Area, and ADT for
Prepare Listing of Hazardaus RePresentatiove SmPe
Evaluate New and TypicalsPavement Mixes
Conduct Cost-EffectivenessEstablish Performance of Mixes Analysis of Treatments for High
t Ppority SitesP rovideFeedbackoODesin,Operations, and Research Schedule Highway Projects for
i R i Resurfacing and Other RemedialTr tTreatments (within constraints of
Ifunds)
Implement Projects in S P
J. I
Coordination with SafetyImprovements, 3R** Pavement -Management, Maintenance, andApplicable Programs
•Average Daily Traff ic 1!
and Rehabilitation Program Implementation Sample Plans
SFigure J-lI. Model Skid Accident Reduction Plan
J-1