94 11 '9 - defense technical information · pdf filechemistry division program project...
TRANSCRIPT
ACURITY CLASSIFICATION OF THIS PACE-AD--A286 479fIEPORTDOCUMENTATIl
la. REPORT SECURITY CLASSIFICATION-L, .I ' lb. RESTRIC
none U non2a. SECURITY CLASSIFICATIO~ U 3. DISTRIBUTION /AV O A
2b. DECLASSIFICATION I DO)WNG unliite tar puble re1eats~
4. PERFORMING ORGANIZATION RE -- S. MONITORING ORGANIZATION REPORT NUMBER(S) -"
Technical Report # 77______ _-__-__ _ONR N00014-89-J-1225
6a. NAME OF PERFORMING ORGANIZATION 6b. OFFICE SYMBOL 7a. NAME OF MONITORING ORGANIZATION
University of Southern (If applicable)
MissisSiDDi I Office of Naval Research5c. ADDRESS (City, State, and ZIP Code) 7b. ADDRESS (City, State, and ZIP Code)
University of Southern Mississippi Chemistry DivisionDepartment of Polymer Science 800 North Quincy StreetHattiesburg, MS 39406-0076 Arlington, VA 22217-5000
3a. NAME OF FUNDING /SPONSORING 1Bb. OFFICE SYMBOL 9. PROCUREMENT INSTRUMENT IDENTIFICATION NUMBERORGANIZATION! (If applicable)
Office of.Naval Research8c. ADDRESS (City, State, and ZIP Code) 10. SOURCE OF FUNDING NUMBERS
Chemistry Division PROGRAM PROJECT ITASK VWORK UNIT800 North Quincy Street ELEMENT NO. NO. NO. ACCESSION NO.
Arlington, VA 22217-5000 1 1 111. TITLE (Include Security Classification) 13 15
Solid-State NMR Characterization of C- and N1-Labelled Phthalimides: Model Compounds forStudying Polyimides
12. PERSONAL AUTHOR(S)
William L. Jarrett C, Greg Johnson and Lon J. Mathias
13a. TYPE OF REPORT 113b. TIME COVERED 114. DATE OF REPORT (Year, Month, Day) S. PAGE COUNT
Technical IFROM TO ____I 11/15/94 I 2116. SUPPLEMENTARY NOTATION
Submitted to Journal of Magnetic Resonance
17. COSA71 CODES 18. SUBJECT TERMS (Continue on reverse if necessary and identify by block number)
FIELD GROUP SUB-GROUP
19. ABSTRACT (Continue on reverse if nccessary and identify by block number)
"5N CSA spectra were acquired for four isotopically labelled bisphthalimidecompounds. The "5N CSA tensor elements (86, 822, and 83) for the labeled derivativeswere determined from CSA lineshape analysis. In addition, the CSA spectrum for the 16N-`sC labelled N-methylphthalimide was obtained. From CSA lineshape analysis it wasdetermined that 833 lies approximately along the N-C bond axis, with 82 assumed to beapproximately perpendicular to the imide plane. The angles a and 0 were found to be900 and 7r, respectively. The dipolar coupling constant for '3C-l 5N bond was 883 Hz,corresponding to a bond length of 1.51 A.
DT1C'. Q.UALlIY IN2PECTED B
20. DISTRIBUTION/AVAILABILITY OF ABSTRACT 21. ABSTRACT SECURITY CLASSIFICATIONU] UNCLASSIFIED/UNLIMITED 1W SAME AS RPT. 0 DTIC USERS
22a. NAME OF RESPONSIBLE INDIVIDUAL 22b. TELEPHONE (Include Area Code) 22c. OFFICE SYMBOL
Lon J. Mathias 1 601-266-4871 1DD FORM 1473, 84 MAR 83 APR edition may be used until exhausted. SECURI TY CLASSIFICATION OF THIS PAGE
All other editions are obsolete.
94 11 '9

Model for Studying Polky mie
WIWAM L JARRETT, C. GREG JOHNSON, and LON J. MATHIAS7University of Southern MississippiDepartment of Polymer Science
Hattiesburg, Mississippi 39406-0076
Abstract
"N CSA spectra were acquired for four isotopically labelled bisphthailide
compounds. The IN CSA tensor elements (8,,, 8., and 8,) for the labeled derivatives
were determined from CSA lineshape analysis. In addition, the CSA spectrum for the rN-
IOC labelled N-methylphtharmide was obtained. From CSA Ilneshape analysis it was
determined that 8. lies approximately along the N-C bond axis, with 8,, assumed to be
approximately perpendicular to the knide plane. The angles a and ý were found to be
90°and 70, respectively. The dipolar coupling constant for 1 .,15N bond was 883 Hz,
corresponding to a bond length of 1.51
Aemesalon For
XTIS GRA&I 6/ -DTIC TABUhannonxed 0
ByBDistrj.but ionA -
Availability Odoes
JAvei afld/oz
4'3,t 586o
S94- 35861)L

Solid-State NMR Characterization of 3C- and "N-Labelled Phthalimiles:Model Compounds for Studying Polylmides
WILLIAM L JARRETT, C. GREG JOHNSON, and LON J. MATHIAS*University of Southern MississippiDepartment of Polymer Science
Hattiesburg, Mississippi 39406-0076
INTRODUCTION
High-resolution solution and solid-state NMR techniques have been used
for a number of years to characterize biological and polymeric systems. Until the
last 10-15 years, however, techniques which only observe the isotropic chemical
shift (8,) value were utilized, thereby ignoring the valuable information that may
be obtained from the 8 tensor, which is sensitive to the structural and chemical
environment of the observed site. Recently, with the advent of isotopic labelling
techniques, researchers have been able to determine the principle components of
the 8 tensor (8,,, &a, and &,) for a variety of ISC and 'lN labelled organic
compounds (1). In addition, the use of dipole-coupled solid-state NMR
spectroscopy to determine the orientation of the 83 tensor with respect to the
dipolar coupling axis has been used on peptides and polypeptides, (2)
nitrosobenzenes, (3) and oximes (4). In some instances the orientation of the
8 tensor element with respect to the local molecular structure has been determined
(2b-f,3,4). A two-dimensional variation of this technique has been used to study
the chain conformation of some oriented proteins (5). Although this particular
technique has been used for biological systems, its application to synthetic

2
polymers has been rare. In addition, little has appeared regarding the magnitude
and orientation of 8 .r for imides, a key component in polyimides a family of
generally semi-crystalline, heterocyclic polymers used extensively when excellent
physical properties and thermal stability are required.
Tensor evaluations of biological polymers are usually based on labelled
model compound studies; thus, a series of labeled model imide compounds based
on the phthalimide moeity (C6H4(CO)2N*-R with R = -H, -CH3, -C16H3, -CH2C6H5 )
have been synthesized and analyzed by solid-state IN1 NMR spectroscopy. In
addition, N-[' 3Cjmethyl-[I6N]phthalimide was synthesized and its solid-state 15N
NMR spectrum acquired in order to obtain information on the orientation of the 8
tensor with respect to the local molecular geometry, with the eventual purpose of
this study to apply this information to 16N-labelled polyimides.
EXPERIMENTAL
NMR Measurements
CP/MAS spectra: Solid-state CP/MAS NMR spectra were obtained on a
Bruker MSL-200 equipped with a Bruker MAS probe operating at 50.32 and 20.287
MHz for 130 and '6N, respectively. Powdered samples were placed in fused
zirconia rotors fitted with Kel-Fe caps and spun with dry air, with rotation rates of
4 to 5 kHz for carbon MAS and 2 to 3 kHz for nitrogen MAS. The IC3 spectra
were referenced to extemal adamantane (29.5 ppm), while "5N spectra were
referenced downfield from external glycine (0 ppm). The 'H 900 pulse was 4.5 tIs

3
for 13C acquisition and 6.0 gIs for '5N acquisition, while a mixing pulse of 2 ms and
a 50 ms acquisition period were used in acquiring spectra for each nuclei. A
recycle delay of 210 s, corresponding to -3-4 'H Tjs, was used for observation of
both nuclei.
Powder spectra: Solid-state '1 N chemical shift anisotropy (CSA) spectra
were acquired with the same probe used for CP/MAS work except that the
spinning rate was set to zero. For 15N powder spectra, a spin-echo sequence with
a tau delay of 200 tis was used to minimize artifacts due to pulse bleed-through.
In addition, a 900 flip-back pulse was implemented at the end of acquisition in
order to circumvent the long 'H Ts. The 1H 900 pulse width was -3.98-4.05 ps,
the acquistion time was 50 ms, and the recycle delay was 30 s. The cross-
polarization contact time was 5 ms. The number of scans acquired varied from
2560 - 3200, respectively. All chemical shift values are referenced to glycine (0
ppm).
CSA simulations: Chemical shift anisotropy (CSA) spectra were simulated
using the POWFIT program developed by Dr. T. G. Oas (6). Fits were done by
performing analyses on either the zeroth or first derviative of selected regions of
the experimental spectrum. In addition, the theoretical spectrum was convoluted
with Iorentzian and gaussian line broadening to reproduce the natural line
broadening present. All simulations were done on a MicroVax 3100.
Synthesis

7 " p ,-
4
All reagents were obtained from Aldrich Chemical Company and used
without purification. Dimethylformamide (DMF) was reagent grade and used as
received.
A typical procedure for the preparation of an N-substituted phthalimide is as
follows: A clean, dry flask was charged with equimolar amounts of ['6N] potassium
phthalimide and methyl iodide (for the N-methylphthalimide) followed by enough
N,N-dimethyfformamide (DMF) to give a mixture that was 15 - 20% solids by
weight. The flask was submerged in a preheated oil bath at -60 Or for 2 to 3
hours. The cooled reaction mixture was poured into rapidly stirring water (10 times
reaction volume). The precipitate was collected and recrystallized from aqueous
ethanol (70 to 85 % yield). For the doubly labelled N-[ 1'CJ-methyl-[1rN]-phthalimide
compound, the above procedure was followed except that '1C labelled methyl
iodide was used.
RESULTS AND DISCUSSION
A. MN-labelled model Imides CSA spectra: Figure 1 shows the CSA
spectra for the four model imides along with the spectral simulations used to
determine the values of 8,,, &. and 83 these values are summarized In Table
1. The calculated spectra fit well to the experimental data, with some variation
probably due to anisotropic T2 and cross-polarization effects.6 From Table 1 it Is
apparent that the major contributor to changes in the 8. are due to the B.
component. This is consistent with previous work by Shoji and coworkers which

5
showed that 8ý was quite sensitive to molecular composition and conformation (at
least in the case of polypeptides) (7).
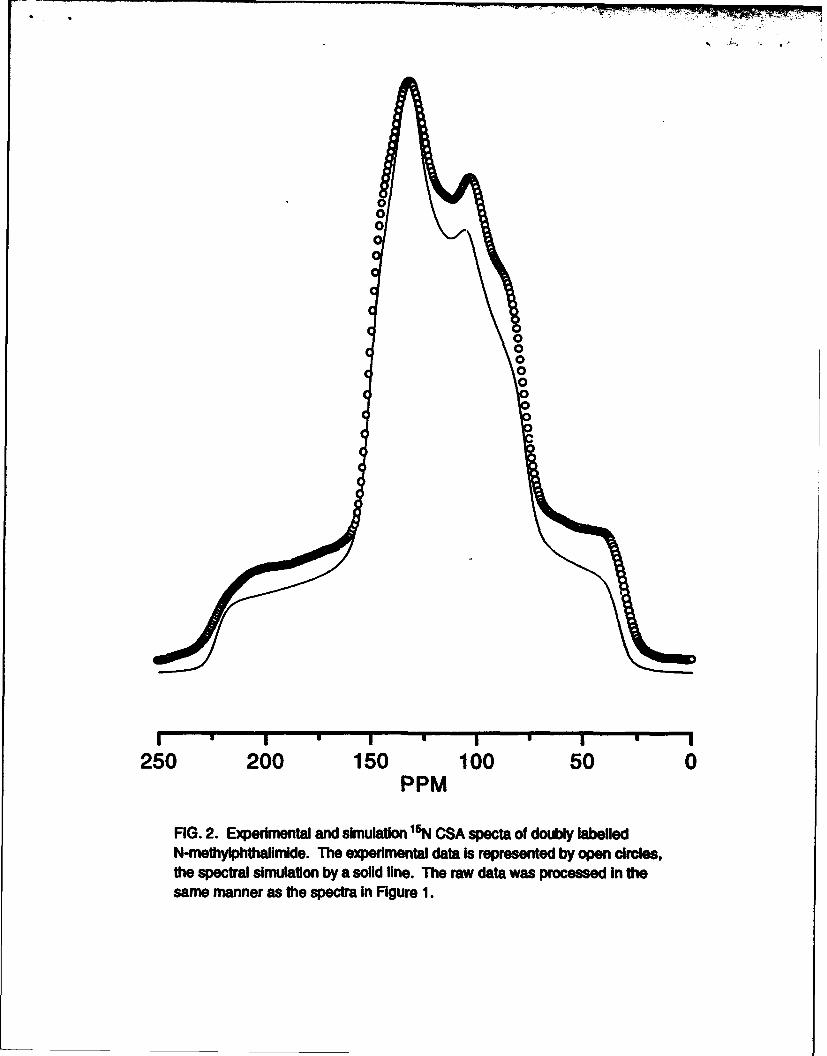
B. Doubly-labelled N-methylphthalimids: Figure 2 shows the experimental
and simulated CSA spectra for 'N-l`3 labelled N-methylphthalimide. The CSA
spectrum is modulated by both the magnitude of the 'N-3C dipolar coupling and
its orientation with respect to the 8 axis system. Table 2 gives the values of 8,
8,2, &0, a, 10, and the "'N-'3C dipolar coupling constant used for the simulation.
From the values of a and P3 the orientation of the N-CH3 bond vector with respect
to the 8 axis system was determined; this is shown in Figure 3. Note that the most
shielded tensor 8. lies approximately along the N-CH3 bond. From the magnitude
of the IN-'3C dipolar coupling constant, the length of the 1N-13C bond is caculated
to be 1.51 A.
C. Discussion: The invariance of the 63 tensor indicates that the N-R a
bond is fairly consitent for the various substituents. Instead, it would appear that
the change in substituents mainly effect the x electron density at the nitrogen site.
Such an explaination would explain the large variation in the 8. tensor, if it is
assumed that this tensor is approximately perpendicular to the imide plane. A
computational study investigating the nature of the bonding about the '6N site is
currently in progress in order to assign the complete orientation of the 8 axis
system with respect to the molecular axis system. Such assignments are beyond
the scope of the present paper.

6
SUMMARY
A procedure has been developed for incorporating 15N and 13C isotopic
labelling into N-substituted phthalimides, for use as model imides for studying
polyimides. From solid-state '5N NMR spectroscopic and computational methods,
the values of the 8 shift tensor for the model imides were determined. In addition,
for N-['1%-methyl-[16N]-phthalimide, the 8.3 tensor was found to lie approximately
along the N-CH3 bond axis, and the N-CH3 bond length was determined to be 1.51
A. Future work concerning the determination of the 8 tensor orientation with
respect to the molecular frame is in progress.
ACKNOWLEDGEMENTS
The authors would like to acknowledge the Office of Naval Research for
providing funds for the purchase of the MSL-200 spectrometer and for a grant
providing partial support of this research and Dr. Terry Oas for providing the
POWFIT program.

7
Table 1. "5N Chemical Shift Data for 16N Labelled Model Imides.a
Compound 8&...M 4, *8n = 11'
Phthalimide 121.5 121 165 136 62 0.492
N-methylphthalimide 119.8 119 177 125 55 0.813
N-stearylphthalimide 128.9 128 172 157 55 0.274
N-benzylphthalimide 134.2 135 179 165 60 0.189
a All data reported in ppm and referenced to glycine (8o--=0.0 ppm).
b Based on '5N CP/MAS spectral analysis.
0 Determined by 1/3(81, + 822+ 83).
Table 2. 15N Chemical Shift Parameters for N-[l3C]-methyl[lsN]-phthalimide.a
811 8 8 a 0 D
179 125 55 90 7 893
* All values for the chemical shift tensor are in ppm. The values of at and P are
referenced with respect to the N-CH3 bond axis. The value of the dipolar coupling
constant D is in hertz.

8
REFERENCES
1. For a compilation of '3C and "5N 8 tensor elements, see T. M. DUNCAN, 'A
Compilation of Chemical Shift Anisotropies," Farragut Press, Chicago, 1990,
pp C1-N9.
2. (a) G. S. HARBISON, L.W. JELINSKI, R. E. STARK, D. A. TORCHIA, J.
HERZFELD, R. G. GRIFFIN, J. Magn. Reson. 60,79 (1984); (b)T. G. OAS,
C. J. HARTZELL,T. J. MCMAHON, G. P. DROBNY, F. W. DAHLQUIST, J.
Am. Chem. Soc. 109, 5956 (1987); (c)T. G. OAS, C. J. HARTZTELL, F. W.
DAHLQUIST, G. P. DROBNY, J. Am. Chem. Soc. 109, 5962 (1987); (d) C.
J. HARTZELL, M. WHITFIELD, T. G. OAS, G. P. DROBNY, J. Am. Chem.
Soc. 109, 5966 (1987); (e) Q. TENG, T. A. CROSS, J. Magn. Reson. 85,
439 (1989); (,q F. SEPAROVIC, R. SMITH, C. S. YANNONI, B. A.
CORNELL, J. Am. Chem. Soc. 112, 8324 (1990).
3. M. D. LUMSDEN, G. WU, R. E. WASYLISHEN, R. D. CURTIS, J. Am.
Chem. Soc. 115, 2825 (1993).
4. R. E. WASYLISHEN, G. H. PENNER, W. P. POWER, R. D. CURTIS, J.
Am. Chem. Soc., 111, 6082 (1989).
5. (a) T. A. CROSS, S. J. OPELLA, J. Mol. Biol. 182, 367 (1985); (b) 0.
9
TENG, L K. NICHOLSON, T. A. CROSS, J. Mol. Biol. 218,607 (1991); (c)
L. K. NICHOLSON, 0. TENG, T. A. CROSS, J. Mol. Biol. 218, 612 (1991).
6. T. G.OAS, G. P. DROBNY, F. W. DAHLQUIST, J. Magn. Reson. 78, 408
(1988).
7. (a) A. SHOJI, T. OZAKI, T. FUJITO, K DEGUCHI, S. ANDO, I. ANDO,
Macromolecules 22, 2863 (1989); (b) A. SHOJI, T. OZAKI, T. FUJITO, K
DEGUCHI, S. ANDO, I. ANDO, J. Am. Chem. Soc. 112, 4693, (1990).

FIG. 1. '6N CSA spectra of a) phthalimide, b) N-methylphthalimide,
c) N-stearylimide, and d) N-benzylphthalimide. All spectra were apodized
using a Kaiser digital filter (a = 4, N = 3-5 ms) and zero-filled to 8092 data
points before Fourier transformation. Experimental data is represented
by open circles, spectral simulation by a solid line.
FIG. 2. Experimental and simulation '5N CSA spectra of doubly labelled
N-methylphthalimide. The experimental data is represented by open circles,
the spectral simulation by a solid line. The raw data was processed in the
same manner as the spectra in FIG. 1.
FIG. 3. Orientatioi of the N-CH3 bond with respect to the 8 axis system.

I~ I
250 200 150 100 50 0PPM
FIG. 1. 15N CSA spectra of a) phthalimide, b) N-rnethylphthalimide,c) N-stearyllmide, and d) N-benzylphthalimide. All spectra were apodizedusing a Kaiser digital filter (a = 4, N = 3-5 ms) and zero-filled to 8092 datapoints before Fourier transformation. Experimental data is representedby open circles, spectral simulation by a solid line.
q O00
000000
250 200 150 100 50 0PPM
FIG. 2. Experimental and simulation 15N CSA specta of doubly labelledN-methylphthalimlde. The experimental data Is represented by open circles,the spectral simulation by a solid line. The raw data was processed in thesame manner as the spectra In Figure 1.

4.o
oCr,.. "0
"0
4.'