955c389b-9028-4a49-a320-9705efdce83e · pdf filetrinidad & tobago st. kitts & nevis...
TRANSCRIPT


2
This Energy Dossier is part of a series of publications produced by the Energy Division of the Infrastructure and Environment Department of the Inter-American Development Bank. It is designed to increase the knowledge base about the composition and organization of the energy sector of Latin American and Caribbean countries. Each dossier describes the energy matrix of the country under analysis and then dives deeply into the institutional organization and regulatory framework of the energy sector in that country. This series is an important contribution to the understanding of the energy sector of the Eastern Caribbean countries, as many projects providing comparable information have been carried out in this part of the hemisphere.
Keywords: Energy; electricity; energy matrix; Caribbean; Eastern Caribbean
JEL Codes: Q40, Q43, Q48
Acknowledgment: The authors wish to thank Camila González, Carlos Sucre, Shohei Tada, María Jimena Córdoba, Scarlett Santana, and Valeria Terán who provided insight and expertise that greatly assisted the research for this paper.
Abstract

3
Acronyms
Country Overview
The Energy Matrix
Institutional Organization of the Energy Sector
Historical Development of the Energy Sector
Methodology
References
4
5
18
27
40
42
43
Index

4
Boe/dayCR&WCNGEAPECERAESAGDPGWhIPPIRENAKboe/dayMWNEPPVSOLVINLEC
Barrels of oil equivalent per dayCombustible renewables and wasteCompressed natural gasEnergy Action PlanEastern Caribbean Energy Regulatory AuthorityElectricity Supply ActGross domestic productGigawatt hourIndependent power producerInternational Renewable Energy AgencyThousand barrels of petroleum equivalent per dayMegawattNational Energy PolicyPhotovoltaicSimpson Oil LimitedSaint Vincent Electricity Services Limited
Acronyms

5
Saint Vincent and the Grenadines is a multi-island state comprising the main island of Saint Vincent as well as seven smaller inhabited islands and about 30 uninhabited islets constituting the Grenadines. The country is located north of Grenada, west of Barbados, and south of Saint Lucia. The islands are home to a population of 109,737 people and cover a land area of 389 square kilometers. About 25,000 people live in the country’s capital of Kingstown (World Bank, 2014).
Saint Vincent and the Grenadines has a high level of development, with a score of 0.719 ranking 91st out of 187 countries on the 2013 Human Development Index (UNDP, 2014). In 2013, it recorded a national gross domestic product (GDP) of US$709m, and its per capita GDP stood at US$6,461 (IMF, 2015).
In contrast to the economies of most its Caribbean neighbors, which are disproportionately service oriented and dominated by the tourism and financial sectors, Saint Vincent’s agriculture sector, primarily banana production, is the most important contri-butor to the national economy. However, the service sector’s importance has been increasing, especially due to the growing tourism industry, but remains underdeveloped compared to that of other countries in the Eastern Caribbean.
Like many island states, Saint Vincent is highly reliant on imported fossil fuels to meet its energy needs. However, due to deve-loped hydropower capacity, its oil import costs have historically remained below the Eastern Caribbean average. In 2008, when oil import costs as a share of GDP in the Eastern Caribbean peaked at 10.9 percent, Saint Vincent’s share peaked at 7.8 percent. However, after declining in 2010 and 2011, the country’s import costs as share of GDP increased again and stood at 8.8 percent, slightly above the Eastern Caribbean average of 8.2 percent in 2013.
Like many small island states, Saint Lucia is highly reliant on imported fossil fuels to meet its energy needs. Its oil import costs have historically remained in line with the Eastern Caribbean average. Saint Lucia spent 10.2 percent of its GDP on oil imports
Country Overview: Saint Vincent and the Grenadines
Saint Vincent and the Grenadines
Source: Author’s elaboration.
Map 1
The Bahamas
Cuba
Haiti
Trinidad & Tobago
St. Kitts & Nevis Dominica
Antigua & Barbuda
St. Vincent & the GrenadinesSt. Lucia
BarbadosGrenada
GuyanaSuriname
JamaicaBelize

6
Saint Vincent and the Grenadines’ production of primary energy is limited to 42 barrels of oil equivalent per day (boe/day) from hydropower and 31.5 boe/day from combustible renewables and waste (CR&W). The vast ma-jority of energy, around 95 percent, is imported in the form of oil products. The island nation imports 1500 boe/day. About a third of these oil products (503 boe/day) is used to generate electricity, supplemented by 42 boe/day of electricity from hydropower. Losses during generation, distribution, and transmission total 331 boe/day, leaving 214 boe/day of electricity for final consumption.
In total, final consumption of Saint Vincent and the Grenadines is 1,201 boe/day, of which 955 boe/day are oil products, 214 boe/day are consumed in the form of electricity, and 31.5 boe/day are in the form of CR&W.
Consumption by sector is as follows: the transportation sector consumes over 67 percent of energy with 804 boe/day, followed by the residential sector with 214 boe/day representing 18 percent, the commercial sector with 154 boe/day equal to 13 percent, the industrial sector with 20 boe/day, and other at 9 boe/day.
in 2008. This share has since fallen to around 6 percent. Saint Lucia is forecasted to spend slightly less on energy imports as a share of GDP than the Eastern Caribbean average over the next few years (IMF, 2013b). According to figures by the National Renewable Energy Laboratory (NREL), Saint Lucia spends 6.75 percent of GDP on fuel imports related to electricity and 16.45 percent on overall fuel imports (NREL, 2015).
The Energy Matrix of Saint Vincent and the Grenadines
0
2
4
6
8
10
12
19992000
20012002
20032004
20052006
20072008
20092010
20112012
20132014
20152016
20172018
perc
ent
Source: IMF (2013).
St. Vincent and the Grenadines Eastern Caribbean Average
Oil Import Costs as Share of GDPFigure 1

7
Saint Vincent and the Grenadines receives more than 95 percent of its overall energy through imported oil pro-ducts, with the remaining 5 percent coming from hydropower and combustible renewables and waste (CR&W).
The total energy supply in Saint Vincent and the Grenadines was 1573.5 barrels of petroleum equivalent per day (boe/day) in 2012. Imported oil products accounted for 1500 boe/day and made up 95.5 percent of total energy supply. Hydropower accounted for 42 boe/day, representing 2.5 percent of total energy supply, and CR&W ac-counted for 31.5 boe/day representing 2 percent.
Total Energy Supply
Source: Calculations based on data from EIA, IRENA, the Government of Saint Vincent and the Grenadines, and VINLEC.
Inter-American Development Bank, 2015Infraestructure & Enviroment / Energy
Editor: Ramón Espinasa (INE/ENE)Authors: Malte Humpert
Saint Vincent and the Grenadines, 2012Figure 2
Total Production(73.5)
CR&W (32)
Hydro (42)
Electricity
Transport(804)
Residential(214)
Commercial (154)
Other (9)
Industry(20)
Production& importsprimaryenergy
Importssecondaryenergy Transformation
Finalconsumptionby source
Finalconsumptionby sector*
Exportsprimaryenergy
Total supplyprimaryenergy
(boe/day)
Elec
tric
ity in
put (
545)
Heat, Waste& Losses
(331)
Total Supply(73.5)
OilProducts(1,500)
502.8 214
32
32
42
42
955
SectorConsumption
(1,201)
FinalConsumption
(1,201)

8
Total Oil Product Imports Figure 3
boe/
day
Motor Gasoline Distillate Fuel oils Kerosene LPG Other
0
200
400
600
800
1000
1200
140
1600
2001 2002 2003 2004 2005 2006 2007 2008 2009 2010 2011 2012
The total cost of imported oil products has increased significantly over the past two decades. Import costs hovered around EC$20 million during the 1990s and increased steadily to around EC$50 million by 2005. Between 2005 and 2006, import costs more than doubled to around EC$125 million and have since stayed above EC$120 million (Government of Saint Vincent and the Grenadines, 2010).

9
Cost of Imported Oil Products, 1993–2009Figure 4m
illio
n EC
$
0
20
40
60
80
100
120
140
160
199819971996199519941993 1999 2000 2001 2002 2003 2004 2005 2006 2007 2008 2009
Source: Government of Saint Vincent and the Grenadines (2010).
Like all Eastern Caribbean countries, Saint Vincent and the Grenadines is characterized by a high depen-dence on imported fossil fuels to meet its energy de-mand. Saint Vincent and the Grenadines, however, is a notable exception in the Eastern Caribbean, together with Dominica, as geography has allowed it to use hy-dropower to some extent on the main island of Saint Vincent since the middle of the twentieth century. All other islands depend entirely on diesel generation for their electricity supply (Government of Saint Vincent and the Grenadines, 2000).
According to government estimates, in addition to the 5.6MW of installed hydropower capacity, Saint Vin-cent may have unused hydropower potential in the range of 5–10MW along the Wallilabou and Bucament Rivers (Government of Saint Vincent and the Grena-dines, 2009). It has significant geothermal resources, with estimates ranging from 100MW to 890MW, some of which are currently being developed by the gover-nment (Caribbean 360, 2014; OAS, 2010). It also has excellent solar potential in the low-lying parts of Saint Vincent and the Grenadines and good wind resources on the western side of Saint Vincent and Bequia as well as all the small islands.
Domestic Production

10
Share of Total Energy Supply, 2012Figure 5
Source: EIA (2012); IRENA (2012).
Hydro3%
CR&W2%
Oil Products95%
Saint Vincent and the Grenadines did not import any primary energy in 2012.
The primary energy supply of Saint Vincent and the Grenadines was 73.5 boe/day in 2012.
Commercial Balance of Primary Energy
Domestic Primary Energy Supply

11
Installed Capacity
Saint Vincent Electricity Services Limited (VINLEC) is the sole provider of utility-scale electricity on Saint Vincent and four of the Grenadines: Bequia, Union island, Canouan, and Mayreau. Other islands of the Grenadines produce electricity for self-consumption, including the private hotel islands of Palm and Musti-que. The vast majority of the VINLEC’s generation ca-pacity, 44.7MW out of a total of 53.7MW, is installed on the island on Saint Vincent.
The various island grids are not interconnected. In 2012, VINLEC’s generation capacity stood at 53.7MW, of which about 88 percent came in the form of thermal generation and around 11 percent (5.6MW) in the form of hydropower. As VINLEC continues to add thermal
generation to its capacity, the share of hydropower continues to decrease. In 2011, hydropower provided only 11 percent of installed capacity, compared to 20 percent in 1999.
In addition, VINLEC operates a 177kW photovoltaic (PV) capacity on Saint Vincent and 70kW PV capa-city on Bequia. Another 0.4MW of privately insta-lled PV capacity exists throughout the country. An additional 174.4kW of PV capacity will be installed at the country’s new international airport following a US$750,000 loan from the CARICOM Development Fund (CARICOM, 2015). As of mid-2015, total installed solar PV capacity in Saint Vincent and the Grenadines stood at around 0.7MW.
Electricity
VINLEC Share of Installed Capacity, 2014Figure 6
Source: GEF (2014); VINLEC (2014a).
Hydro11%
Solar1%
Thermal88%

12
Power stations Capacity
Cane Hall
Lowmans Bay
Cumberland
Richmond
South Rivers
VINLEC PV
Private PV
21.66 MW
17.4MW
3.664MW
1.1MW
0.87MW
0.177MW
0.5MW
Year installed
Oldest Unit: 1973Newest Unit: 2001
2011
1987/1988
1962
1952
2013
Type
Diesel
Diesel and heavyfuel oil
Hydro
Hydro
Hydro
PV
PV
Details
Allen: 1.126MW, 1.262MWCaterpillar:4x1.28MW, 1.47MW, 3.78MW
Cummins: 0.6MWWärtsilä: 3.243MW, 3.25MW, 4.2MW
4x Man: 4.35MW
5x Neypric Francis Turbine:2x460kW, 2x640kW, 1.464MW
2x Gilkes Turgo: 550kW
3x Gilkes Turgo: 2x275kW, 320kW
-
-
Source: GEF (2014); Samuel (2013); VINLEC (2010b; 2014a; 2015a).
Inventory of Saint Vincent Power Stations, 2014Table 1
IslandPower stations
Capacity
Bequia
Union Island
Canouan
Mayreau
4.145MW
70kW
1.32MW
3.12MW
0.18MW
Year installed
1968
1974
1994
2003
Type
Diesel
PV
Diesel
Diesel
Diesel
Details
Caterpillar: 2x550kW, 640kW, 7575kW, 1.28MWCummins: 350kW
Caterpillar: 150kW, 200kW, 220kW, 350kW, 400kW
Caterpillar: 200kW, 220kWWärtsilä: 2x1.2MW
Perkins: 3x60kW
Source: VINLEC (2014a; 2014b).
Inventory of Grenadines Power Stations, 2014Table 2
Between 1998 and 2012, VINLEC’s generation capacity increased by 102 percent from 26.5MW to 53.7MW, repre-senting an annual growth rate of around 5.2 percent.

13
In 2012, Saint Vincent had an installed capacity of 44.7MW. Due to seasonally varying rainfall and fluctuating wa-ter levels, the generation capacity of the flow-of-the-river hydropower plants varies throughout the year. During the dry season, availability of hydropower decreases by up to 50 percent or more.
Electricity on Saint Vincent is provided by five separate power plants. The oldest plant is the hydropower faci-lity at South Rivers, which began operation in 1952 and provides 0.87MW of capacity coming from three Gilkes Turgo turbines with 275kW (2x) and 320kW capacity.
A second hydropower plant was added at Richmond in 1962. It provides 1.1MW of capacity coming from two Gilkes Turgo turbines with 550kW capacity each. The Cane Hall Power Station, the first thermal power plant, began operation in 1976 and has since been continually expanded. The latest unit was added in 2001. It operates twelve diesel generators with a total capacity of around 21.66MW.
In 1987, a third hydropower plant was built at Cumberland and subsequently expanded in 1988, adding 3.664MW of capacity provided by five Neyrpic Fancis Turbines with 465kW, 640kW and 1.464MW capacity, respectively. In addition to the already exploited hydropower capacity, the country has significant potential for renewable energy technologies such as solar PV, wind power, biomass, and geothermal. While studies of the island’s re-maining hydro potential have been conducted, no concrete steps to build additional plants have been taken (VINLEC, 2014b).
To meet Saint Vincent’s rapidly growing demand, a new thermal power plant was built at Lowman Bay in 2006, which provides 17.4MW of capacity coming from four MAN generators with 4.35MW capacity each. These units currently run on diesel fuel but can also operate on HFO (Knopp, 2012; VINLEC, 2010b).
Installed Capacity, 1998–2012Figure 7
MW
Peak Demand Firm Capacity Installed Capacity
Source: EIA (2012); GEF (2014); Myers (2012); VINLEC (2004; 2005; 2006; 2008; 2009; 2010b; 2014a).
0
10
20
30
40
50
60
1998 1999 2000 2001 2002 2003 2004 2005 2006 2007 2008 2009 2010 2011 2012

14
The Grenadines had a combined capacity of 8.842MW, with 4.145MW on Bequia, 1.32MW on Union Island, 3.12MW on Canouan, and 0.18MW on Mayreau. All utility-scale generation capacity on the Grenadines is thermal.
Installed capacity on the Grenadines comes from four power plants, one each on Bequia, Union Island, Canouan, and Mayreau. The Bequia Power Station was commissioned in 1968, followed by Union Island in 1974. The Ca-nouan Power Plant was commissioned in 1994, and Mayreau began operation in 2002.
Saint Vincent Installed and Firm Capacity and Peak Demand, 1999–2012Figure 8
MW
Peak Demand Firm Capacity Installed Capacity
0
5
10
15
20
25
30
35
40
45
50
1999 2000 2001 2002 2003 2004 2005 2006 2007 2008 2009 2010 2011 2012
Source: Castalia (2015); EIA (2012); GEF (2014); Myers (2012); VINLEC (2004; 2005; 2006; 2008; 2009; 2010b; 2014a).
Bequia Installed Capacity, 1998–2012Figure 9
MW
Peak Demand Firm Capacity Installed Capacity
Source: VINLEC (2004; 2005; 2006; 2008; 2009; 2010b; 2014a).
1998 1999 2000 2001 2002 2003 2004 2005 2006 2007 2008 2009 2010 2011 2012
0
0.5
1.0
1.5
2.0
2.5
3.0
3.5
4.0
4.5
5.0

15
Union Island Installed Capacity, 1998–2012Figure 10
MW
Peak Demand Firm Capacity Installed Capacity
Source: VINLEC (2004; 2005; 2006; 2008; 2009; 2010b; 2014a).
1998 1999 2000 2001 2002 2003 2004 2005 2006 2007 2008 2009 2010 2011 2012
0
0.2
0.4
0.6
0.8
1.0
1.2
1.4
1.6
Canouan Installed Capacity, 1998–2012Figure 11
MW
Peak Demand Firm Capacity Installed Capacity
Source: VINLEC (2004; 2005; 2006; 2008; 2009; 2010b; 2014a).
1998 1999 2000 2001 2002 2003 2004 2005 2006 2007 2008 2009 2010 2011 2012
0
0.5
1.0
1.5
2.0
2.5
3.0
3.5
4.0
4.5
5.0

16
Mayreau Installed Capacity, 1998–2012Figure 12
MW
Peak Demand Firm Capacity Installed Capacity
Source: VINLEC (2004; 2005; 2006; 2008; 2009; 2010b; 2014a).
1998 1999 2000 2001 2002 2003 2004 2005 2006 2007 2008 2009 2010 2011 2012
0
0.02
0.04
0.06
0.08
0.10
0.12
0.14
0.16
0.18
0.20
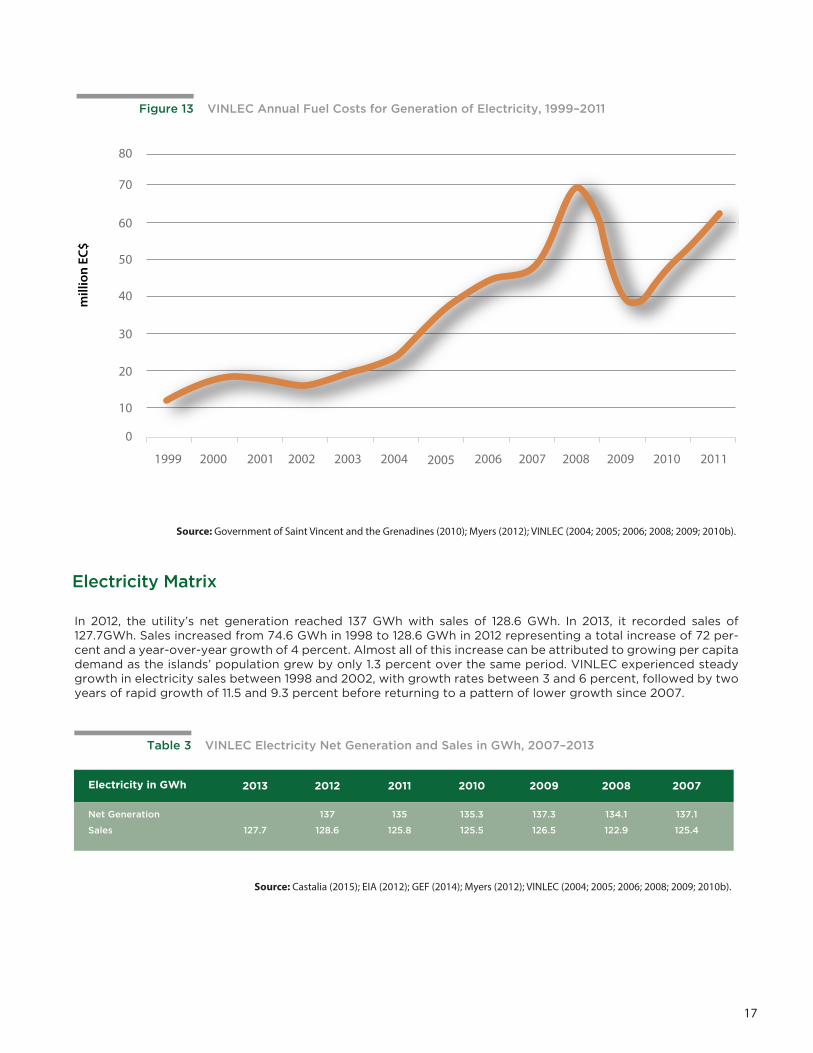
Of the 545 boe/day intended for electricity genera-tion in 2012, 42 boe/day came from hydropower and 503 boe/day came from diesel and heavy fuel oil. VINLEC’s annual fuel costs, the majority of which are recovered from consumers through a fuel surcharge, have increased dramatically between 1999 and 2010.
While the company spent around EC$15 million a year in 1999–2003, costs rose to approximately EC$25 million in 2004, EC$44 million in 2006, and peaked at around EC$69 million in 2008. Cost decreased to around EC$40 million in 2009 before climbing again to EC$50 million in 2010 and EC$62 million in 2011.
Input to Electricity Generation
17
In 2012, the utility’s net generation reached 137 GWh with sales of 128.6 GWh. In 2013, it recorded sales of 127.7GWh. Sales increased from 74.6 GWh in 1998 to 128.6 GWh in 2012 representing a total increase of 72 per-cent and a year-over-year growth of 4 percent. Almost all of this increase can be attributed to growing per capita demand as the islands’ population grew by only 1.3 percent over the same period. VINLEC experienced steady growth in electricity sales between 1998 and 2002, with growth rates between 3 and 6 percent, followed by two years of rapid growth of 11.5 and 9.3 percent before returning to a pattern of lower growth since 2007.
VINLEC Annual Fuel Costs for Generation of Electricity, 1999–2011Figure 13
mill
ion
EC$
Source: Government of Saint Vincent and the Grenadines (2010); Myers (2012); VINLEC (2004; 2005; 2006; 2008; 2009; 2010b).
1999 2000 2001 2002 2003 2004 2005 2006 2007 2008 2009 2010 2011
0
10
20
30
40
50
60
70
80
Electricity Matrix
Electricity in GWh
Net Generation
Sales
2013
127.7
2012
137
128.6
2011
135
125.8
2010
135.3
125.5
2009
137.3
126.5
2008
134.1
122.9
2007
137.1
125.4
Source: Castalia (2015); EIA (2012); GEF (2014); Myers (2012); VINLEC (2004; 2005; 2006; 2008; 2009; 2010b).
VINLEC Electricity Net Generation and Sales in GWh, 2007–2013Table 3

18
The amount of electricity that VINLEC generates from its hydropower plants can fluctuate by up to 50 per-cent year-over-year depending on rainfall amount. In
1999, VINLEC recorded a low of 17.4GWh generated from its hydropower plants. This contrasts with a high of 30.9 GWh in 2011.
VINLEC Electricity Generation and Sales in GWh, 1998–2012Figure 14
GW
h
Sales Net GenerationSource: Castalia (2015); EIA (2012); GEF (2014); Myers (2012); VINLEC (2004; 2005; 2006; 2008; 2009; 2010b).
1998 1999 2000 2001 2002 2003 2004 2005 2006 2007 2008 2009 2010 2011 2012 2013
0
20
40
60
80
100
120
140
160
Electricity Gross Generation Hydro vs. Diesel, 1998–2012Figure 15
MW
Diesel Hydro
Source: EIA (2012); VINLEC (2004; 2005; 2006; 2008; 2009; 2010b).
1998 1999 2000 2001 2002 2003 2004 2005 2006 2007 2008 2009 2010 2011 2012
0
20
40
60
80
100
120
140

19
In 2013, VINLEC’s electricity sales by sector were as fo-llows: the residential sector accounted for 60.5 GWh, representing 47 percent of all sales; the commercial sector consumed 57.6GWh, signifying 45 percent of
sales; and the industrial sector and street lighting re-presented five and three percent, respectively, with sales of 6.5GWh and 3.2GWh.
VINLEC Electricity Consumption by Sector, 2013Figure 17
Source: Castalia (2015).
Industrial5%
Domestic47%
Street lighting3%
Commercial45%
Share of Electricity Gross Generation Hydro vs. Diesel, 1998–2012Figure 16
0%
10%
20%
30%
40%
50%
60%
70%
80%
90%
100%
19981999
20002001
20022003
20042005
20062007
20082009
20102011
2012
Diesel Hydro
Source: EIA (2012); VINLEC (2004; 2005; 2006; 2008; 2009; 2010b).
As the utility company has expanded its thermal generation capacity, the importance of hydropower has decrea-sed steadily. While it represented 26 percent of all generated electricity in 2000, it only represented 17 percent in 2012. Even during a year with record generation of 30.9 GWh in 2011, hydropower accounted for only 22 percent of generation.

20
VINLEC Electricity Sales by Sector, 1998–2011Figure 18
GW
h
Source: GEF (2014); Myers (2012); Samuel (2013); VINLEC (2004; 2005; 2006; 2008; 2009; 2010b).
1998 1999 2000 2001 2002 2003 2004 2005 2006 2007 2008 2009 2010 2011 2012 2013
0
10
20
30
40
50
60
70
Residential Commercial Industrial Street Lighting
Between 1998 and 2013, the importance of the commercial sector (mainly hotels) as an electricity consumer steadily increased, surpassing the residential sector as the largest consumer in 2007. Following negative GDP growth between 2009 and 2011, commercial consumption decreased and has remained below residential con-sumption since 2010. Commercial consumption grew from 30.7GWh in 1998 to 57.6 GWh in 2013. Over the same period, residential consumption increased from 35.5GWh to 60.5GWh.
Commercial consumption as a share of total consumption increased from 41 percent in 1998 to 47.4 percent in 2008, be-fore declining to 45.1 in 2013. Over the same period, residential consumption held roughly steady at around 48 percent of overall usage. Industrial consumption decreased from 8.4 to 5.1 percent.

21
Share of VINLEC Electricity Sales by Sector, 1998–2012Figure 19
Residential Commercial Industrial Street Lighting
0%
10%
20%
30%
40%
50%
60%
70%
80%
90%
100%
19981999
20002001
20022003
20042005
20062007
20082009
20102011
20122013
Source: GEF (2014); Myers (2012); Samuel (2013); VINLEC (2004; 2005; 2006; 2008; 2009; 2010b).
Based on 2010 forecasts, the currently installed genera-ting capacity is projected to meet demand until 2017, at which point VINLEC will need to add new capacity (Cas-talia Consulting, 2012). However, based on relatively flat
growth between 2007 and 2012 with sales increases of just 2.5 percent, demand forecasts may prove to be too aggressive.
Projected needed capacity
Projected peak demand
2015
53
39
2017
61
45
2019
70
51
2021
80
59
2023
91
67
2025
104
77
2027
119
89
Source: World Bank (2010).
Projected Capacity Needs and Peak Demand in MWTable 4

22
Saint Vincent and the Grenadines’ Projected Capacity Requirement and Peak Demand in MW
Figure 20
MW
1998
1999
2000
2002
2004
2006
2008
2010
2012
2014
2016
2018
2020
2022
2024
2026
2001
2003
2005
2007
2009
2011
2013
2015
2017
2019
2021
2023
2025
2027
2028
0
20
40
60
80
100
120
140
Peak Demand Installed CapacityProjected Peak Demand Projected Required Capacity
Source: World Bank (2010).
In Saint Vincent and the Grenadines, the full range of renewable resources is available. Besides Dominica, it is the only country that already makes use of and has additional hydropower potential.
Saint Vincent and the Grenadines is in the early stages of exploring its geothermal potential. It has not yet drilled slim-hole wells, but plans to have a functioning geothermal plan by 2018. To develop this resource, the country has partnered with Emera and Reykjavik Geothermal. Surface exploration was completed in July 2015. The resul-ting studies suggest potential of up to 300MW of geothermal power to carry out surface exploration. The results of the surface exploration studies suggest the existence of 300MW of potential. Project developers will forego slim-hole drilling and move directly to exploratory drilling. The Abu Dhabi Fund for Development provided a US$15 million loan to finance the opening of a geothermal plant, and negotiations to finalize the business plan involving private sector partners are expected in August 2015 (Castalia, 2015).
Solar (PV and hot water)Geothermal Energy Efficiency Waste to Energy Wind Hydro
Source: Castalia (2015).
Resource AvailabilityTable 4

23
Saint Vincent and the Grenadines’ Projected Net Generation Figure 21
GM
h
1998
1999
2000
2002
2004
2006
2008
2010
2012
2014
2016
2018
2020
2022
2024
2026
2001
2003
2005
2007
2009
2011
2013
2015
2017
2019
2021
2023
2025
2027
2028
0
100
200
300
400
500
600
Net Generation Projected Net Generation
Source: World Bank (2010).
Source: World Bank (2010).
Projected capacity needs
2015
232.8
2017
266.1
2019
304.1
2021
347.6
2023
397.3
2025
454.1
2027
519
Projected Net Generation (in GWh)Table 5
Generation Forecast
Based on forecasts from 2010, Saint Vincent and the Grenadines net generation was projected to increase at a rate of 6.9 percent per year between 2009 and 2028. Due to relatively flat generation growth between 2007 and 2012, this forecast is probably too high. VINLEC’s net generation stood at around 137GWh in 2012 compared to a projected generation of 232.8GWh just three years later.
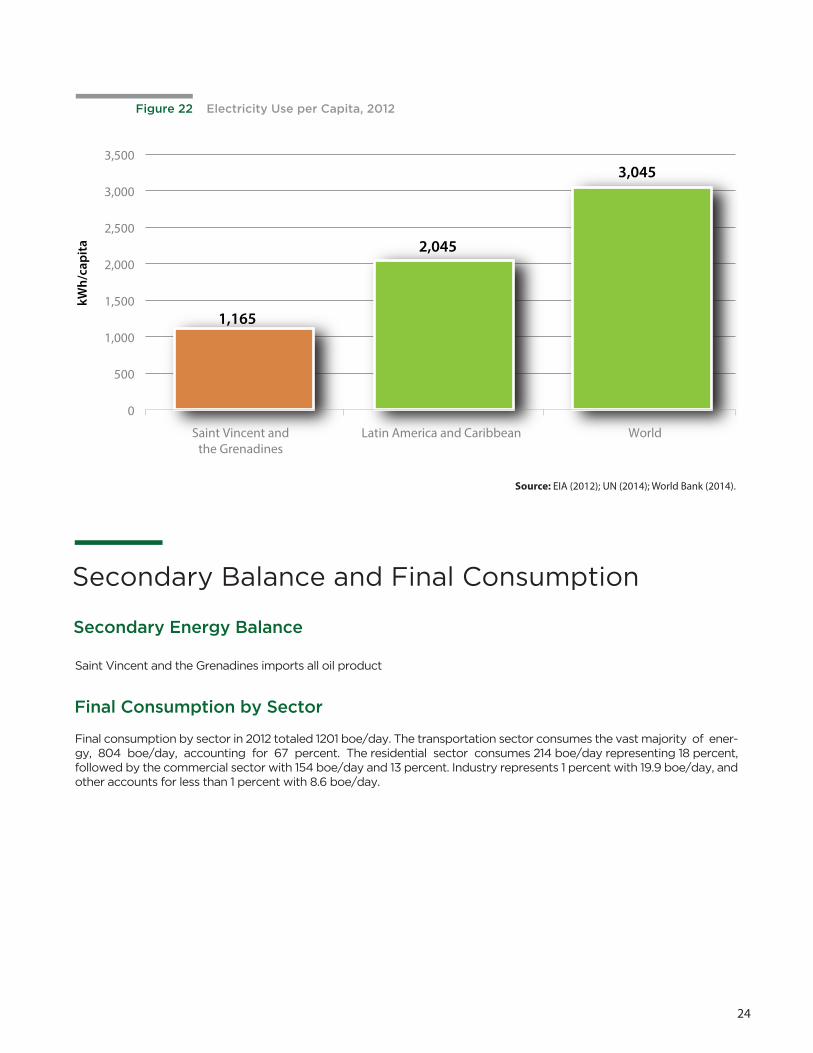
In 2012, per capita consumption in Saint Vincent and the Grenadines stood at 1165 kWh, just over half of the Latin American and Caribbean average. The country records the lowest per capita consumption of the six Eas-tern Caribbean countries and consumed around 50 percent less than the Eastern Caribbean average of 1764kWh/capita.
24
Final Consumption by Sector
Final consumption by sector in 2012 totaled 1201 boe/day. The transportation sector consumes the vast majority of ener-gy, 804 boe/day, accounting for 67 percent. The residential sector consumes 214 boe/day representing 18 percent, followed by the commercial sector with 154 boe/day and 13 percent. Industry represents 1 percent with 19.9 boe/day, and other accounts for less than 1 percent with 8.6 boe/day.
Saint Vincent and the Grenadines imports all oil product
kWh/
capi
ta
1,165
2,045
3,045
0
500
1,000
1,500
2,000
2,500
3,000
3,500
Saint Vincent andthe Grenadines
Latin America and Caribbean World
Source: EIA (2012); UN (2014); World Bank (2014).
Electricity Use per Capita, 2012Figure 22
Secondary Energy Balance
Secondary Balance and Final Consumption

25
Current Institutional Structure
As in all Caribbean countries, the growing penetration of motor vehicles over the past two decades has led to increased consumption by the transportation sector. Due to the small per capita consumption of electricity, less than a half of that of Saint Lucia, the trans-portation sector dominates overall consumption far more than in other Eastern Caribbean countries. Over the past decade the transportation sector of Saint
The Prime Minister’s Office took over the portfolio of the Ministry of Energy in 2006 and has overall control over the energy sector. In 2008, an Energy Unit was created within the Prime Minister’s Office to assist with formulation and implementation of energy policy and coordinate efforts related to renewa-ble energy and energy efficiency. The Energy Unit was responsible for the drafting of the 2009 Natio-nal Energy Policy (NEP) and the 2010 Action Plan. It was also tasked with supervising the implementation of the Geothermal Exploration and Exploitation Agre-ement of 2010. The National Energy Committee, es-tablished in 2006 on initiative of the Prime Minister, serves as an advisory body comprising stakeholders from relevant ministries and representatives from state-dependent institutions. The Physical Planning
Vincent and the Grenadines has recorded annual import rates of 1300–1600 vehicles. As of 2008, the total vehicle count stood at 25,382. With the cons-truction of a new international airport and the asso-ciated increase in air travel, the transportation sector can be expected to continue to grow in importan-ce as the largest consumer of energy (Government of Saint Vincent and the Grenadines, 2010).
Unit within the Ministry of Housing, Informal Hu-man Settlements, Lands, and Surveys and Physical Planning is responsible for the development of energy sector projects and the approval of land use plans. It also promotes sustainable development. As part of energy efficiency and conservation measures, it is tasked with implementing new building codes. The Ministry of Health and the Environment is respon-sible for assessing and approving environmental im-pact studies. The Ministry of Foreign Affairs, Foreign Trade and Consumer Affairs is responsible for the im-port and taxing of petroleum product imports. The Mi-nistry of Finance is in charge of setting and controlling fuel prices (Castalia Consulting, 2012; Government of Saint Vincent and the Grenadines, 2009; 2010; 2014a; 2014b; 2014c; Samuel, 2013a).
Institutional Organization of the Energy Sector
Energy Consumption by Sector, 2012Figure 23
Source: EIA (2012); Government of Saint Vincent and the Grenadines (2010); VINLEC (2010b).
Industry1%
Residential18%
Other1%
Transport67%
Commercial13%

26
Office of the Prime Minister(contains Ministry of Energy)
Energy Unit
Physical Planning Unit within the Ministry of Housing, Informal Human Settlements,
Lands, and Survey and Physical Planning
Ministry of Health and the Environment
Ministry of Foreign Affairs, Foreign Trade and Consumer Affairs
Ministry of Finance
National Energy Committee
VINLEC
Ministry
Department in the Office of Prime Minister
Ministry
Ministry
Ministry
Ministry
Government-appointed committee
State-owned, vertically integrated utility
TypeEntity Tasks and Responsibilities
Source: Castalia Consulting (2012); Government of Saint Vincent and the Grenadines (2009; 2010; 2014a; 2014b; 2014c); Samuel (2013).
Holds overall responsibility for the energy sector. Responsible for the formulation and implementation of
all policies related to energy.
Assists with formulation and implementation of energy policy, and coordinates efforts specially related to
renewable energy and energy efficiency.
Responsible for sustainable development and environmental management, approval of land use
plans, and development of power projects. It is also tasked with implementing building codes.
Responsible for the management and approval of environmental impact assessments.
Responsible for the import and setting of taxes and import duties for petroleum products.
Responsible for setting and controlling fuel prices.
Advises the government on energy issues. Composed of stakeholders from other ministries and
state-dependent institutions.
Responsible for the generation, transmission, distribution, and sale of electricity.
Institutions and Responsibilities for the Energy SectorTable 6

27
Source: Authors’ elaboration based on information from Castalia Consulting (2012); Government of Saint Vincent and the Grenadines (2009; 2010; 2014a; 2014b; 2014c); Samuel (2013).
Organization and Functioning of the Energy Sector, 2014Figure 24
Government-owned Corporation Advisory BodyGovernment
MINISTRY OF FINANCE
MINISTRY OF HOUSING, LANDS AND PHYSICAL
PLANNING
OFFICE OF PRIMEMINISTER (MINISTRY OF
ENERGY)
NATIONALENERGY
COMMITTEE
ENERGYUNIT
MINISTRY OF FOREIGN AFFAIRS & TRADE
STATE
MINISTRY OF HEALTH &
ENVIRONMENT
CONSUMERVINLEC
PDVSVG
Assists with formulation andimplemetation. Coordinates e�ortsfor renewable energy & e�ciency
Resposible for energy sector.Formulate and implements policy
Resposible for sustainabledevelopment and enviromentalmanagement, land and building codes
Manages and approvesenviromental impact assessments
Responsible for setting and controllingfuel prices
Implements policies and regulations andexcercises limited regulatory functions
Supplieselectricity
Sets taxes rates and importduties for petroleum products
Provides license+ owner
Sells diesel
Advisesgovernment

28
Key Legislation and documents
National Energy Policy, 2009
Energy Action Plan, 2010
Electricity Supply Act, 1973
Arbitration Ordinance, 1952
Geothermal Exploration and Exploitation Agreement, 2010
Hydro-Electric Ordinance, 1951
Regulator
Office of the Prime Minister
Utility
VINLEC 100% state-owned
Ownership structure
Source: OAS (2010); Samuel (2013).
Key Legislation and Structure of the Energy SectorTable 7
Saint Vincent and the Grenadines, in line with its Eastern Caribbean neighbors, has experienced significant economic strain from the rapidly increasing price of crude oil since 2003. With the creation of the National Ener-gy Committee in 2006 and the Energy Unit in 2008 the Government of Saint Vincent and the Grenadines began the process of formulating a long-term energy policy to support the country’s efforts to diversify the national economy and to reduce poverty. At the end of this process stood the National Energy Policy of 2009.
The NEP, adopted by the Cabinet in February 2009, aims to ensure a clean, reliable, and affordable ener-gy supply and to strengthen the country’s economy by reducing its dependence on imported oil products. The NEP plans to achieve these ends by reducing demand in the medium and long term, improving efficiency and conservation, and pursuing indigenous energy resources.
For the regulatory framework, the policy suggests liberalizing the market to encourage private sector partici-pation, increase competition, and reduce prices. The policy aims to improve the government’s ability to effectively plan and manage the national energy sector.
In terms of planning and management of the energy sector, the policy aims to ensure “efficient and well-coordi-nated planning and management activities to achieve sustainable supply and use of energy.” To meet this goal, the policy calls for: (i) improved and expanded record keeping on all energy-related activities, (ii) impro-ved decision making and cross-ministerial coordination, (iii) designation of an authority within the govern-ment and providing it with adequate resources for the implementation of the NEP, (iv) creation of staff positions within VINLEC and other state-dependent institutions responsible for implementing the NEP, (v) establishment of educational programs to achieve efficient use of energy and improved conservation, and (vi) designing of an Action and Implementation Plan to implement the NEP.
With regard to the power sector, the policy aims to achieve safe, efficient, reliable, affordable, and environmentally friendly electricity generation and supply, and calls for the (i) improved efficiency in the gene-ration, transmission and distribution, (ii) exploration of renewable energy potential, (iii) introduction of new commercially-proven generation technologies, (iv) access to imported fossil fuels at the lowest cost with environmental and supply security in mind, and (v) fair access to transmission and distribution and improved mechanisms to allow private sector involvement.
In terms of renewable energy, the NEP aims to use indigenous energy sources, such as solar, wind, hydro, and geothermal, to replace imported petroleum products for electricity generation. The policy identifies the lack of technological expertise and weak institutional frameworks as key obstacles to greater public and private investment. The government aims to increase the utilization or renewable energy technologies by (i) promoting the increased use of commercially-viable renewable energy resources, (ii) analyzing the potential and making site-specific assessments, (iii) developing local expertise in renewable energy systems, (iv) encouraging private sector participation in renewable energy projects, (v) providing financial and fiscal incen-tives to allow renewable energy technologies to be market competitive, (vi) investigating the increased use of biofuels, and (vii) considering a requirement for installation of solar thermal collectors for large-scale users. For the petroleum sector, the NEP aims to reduce the cost of oil product imports by ensuring good supply management and negotiations and reducing the growth rate for oil imports to below the rate of economic

29
growth. It aims to achieve safe, reliable, and affor-dable supplies of petroleum products and their safe handing by (i) importing oil products at the lowest possible cost, (ii) improving fuel conservation and efficiency to reduce imports, and (iii) providing adequate storage facilities for petroleum products.
In the transportation sector, the government aims to achieve efficient, environmentally sound, and cost-effective transportation in part by (i) improving fuel conservation and efficiency, (ii) improving road conditions and reducing congestion, and (iii) establishing a taxation system and inspection sys-tem to encourage the use of fuel-efficient vehicles.
Lastly, it suggested a number of energy-efficiency measures to minimize energy input and intensi-ty, including: (i) promoting energy audits for industry, hotels, restaurants, and public buildings, (ii) providing fiscal incentives to encourage the use of energy-efficient appliances and light bulbs and improving efficiency awareness, (iii) studying consumption patterns to design efficiency measures, and (iv) establishing new building codes (Government of Saint Vincent and the Grenadines, 2009).
The Energy Action Plan (EAP) for Saint Vincent and the Grenadines of 2010 develops energy scenarios for the period between 2009 and 2030 and contains 40 policy actions, ranging from the short term (1–5 years) and medium term (5–10 years) to the long term (10–20 years), which complement the NEP and will facilitate its implementation. The EAP prescribes actions for six specific areas: (i) planning and management, (ii) the power sector, (iii) renewable energy, (iv) the petroleum sector, (v) the transportation sector, and (vi) energy efficiency.
In the area of planning and management, the EAP aims to establish a consolidated and well-coordinated sector by 2015. It prescribes the following key actions:
• Action 1: The Cabinet will define clear responsibi-lities in the energy sector for ministries and ins-titutions. It will consult with the National Energy Committee to make its decision.
• Action 2: The Office of Statistics will create a da-tabase with up-to-date and relevant information on consumption and supply in the energy sector, including an annual energy balance.
• Action 4: The Ministry of Energy, with assistance from the Finance Department, will make funds available for small-scale pilot and demonstration projects aimed at improving energy efficiency.
• Action 6: The Ministry of Energy will study the fea-sibility of grid interconnection between the different islands of the country as well as neighboring states.
• Action 9: The Ministry of Finance will com-pletely or partially exempt from import or consumption taxes items, which improve ener-gy efficiency or the use of renewable energy sources. Similar exemptions may be made availa-ble to persons or companies making investments
in these fields. • Action 10: The Ministry of Energy, with support
from other Ministries and agencies, will provide a bi-annual report on the implementation status of the EAP and make necessary revisions.
For the power sector, the EAP aims to reduce peak demand by 5 percent by 2015 compared to 2010 fore-casts, and by 10 percent by 2020. It also sets goals for system losses of 7 percent for 2015 and 5 percent for 2020. The EAP prescribes the following key actions to achieve these goals:• Action 11: VINLEC will provide on a bi-annual basis
a 10-year plan for the electricity sector to the go-vernment for discussion.
• Action 12: VINLEC will be asked to define a more equitable formula for the demand charge, espe-cially for the commercial sector, with the aim of more accurately reflecting the true costs of ge-neration.
With respect to renewable energy, the EAP set goals of 30 percent of electricity generation from renewable energy sources by 2015 and 60 percent by 2020. To reach these goals, it supports the following key actions:
• Action 14: The Ministry of Energy will coordinate the development of the Soufriere Resource area according to the existing geothermal agreement. If the selected private investor does not meet its duties and obligations, the government may elect to terminate the agreement at various stages of the development process.
• Action 15: VINLEC will begin the process of selec-ting appropriate river sites for future run-of-river hydropower developments.
• Action 16: VINLEC will be financially responsible, with government support where possible, for re-habilitating existing hydropower facilities at South River and Richmond as well as for the installation of new small hydropower plants.
• Action 17+18: VINLEC will continue further long-term wind potential assessments and, in coope-ration with Ministry for Physical Development, begin the process of erecting wind turbines for grid connection as soon as possible.
• Action 23: The Ministry of Energy will take the necessary steps to allow independent power pro-ducers (IPPs) to participate in the generation of electricity from renewable sources. To this end, the Ministry will either amend the ESA or mandate VINLEC to issue licenses to IPPs when instructed to do so, and VINLEC will purchase and distribu-te generated electricity from IPPs under power purchase agreements. Currently, IPPs are only allowed to operate with the approval of VINLEC.
• Action 24: The Ministry of Energy will create the necessary legal framework to allow supply of electricity into the national grid from small-scale generation without the need for a license from VINLEC and will develop an appropriate net-me-tering scheme.

30
In the petroleum sector, the EAP aims to diversify the energy supply and to increase energy security. Key actions are:
• Action 27: The government will explore alternative energy supply options, such as the combination of renewable energy sources and natural gas. To this end it will request studies on the feasibility of imported liquefied natural gas (LNG) and compressed natural gas (CNG).
For the transport sector, the plan foresees reduced consumption of 10 percent by 2015 and 15 percent by 2010. Key actions in this sector are: • Action 29: The Ministry of Transportation will develop a comprehensive, long-term transport strategy with
the aim of reducing consumption. • Action 30: The introduction of hybrid and electric vehicles and the procurement of such vehicles for
the government fleet.
To promote energy efficiency and reduce projected electricity demands by 5 percent by 2015 and by 15 percent by 2020, the plan describes the following key actions: • Action 35 and 36: The Ministry of Energy may consider fiscal incentives, including the exemption from im-
port duties, to introduce energy-efficient devices, such as light bulbs and solar water heaters. To re-duce the burden of initial costs, the government may offer low-interest loans (Government of Saint Vincent and the Grenadines, 2010). Thus far, the government has increased import duties for incan-descent light bulbs and is currently considering appliance-labeling standards.
The Arbitration Ordinance of 1952 sets forth the arbitration procedure in case VINLEC, and thegovernment cannot agree on a suggested electricity tariff increase.
The government and CGE Limited signed the Geothermal Exploration and Exploitation Agreement of 2010. It granted the company exclusive rights to explore and develop geothermal resources in the Soufriere area and operate as an IPP. The government cancelled the agreement, however, after CGE failed to begin exploratory work within the first six months.
As of June 2015, the government completed work on and submitted a new Geothermal Resources Ex-ploration and Development Bill for the first round of revisions by the legal committee (Castalia, 2015).
The Hydro-Electric Ordinance of 1951 relates to the development of hydropower resources in Saint Vincent and the Grenadines.
Saint Vincent and the Grenadines does not have a designated regulatory authority in charge of over-seeing the energy sector. Overall control and guidance of the energy sector is the responsibility of the Ministry of Energy, which is part of the Office of Prime Minister. The Energy Unit assists the Ministry in its work. There is no discernible regulatory oversight being conducted, nor does the NEP propose the creation of an overarching regulatory body.
Regulator

31
Institutional Structure of the Electricity Subsector
Saint Vincent and the Grenadines represents a segmented electricity market. The state-owned, vertically integrated utility, VINLEC, provides electricity services on five is-lands. Ninety-nine percent of the population has access to electricity services.
The Electricity Supply Act of 1973 (ESA) provides the elec-tricity sector’s legal framework. It governs the generation, transmission, distribution, and sale of electricity and provi-des the legal basis for the setting of electricity tariff. Under the ESA, VINLEC must answer requests by the Prime Mi-nister but in practice, the utility company operates largely independently. The ESA represents an inadequate legal fra-mework, eliminating competition and placing control over licenses for IPPs in the hands of VINLEC, the monopoly holder. As Saint Vincent and the Grenadines strives to expand and modernize its electricity sector, there is an urgent need to reform the legal framework.
The institutional framework of the electricity sector re-mains unclear, as responsibilities for current policies and long-term planning are divided between a number of minis-tries and agencies. There is no discernible regulatory oversight and no dedicated regulatory entity. Under the EAP, VINLEC is required to provide 10-year plans on a bi-annual basis, but it is unclear if such documents are being or have been produced.Similarly, the EAP requires improved record keeping and availability of data on the energy and electricity sector. However, information and statistical data as well as re-ports on monitoring and performance evaluations remain extremely limited. VINLEC last published an annual report in 2010.
The ESA (Act No. 14) governing the electricity sector in Saint Vincent and the Grenadines was passed by parlia-ment in 1973 and has not been amended or updated since (Castalia Consulting, 2012). It granted an exclusive license for the supply of electricity, including generation, transmission, distribution and sale, to VINLEC for a period of 60 years until 2033.
With permission by the minister responsible for ener-gy, VINLEC may grant a sub-license for the generation, transmission, distribution, and sale of electricity to another person or company. VINLEC is required to answer requests for information by the Prime Minister, but overall, the ESA provides very limited oversight and does not specify who holds regulatory authority over the utility.
The ESA established the original electricity rate and speci-fies that electricity rates may be adjusted from time to time, and that either the Minister or VINLEC may make such a request. It does not provide a formula by which tariffs are calculated. If both parties come to an agreement during the 60 days following the request, the new rates take effect. In case they cannot agree, a single arbitrator will follow the arbitration procedure set forth in the Arbitration
Ordinance of 1952. The governor and VINLEC jointly select the arbitrator. If the two parties cannot agree, the judge as-signed to Saint Vincent as set out in the West Indies Asso-ciated States Supreme Court Order 1967 will serve as arbi-trator. According to the ESA, VINLEC’s revenues must be sufficient to (i) cover operating costs, (ii) meet all expenses incurred, (iii) repay debt, (iv) cover the costs of replacement of assets, (v) cover the costs of expansion, (vi) pay regular dividends at the commercial rate, and (vi) provide fair rates for all classes of consumers.
All electricity consumed by the government is billed at a 10 percent discount, with the exception of street lighting. For the duration of its license, VINLEC is exempt from import duties and customs taxes for all equipment, plant installa-tions, machinery, vehicles, and other materials used for its operation and not intended for resale. The company also was limited to a 32 percent tax on profits for the first ten years of the license. It is unclear what its tax rate is today.
VINLEC is also assured continuous access to the land and property that contains its installations, power lines, and hy-dropower facilities even if such lands change ownership in the future. Part of this regulation is set out in Hydro-Elec-tric Ordinance No. 24 of 1951. The government will help VINLEC with the acquisition of land necessary for the ge-neration, transmission, distribution, and sale of electricity. It may also choose to transfer crown land into the possession of VINLEC if its operations reasonably require this.
According to the ESA, the government has the right to revoke the license after 15 and 40 years if it provides 24 months’ notice. In that case, it would be required to purcha-se all assets and debts calculated according to a formula set out in the Third Schedule. As the 40-year limit passed in 2013, this provision is no longer relevant.
The First and Second Schedule set the electricity rate on Saint Vincent and on the island of Bequia. On Saint Vincent, the original residential electricity rate was set at 10 cents for the first 20kWh, 15 cents for 20-80kWh, and 7 cents abo-ve 80kWh, with an EC$1.50 minimum fee. Commercial rates were calculated according to floor space, with the first 4000 units at 20 cents and 9 cents thereafter. A unit re-presented square feet divided by 50. Industrial rates stood at 6 cents with an EC$ base charge.
On Bequia, domestic rates stood at 20 cents for up to 30kWh and 12 cents thereafter, with an EC$1.50 minimum. Commercial rates consisted of an EC$2.00 service charge, an EC$2.50 minimum, and 20 cents up to 30kWh, the next 500kWh at 10 cents, and 8 cents above that (Government of Saint Vincent andthe Grenadines, 1973).
VINLEC is a wholly state-owned company and vertically integrated utility, which has held a monopoly on the gene-ration, transmission, distribution, and sale of electricity since

32
1973. VINLEC was incorporated under the laws of Saint Vincent and the Grenadines on November27, 1961, and continues to operate as a company under the Companies’ Act of 1994. VINLEC has been fully government-owned since 1985, and its exclusive license is valid until 2033. VINLEC registered a net profit between 2003 and 2013.
VINLEC currently supplies electricity to Saint Vincent as well as four of the Grenadines. Under the ESA, VINLEC has been given the authority to issue licenses to IPPs wishing to generate, transmit, and distribute utility-scale electricity.
28 It has granted licenses to two IPPs for the private islands of Palm and Mustique, where VINLEC does not operate. There is no dedicated independent regulator in Saint Vincent and the Grenadines. In theory, the Ministry of Energy, which does not currently exist, functions as a regulator, but in practice VINLEC operates largely independently (Castalia Consulting, 2012; World Bank, 2010).
VINLEC operates three hydropower plants. The South Rivers and Richmond Power plants are run-of-the-river hydro plants, which provide limited or no water storage capacity. Their capacity thus varies significantly throughout the year as water levels of the river fluctuate by season. Water for the Richmond plant enters a small settling tank to allow silt and parti-culates to settle to the bottom before entering the turbine house.
The South Rivers station, in addition to its settling tank, operates a balancing tank providing limited water storage ca-pacity. This setup allows the station to operate as a peaking plant. The reservoir is filled during off-peak hours when turbines operate at lower loads and require less water throughput.
The Cumberland power plant is situated along a fast-moving mountain stream dropping from an elevation of over 600 meters to sea level in less than 10 kilometers. It provides for steep gradients between 1 in 6 and 1 in 16. The station operates three separate powerhouses with five different units.
Cumberland One (C1) has one unit with a capacity of 1.46MW, Cumberland Two (C2) operates two units with 640kW ca-pacity each, and Cumberland Three (C3) operates two units with 490kW capacity each. C1, the uppermost plant, employs an 11,000 cubic meter water tank, which provides sufficient storage capacity for three hours at maximum plant discharge.
The Cumberland stations are able to provide peak load electricity year round and are less affected by the dry season than the Richmond and South Rivers station. The most limiting factor to Cumberland’s operation is the withdrawal of river water for drinking water supply at an elevation of 500 meters, above VINLEC’s “tap-off point” (CARILEC, 2002).
Currently there is no formal net-metering or net-billing policy, and feed-in tariffs have not been established. VINLEC, however, encourages private investment into grid-tied PV systems and has made available an online form to apply for micro-generator interconnection. VINLEC also states that it will move from net metering to feed-in tariffs. (Government of Saint Vincent and the Grenadines, 2009; Myers, 2012).
The first grid-connected PV system was installed at Saint Vincent’s Technical College in May 2008. Today there are more than a dozen grid-connected PV systems on Saint Vincent and the Grenadines, with a total peak capacity of 400kW. About 88 percent of installed capacity is owned and operated by the government and VINLEC, including a 10kW system on the roof of the Ministry of Finance, a 75.9kW system on the island of Bequia providing electricity to a desalination plant, and a 177kW system at VINLEC’s engineering headquarters.
Furthermore, there are 24kW in the domestic and commercial sectors on Saint Vincent and 14kWp on Bequia. VINLEC aimed to expand its installed capacity to 555kW by the end of 2013 (Samuel, 2013). By early 2015, the country had around 750kW of PV capacity (Samuel, 2013).
Saint Vincent and the Grenadines possesses significant geothermal energy potential, with estimates ranging from 100MW to 890MW. To begin taking advantage of this resource, the government and CGE Limited signed the Geothermal Exploration and Exploitation Agreement in 2010. The agreement granted the company exclusive rights to investigate and develop geothermal resources in the Soufriere region and operate as an IPP. After the company failed to begin scientific survey work within six months, the government terminated the agreement effective December 2010 (OAS, 2010).
Saint Vincent and the Grenadines subsequently contracted with Iceland-based Reykjavik Geothermal to help establish geothermal development in the Soufriere area. The Bill, Hillary, and Chelsea Clinton Foundation, the government of Saint Vincent and the Grenadines, Barbados Light and Power Holdings, and Reykjavik Geothermal fun the US$50 million project. Icelandic experts were scheduled to visit the island in November 2013 to conduct surface exploration work (Brown, 2013). In 2014, the government signed a geothermal agreement with Icelandic firm Reykjavik Geothermal Ltd. and Emera Inc. As of early 2015, the government reports that the power plant, with a planned capacity of 10MW, will start generating electricity by the end of 2017 (Chance, 2015).

33
Saint Vincent and the Grenadines does not have a de-dicated electricity regulator. In theory, VINLEC must answer questions and inquiries from the Ministry of Energy within the Office of the Prime Minister, but in practice the utility company operates largely un-checked. Changes to electricity tariffs can be re-quested by either VINLEC or the Minister and if
approved by both parties within 60 days go into effect. In case of disagreement an arbitrator is called upon. The ESA, which governs the electri-city sector, does not provide any formula for the cal-culation of the electricity tariff, a severe shortcoming, which the EAP aims to address in the future.
Regulator
Who sets tariffs Who controls tariffchanges
How is the tariffcalculated
How are tariffchanges calculated
Source: World Bank (2011).
Government and VINLEC VINLEC and government may initiate tariff change procedure.
If no agreement goes to arbitration.
No criteria are set If no agreement between VINLEC and government, arbiter will
consider expenses, costs of asset replacement, expansion costs,
and profits.
Who monitors andenforces fairness of tariff
Who can alter termsof how tariff is calculated
How frequently istariff revised
Is there aguaranteed rate of return
No designated entity Parliament At any time. No time interval
specified by the legislation.
No guaranteed rate. Commercial
rate is used as base during
arbitration.
VINLEC Electricity Tariff RegulationTable 8
Net meteringFeed-intariff
Renewableportfolio standard
IPPspermitted
Tax credits Tax reduction/exemption
Public loans/grants
Source: Auth et al. (2013).Note: IPPs permitted only with license from VINLEC.
Suggested
as of 2015Suggested Suggested
Renewable Energy Support Policies, 2013Table 9

34
Source: Authors’ elaboration based on information from Samuel (2013); World Bank (2011).
Saint Vincent and the Grenadines Regulatory Framework of the Electricity SectorFigure 25
Government-owned Corporation Regulatory BodyGovernment
VINLEC
OFFICE OF PRIME MINISTER(MINISTRY OF ENERGY)
Exercises limited regulatory functions
The country’s electrification rate is 99 percent, and VINLEC supplies electricity along a 350-mile-long network of 33kV, 11kV, 400V, and 230V lines. Accor-ding to VINLEC, construction work at the Cane Hall Power station and its Annex is ongoing and part of the utility’s 33kV line expansion project. As part of the project, two substations, at the Cane Hall and South Rivers plants, will be built.
VINLEC will also add 19.66 kilometers of overhead and three kilometers of underground 33kV line from Lowman’s Bay to Kingstown, from Kingstown to Cane Hall, and from Cane Hall to South Rivers. The project will create a direct link between the Lowman’s Bay Power Plant and the Kingstown substation via two 33kV transmission lines. In addition, one 33kV will link the Kingstown substation with the Cane Hall Subs-tation, and another line will connect the Cane Hall Substation to the South Rivers Substation (VINLEC, 2010a).
The construction of high-voltage transmission lines is often prohibitively expensive and thus unecono-mical for small hydro stations. Consequently, the Richmond and South Rivers plants are connected to the load centers only via 11kV distribution lines, and not via 33kV transmission lines. In case of fault on the
distribution line, Richmond’s and South Rivers’ capa-city would be lost.
As their overall capacity represents only a small share of total installed capacity, the consequences of such a loss would be manageable. The Cumberland hydro plant, on the other hand, which at peak can provide up to 20 percent of maximum demand, is connected via a separate 33kV transmission line to isolate it from potential faults on the distribution lines (CARILEC, 2002).
Between 2007 and 2012, VINLEC invested around US$37 million (EC$100 million) to improve its ge-neration and transmission infrastructure and to increase its service quality. According to the go-vernment, these investments have improved service quality and reduced losses (Castalia, 2015).
VINLEC’s transmission and distribution losses have decreased significantly over the past three decades. While losses stood at a peak of 24.8 percent in the 1980s and still ranged between 10 and 15 percent in the 1990s, they have continuously declined and stood at 6.7 percent in 2012 before increasing to 8.4 percent in 2013.
Transmission and Distribution

35
VINLEC Losses as Share of Net Generation, 1969–2013Figure 26
perc
ent
0
5
10
15
20
25
30
18.3
24.8
15
10.09 7.4
1969
1971
1973
1975
1977
1979
1981
1983
1985
1987
1989
1991
1993
1995
1997
1999
2001
2003
2005
2007
2009
2011
2013
Source: Samuel (2013); USAID (1988); VINLEC (2004; 2005; 2006; 2008; 2009).
Electricity tariffs are relatively low compared to other countries in the region, in part because VINLEC ge-nerates some electricity using hydroelectric power. VINLEC’s tariff structure is similar to that in other Eas-tern Caribbean States. It charges different rates for domestic, commercial, and industrial customers as well as for street lighting. Domestic customers pay EC$0.425 for the first 50kWh of consumption and EC$0.50 for all units above with a minimum charge of EC$5.00. This rate has been fixed since 1989 (OAS, 2010).
Commercial customers pay a minimum char-ge of EC$15.00 for consumption below 17kWh, EC$0.54 per kWh for consumption between 18kWh and 150,000kW, EC$0.513 per kWh bet-ween 151,000kWh–200,000k, and EC$0.486 per kWh above 201,000kWh. Industrial consumers pay EC$0.42per kWh below 150,000kWh, EC$0.399 per kWh between 150,000–200,000kWh, and EC$0.378 per kWh above 200,000kWh. Street lighting is billed with EC$0.565 per kWh. All charges are subject to a
15 percent value-added tax (VAT). In addition, VIN-LEC assesses a monthly fuel surcharge. This charge stood at EC$0.2863 per kWh as of March 2015 (VIN-LEC, 2015b).
According to the government, VINLEC’s tariff struc-ture is outdated and does not accurately reflect the true cost of generation. As part of the EAP, the government requests that VINLEC reform its tariff structure to reflect the real costs (Government of Saint Vincent and the Grenadines, 2010). The 32go-vernment appears to provide some subsidies to co-ver the fuel surcharge of low-income households, but there is no public information available to confirm the extent or continuity of the subsidies (Castalia, 2015).
The availability of hydropower helps keep electricity rates relatively low compared to other countries in the region. However, as fuel surcharges have in-creased and the importance of hydropower has decreased, electricity rates have risen sharply over the past ten years.
Electricity Rate

36
Charge
Fixed basic charge
Value-addedtax
Fuel surcharge(March 2015)
Domestic
First 50kWh: $0.425/kWhAbove 50 kWh: $0.50/kWh
Minimum: $5.00
15%
$0.2863/kWh
Commercial
0–17kWh: $15 minimum charge18–150,000kWh: $0.54/kWh
151,000–200,000kWh: $0.513/kWh>200,000kWh: $0.486/kWh
15%
$0.2863/kWh
Industrial
<150,000kWh: $0.42/kWh150,000–200,000kWh: $0.399/kWh
>200,000kWh: $0.378/kWh
15%
$0.2863/kWh
Streetlighting
$0.565/kWh
15%
$0.2863/kWh
Source: VINLEC (2015b).
VINLEC Electricity Rates, March 2015 (in EC$)Table 10
Generation
VINLEC
More than 20 private producers using PV system feeding into the grid under net metering
Transmission
VINLEC
Distribution
VINLEC
Source: Authors’ elaboration.
Matrix of the Electricity SectorTable 11
Institutional Structure of the Hydrocarbon Subsector
The Ministry of Finance, which is part of the Office of the Prime Minister, is responsible for the setting of fuel prices. Import du-ties and taxes for oil products are controlled by the Ministry of Foreign Affairs, Foreign Trade and Consumer Affairs. Saint Vincent and the Grenadines joined the PetroCaribe agreement in 2005, under which it can receive up to 1,000 boe/day per day under the preferential terms of PetroCaribe. On average, it received 560 boe/day and it has received 800,000 boe between 2005 and 2014 (PDVSA, 2014). As part of PetroCaribe, the government created PDV Saint Vincent and the Grenadines Ltd. in 2006 in which it holds a 45 percent minority stake, with the other 55 percent held by PDV Caribe, a sub-sidiary of PDVSA. The commercialization of oil products falls primarily to Simpson Oil Limited (SOL) and Rubis Caribbean, which are the two largest operators of gas stations on Saint Vincent. There are also a number of independent operators.
SOL was created when Barbadian businessman Kyffin Simpson purchased Shell’s Caribbean downstream bu-siness in 2005. In addition to operating under the Shell brand under license, it unveiled its first SOL 33 Service Stations in Saint Vincent in 2010.
It further expanded its Caribbean operation when it purchased Shell’s aviation business in 2009 and ExxonMobil’s fuels marketing businesses in some Caribbean countries in 2014. In total, SOL operates 480 gas stations, 14 aviation facilities, 24 marinas, and 32 import terminals throughout the Caribbean (SOL, 2014).
Rubis Caribbean began operation in the Eastern Caribbean on April 1, 2011 when it purchased assets owned and operated by Chevron under its Texaco brand. Apart from Saint Vincent and the Grenadines, Rubis operates in the downstream business in Antigua and Barbuda, The Bahamas, Barbados, Dominica, Grenada, Guyana, Saint Lucia, Saint Kitts and Nevis, and Trinidad and Tobago. It also operates in several dependencies, such as the Cay-man Islands and Turks and Caicos Islands. In total, it owns and operates more than 200 service stations throug-hout the region (Rubis, 2014).

37
Production Imports
PDV Saint Vincent and the Grenadines Ltd.
Sol Petroleum
Rubis Caribbean
Transformation Commercialization
PDV Saint Vincent and the Grenadines Ltd.
Sol Petroleum
Rubis Caribbean
Source: Authors’ elaboration.
Matrix of the Hydrocarbon SectorTable 12
VINLEC’s storage capacity at the Cane Hall Power sta-tion reached 34,000 gallons following its 33kV expan-sion project, up from 20,000 barrels previously.
As part of the PetroCaribe agreement, Saint Vincent and the Grenadines built a new fuel facility at Low-mans Bay. According to PetroCaribe documents it constructed five storage tanks with a capacity of 34,000 barrels at the Lowmans Bay fuel storage and distribution plant.
The first stage saw the construction of a Heavy Fuel Oil storage tank for VINLEC’s Lowmans Bay Power plant, which was simultaneously undergoing ex-pansion and conversion to work with heavy fuel
oil. During the second stage two gasoline tanks and one Jet A1 tank were constructed (PetroCaribe, 2014).
Following the expansion, VINLEC’s total storage ca-pacity increased from a two-week supply to a three-month supply. Officials argued that this expansion was critical to ensure continuous operation in case of natural disasters, such as hurricanes.
In addition to the diesel storage, Saint Vincent and the Grenadines also constructed a 20,000-barrel tank for the storage of gasoline with a third smaller tank hol-ding Liquid Petroleum Gas (Searlight News, 2009).
In July 2009, there were a total of 25,382 registe-red motor vehicles on Saint Vincent and the Gre-nadines. Transportation is the largest consumer of energy, with more than 16 million gallons of diesel and gasoline consumed in 2008. Between 1300 and 1600 vehicles are imported annually into the country (Government of Saint Vincent and the Grenadines, 2010).
There are no figures available on the number of vehi-cles retired each year. In addition to land-based ve-hicles there are about 1095 water vessels, of which about three-quarters are small vessels equipped with outboard gasoline and diesel engines. The remaining are small commercial yachts, ferries, and cargo ves-sels.
As in other Eastern Caribbean Countries, the share of large SUV-type vehicles has increased in recent de-cades, leading to higher fuel consumption. Small, modern compact vehicles with very high fuel efficiency are not common on Saint Vincent and the Grenadines. The government intends to introduce tax exemptions for low emission and efficient vehicles.
The country does not mandate regular emissions tes-ting or monitoring, and there are no maintenance re-quirements, further contributing to high fuel con-sumption (Government of Saint Vincent and the Grenadines, 2010).
Transportation

38
Imported Motor Vehicles per Year, 2000–2008Figure 27
1000
1100
1200
1300
1400
1500
1600
1700
1800
2000 2001 2002 2003 2004 2005 2006 2007 2008
Source: Government of Saint Vincent and the Grenadines (2010).
Historical Development of the Saint Vincent and the Grenadines Energy Sector
Saint Vincent and the Grenadines’ first public electricity services began in 1931 as a nighttime-only service around the capital of Kingstown. The country built the first hydropower facility in South Rivers in 1952, followed by the Richmond hydropower station in 1962. VINLEC first expanded to one of the Grenadines in 1968, when the Bequia Power station opened.
The government purchased a 49 percent ownership stake in VINLEC from the Commonwealth Development Corporation in 1971, and took full ownership in 1985. In 1973, the government passed the Electricity Supply Act, which granted exclusive license to VINLEC.
In 1974 and 1976, the government commissioned the Union Island Power Station and the Cane Hall Power Sta-tion, followed by a third hydro plant at Cumberland between 1987 and 1988. Power plants on the island of Canouan and Mayreau followed in 1994 and 2003, and VINLEC opened a new plant at Lowmans Bay on Saint Vincent in 2006 (VINLEC, 2014b).
VINLEC experienced two major fires in 2009. The first occurred on February 2, when the 3.8MW Caterpillar ge-nerator, the second largest at the Cane Hall Power Station, was severely damaged when spilled fuel ignited on the hot exhaust pipe. On April 26 of the same year, another fire, again caused by a fuel leak near the exhaust pipe, severely damaged the 4.2MW Wärtsilä unit at the Cane Hall Power Station (Lewis, 2013).
Over the past 45 years, VINLEC’s sales have grown fifteen-fold, from around 8.2GWh in 1969 to 122.9GWh in 2008. Its gross generation grew thirteen-fold, from 10.2GWh to 139GWh.

39
VINLEC Sales and Gross Generation, 1969–2011Figure 28
GW
h
Sales Gross Generation
1969
1971
1973
1975
1977
1979
1981
1983
1985
1987
1989
1991
1993
1995
1997
1999
2001
2003
2005
2007
2009
2011
0
20
40
60
80
100
120
140
160
Source: Samuel (2013); USAID (1988); VINLEC (2004; 2005; 2006; 2008; 2009).
VINLEC Peak Demand, 1969–2011Figure 29
MW
1969
1971
1973
1975
1977
1979
1981
1983
1985
1987
1989
1991
1993
1995
1997
1999
2001
2003
2005
2007
2009
2011
0
5
10
15
20
25
Source: Samuel (2013); USAID (1988); VINLEC (2004; 2005; 2006; 2008; 2009).
Similarly, VINLEC’s peak demand grew nearly tenfold, from 2.6MW in 1969 to 24.5MW in 2008.

40
Methodology for Energy Matrix
The matrix was constructed with data from the EIA, IRENA, and the Government of Saint Vincent and the Grenadines’ EAP of 2010. The EAP plan provides information about imported oil products and how they are used by sector. Information about electricity consumption by sector was found in VINLEC’s annual report.
Source: Authors’ elaboration.
Energy MatrixTable 13
CR&W HydroElectricity input oil products
Electricity consumption
Final consumption by sector
Based on 2010 consumption by sector from Energy Action Plan. Assuming no significant change in sectoral consumption pattern between 2008 and 2012.
214 boe/day
Based on VINLEC
1500 boe/day
Based on EIA data
42 boe/day
Based on VINLEC
31.5 boe/day
Based on IRENA 2009 figure assuming similar decrease as between 2000 and 2009.
2012
Source

41
References
Auth, K., M. Konold, E. Musolino, and A. Ochs. 2013. Caribbean Sustainable Energy Roadmap, Baseline Report and Assessment.
Brown, D. 2013. St. Vincent’s Volcano Holds More Promise than Peril “In North Windward where I grew up and still spend most of my time, I remember how much we yearned for electricity was brightly lit.”
Local resident Rochelle Baptiste, pp. 2013–2014. Retrieved from http://www.ipsnews.net/2013/11/st-vincents-volca-no-holds-more-promise-than-peril/
Caribbean 360. 2014. St Vincent geothermal power plant could be operational by 2018. Retrieved from http://www.caribbean360.com/news/st-vincent-geothermal-power-plant-could-be-operational-by-2018
CARICOM (Caribbean Community). 2015. CARICOM approves loan for solar power project in St. Vincent. Retrieved from http://latino.foxnews.com/latino/politics/2015/03/10/caricom-approves-loan-for-solar-power-project-in-st-vincent/
CARILEC. 2002. Carilec : Renewable Energy Conference November 4 th and 5 th 2002 From Barriers To Success Hy-droelectric Development In St. Vincent, 1–6. Retrieved from http://www.carilec.org/Presentations/RE_Conf_2002/Hydroelectric Development in St. Vincent.doc
Castalia Consulting. 2012. Sustainable Energy in the Eastern Caribbean: Achieving an Unrealized Potential.
Chance, K. 2015. St. Vincent Embarks on Renewable Energy Path solar , you are still going geothermal and the diesel Prime Minister Ralph Gonsalves. Retrieved from http://www.ipsnews.net/2015/01/st-vincent-embarks-on-renewa-ble-energy-path/
EIA (U.S. Energy Information Administration). 2012. International Energy Statistics. Retrieved from http://www.eia.gov/cfapps/ipdbproject/IEDIndex3.cfm?tid=5&pid=53&aid=1
GEF (Global Environmental Facility). 2014. Promoting Access to Clean Energy Services in St. Vincent and the Gre-nadines (PACES). Retrieved from http://www.thegef.org/gef/sites/thegef.org/files/gef_prj_docs/GEFProjectDocu-ments/Climate Change/PIMS_5146_SVG_PACES_ProDoc_18Jul2014_Resub.doc
Government of Saint Vincent and the Grenadines. 1973. Electricity Supply Act No 14 1973. Retrieved from http://ufdc.ufl.edu/UF00077473/01280/19x?vo=3
------. 2000. Initial National Communication on Climate Change St . Vincent and the Grenadines.
------. 2009. The Government’s National Energy Policy.
------. 2010. Energy Action Plan for Saint Vincent and the Grenadines.
------. 2014a. About the Energy Unit, 2014. Retrieved from http://www.security.gov.vc/index.php?option=com_content&view=article&id=87&Itemid=139
------. 2014b. International Trade And Consumer Affairs Department, (784), 456–457. Retrieved from http://www.foreign.gov.vc/index.php?option=com_content&view=article&id=71&Itemid=25
------. 2014c. Role And Objectives of Physical Planning Unit, 2014. Retrieved from http://housing.gov.vc/index.php?option=com_content&view=article&id=11&Itemid=47
IMF (International Monetary Fund). 2013. World Economic Outlook April 2013. Retrieved from https://www.imf.org/external/pubs/ft/weo/2013/01/weodata/index.aspx
------. 2015. World Economic Outlook April 2015. Retrieved from http://www.imf.org/external/pubs/ft/weo/2015/01/weodata/index.aspx

42
IRENA (International Renewable Energy Agency). 2012. Renewable Energy Country Profiles: Caribbean. Retrieved from http://www.irena.org/DocumentDownloads/Publications/_CaribbeanComplete.pdf
Knopp, M. 2012. Study on maximum permissible intermittent electricity generators in an electricity supply network based on grid stability power quality criteria by, 1–115. Retrieved from http://www.credp.org/Data/MT-VRE-12-mk-nopp.pdf
Lewis, V. 2013. Improving Fire Safety at VINLEC, (March). Retrieved from http://www.carilec.com/members2/uploads/OHSHR13_Pres/VLewis_ImprovingFireSafetyAtVINLEC.pdf
Myers, T. 2012. St . Vincent and the Grenadines in the Eastern Caribbean. Retrieved from https://www.irena.org/do-cumentdownloads/events/BermudaSeptember2012/9_Thornley_O_A_O_Myers.pdf
OAS(Organization of American States). 2010. Energy Policy and Sector Analysis in the Caribbean 2010-2011. Retrie-ved from http://www.ecpamericas.org/data/files/Initiatives/lccc_caribbean/LCCC_Report_Final_May2012.pdf
PDVSA. 2014. PETROCARIBE MANAGEMENT REPORT QUARTER 1 2014. Retrieved from http://venezuela-us.org/live/wp-content/uploads/2014/11/INFORME_GESTION-PETROCARIBE_ingles.pdf
Petrocaribe. 2014. PetroCaribe Today, 1–4. Retrieved from http://www.petrocaribe.org/interface.en/database/fiche-ro/publicacion/728/54.PDF
Rubis. 2014. OUR HISTORY - RUBIS. Retrieved from http://www.rubis-caribbean.com/our-history/Samuel, H. A. 2013. A Review of the Status of the Interconnection of Distributed Renewables to the Grid in CARICOM Countries. Retrieved from http://www.credp.org/Data/CREDP-GIZ_Interconnection_Report_Final_Oct_2013.pdf
Searlight News. 2009. Vinlec gets more storage tanks, 22523. Retrieved from http://searchlight.vc/vinlec-gets-more-storage-tanks-p22523.htm
SOL (Simpson Oil Limited). 2014. About Sol.
UN (United Nations). 2014. United Nations Statistics. Retrieved from http://data.un.org/Data.aspx?d=WDI&f=Indicator_Code%3AEG.USE.ELEC.KH.PC
UNDP (United Nations Development Programme). 2014. Human development index (HDI). Retrieved from http://hdr.undp.org/en/content/human-development-index-hdi-table
USAID. 1988. Cumberland Hydroelectric Project, (538). Retrieved from http://pdf.usaid.gov/pdf_docs/PDAAR294.pdf
VINLEC (Saint Vincent Electricity Services Limited). 2004. VINLEC Annual Report 2003. Retrieved from http://www.vinlec.com/about/articlefiles/142-FS2003.pdf
------. 2005. VINLEC Annual Report 2004. Retrieved from http://www.vinlec.com/about/articlefiles/142-FS2004.pdf
------. 2006. VINLEC Annual Report 2005 (pp. 1–29). Retrieved from http://www.vinlec.com/about/articlefiles/222-FS2005.pdf
------. 2008. VINLEC Annual Report 2007 (pp. 1–33). Retrieved from http://www.vinlec.com/about/articlefiles/222-Microsoft Word - VIN2007 signed.pdf
------. 2009. VINLEC Annual Report 2008 (Vol. 2008). Retrieved from http://www.vinlec.com/about/articlefiles/317-Financial Statements 2008.pdf
------. 2010a. Improved reliability expansion project, 1–2. Retrieved from http://www.vinlec.com/article.aspx?articleid=306&zone=50
------. 2010b. VINLEC Annual Report 2010. Retrieved from http://vinlec.com/uploads/userfiles/VINLEC_ANNUAL_REPORT_2010.pdf
------. 2014a. Grid emission factor calculation sheet. Retrieved from https://cdm.unfccc.int/sunsetcms/storage/con-tents/stored-file-20141021153637847/Grid emission factor calculation sheet_vc_rev20140603.xlsx

43
------. 2014b. History of VINLEC, 6–8. Retrieved from http://webcache.googleusercontent.com/search?q=cache:Pli6oysv4RoJ:www.vinlec.com/category.aspx?zone=History+&cd=3&hl=en&ct=clnk&gl=us
------. 2015a. About Vinclec, 3–5. Retrieved from http://www.vinlec.com/contents/about-vinlec
------. 2015b. Electricity Rate Structure and Fuel Surcharge. Retrieved from http://www.vinlec.com/contents/electri-city-rate-structure
World Bank. 2010. Caribbean Regional Electricity Generation, Interconnection, and Fuels Supply Strategy Final Re-port. Retrieved from http://www.caricom.org/jsp/community_organs/energy_programme/electricity_gifs_strate-gy_final_report.pdf
------. 2011. The World Bank Project Appraisal. Retrieved from http://www-wds.worldbank.org/external/default/WDSContentServer/WDSP/IB/2011/05/30/000356161_20110530015337/Rendered/PDF/515760PAD0P1010e0only0900BOX358362B.pdf
------. 2014. Population Statistics.
