9doxlqj $vvhvvphqw &rvw %hqhÀw &rqvlghudwlrqv
TRANSCRIPT


About the AuthorsRandy L. Swing is the Executive Director of the Association for Institu-tional Research (AIR). AIR is a professional association of nearly 4,000 institutional researchers, planners, and decision makers representing over 1,500 higher education institutions around the world. Prior to joining AIR, Swing served as Co-Director & Senior Scholar at the Policy Center on the First Year of College and as a fellow in the National Resource Center for !e First-Year Experience and Students in Transition at the University ofSouth Carolina. He has worked with numerous research teams in Japan, andserved as an advisor to the Quality Assurance Agency of Scotland. He hasauthored articles, chapters, monographs, and books, including Achievingand Sustaining Excellence in the First College Year (2006) and Provingand Improving: Tools and Techniques for Assessing the First College Year(2004). He is a frequent speaker at national and international conferenceson institutional change, assessment, retention, and undergraduate studentsuccess. He serves on the editorial/review boards for the Journal of GeneralEducation, !e Journal on Excellence in College Teaching, and InnovativeHigher Education. For two decades prior to 1999, he held various leadershippositions at Appalachian State University in assessment, advising, UpwardBound, and Freshman Seminar. He holds a Ph.D. in Higher Education fromthe University of Georgia, MA and ED.S from Appalachian State University,and a B.A. in Psychology from the University of North Carolina – Charlotte.Randy began postsecondary education as a "rst-generation college studentat Davidson County Community College in Lexington, NC.
Christopher Coogan is Chief of Sta# and Director of the Data and Decisions®Academy at the Association for Institutional Research (AIR). He has oversight for contracts and grants, information technologies, and serves on the senior leadership team. In this role he leads the Association’s training programs for IR o$cers at two-year institutions, the national training program for IPEDS reporters, grants to support research and dissertations, and other AIR membership services. Previously, Christopher served as Asso-ciate Director of the University of Florida’s Institute of Higher Education and Assistant Editor of the Florida Journal of Educational Administration and Practice (FJEAP). In 2005, he was awarded the University of Florida’s Alumni Fellowship, its most prestigious, for doctoral studies in higher educa-tion. Christopher has an Associate of Arts in Accounting from Manatee Community College and Bachelor’s and Master’s of Accounting degrees from the University of Florida. In addition, he is a graduate student in UF’s Higher Education Administration program. Christopher is a frequent presenter at institutional research conferences and active in the Achieving the Dream initiative. His research focus is on the "eld of institutional research and the national capacity, especially at community colleges, to conduct meaningful institutional research.
Please cite as: Swing, R. L., & Coogan, C. S. (2010, May). Valuing assessment: Cost-benefit considerations. (Occasional Paper No. 5). Urbana, IL: University of Illinois and Indiana University, National Institute for Learning Outcomes Assessment (NILOA).
Contents
!e ideas and information contained in thispublication are those of the authors and donot necessarily re%ect the views of CarnegieCorporation of New York, Lumina Founda-tion for Education, or !e Teagle Foundation.
Abstract . . . 3Foreword . . . 4
Valuing Assessment: Cost-Bene!t Considerations . . . 5
What Counts?—Direct and Indirect Spending on Assessment . . . 6Are Assessment Costs Expenses or Investments? . . . 9How to Measure: Costs for Weighing the Pig . . . 9Conclusion . . . 18
References . . . 19Glossary of Terms . . . 20
NILOA National Advisory Panel . . . 21Mission . . . 21Occasional Paper Series . . . 21About NILOA . . . 22Sta# . . . 22Sponsors . . . 22
A b s t r a c t
Valuing Assessment: Cost-Bene!t Considerations
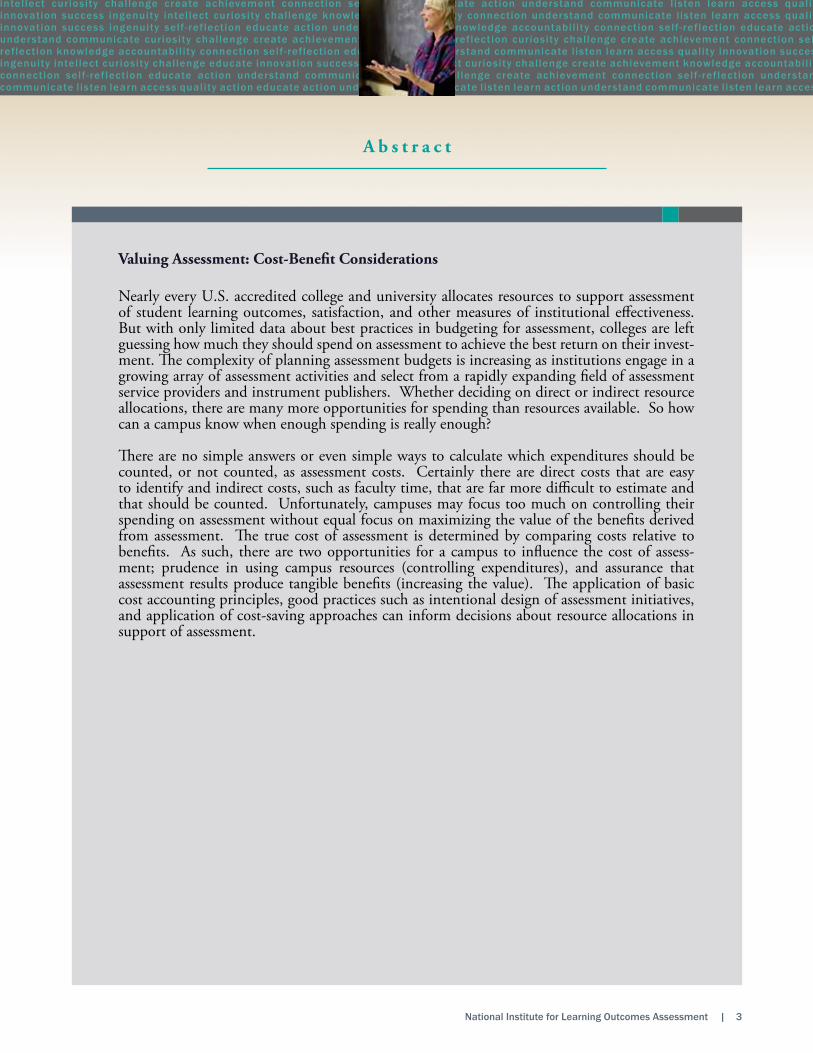
Nearly every U.S. accredited college and university allocates resources to support assessment of student learning outcomes, satisfaction, and other measures of institutional e#ectiveness. But with only limited data about best practices in budgeting for assessment, colleges are left guessing how much they should spend on assessment to achieve the best return on their invest-ment. !e complexity of planning assessment budgets is increasing as institutions engage in a growing array of assessment activities and select from a rapidly expanding "eld of assessment service providers and instrument publishers. Whether deciding on direct or indirect resource allocations, there are many more opportunities for spending than resources available. So how can a campus know when enough spending is really enough?
!ere are no simple answers or even simple ways to calculate which expenditures should be counted, or not counted, as assessment costs. Certainly there are direct costs that are easy to identify and indirect costs, such as faculty time, that are far more di$cult to estimate and that should be counted. Unfortunately, campuses may focus too much on controlling their spending on assessment without equal focus on maximizing the value of the bene"ts derived from assessment. !e true cost of assessment is determined by comparing costs relative to bene"ts. As such, there are two opportunities for a campus to in%uence the cost of assess-ment; prudence in using campus resources (controlling expenditures), and assurance that assessment results produce tangible bene"ts (increasing the value). !e application of basic cost accounting principles, good practices such as intentional design of assessment initiatives, and application of cost-saving approaches can inform decisions about resource allocations in support of assessment.

F o r e w o r d
As the saying goes, if you want to know what an institution values, follow the money. Over the past year, more people have become more interested in understanding to what ends institutional resources are being used as both public and private colleges and universities make do with less. Following the money has its own connotation when looking at the assessment landscape. While some categories of institutional expenditures are essential – faculty and sta# salaries, utilities, student "nancial aid and such – other expenditures are discretionary. Up until the past decade, assessment of student learning outcomes often fell into the latter category. But with unrelenting external pressure to provide evidence of student and institutional performance, the resources targeted to assessment activities now total non-trivial sums on many campuses. At the same time, campus administrators have been pretty much left up to their own devices to determine how much their institution should spend on various kinds of assessment approaches.
In this NILOA Occasional Paper, Randy Swing and Christopher Coogan examine the “what should assessment cost” question. It’s hard to imagine a duo with better credentials and perspectives to tackle the issue. Now the executive director of the Association for Institutional Research, Swing was a campus assessment coordinator for many years and later helped scores of campuses develop assessment schemes working with John Gardner and others at the Policy Center for the First Year Experience. Coogan’s work in "nancial a#airs in both the private and public sectors gives him a reality-tested perspective on how cost accounting can be used to understand what organizations spend on various activities and whether those expenditures are mission relevant. !e fusion of their conceptual understandings and front-line experiences produced a compelling, accessible analysis of what should be considered when estimating the costs of assessment. As Swing and Coogan point out early in the paper, the "eld does not have data showing what institu-tions spend on assessment and what they get for the investment. As a result, it’s not possible to suggest appropriate or desirable expenditure amounts for various assessment activities in di#erent types of institutional settings. Indeed, so little is known about actual assessment expenditures and bene"ts that any attempt to recommend what, for example, a small independent college should spend compared to a large university is an abstract exercise, intellectually interesting but possibly devoid of practical signi"cance.
But there are many other questions that when addressed can help faculty and sta# responsibly deter-mine whether resources should be devoted to certain assessment activities. Among the more important of these topics is fairly estimating the direct and indirect costs of assessment. Another is deciding what should and should not be included when calculating what student outcomes assessment actually costs. A third is if and when assessment can appropriately be considered an expense or an investment. !is naturally leads into a discussion of the bene"ts of assessment, a topic that eludes easy resolution. Even so, Swing and Coogan insightfully suggest helpful ways to think about this and related issues. We are grateful to Swing and Coogan for systematically unpacking what needs to be taken into account when allocating resources to the assessment of student learning outcomes. !e value of their contribu-tion will only increase over time as campus leaders and others more consistently account for the costs and bene"ts of assessment e#orts.
George D. KuhChancellor’s Professor and DirectorIndiana University Center for Postsecondary ResearchNILOA Director

Assessment in postsecondary education has come of age. Abstracts from assessment and institutional research conferences indicate that good practices in assessment have deepened and broadened as the array of measurement, data collection, and reporting tools has expanded and the scholarship of assessment has grown over the past two decades. Educators and policy makers are asking increasingly sophisticated questions about how best to address improvement and accountability goals in postsecondary education settings (Ewell, 2009). !ey also are asking whether institutional spending on assessment is really cost e#ective.
Only limited information exists on institutional spending on assessment. !e National Institute for Learning Outcomes Assessment (NILOA) found that campuses are undertaking a wide array of assessment activities and that most are doing so on a shoestring budget (Kuh & Ikenberry, 2009). Although the study did not capture detailed cost data, a corollary follows that demands are increasing at institutions for resources to mount these new and diverse assess-ments of student learning outcomes, satisfaction, and measures of institutional e#ectiveness.
It is tempting to call for a national study of spending on assessment, but even if such data existed it would lead to further questions about whether the resources were being used wisely. We hold that it is not how much institu-tions spend, but the ratio of their spending to the bene"ts gained that should be the focus of campus conversations about spending on assessment activities. In this paper we explore the cost-bene"t dynamic of assessment to provide a foundation for campus conversations about budgeting for, and investing in, assessment activities. Whether those assessments are conducted to meet accountability demands or for institutional improvement, the focus should remain on the relative bene"ts of the assessment activity. To do so requires good "nancial estimates of how much is spent (instruments, personnel time, technology support, etc.) and the value gained by the use of assessment results. Campuses must certainly make realistic budgeting decisions about assessment costs, and a lot of opportunities exist to spend on assessment activities. !e development of commercial assessment products and services—from survey instruments and data collection processes to analytics and report dissemina-tion software—has grown into a major industry in support of higher educa-tion. Higher education spending on assessment activities has clearly caught the eye of for-pro"t businesses, which have responded with data management, collection, and reporting systems as well as surveys and assessment instruments (Hutchings, 2009). Even organizations and companies that focus primarily on providing other educational support services are adding assessment compo-nents to their lines. Blackboard, a provider of course delivery software, for example, has added the “Blackboard Outcomes System” to collect electronic portfolios, manage surveys, and track standards of performance at the course level (Jaschik, 2007). Victor Borden (2010), in a project supported by the American Council on Education (ACE), the Association for Institutional Research (AIR), and NILOA, located over 250 assessment instruments and services speci"cally designed for purchase by higher education entities (see www.airweb.org/measuringquality).
It is not how much institutions spend, but the ratio of their spending to the bene!ts gained that should be the focus of campus conversations about spending on assessment activities.
Va l u i n g A s s e s s m e n t : C o s t - B e n e f i t C o n s i d e r a t i o n s
Randy L. Swing and Christopher S. Coogan

Concerns about the cost of assessment are not new. Noting that questions about cost were on the agenda of regional accreditation agencies as early as 1991—when NCA made the statement that assessment programs should be cost e#ective— Cecilia López (1999), former Associate Director of the Higher Learning Commission of the North Central Association of Colleges and Schools (NCA), said, “NCA has explained that by ‘cost-e#ective’ it means the program must be designed so that maximum information is gathered for the time and money given to all assessment sta$ng and activities” (p. 29). Early debates about whether campuses should devote resources to assessment activi-ties have largely been settled. Assessment is not an optional activity for region-ally accredited colleges and universities. Campuses must invest resources in assessment activities. But how much spending is enough?
We will explore this question by focusing on ways to determine the optimal balance of an institution’s spending on assessment (cost) and its return on investment (bene"t)—a dynamic that will vary for each institution at partic-ular points in time. !at state of balance lies between two undesirable states of imbalance: 1) a de"cient model with too little assessment conducted to be meaningful or 2) an excessive model with data collections and assessment "nd-ings that overwhelm the institution’s capacity to absorb and use them.
To that end, this paper does not de"ne a speci"c dollar amount that campuses should spend on assessment. In fact, at the base of the assessment movement is a rejection of input only or counting-based measures of quality such as the number of books in the library, the number of faculty with Ph.D.s, or the number of student applications (see Rogers, 1986, for example). To rank insti-tutions on the amount they spend on assessment would be tomfoolery. !is paper focuses, rather, on assessment cost as the ratio between the resources used and the bene"ts gained. We begin by applying standard "nancial metrics to the unique work of assessment—describing what to count (and not to count), how to classify what counts, how to measure what counts, and how to know when enough is enough. Finally, we provide guidance about how to control costs and improve the value of assessment results. At the end of the day, improving the cost side of the equation or the bene"t side can have drastic e#ects on the overall cost-bene"t ratio. Restated, while spending matters, it is equally important that the results gained yield a positive return on investment.
What Counts?—Direct and Indirect Spending on AssessmentAnswering “What counts?” is di$cult because colleges and universities seldom employ the activity-based costing systems that allow clear tracking of expenses for speci"c programs (Wellman, 2010). In the absence of the requisite knowl-edge, training, and/or accounting systems, there is little hope of determining the precise cost of assessment. !eoretically, it is possible to identify every direct and indirect cost associated with assessment, but the institutional resources that would be required to accomplish such accounting would be greater than the potential bene"t. Even with rough estimates of bene"ts derived from assessment e#orts and correspondingly rough estimates of expenditures, we can have enough precision to develop a useful measure of cost-bene"t.
!e di$culty of answering “What counts?” is compounded in that assess-ment is an educational activity without clean edges. Some assessments might rightly be considered feedback to students, a core aspect of good teaching, as well as measurement of student learning. Other assessments are based on data that must be collected and reported for other reasons (e.g., enrollments and completions by race and gender) but are also useful for measurement of student learning, satisfaction, and the impact of college experiences. And,
At the base of the assessment movement is a rejection of input only or counting-based measures of quality such as the number of books in the library, the number of faculty with Ph.D.s, or the number of student applications.

in terms of faculty development and training, there is considerable overlap between professional development in assessment concepts and good teaching/grading practices in general (e.g., use of multiple data sources and collection points).
In establishing the cost of an assessment program, Ewell and Jones (1986) proposed counting four categories of expenses: 1) instrument costs, 2) admin-istrative costs, 3) analysis costs, and 4) coordination costs (salaries/bene"ts and overhead). Picus (1994), building on lessons learned from K–12 testing programs, speci"es expenses associated with training and program evaluation as unique assessment cost categories. !e main focus in both sets of categories is on identifying direct costs—with the acknowledgment that indirect costs are signi"cant but di$cult to estimate.
!e State Council of Higher Education for Virginia (SCHEV) proposed a process to systematize accounting for assessment costs across institutions (Harper, 2009). Using a variation of the categories proposed by Ewell and Jones, SCHEV identi"ed "ve categories of direct costs: 1) instrument costs, 2) data analysis costs, 3) delivery costs, 4) software licensing costs, and 5) stipends for faculty or assistants. SCHEV also provided recommendations for establishing the indirect costs of assessment based on a portion of the cost associated with “loaning” an existing resource to an assessment activity. !e value of a loaned resource is largely determined by the amount of time the resource spends on assessment as a proportion of an annual salary (see further discussion later in this paper).
What IS NOT Included in an Assessment Cost Model?To answer “What counts?” the place to start may be to decide which expen-ditures are not worth the e#ort to quantify and should not be included in the cost model. Assessment’s opportunity costs, i.e., the value of activities that could be conducted if assessment is not pursued, are worth acknowledging but they are not worth calculating. !e absence of opportunity costs in this model should be noted only as a limitation—not a fatal %aw.
!is assessment cost model also does not include implementation costs. Ewell and Jones (1986) recommended that the cost of implementing improvement should be estimated. Certainly some assessment "ndings will call for addi-tional expenditures on improvements, but other "ndings might be addressed with little or no new resources. Still other "ndings may suggest eliminating certain activities, resulting in a budgetary gain.
Assessment is commonly assumed to be about "nding problems and then "xing them with new initiatives, but not all assessment activities create costs. Good assessments also identify e#ective practices already in place and guide educators in protecting and maintaining those practices—often with no new expenditures. Identifying and protecting e#ective practices can be as impor-tant a function of assessment as identifying and improving areas of weak-ness. No matter the outcome, the resources to implement assessment "ndings should be anticipated and assured even without implementation costs in the model.
Sunk costs—incurred expenditures that cannot be recovered—should not be included in the assessment cost model for current or future assessment e#orts. Postsecondary institutions often erroneously include these costs in their assess-ment decisions. Such costs are particularly relevant in assessment decisions about longitudinal data collections. Past costs associated with collection and storage of assessment data and/or unique systems designed to support longi-tudinal studies are examples of sunk costs in that they have no recoverable expenditures. More importantly, on many campuses there is an aversion to the perceived loss in ending existing practices, especially if there have been
Identifying and protecting e"ective practices can be as important a function of assessment as identifying and improving areas of weakness.
signi"cant past investments in them. In decisions about spending, a forma-tive evaluation of existing assessments should consider the future gain from continued expenditures rather than only considering the total of past expendi-tures. Particularly di$cult are decisions related to closing down a longitudinal data collection e#ort. Avoiding the “loss” of sunk costs is a poor reason to continue spending on assessments that are of questionable or declining useful-ness.
Lastly, the time-costs of administrators who use assessment "ndings for plan-ning and improvement should not be counted. Using assessment to inform institutional decisions is a normal part of campus decision making and not a unique assessment activity. Some of the highest paid college administrators are certainly frequent consumers of assessment "ndings, but their time should not be considered in estimating the cost of assessment.
What IS Included in an Assessment Cost Model?Direct costs should be counted in the total costs for assessment. !ese costs are often easy to identify although they are not always easy to isolate and recover from accounting records. Institutional expenses that clearly meet the de"nition of unique assessment expenditures can be traced to a voucher or procurement order and the direct payment to outside sources. Example purchases include
• surveys and tests• software and hardware for assessment tracking, scoring, and analysis• postage• student incentive awards• third-party scoring and/or reporting services• access to benchmarking/peer comparison data (for example, the
National Student Clearinghouse) It is unlikely that these direct costs have been assigned to a speci"c “assessment cost” account code, however they do exist in the institution’s general ledger and could be identi"ed as direct costs.
Personnel time—a signi"cant portion of both a university’s budget and assess-ment costs—should also be counted, although higher education accounting systems are not organized to answer questions about the full personnel costs of any particular activity (Jenny, 1996). A portion of faculty time committed to the assessment of student learning is often considered part of the normal instructional load and, therefore, not a unique assessment-related expendi-ture. When faculty are involved in managing assessment or assessment activi-ties aimed at institutional goals beyond their own classrooms or departments, however, their e#orts should be considered unique assessment expenditures. While most faculty would have some assessment-related time commitment, only a portion of them would be engaged in assessment oversight and admin-istration that should be included.
As a model, SCHEV (Harper, 2009) proposed that about 30% of an admin-istrator’s time is needed to conduct a campus-wide assessment of a learning outcome goal. Faculty time ranges in that model from 10%, if the faculty role is limited to consulting and advising; to 30%, if new/speci"c assessment instruments are developed by the campus; to 50%, for assessments requiring faculty evaluation of live performances, portfolio reviews, and other labor-intensive methods.
Using assessment to inform institutional decisions is a normal part of campus decision making and not a unique assessment activity.

!e time commitment of administrators and sta# involved in the direct management or conduct of assessment activities should also be included. We suggest that such units estimate the percentage of their yearly time devoted to assessment and that the equivalent costs be included as a percentage of the department’s personnel budget.
In addition to time, institutional cost for on-the-job professional development of faculty and sta# for assessment should be included in the cost model. !e most common of these costs are for sta# from faculty development centers and external consultants who provide workshops and planning assistance.
Another category of cost to monitor for the future is assessment costs trans-ferred to students. While still an infrequent occurrence, some institutions have required students to purchase clickers (used in classroom assessment tech-niques) and access to assessment instruments. !ese costs, while not captured by institutional records, are still part of the direct costs of assessment.
Are Assessment Costs Expenses or Investments?Is assessment spending an “expense” or an “investment?” !e "nance litera-ture de"nes an expense as a cost that delivers a short-lived bene"t and an investment as a cost that o#ers a long-term bene"t. Di#erentiating expenses from investments depends on the intentions for the spending and the life expectancy of the results.
If assessments fell neatly into the two paradigms of “accountability” or “improvement,” it would be reasonable to consider assessment for account-ability to be an expense and assessment for improvement to be an investment. Unfortunately, it was too common in past decades to use fear of the regional accrediting body as the driver for assessment—strengthening the view that assessment is an expense of getting over the once-every-ten-years accreditation hurdle.
Rather than viewing assessment as a dichotomy of either an investment or an expense, our view is that assessment spending is best construed as a point on a continuum of expenses and investments. For most institutions, assessments are not conducted solely for accreditation or purely for a long-term payo# in institutional improvement. As such, nearly all assessment activities are, to a degree, an investment in a hoped-for future return.
How to Measure: Costs for Weighing the PigCosts for assessment should be measured with a ruler rather than a microm-eter. !e goal is a practical model that is useful in determining when enough spending is enough. !is can be achieved by less than an absolutely full accounting of all resources used in support of assessment or all bene"ts gained.
An English farmer’s proverb proclaims, “You don’t fatten a pig by weighing it.” While polemics have applied the proverb to the assessment of student learning, by confusing means with ends it does not actually "t the context of assessment. !e focus should not be on weighing the pig but rather on using the information obtained to gain desired outcomes. !e relevant question for the weighing-the-pig analogy concerns how much we spend on the scale to weigh the pig in comparison to how much the information gathered in the weighing is worth. What is to be gained from a scale that is top of the line in terms of accuracy (reliability and validity)? Would a scale that produces the exactly correct weight 95% of the time, for example, be good enough? Because of the natural tendency to equate higher cost with higher quality, does purchasing an expensive scale increase the credibility of the results and
Nearly all assessment activities are, to a degree, an investment in a hoped-for future return.

the likelihood of their being used? At what level of cost can we be sure that assessment instrumentation and methodology are good enough?
Building on the assumptions of a centrally coordinated, paper-and-pencil-based assessment program (appropriate in 1986), Ewell and Jones (1986) developed sample budgets for four assessment programs. !eir four case studies showed annual assessment budgets of $29,200 to $130,000—varying by institution size and type of control. Checking their assumptions, they found they were within 15% of actual spending by a small sample of 11 institutions. Table 1, with amounts converted to 2010 dollars, summarizes their assumptions.
In considering assessment costs, Marc Chun (2006) posited an inherent tension between the three points of “better, cheaper, and faster,” such that movement toward any one of the three comes at the detriment of the other two. In other words, “faster” is unlikely to be “better” or “cheaper,” and “cheaper” is unlikely to be “better” or “faster.” Chun believes “better” should rule in assessment decisions since cheaper and faster are unlikely to produce results that have the greatest utility. Hutchings (2009), however, notes that many campuses are just getting around to developing quality assessment e#orts and are now under time constraints to move quickly. When campuses wait until they are under great pressure for assessment results (e.g., facing rea$rmation of accreditation or other external mandates), “better” and “cheaper” may not be real options. Delaying assessment, and thus being forced to play the “faster” game, will drive up costs – akin to the economics of deferred maintenance of a leaky roof that leads to more extensive emergency repairs later.
Table 1: 1985 Assessment Cost Estimates
1 !e costs for each of the categories for 1985 are pulled from the 4 case studies in !e Costs of Assessment (Ewell and Jones, 1986): Instru-ment - costs to develop and/or purchase survey instruments and to score the surveys; Admin. of Survey - costs to announce, administer, and mail surveys; Salaries and Bene"ts - costs for salaries and bene"ts of testing/measurement specialists, secretaries, and student workers; Overhead - costs for consulting visits (fee and travel), data analysis, reports, and o$ce expenses.2 !e costs for 2009 are calculated based on the Common Fund’s (www.commonfund.org) Higher Education Price Index (HEPI), which had a total increase of 164% between 1985 and 2009 (actual through 2008 and estimated for 2009), multiplied by the totals from Ewell and Jones, 1986
Postsecondary institutions vary in their willingness to intentionally use data to support decision making which in turn impacts how assessments are designed and conducted – especially the number of stakeholders involved in decisions about design.

!e “how much” question is only one part of the dynamic of determining when enough spending on assessment is really enough. !e far more impor-tant consideration is the cost-bene"t ratio of assessment. Considerations of cost must go beyond calculating the direct and indirect costs. An appropriate conversation would include consideration of the amount of return for the amount invested, classic return on investment "nancial analyses.
Answering the question of how much investment is “enough” means acknowl-edging that there is not one answer, nor a "xed answer that uniformly applies across higher education. Postsecondary institutions vary in their willingness to intentionally use data to support decision making which in turn impacts how assessments are designed and conducted – especially the number of stake-holders involved in decisions about design. As institutional leadership and opportunities for organizational change vary from year to year, institutional capacity to use assessment data to inform improvement will vary as well. For these reasons, decisions about resource allocations for assessment must include some degree of perennial decision-making.
Foundational to any discussion of resource allocation for assessment is the view that assessment is conducted with the intention of receiving bene"ts as a result of using resources. Whether assessments are viewed as investments or expenses, the reality is that resources are needed to support the growing array of assessment e#orts expected of American colleges and universities. As di$cult as it is to identify the full direct and indirect costs of assessment, the cost side of the return on investment calculation may be the easier problem to overcome.
!e bene"t side of the equation is more di$cult to calculate – especially when the focus is on learning outcomes rather than considerations that have "nan-cial outcomes for the institution such as student persistence to graduation. !ose of us who hold great passion for education are easily convinced that learning is priceless. But as economic pressures increase, postsecondary insti-tutions are increasingly "nding the need to choose some missions and educa-tional priorities over others. It is not just in assessment that we must learn how to assign value to our work in the absence of pro"t and loss statements.
It may be useful to look to actuarial sciences for guidance in determining the value of “priceless” attributes such as learning. Before rejecting the notion as ridiculous, consider your decision to purchase a life or accident insurance policy with accepted values for loss of human life, limb, eye, and ability - check your policy to see the values assigned. We acknowledge that placing a value on reading, writing, mathematical and other skills is di$cult, but cannot be written o# as impossible. For example, Cli# Aldeman’s (1999) "ndings show that continuous enrollment, completion of 20 credit hours in the "rst college year, and an increase in grade point average are predictive of higher rates of student success. Logically, the value of these benchmarks can be estimated for students or their institutions. When students are retained colleges receive the bene"t of their tuition or state funding associated with those individuals. And the individuals advance toward their degrees. Using the College Board’s estimate that a bachelor’s degree is worth approximately $300,000 more than the cost of the degree, a rough guess of the value for successful completion of a three hour course (approximately 2.5% of a bachelor’s degree) would be about $7,500 above the cost of the course (Baum & Ma, 2007). !e value of an assessment that increases the percentage of students earning credits could be based on the portion of the change attributable to that assessment, the amount of improvement observed, and the number of students a#ected. We posit that actuarial techniques can be employed, as these examples demonstrate, to develop standard estimates of the value of core educational metrics for indi-viduals, institutions, and the larger society.
Foundational to any discussion of resource allocation for assessment is the view that assessment is conducted with the intention of receiving bene!ts as a result of using resources.

With the improved ability to estimate costs and bene"ts, using the 2X2 deci-sion matrix becomes possible. A simple visual arrangement of assessment expenditures as low or high and of assessment bene"ts as low or high provides guidance about which assessment activities to continue and which to end. More importantly, it drives home the point that knowing the level of spending on assessment without also having a measure of its bene"ts results in an incom-plete calculation of assessment’s value.
If all we know is the amount of resources used in support of an assessment activity, we can easily be misled about the true cost of the e#ort. Likewise, a limited view of bene"ts as high or low can be misleading. In the standard use of the 2X2 decision matrix, the idea is to avoid future investments in high-cost/low-bene"t options, to reduce reliance on low-cost/low-bene"t activi-ties, and to steer investments toward low-cost/high-bene"t activities by only selecting a limited number of high-cost/high-bene"t activities. “Cheap” (low expenditure) is good only when it still reaps meaningful and useful assessment results (a wish seldom realized within the constraints of “better, cheaper, and faster”).
Focusing on Bene!ts!e irony of assessment cost-bene"t calculations is that the area most control-lable by an institution is the bene"t side of the equation. Nothing negatively impacts the cost-bene"t ratio more than collecting data that are never analyzed, failing to close the loop in implementing improvements, or engaging in “inter-esting questions” outside of the institution’s control. In such cases, costs are incurred but no bene"ts are gained. Controlling spending on assessment has less potential for improving the cost-bene"t dynamic than does assuring that assessment results are used to bene"t the institution directly (for example, by bringing gains in retention) or indirectly (for example, by improving students’ learning).
!e assessment focus of accrediting bodies has complicated the cost-bene"t calculation. !e huge bene"t (avoiding a negative consequence can be a bene"t) from gaining or renewing accreditation creates an arti"cially high value for any assessment conducted to meet accountability demands, even if it
Nothing negatively impacts the cost-bene!t ratio more than collecting data that are never analyzed, failing to close the loop in implementing improvements, or engaging in “interesting questions” outside of the institution’s control.

proves to have little or nothing to do with creating improvement. Resources spent on meeting accountability standards that do not also produce better learning and student success outcomes, however, are clearly missed opportuni-ties and costly.
In a NILOA-commissioned paper, Jane Wellman (2010) reviewed what is generally known about spending in higher education and the resulting cost-e#ectiveness of spending decisions. Finding a weak link between levels of spending and e#ectiveness, she posited that “intentionality matters as much as or more than money alone” (p. 16). Although there has been only limited research on college spending on assessment, it is reasonable to speculate that Wellman’s "ndings would apply to assessment as well as to teaching/learning and other areas of institutional performance. Assessment shares a common development process with many other institutional e#orts included in her study, such as those to improve the "rst year of college, in that each e#ort was
• launched despite a thin theoretical base• often initiated as a “grass roots” improvement e#ort by campus-based
advocates• started with few or no "nancial resources• “bolted-on” or marginal, rather than fully integrated• justi"ed as an investment as opposed to an expense• slowly institutionalized, even becoming formalized with line struc-
tures and budgets over timeFor these reasons, we suggest that how an institution spends its assessment dollars likely matters more than how much it spends. Building on that hypothesis, we present the following guiding principles as prompts for campus conversations about creating a balanced model of assessment costs.
Intentional Design Improves the Cost-E"ectiveness of AssessmentCost-e#ective assessments begin with a clearly de"ned purpose and intention-ally designed means to achieve the intended purpose. A starting place is to establish the degree to which the intended purpose is to inform improvement and/or address mandated accountability. Peter Ewell (2009) concludes that these two purposes are not a dichotomy, as suggested in the early literature on assessment, but rather a continuum on which an assessment may serve the two purposes to varying degrees simultaneously. Still, clarity about the intended outcomes of the assessment process is core to the intentional design of any assessment.
Assessment for improvement (Palomba & Banta, 1999; Suskie, 2009) has to 1) accurately evaluate the current state, 2) provide insight into what should be continued or changed to improve performance, and 3) motivate individuals to take action (Swing, 2004). In other words, assessment for improvement has to intentionally balance the scienti"c side of measurement and the polit-ical reality that being right—alone—does not always motivate individuals to change their behavior. To achieve a positive return on investment, assessment for improvement has to create action—either to change or to protect existing practices.
Intentional design should assure that the individuals with the power to initiate change "nd the assessment results credible. Take, for example, the challenge of assessing gains in writing skills. An inexpensive measure is a multiple choice test of grammar skills and writing strategies (e.g., CAAP and CollegeBASE, at $3.00–$4.00 per student; see Table 2 for details). A more expensive measure is a rubric-based evaluation of individual student writing samples (e.g., Colleg-eBASE and CAAP essay scoring at $13.50 per student). Because of the high
For these reasons, we suggest that how an institution spends its assessment dollars likely matters more than how much it spends.

correlation between grammar skills and other aspects of writing, the multiple choice test of writing arguably produces a reasonable proxy of writing skills. Measuring writing with a multiple choice test is counter-intuitive for many academics, and so, such assessment activities may produce little momentum to change existing practices. !e choice between essay-based assessment (high face-validity) and multiple-choice testing (low face-validity)—both of which produce useable information (bene"ts) about student writing skills—is not as simple as selecting the method with the least direct cost if the results of the less costly method are not motivating. Rather than focusing on direct cost, the true value proposition is best considered as a ratio of cost to bene"t. A change in either side of the equation changes the resulting ratio. Assessments whose results are not used have costs but no bene"ts, and the resulting ratio is still undesirable, regardless of whether the original “investment” was inexpensive.
Intentional design improves the cost-bene"t ratio by focusing on practices and conditions institutions control or can in%uence. Because educators are by nature intellectually curious, we have a tendency to pursue “interesting questions”; yet return on investment is undermined when assessments focus on matters that cannot be changed. Assessments that mostly measure input variables—entering students’ attitudes, behaviors, skills, and so forth—can easily address interesting research questions outside of institutional control. !ree questions that can help focus assessment e#orts on the potential return on investment are
• What would we do if we knew that X has an impact on our institu-tional goals for students? (Where X is the dependent variable of theassessment.)
• Who would care about the "nding? (Who would be willing to takeaction?)
• Does the institution have in%uence/control over X? (Could wechange it if we knew that doing so would improve learning andstudent success?)
#e choice between essay-based assessment (high face-validity) and multiple-choice testing (low face-validity)—both of which produce useable information (bene!ts) about student writing skills—is not as simple as selecting the method with the least direct cost if the results of the less costly method are not motivating.
Table 2: Examples of Prices for Assessment Instruments
Instrument and Company Sample Pricing
College BASE – University of Missouri
http://arc/missouri.edu/product_cbase.aspx*
Scoring of four multiple choice tests per students is $13.90 (subjects - English, mathematics, science, and social studies). Scoring of written essays costs $13.50 each.
CAAP – ACT, Inc.
www.act.org/caap/pdf/09PriceList.pdf*
Scoring of "ve multiple choice tests per students is $20.50 (subjects - reading, writing, mathematics, science, and critical thinking). Scoring of written essays costs $13.50 each.
CLA – Council for Aid to Education
http://cae.org/flagship-assessments-cla-cwra/cla/*
Cross-sectional administration of assessment to freshman (100 at beginning of fall term) and seniors (100 at end of spring term) in the same year costs $6,500.
Major Field Tests – ETS
www.ets.org* !e test and standard report for the online version administered to undergraduates costs $25 each (1-99 students tested).
NSSE – Indiana University, Bloomington
http://nsse.iub.edu/faq/ifaq.cfm#surveycost*
Survey costs $4,800 (including $300 participation fee) for an institution with 4,000 to 7,999 students (600 paper surveys or 2,400 web surveys).

Applying the questions above to each factor or survey prompt of a proposed assessment instrument can be eye opening when selecting an assessment instru-ment. Several popular assessment tools were originally developed for data collection by researchers to use in aggregated national research. It is surprising how often these instruments, especially those that collect signi"cant demo-graphic variables or attitudinal measures, contain elements of little interest at the campus-level. In terms of return on investment, the level of interest and ability to use assessment results by the department/campus/system paying for the assessment must take priority. Contributing to the higher education general knowledge base is commendable, but it is secondary among the assess-ment investments by colleges and universities.
#e Cost of Assessment Will Vary Over TimeAnecdotal evidence suggests that spending on assessment has varied over time within individual institutions. Unfortunately, this variance may be mostly attributable to the conducting of assessment in episodic cycles for the wrong reasons. Ramping up spending on assessment in the years immediately before reaccreditation is not the kind of variance we propose. Rather, we hold that there are natural cycles of best opportunities for campus improvement that determine the amount of assessment information that can be successfully used at a speci"c point in time. While an adequate base of spending on assessment would be expected as part of any e#ective, ongoing, and stable postsecondary institution, it is legitimate to expect that some spending should peak after signi"cant events such as the introduction of a new general education curric-ulum, the establishment of a new student a#airs program or academic policy, shifts in the entering characteristics of new students, or other signi"cant insti-tutional changes.
Most of the truly important improvements colleges desire—like gains in student learning, retention, and attributes for educated citizenship—do not happen overnight. Likewise, characteristics of entering students tend to change only incrementally over time. Whether assessments are intended to measure inputs or outcomes, there is little reason to believe that measuring the same constructs annually will provide important new information each year. An assessment plan of merit acknowledges the time it takes to create changes large enough to measure. It is di$cult to conceive of a reason to repeat an assess-ment every year unless a very active change strategy is being implemented. An assessment plan to measure progress intentionally at key points is a wiser investment than annual measurements (with their costs) conducted just to establish a stable, repeated cycle of spending and reporting.
#e False Economy of “Home Grown”Independence and autonomy are hallmarks of the academic life, but uniquely designed assessment instruments may not be cost-e#ective. Developing assess-ment instruments from scratch is time-consuming and demanding. A false economy of savings can develop if the cost of purchasing a commercially avail-able product is compared to a perceived “free” product developed locally. Of course, “free” is never so. Good assessment instruments undergo an iterative process of development, editing, pilot testing, statistical analysis, and produc-tion. Even if it has the resources to produce an outstanding assessment instru-ment, a campus has limited ability to consider its "ndings in the context of other institutions and student populations in the absence of benchmark or normative data. Data without clear contexts are di$cult to use in an account-ability or improvement paradigm. Anything that reduces the usability of results and does not increase the bene"ts derived from an assessment nega-tively impacts the cost-bene"t ratio.
An assessment plan to measure progress intentionally at key points is a wiser investment than annual measurements (with their costs) conducted just to establish a stable, repeated cycle of spending and reporting.

Use Existing Data FirstA basic tenet of cost-e#ective assessment is to use existing data "rst, if possible, rather than to undertake new data collection initiatives. !e value of using existing data is easily understood as a cost saving arrangement even though there are costs associated with "nding and cleaning existing data (Paulson & Siegel, 2003). Still, it is important to evaluate the degree to which data collected for another purpose is appropriate for double duty. It does not matter that data are available at low cost or no cost if these data discourage the institution from conducting a targeted assessment study or fail a face-validity test. As with much about assessment, it is rarely a case of all or nothing. Existing data from multiple sources can often be linked to reduce the size and cost of new data collection e#ort.
An additional cost-saving approach is to create additional opportunities for using data by adjusting how it is collected for its "rst use. For example, the placement tests given to new students at many institutions commonly produce three-level results used for placement: developmental, “regular,” or honors. !ese three broad categories may serve placement needs well, but they are not calibrated "nely enough to serve as a pretest for a later posttest measure of skills gained. A student who starts at the lowest end of placement into a regular college-level course may experience a great deal of growth and yet not achieve honors-level placement status. Rethinking this scale can change the usefulness—and raise the value—of placement data. Consider a placement test that has three levels within each of the three major categories, for a total of nine levels. !e "rst three placement positions may still de"ne placement at the developmental level, the fourth through sixth at the entry level for a regular college course, and the seventh through ninth for placement in an honors course. But the increased scale provides capacity to measure change within each placement category - which greatly improves the value of test scores as an assessment tool. It does so without limiting or reducing the original use of the data. It is often possible to develop additional levels of data with only limited additional cost, especially if the dual use is intentional from the start.
Sampling is cost e"ectiveTesting only some students carries a lower initial investment than testing all students. !e purpose of assessment determines if a sampling methodology can be su$cient or if whole population testing is required. For program-level and institution-wide assessments, total population testing (census sampling) will not improve precision of "ndings compared to a carefully crafted sample-based initiative. “…[A] representative sample can yield information that is almost as accurate as information from everyone” (Suskie 2009, p. 4). !e down side of sampling is that subgroups can be too small to provide useful information. !e decision to test the entire cohort to assure adequate size of subgroups, however, may be easier to make when using a multiple choice test of writing at under $5.00 per student than an essay writing test at $13.50 or more per student.
Returning to the earlier theme that assessments have to be believable to be successful in stimulating change, sampling can prove to be a barrier. !e assessment plan must be intentional and clear about how and why sampling is used. Assessment leaders must show that sampling produces a representative set of data. When sampling is used, anticipate the need for a thorough, user-friendly explanation of why the method was chosen, how it works, and what can (and cannot) be assumed from its results. While sampling saves on the costs of the instrument, it can increase the costs of analysis and reporting—because a sample never perfectly re%ects the total population. To help mini-mize these costs, think of defending an assessment methodology as providing a case of "ndings illustrating a preponderance of evidence. A convincing case can often be constructed using an array of demographic data comparing the sample respondents to the total population.
A basic tenet of cost-e"ective assessment is to use existing data !rst, if possible, rather than to undertake new data collection initiatives.

Sampling may reduce net costs, but it should not be assumed that it improves return on investment. Assessments are often a delicate blend of solid research methodology and political wisdom. If contention over the appropriateness of the sampling process reduces the believability of the results—and, thus, the use of them—then sampling can prove to be a poor cost-saving device in that it reduces the bene"t side of the cost-bene"t equation. In the end, decisions that focus a campus’s attention on the assessment methodology distract it from focusing on understanding and using the assessment results. Alternatives to whole-cohort testing include strati"ed sampling, assuring the adequate repre-sentation of identi"ed subgroups, and oversampling, testing a larger-than-needed sample to meet statistical standards and to increase “believability.”
Start-up Costs Will Be Greater #an Costs to Maintain Assessment E"orts!e past may not predict the future in terms of assessment costs for start-up operations. Initial investments are likely to be greater on the cost side and lighter on the bene"ts side of the cost-bene"t equation. During the start-up phase of most higher education initiatives, there are extra costs associated with initial research and development e#orts. A common “launch” e#ort in higher education includes professional development of key sta#—often in the form of travel to conferences and workshops, release-time for other activities, and books and webinars for additional information and training. !e value of investing in professional development as part of an assessment plan was documented in a 1999 study (López) of over 900 institutions accredited by the Higher Learning Commission, summarized in this statement: “Institu-tions that have been successful in educating their faculty about assessment have high rates of faculty involvement in the assessment program at both the institutional and departmental levels” (p. 17).
Because assessment crosses lines of faculty, sta#, and administration, it is common to "nd a large planning committee involved in a start-up e#ort and just as likely that the large committee will spend many hours deciding the scope and limits of assessment. !e combined costs of faculty and sta# time increase the cost of mounting an assessment e#ort, but the value of that crit-ical mass of support increases the potential bene"ts by assuring stakeholder investment in the process. Another common element among start-up assess-ment e#orts is the purchase of commercially available instruments—because doing so allows for a faster start than building instruments from scratch. For all these reasons, it is likely that initial start-up costs for assessment programs may require more spending than maintaining existing assessment operations.
Using our de"nition of cost, start-up assessment operations are initially likely to have a less-than-desirable cost-bene"t ratio. As assessment processes are institutionalized, however, and move from being “bolted on” accessories to normal elements of the institution’s education process, the cost-bene"t ratio should accordingly rebalance.
Some Assessments Will Fail to Produce Useable ResultsNot all investments, even in assessment, are proven by the test of time to be wise investments. Assessment technologies and tools will continue to evolve, and some of them will become obsolete or produce disappointing results. When considering an assessment e#ort it is important to remember that insti-tutions take informed risks about all kinds of other investments. Some of the assessments that many institutions risk undertaking will likely yield little useable information. !is possibility should be anticipated and not used as an example to prove that assessment “doesn’t work here.”
It is likely that initial start-up costs for assessment programs may require more spending than maintaining existing assessment operations.

Having permission to fail can stimulate the development of innovative and creative new assessment techniques. If they must minimize costs, however, institutions just ramping up assessment e#orts may "nd it safer to lean on the tried-and-true.
Conclusion!ere are no simple rules for determining how much a college or univer-sity should spend on assessment. Even for a single institution, the amount of assessment information that can be successfully consumed varies from year to year depending on the institution’s pace of innovation and change. Also, an institution’s needs related to the assessment’s level of precision and type of information change over time with the institution’s shifting strategic needs.Beyond the important function of monitoring the use of precious resources, there are other important reasons for campuses to study the costs and bene"ts of assessment. Good practice in assessment includes evaluating the process itself. For this purpose we posit two distinct components of evaluating the costs of assessment. !e "rst is a combination of basic accounting and estimating techniques. Quantifying the direct expenditures for assessment requires calculating spending on instruments, software, scoring, personnel time for administration, and management of assessment and other costs that can be speci"cally tracked to assessment processes. In addition, indirect costs such as faculty time for supporting assessment, building instruments, and participating in scoring as part of their duties are part of assessment expen-ditures. !e expenditures total, however, is only one side of the cost-bene"t equation.
Equally important is the second distinct component of evaluating the cost of assessment: determining the value of bene"ts gained from assessment—in institutional improvement, achievement of accreditation, or successfully meeting external mandates for accountability. !e value of a completed three-hour class as a portion of the life-long bene"t gained from earning a college certi"cate or degree could be estimated for individuals. Likewise, the bene"t to institutions from that class’s contribution to student persistence and to the larger society from another college graduate’s contributions can be quanti"ed and included in a cost-bene"t ratio. While assigning a price to a “priceless” education may seem crass, doing so makes it possible to determine whether spending on assessment is producing the desired level of return on investment.
An absence on either side of the cost-bene"t equation creates an incomplete model for establishing the true cost of assessment. Without information on the bene"t side, it is impossible to show whether higher expenditures are better or worse than lower expenditures. Without information on the cost side it is impossible to determine if the bene"t gained was worth the cost of achieving it.
Finally, acknowledging the need to be good stewards of resources, we propose that most assessment processes can bene"t from a careful review of expen-ditures and the use of cost-saving methods such as sampling and collecting enough—but not too much—data for analysis. Furthermore, the bene"t side of the equation can often be enhanced by assuring that data collected becomes data used. A full model, even if based on rough estimates and with some potential economic indicators purposefully excluded (e.g., opportunity costs), is the best test of the true cost of assessment. What ultimately matters most is not the amount spent on assessment but the amount gained compared to the amount spent. Colleges and universities can impact assessment’s cost-bene"t by improving their use of assessment and by deriving greater utility from their investments.
While assigning a price to a “priceless” education may seem crass, doing so makes it possible to determine whether spending on assessment is producing the desired level of return on investment.

References
Adelman, C. (1999). Answers in the tool box: Academic intensity, attendance patterns, and bachelor’s degree attainment. Washington, DC: U.S. Department of Education.
Baum, S., & Ma, J. (2007). Education pays: !e bene"ts of higher education for individuals and society (Trends in Higher Education Series). Washington, DC: College Board.
Borden, V. (2010). Measuring quality in higher education: An inventory of instruments, tools and resources. Retrieved from www.airweb.org/measuringquality
Chun, M. (2006). Faster, better, cheaper: !e iron triangle of higher education assessment. New York, NY: Council for Aid to Education. Retrieved from http://www.cae.org/content/pdf/FasterBetterCheaperChun.pdf
Ewell, P. T. (2009, November). Assessment, accountability, and improvement: Revisiting the tension (NILOA Occasional Paper No.1). Urbana, IL: University of Illinois and Indiana University, National Institute for Learning Outcomes Assessment.
Ewell, P. T., & Jones, D. P. (1986). !e costs of assessment. In C. Adelman (Ed.), Assessment in American higher education: Issues and contexts (pp. 33–46). Washington, DC: U.S. Department of Education, O$ce of Educational Research and Improvement.
Jaschik, S. (2007). !e new assessment market. www.insidehighered.com, January 17, 2007. Harper, V.B. Jr. (2009). Virginia’s value added: A diverse system perspective. Assessment Update. Vol 21. Issue 4.Hutchings, P. (2009, May/June). !e new guys in assessment town. Change, 41(3), 26–33. Retrieved from http://www.
changemag.org/May-June 2009/full-assessment-town.htmlJenny, H. H. (1996). Cost accounting in higher education: Simpli"ed macro- and micro-costing techniques. Washington,
DC: National Association of College and University Business O$cers.Kuh, G. D., & Ikenberry, S. O. (2009, October). More than you think, less than we need: learning outcomes assessment
in American higher education. Urbana, IL: University of Illinois and Indiana University, National Institute for Learning Outcomes Assessment.
López, C. L. (1999). A decade of assessing student learning: What we have learned; What’s next? Retrieved from http://www.ncahlc.org/download/annualmeeting/archive/ASSESS10.PDF
Palomba, C. A., & Banta, T. W. (1999). Assessment essentials: Planning, implementing, and improving assessment in higher education. San Francisco, CA: Jossey-Bass.
Paulson, K., & Siegel, M. (2003). Data audit and analysis toolkit to support assessment of the "rst college year. Boulder, CO: National Center for Higher Education Management Systems.
Picus, L.O. (1994). A conceptual framework for analyzing the costs of alternative assessment. Los Angeles, CA: University of Southern California, National Center for Research on Evaluation, Standards, and Student Testing.
Rogers, J. T. (1986). !e new criteria for accreditation. In C. Fincher, L. G. Jones, & J. Placek (Eds.), Higher education in Georgia: Assessment, evaluation, and accreditation (Proceedings of the conference, Athens, GA, January 15 -16, 1986.
Suskie, L.A. (2009). Assessing student learning: A common sense guide (2nd Edition). San Francisco, CA: Jossey-Bass.Swing, R.L. (Ed.). (2004). Proving and improving: volume II: Tools and techniques for assessing the "rst college year
(Monograph No. 37). Columbia, SC: University of South Carolina, National Resource Center for !e First-Year Experience and Students in Transition.
Wellman, J.V. (2010). Connecting the dots between learning and resources. (NILOA Occasional Paper No.3). Urbana, IL: University of Illinois and Indiana University, National Institute for Learning Outcomes Assessment.

Glossary of Terms
activity-based costing – an accounting model that identi"es activities in an organization and assigns the resource cost (direct and indirect) of each activity to products and services according to the actual consumption by each.
cost - monetary value of expenditures for supplies, services, labor, products, equipment, and other items purchased for use. In economics, a cost is an alternative that is given up as a result of a decision.
cost-bene"t – the comparison of the monetary cost of an intervention compared to the monetary bene"t of the intervention’s outcome.
cost-e#ectiveness – a measure of e$ciency typically used when a particular bene"t is di$cult (or insensitive) to quantify. !e ratio of the cost (in monetary value) of an intervention is compared to a relevant measure of its outcome or e#ect.
direct cost – costs for activities or services that bene"t speci"c projects and are easily traced to speci"c projects.
expenditures – a payment or the promise of a payment.expenses - a cost that delivers a short-lived bene"t.indirect cost – costs for activities or services that bene"t more than one project and are di$cult or impossible
to trace to a speci"c project.investments – a cost that o#ers a long-term bene"t.opportunity cost - the value of other activities that could be conducted if a particular activity was not
pursued.return on investment – the ratio of money (or value) gained or lost on an investment compared to the
amount money (or value) invested.sunk cost - an incurred expenditure that cannot be recovered.value proposition – a quanti"ed analysis where value equals the bene"ts (less the costs) that an entity can
deliver to its customers.

NILOA National Advisory Panel
NILOA Mission
NILOA’s primary objective is to discover and disseminate ways that academic programs and institutions can productively use assessment data internally to inform and strengthen undergraduate education, and exter-nally to communicate with policy makers, families and other stake-holders.
NILOA Occasional Paper Series
NILOA Occasional Papers are commissioned to examine contemporary issues that will inform the academic community of the current state-of-the art of assessing learning outcomes in American higher education. !e authors are asked to write for a general audience in order to provide comprehensive, accurate information about how institutions and other organizations can become more pro"cient at assessing and reporting student learning outcomes for the purposes of improving student learning and responsibly ful"lling expectations for transparency and accountability to policy makers and other external audiences.
Comments and questions about this paper should be sent to [email protected].
Trudy W. BantaProfessor Indiana University-Purdue University Indianapolis
Douglas C. BennettPresident Earlham College
Robert M. BerdahlPresident Association of American Universities
Molly Corbett BroadPresident American Council on Education
Judith EatonPresident Council for Higher Education Accreditation
Richard EkmanPresident Council of Independent Colleges
Joni FinneyPractice Professor University of Pennsylvania
Vice President, National Center for Public Policy and Higher Education
Susan JohnstonExecutive Vice President Association of Governing Boards
Paul LingenfelterPresident State Higher Education Executive O#cers
George Meha"y Vice PresidentAcademic Leadership and ChangeAmerican Association of State Colleges and Universities
Margaret MillerProfessor University of Virginia
Charlene NunleyProgram DirectorDoctoral Program in Community College Policy and AdministrationUniversity of Maryland University College
Randy SwingExecutive Director Association for Institutional Research
Carol Geary SchneiderPresident Association of American Colleges and Universities
David ShulenburgerVice President Association of Public and Land-Grant Universities
Belle WheelanPresident Southern Association of Colleges and Schools
George WrightPresidentPrairie View A&M University
Ex-O$cio MembersPeter EwellVice PresidentNational Center for Higher Education Management Systems
Stanley IkenberryInterim President University of Illinois
George KuhChancellor’s ProfessorIndiana University

About NILOA
• !e National Institute for Learning Outcomes Assessment (NILOA) was established in December 2008.
• NILOA is co-located at the University of Illinois and Indiana Univer-sity.
• !e NILOA web site went live on February 11, 2009. www.learningoutcomesassessment.org
• !e NILOA research team reviewed 725 institution web sites for learning outcomes assessment transparency from March 2009 to August 2009.
• One of the co-principal NILOA investigators, George Kuh, founded the National Survey for Student Engagement (NSSE).
• !e other co-principal investigator for NILOA, Stanley Ikenberry, was president of the University of Illinois from 1979 to 1995 and of the American Council of Education from 1996 to 2001. He is currently serving as Interim President of the University of Illinois.
• Peter Ewell joined NILOA as a senior scholar in November 2009.
NILOA Sta"
NATIONAL INSTITUTE FOR LEARNING OUTCOMES ASSESSMENT
Stanley Ikenberry, Co-Principal Investigator
George Kuh, Co-Principal Investigator and Director
Peter Ewell, Senior Scholar
Staci Provezis, Project Manager
Jillian Kinzie, Associate Research Scientist
Jason Goldfarb, Research Analyst
Natasha Jankowski, Research Analyst
Gloria Jea, Research Analyst
Julia Makela, Research Analyst
NILOA Sponsors
Carnegie Corporation of New York
Lumina Foundation for Education
#e Teagle Foundation