9feb12 - parkson initiate
TRANSCRIPT
DMG & Partners Securities Pte Ltd may have received compensation from the company(s) covered in this report for its corporate finance or its dealing activities; this report is therefore classified as a non-independent report. Please refer to important disclosures at the end of this publication. of this publication
1 See important disclosures at the end of this publication
DMG Research
DMG Research
OSK Research
OSK Research DMG Research
February 9, 2012
SINGAPORE EQUITYInvestment Research
DMG & Partners Research Initiation of coverage Private Circulation Only
CONSUMER
Melissa Yeap +65 6232 3897 [email protected]
PARKSON RETAIL ASIA NEUTRAL
Price SS$1.52
Terence Wong, CFA +65 6232 3896 terence.wong@ sg.oskgroup.com
Previous n/a
Target SS$1.50
Retail
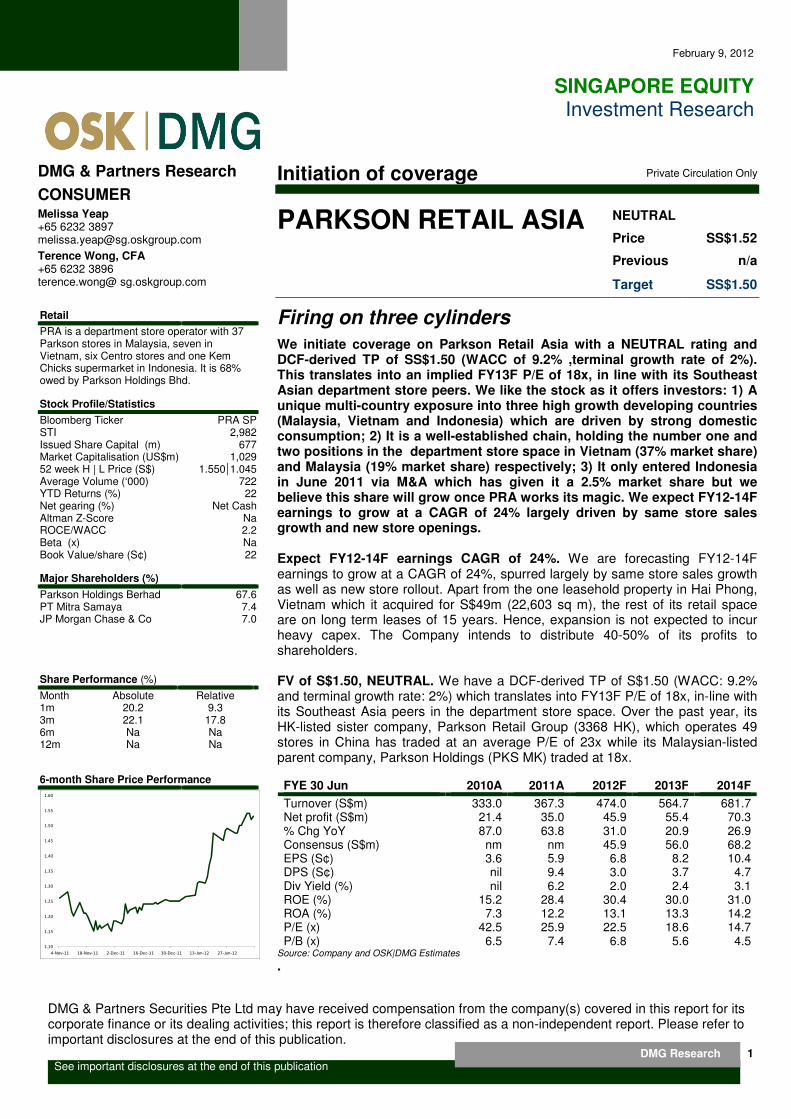
PRA is a department store operator with 37 Parkson stores in Malaysia, seven in Vietnam, six Centro stores and one Kem Chicks supermarket in Indonesia. It is 68% owed by Parkson Holdings Bhd. Stock Profile/Statistics Bloomberg Ticker PRA SP STI 2,982 Issued Share Capital (m) 677 Market Capitalisation (US$m) 1,029 52 week H | L Price (S$) 1.550 1.045 Average Volume (‘000) 722 YTD Returns (%) 22 Net gearing (%) Net Cash Altman Z-Score Na ROCE/WACC 2.2 Beta (x) Na Book Value/share (S¢) 22 Major Shareholders (%) Parkson Holdings Berhad 67.6 PT Mitra Samaya 7.4 JP Morgan Chase & Co 7.0
Share Performance (%) Month Absolute Relative 1m 20.2 9.3 3m 22.1 17.8 6m Na Na 12m Na Na 6-month Share Price Performance
Firing on three cylinders
We initiate coverage on Parkson Retail Asia with a NEUTRAL rating and DCF-derived TP of SS$1.50 (WACC of 9.2% ,terminal growth rate of 2%). This translates into an implied FY13F P/E of 18x, in line with its Southeast Asian department store peers. We like the stock as it offers investors: 1) A unique multi-country exposure into three high growth developing countries (Malaysia, Vietnam and Indonesia) which are driven by strong domestic consumption; 2) It is a well-established chain, holding the number one and two positions in the department store space in Vietnam (37% market share) and Malaysia (19% market share) respectively; 3) It only entered Indonesia in June 2011 via M&A which has given it a 2.5% market share but we believe this share will grow once PRA works its magic. We expect FY12-14F earnings to grow at a CAGR of 24% largely driven by same store sales growth and new store openings. Expect FY12-14F earnings CAGR of 24%. We are forecasting FY12-14F earnings to grow at a CAGR of 24%, spurred largely by same store sales growth as well as new store rollout. Apart from the one leasehold property in Hai Phong, Vietnam which it acquired for S$49m (22,603 sq m), the rest of its retail space are on long term leases of 15 years. Hence, expansion is not expected to incur heavy capex. The Company intends to distribute 40-50% of its profits to shareholders. FV of S$1.50, NEUTRAL. We have a DCF-derived TP of S$1.50 (WACC: 9.2% and terminal growth rate: 2%) which translates into FY13F P/E of 18x, in-line with its Southeast Asia peers in the department store space. Over the past year, its HK-listed sister company, Parkson Retail Group (3368 HK), which operates 49 stores in China has traded at an average P/E of 23x while its Malaysian-listed parent company, Parkson Holdings (PKS MK) traded at 18x. FYE 30 Jun 2010A 2011A 2012F 2013F 2014F Turnover (S$m) 333.0 367.3 474.0 564.7 681.7 Net profit (S$m) 21.4 35.0 45.9 55.4 70.3 % Chg YoY 87.0 63.8 31.0 20.9 26.9 Consensus (S$m) nm nm 45.9 56.0 68.2 EPS (S¢) 3.6 5.9 6.8 8.2 10.4 DPS (S¢) nil 9.4 3.0 3.7 4.7 Div Yield (%) nil 6.2 2.0 2.4 3.1 ROE (%) 15.2 28.4 30.4 30.0 31.0 ROA (%) 7.3 12.2 13.1 13.3 14.2 P/E (x) 42.5 25.9 22.5 18.6 14.7 P/B (x) 6.5 7.4 6.8 5.6 4.5
Source: Company and OSK|DMG Estimates
.
1.10
1.15
1.20
1.25
1.30
1.35
1.40
1.45
1.50
1.55
1.60
4-Nov-11 18-Nov-11 2-Dec-11 16-Dec-11 30-Dec-11 13-Jan-12 27-Jan-12

See important disclosures at the end of this publication 2
See important disclosures at the end of this publication
DMG Research
OSK Research
OSK Research DMG Research
TABLE OF CONTENTS
Company description 3 Products/merchandise 7 Retail Network 9 Use of IPO Proceeds 11 Investment Merits 12 Investment Risks 17 Earnings Outlook 18
Valuation 22
Peer Comparison 25
APPENDICES: Appendix 1: Department Store Industry Outlook: Malaysia 26 Appendix 2: Department Store Industry Outlook: Vietnam 28 Appendix 3: Department Store Industry Outlook: Indonesia 30 Appendix 4: Management Profile 32 Financial Tables 33 Disclaimer 34
See important disclosures at the end of this publication 3
See important disclosures at the end of this publication
DMG Research
OSK Research
OSK Research DMG Research
COMPANY DESCRIPTION
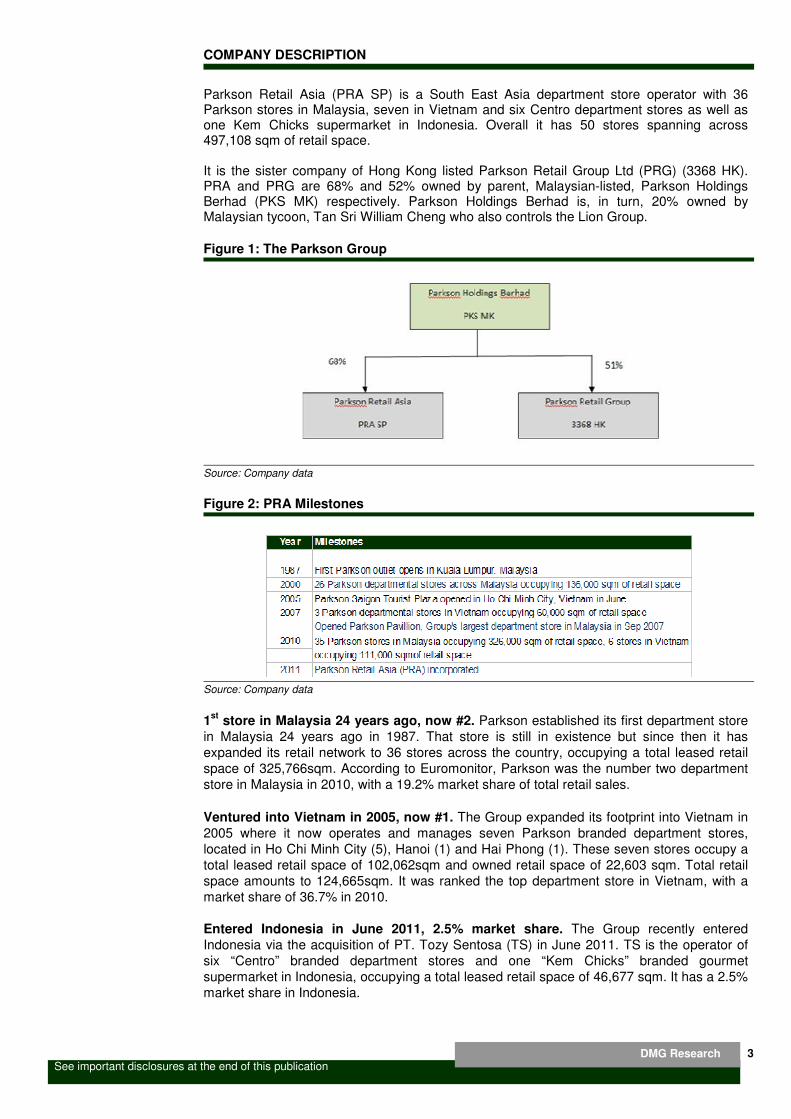
Parkson Retail Asia (PRA SP) is a South East Asia department store operator with 36 Parkson stores in Malaysia, seven in Vietnam and six Centro department stores as well as one Kem Chicks supermarket in Indonesia. Overall it has 50 stores spanning across 497,108 sqm of retail space. It is the sister company of Hong Kong listed Parkson Retail Group Ltd (PRG) (3368 HK). PRA and PRG are 68% and 52% owned by parent, Malaysian-listed, Parkson Holdings Berhad (PKS MK) respectively. Parkson Holdings Berhad is, in turn, 20% owned by Malaysian tycoon, Tan Sri William Cheng who also controls the Lion Group.
Figure 1: The Parkson Group
Source: Company data
Figure 2: PRA Milestones
Source: Company data
1st
store in Malaysia 24 years ago, now #2. Parkson established its first department store in Malaysia 24 years ago in 1987. That store is still in existence but since then it has expanded its retail network to 36 stores across the country, occupying a total leased retail space of 325,766sqm. According to Euromonitor, Parkson was the number two department store in Malaysia in 2010, with a 19.2% market share of total retail sales.
Ventured into Vietnam in 2005, now #1. The Group expanded its footprint into Vietnam in 2005 where it now operates and manages seven Parkson branded department stores, located in Ho Chi Minh City (5), Hanoi (1) and Hai Phong (1). These seven stores occupy a total leased retail space of 102,062sqm and owned retail space of 22,603 sqm. Total retail space amounts to 124,665sqm. It was ranked the top department store in Vietnam, with a market share of 36.7% in 2010. Entered Indonesia in June 2011, 2.5% market share. The Group recently entered Indonesia via the acquisition of PT. Tozy Sentosa (TS) in June 2011. TS is the operator of six “Centro” branded department stores and one “Kem Chicks” branded gourmet supermarket in Indonesia, occupying a total leased retail space of 46,677 sqm. It has a 2.5% market share in Indonesia.

See important disclosures at the end of this publication 4
See important disclosures at the end of this publication
DMG Research
OSK Research
OSK Research DMG Research
Overall 50 stores across 497,108sqm. PRA operates 49 departmental stores and one gourmet supermarket across Malaysia, Vietnam and Indonesia. Figure 3: Summary of Store Network
Source: Company data * Indonesia includes the gourmet supermarket The following maps show the geographic distribution of its stores in Malaysia, Vietnam and Indonesia. Figure 4: Parkson’s 37 stores in Malaysia
Source: Company data

See important disclosures at the end of this publication 5
See important disclosures at the end of this publication
DMG Research
OSK Research
OSK Research DMG Research
Figure 5: Parkson’s 7 stores in Vietnam
Source: Company data
Figure 6: Parkson’s 7 stores in Indonesia
Source: Company data

See important disclosures at the end of this publication
See important disclosures at the end of this publication
Figure 7: FY11 revenue breakdown by
Source: Company data
Malaysia: Still home base. forward we still expect Malaysia to be its main earnings contributor. Figure 8: FY09
Source: Company data
0
50
100
150
200
250
300
350
400
S$m
See important disclosures at the end of this publication
See important disclosures at the end of this publication
: FY11 revenue breakdown by country
Company data
Malaysia: Still home base. The Group derives ~80% of sales from Malaysia and going forward we still expect Malaysia to be its main earnings contributor.
: FY09-FY11 revenue growth
Company data
Malaysia, 87%
Vietnam, 12%
Indonesia, 1%
FY09 FY10
262.8 293.5
320.9
37.4 39.4
2year revenue CAGR of 11%
6
DMG Research
OSK Research
OSK Research DMG Research
The Group derives ~80% of sales from Malaysia and going forward we still expect Malaysia to be its main earnings contributor.
Malaysia, 87%
FY11
320.9
42.4
4.0
Malaysia
Vietnam
Indonesia

See important disclosures at the end of this publication 7
See important disclosures at the end of this publication
DMG Research
OSK Research
OSK Research DMG Research
Products/Merchandise Parkson offers a wide range of merchandise in its departmental stores. The Group categorises them into four categories. Merchandise sales make up ~96% of revenues.
� Fashion and apparel
� Cosmetics and accessories
� Household, electrical goods and others
� Groceries and perishables Figure 9: Merchandise sold in FY11
Source: Company data
Merchandise are sold via two avenues: direct sales and through concessionaires. Direct sales For direct sales, the Group basically sources and sells its own direct-purchase merchandise. Most of its direct sales includes sales in its “household, electrical goods and other” and “groceries and perishables” product categories as well as cosmetic products in Malaysia. Concessionaire sales The Group enters into concessionaire agreements with certain suppliers (known as concessionaires) who display and sell their products in designated areas in its stores. Concessionaires are responsible and bear the expenses for the design, display and fitting out of their counters as well as for repair and maintenance while the Group provide general facilities such as lighting, air conditioning as well as customer service training to the concessionaire’s sales staff to ensure certain standards are met. “Fashion and apparels” and “cosmetics and accessories” account for the bulk of concessionaire sales except in the case of Malaysia where cosmetics are sold under direct sales.
Fashion & apparel
55%Cosmetics & accessories
27%
Household14%
Grocerries3%

See important disclosures at the end of this publication 8
See important disclosures at the end of this publication
DMG Research
OSK Research
OSK Research DMG Research
A standard concessionaire agreement will specify the type of product to be sold as well as price points. Concessionaires are not allowed to alter their product mix nor price their products in the Group’s stores higher than elsewhere in the same country. Agreements are subject to yearly renewals. A turnover commission in the form of a percentage of sales is agreed upon and charged on concessionaires, typically based on a agreed minimum commission amount which is determined by a minimum sales target. The minimum commission amount typically ranges from 15%-30% (excluding groceries and perishable goods) depending on the type of product. Sales from concessionaire sales are collected by the Group and then paid out to concessionaires according to their respective credit terms after deduction of relevant expenses, fees and commissions. The Group also collects certain other fees from concessionaires that include promotional, administration, credit card handling and loyalty programme fees. Vietnam has a higher portion of concessionaire sales. Between Malaysia and Vietnam, Vietnam has a higher percentage of concessionaire sales at 96%:4% vs Malaysia’s 75%:25%. The table further breaks down merchandise sales for the respective countries including Indonesia. Figure 10: Breakdown in Merchandise Sales for 3 Countries
Source: Company data
Concessionaire sales: ~25% of merchandise sales. The Group generated merchandise sales of S$659.9m, S$767.5m and S$851.6m in 2009, 2010 and 2011 of which proceeds from concessionaire sales amounted to S$497.3m, S$598.3m and S$671.1m accounting for 25.4%, 25.0% and 25.3% of revenues respectively. Rental income: Derived from subleasing certain designated areas of its stores to restaurants, fast food outlets, salons, supermarkets and photo shops; and
Consultancy and management service fees: Derived from its three managed stores in Ho Chi Minh City, Vietnam that it manages
Stated in S$m S$ % S$ % S$ % S$ %
Malaysia
-Concessionaire sales 382.0 71% 467.8 74% 528.4 75% 528.4 75%
-Direct sales 157.8 29% 164.1 26% 173.5 25% 173.5 25%
-Subtotal 539.9 100% 631.9 100% 701.9 100% 701.9 100%
Vietnam
-Concessionaire sales 115.3 96% 130.4 96% 134.6 96% 134.6 96%
-Direct sales 4.8 4% 5.1 4% 5.4 4% 5.4 4%
-Subtotal 120.1 100% 135.5 100% 139.9 100% 139.9 100%
Indonesia
-Concessionaire sales 8.1 82% 84.0 81%
-Direct sales 1.7 18% 20.0 19%
-Subtotal 9.8 100% 104.0 100%
TOTAL 659.9 767.5 851.6 945.8
Note:
- Only commissions on concessionaire sales form part of reported revenue. Total concessionaire sales above is for ref only
- Merchandise sales for TS is for full year financial year 2011 including period prior to acquisition on 9 June 2011
2009 2010 2011 2011 (includes TS)

See important disclosures at the end of this publication 9
See important disclosures at the end of this publication
DMG Research
OSK Research
OSK Research DMG Research
RETAIL NETWORK
MALAYSIA
� 36 department stores
� Total retail space of 325,766 sq m
Figure 11: Retail Network in Malaysia
Source: Company data

See important disclosures at the end of this publication 10
See important disclosures at the end of this publication
DMG Research
OSK Research
OSK Research DMG Research
VIETNAM
� 7 department stores
� Total retail space of 124,665 sq m
� Spent ~S$49m to acquire leasehold property in Hai Phong with space of 22,603 sq m
Figure 12: 7 Outlets in Vietnam
Source: Company data
INDONESIA
� Entered market via acquisition of PT Satozy Sentosa (TS) in June 2011 � TS operates the six Centro branded departmental stores and one Kem Chicks
supermarket in Indoensia.
Figure 13: 7 Outlets in Indonesia
Source: Company data
2-3 years for a store to turn profitable. On average, it takes between 2-3 years for a new store to turn profitable. As a store matures, sales per sqm will rise.
"Centro" brand
1 Plaza Semanggi Nov 2003 8 7,305 Jakarta
2 Discovery Shopping Mall Dec 2004 7 7,501 Kuta, Bali
3 Margo City Mall Mar 2006 5 6,402 Greater Jakarta
4 Ambarrukmo Plaza Jun 2006 5 7,045 Yogyakarta
5 Mall of Indonesia Sep 2008 3 9,232 North Jakarta
7 Galaxy Mall Aug-11 7,572 Surabaya
"Kem Chicks" brand
7 Pacif ic Place Nov 2007 1,620 Jakarta
Total floor space 46,677
No Indonesia StoresDate
Commenced
Age
(Years)
Retail space
(sqm)City

See important disclosures at the end of this publication 11
See important disclosures at the end of this publication
DMG Research
OSK Research
OSK Research DMG Research
Use of IPO Proceeds With an IPO offer price of S$0.94 per share, the Group generated net proceeds of S$69.2m, which has been earmarked for the following purposes:
� ~S$60m (US$48.8m) or 79.8 cents for each S$1 of gross proceeds will be for new store openings in Malaysia, Indonesia, Vietnam and Cambodia;
� ~S$5m (US$4.1m) or 6.6 cents for each S$1 of gross proceeds will be for IT investment and
� ~S$4.2m (US$3.4m) or 5.6 cents for each S$1 will be for maintenance capital
expenditure in Malaysia, Vietnam and Indonesia. Capex will be on new stores and refurbishments. Capex for FY12 will be approximately S$41m, comprising S$16m for existing stores and S$20m for new stores and S$5m for IT investment. Capex for FY13 is projected to be S$45m, comprising S$5m for existing stores and S$40m for new stores. We estimate capex to range at a similar amount for FY14. Capital expenditure for new stores varies by country. In Indonesia it is higher at US$2-3m while in Malaysia and Vietnam cost are on par and lower at US$1-2m per store.
See important disclosures at the end of this publication 12
See important disclosures at the end of this publication
DMG Research
OSK Research
OSK Research DMG Research
INVESTMENT MERITS
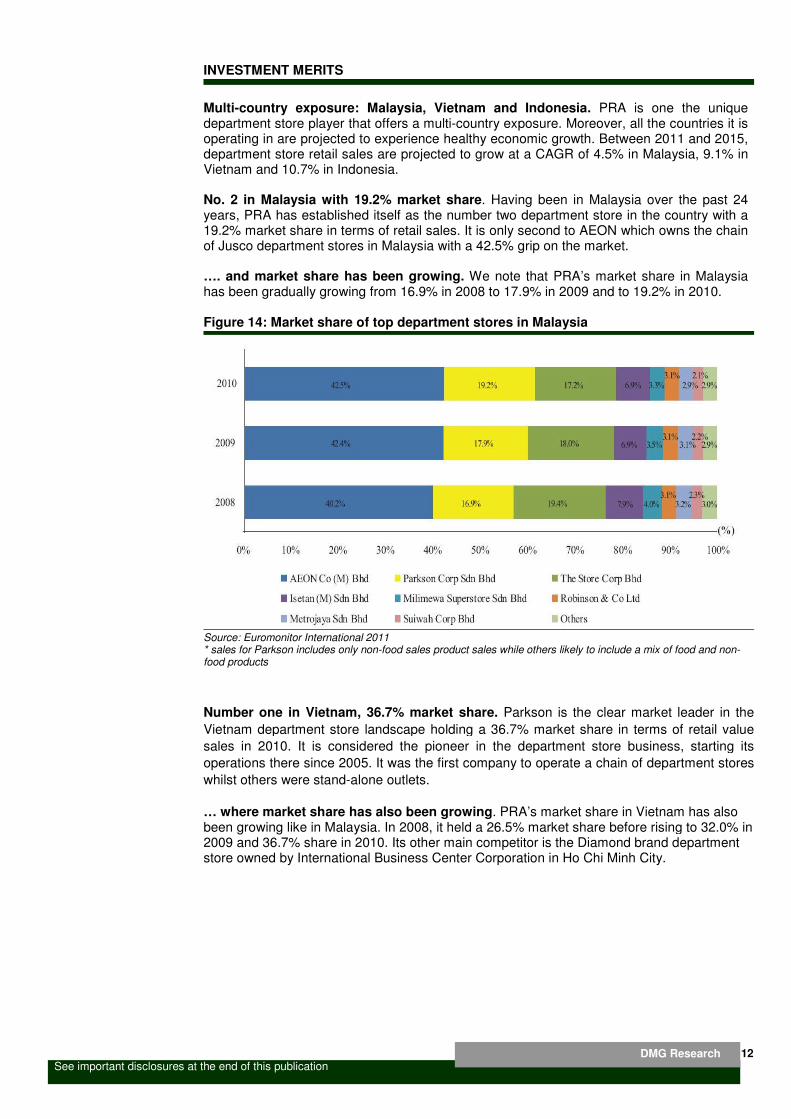
Multi-country exposure: Malaysia, Vietnam and Indonesia. PRA is one the unique department store player that offers a multi-country exposure. Moreover, all the countries it is operating in are projected to experience healthy economic growth. Between 2011 and 2015, department store retail sales are projected to grow at a CAGR of 4.5% in Malaysia, 9.1% in Vietnam and 10.7% in Indonesia. No. 2 in Malaysia with 19.2% market share. Having been in Malaysia over the past 24 years, PRA has established itself as the number two department store in the country with a 19.2% market share in terms of retail sales. It is only second to AEON which owns the chain of Jusco department stores in Malaysia with a 42.5% grip on the market. …. and market share has been growing. We note that PRA’s market share in Malaysia has been gradually growing from 16.9% in 2008 to 17.9% in 2009 and to 19.2% in 2010. Figure 14: Market share of top department stores in Malaysia
Source: Euromonitor International 2011 * sales for Parkson includes only non-food sales product sales while others likely to include a mix of food and non-food products
Number one in Vietnam, 36.7% market share. Parkson is the clear market leader in the
Vietnam department store landscape holding a 36.7% market share in terms of retail value
sales in 2010. It is considered the pioneer in the department store business, starting its
operations there since 2005. It was the first company to operate a chain of department stores
whilst others were stand-alone outlets.
… where market share has also been growing. PRA’s market share in Vietnam has also been growing like in Malaysia. In 2008, it held a 26.5% market share before rising to 32.0% in 2009 and 36.7% share in 2010. Its other main competitor is the Diamond brand department store owned by International Business Center Corporation in Ho Chi Minh City.

See important disclosures at the end of this publication 13
See important disclosures at the end of this publication
DMG Research
OSK Research
OSK Research DMG Research
Figure 15: Retail value sales market share of departmental store players
Source: Euromonitor International 2011 * sales for Parkson includes only non-food sales product sales while others likely to include a mix of food and non-food products
Vietnam: big department stores gaining popularity. It appears that the big department store retailers are gaining market share in the expense of smaller retailers and mom and pop shops which has seen its share fall from 45.4% in 2008 to 33.6% in 2010. Fast growth in Indonesia. PRA has a 2.5% share of the Indonesian department store industry, which was valued at US$2.8b in 2010 and is projected to grow at a CAGR of 10.7% between 2011 and 2015. In June 2011, PRA spent US$12.8m to acquire TS, which operates the “Centro” branded department stores in Indonesia and one “Kem Chicks” gourmet supermarket. The purchase was for US$12.8m plus a sale of 9.9% in PRA to PT Mitra Samaya(MS), the former owners of TS at S$15.8m. The stake has been reduced to 7.4% with the IPO. Figure 16: Retail value sales market share of departmental store players
Source: Euromonitor International 2011 * Sales for Parkson include only non-food sales product sales while others likely to include a mix of food and non-food products

See important disclosures at the end of this publication 14
See important disclosures at the end of this publication
DMG Research
OSK Research
OSK Research DMG Research
Well-recognised brand name in Malaysia and Vietnam. Having been in the Malaysian departmental store scene over the past 24 years, the Group has managed to establish itself as one of the premium departmental stores. Its popularity in Malaysia and Vietnam is evident in the numbers where it is ranks number two and number one respectively. …. and China via sister company. Apart from having a presence in Malaysia and Vietnam, Parkson is also a well recognised brand in China where its sister company, Parkson Retail Group (3368 HK) operates 46 stores as at 30 June 2011. …leading it to be a preferred partner. Due to its strong brand presence and dominant market position, it has become the the preferred point of entry for international brands planning to enter the Malaysian and Vietnamese retail markets via department stores. This allows it to offer customers a better mix of merchandise. The table below illustrates the awards and accolades it has won. Figure 17: Parkson’s Awards and Accolades
Source: Company data
Asset light: depends largely on a concessionaire model. PRA adopts a largely asset light strategy, relying in large part on concessionaire sales. In Malaysia, the mix between concessionaire and direct sales is 75%/25% and in Vietnam 96%/4%. In Indonesia the mix is 82%/18%. The mix lower in Malaysia as cosmetics are sold via direct sales there. … concessionaire sales accounted for 79% of Group merchandise sales. Overall, concessionaire sales make up for 79% of total merchandise sales in 2011. The proportion has been growing over the past several years growing from 75.4% in FY09, 78.0% in FY10 to 78.8% in FY11. Concessionaire sales are appealing as PRA collects all payments from customers and later only remits a portion of these proceeds to its concessionaires. It typically has credit terms of 30-90 days from suppliers. Its turnover days was 55 days, 54 days and 56 days for FY09, FY10 and FY11 respectively. By operating largely on the concessionaire model, the risks and costs of holding inventories as well as fit-out, selling and shrinkage costs are all borne by the concessionaires. As inventory is directly managed by each concessionaire, overall working capital requirement is also lowered.
Award Awarding Body Year Awarded
5th Most Valuable Brand in Malaysia The Edge Malaysia 2008 -2009
Overall Best Retail Outlet Malaysia Retailers Association 2009/2010
for Parkson Pavilion 2008/2009
Malaysia Retailers Association 2008/2009
Best Department Store Malaysia Retailers Association 2010/2011
Parkson KLCC 2007/2008
Parkson Subang Parade 2006/2007
Parkson One Utama
Most Favourite Vietnamese Brand Sai Gon Giai Phong newspaper 2006-2010
Ho Chi Minh City People's Committee
Most Famous Brand in Vietnam AC Nielson 2008
Vietnam Chambers of Commerce & Industry
Cosmopolitan magazine 2010
The Assoc of Accredited Advertising Agents
Malaysia
Innovative Shopping Outlet
(Department Store) category - Parkson
Pavilion
Readers' Choice Award: Lifestyle
Department Store - Centro

See important disclosures at the end of this publication 15
See important disclosures at the end of this publication
DMG Research
OSK Research
OSK Research DMG Research
Large pool of loyalty cardholders. PRA participates in a multi-party loyalty programme in Malaysia through BonusLink, which is operated by a third party and allows cardholders to use the card at a variety of other speciality retail and service outlets. In Vietnam and Indonesia, it has its own loyalty programmes. Loyalty programme members are entitled to points for purchases which can later be redeemed for discount vouchers or products. Members also receive special discounts on selected items and are eligible to participate in special promotional events at stores. As at 30June2011, the Group has over 1.28m active loyalty cardholders in Malaysia, over 65,000 active loyalty cardholders in Vietnam and approximately 200,000 active loyalty cardholders in Indonesia. Access to this large database of information enhances Parkson’s ability to understand its customers purchasing habits, tailor product and brand mix as well as customize marketing and promotional activities. … 50% of sales are generated by loyalty card holders. Evidence of the effectiveness of its loyalty cards is reflected in its sales. In FY11, 54.5%, 50.0% and 51.0% of total merchandise sales in Malaysia, Vietnam and Indonesia respectively were generated by loyalty cardholders. Same stores sales growth (SSSG) that beats industry. Stores in Malaysia had a SSSG of 11% in FY10 and 9.7% in FY11 beating the Malaysian department store industry’s -0.3% in CY09 and 10.7% in CY10. In Vietnam, SSSG was 26.6% in FY10 and 22.4% in FY11, beating industry’s 9.9% in CY09 and 5.8% in CY10. We forecast annual SSSG of 7% in Malaysia, 9% in Vietnam and 5% in Indonesia from FY12-14. Efforts taken to further increase store productivity include among others, to increase its average unit selling price, value per transaction and customer traffic. To achieve those goal, it will periodically change merchandise offerings, maximise customer flow and optimising space allocation for each concessionaire or supplier. Expanding existing store network. The Group will ramp up the rollout of its retail network across Malaysia, Vietnam and Indonesia. A store typically takes approximately two to three years to become profitable with sales volume growing as an outlet matures. In Indonesia, the Group has opened a new store in Indonesia at Galaxy Mall in August 2011, aims for another one and it will lease additional floor space for its Centro store in Bali. We believe down the road, it will introduce “Parkson” branded department stores alongside its Centro stores in Indonesia. In Malaysia it has opened a new store at KL Festival City and and in Vietnam, it will add one more. In total we should expect a total of four new stores by June 2012. For FY13, rate of expansion is faster and we can expect two new stores in Malaysia, 2-3 in Vietnam and 4-5 in Indonesia. Total new stores would be 7-8. Capital expenditure for new stores varies by country. In Indonesia, it is higher at US$2-3m while in Malaysia and Vietnam cost are on par and lower at US$1-2m per store.
See important disclosures at the end of this publication 16
See important disclosures at the end of this publication
DMG Research
OSK Research
OSK Research DMG Research
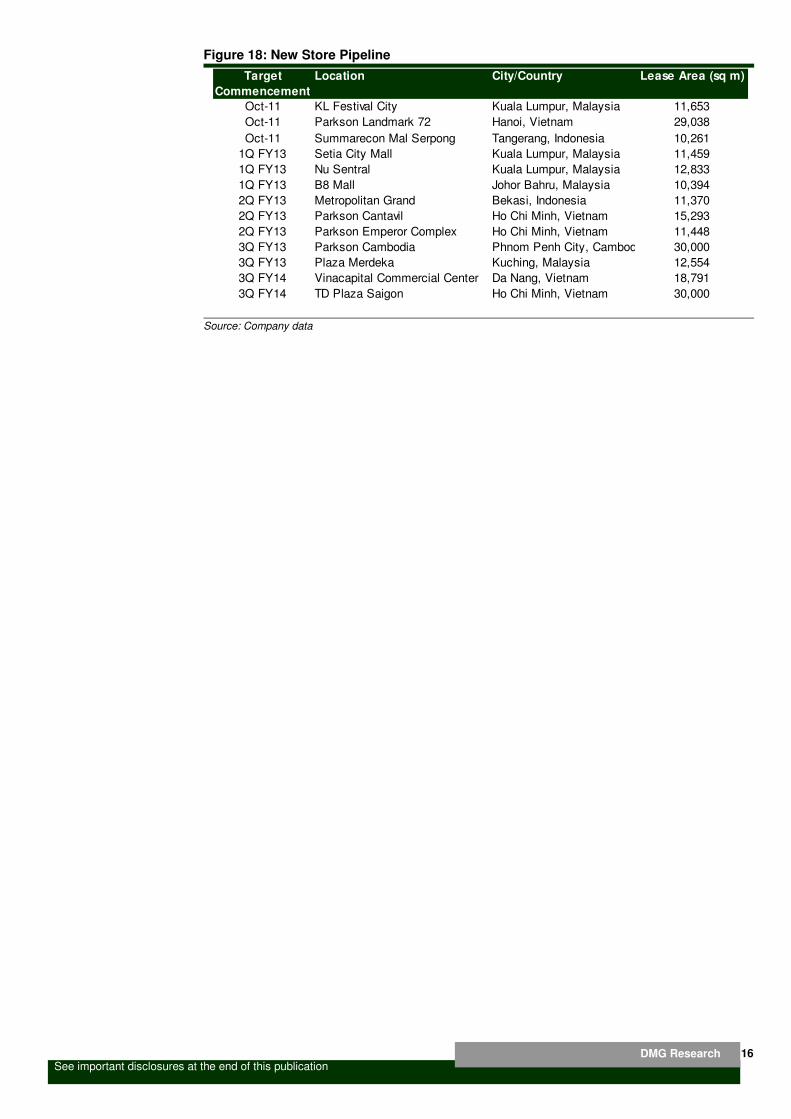
Figure 18: New Store Pipeline
Source: Company data
Location City/Country Lease Area (sq m)
Oct-11 KL Festival City Kuala Lumpur, Malaysia 11,653
Oct-11 Parkson Landmark 72 Hanoi, Vietnam 29,038
Oct-11 Summarecon Mal Serpong Tangerang, Indonesia 10,261
1Q FY13 Setia City Mall Kuala Lumpur, Malaysia 11,459
1Q FY13 Nu Sentral Kuala Lumpur, Malaysia 12,833
1Q FY13 B8 Mall Johor Bahru, Malaysia 10,394
2Q FY13 Metropolitan Grand Bekasi, Indonesia 11,370
2Q FY13 Parkson Cantavil Ho Chi Minh, Vietnam 15,293
2Q FY13 Parkson Emperor Complex Ho Chi Minh, Vietnam 11,448
3Q FY13 Parkson Cambodia Phnom Penh City, Cambodia 30,000
3Q FY13 Plaza Merdeka Kuching, Malaysia 12,554
3Q FY14 Vinacapital Commercial Center Da Nang, Vietnam 18,791
3Q FY14 TD Plaza Saigon Ho Chi Minh, Vietnam 30,000
Target
Commencement

See important disclosures at the end of this publication 17
See important disclosures at the end of this publication
DMG Research
OSK Research
OSK Research DMG Research
INVESTMENT RISKS
Forex risks. PRA’s earnings are denominated in Malaysian Ringgit, Vietnamese Dong and Rupiah while it reports its earnings in Singapore dollar. It is particularly affected by the SGDMYR rate. That said, this is just an accounting issue as all profits generated in the respective countries are usually re-invested in store refurbishments and new store openings. Dependance on Malaysia. In FY11, Malaysia accounted for 80% of PRA’s revenues. It is largely dependant on the market. Should there be any economic downturn or political instability, it will be negatively impacted. That said, we do not see this risk as high as it has been operating in the country for the past 27 years. Failure in Indonesia. While PRA has proven itself in Malaysia and Vietnam, the Indonesian department store landscape is very different. When it ventured into Vietnam in 2005, it was the pioneer there giving it the first mover advantage. Indonesia’s market is rather mature with the two big giants PT Ramayana Lestari Sentosa Tbk and PT Matahari Department Store Tbk dominating the scene. It’s acquired Centro department stores just hold a 2.6% market share. There is the risk that it may not be able to succeed as well in Indonesia as it has done in Malaysia and Vietnam. Choosing the wrong location for new stores. There is the risk that being new to the Indonesian and Cambodia scene, the Group might choose the wrong site for its new outlet and have to shut down. However we view this risk as low as the Group has had many years of experience in site location under its belt.
See important disclosures at the end of this publication 18
See important disclosures at the end of this publication
DMG Research
OSK Research
OSK Research DMG Research
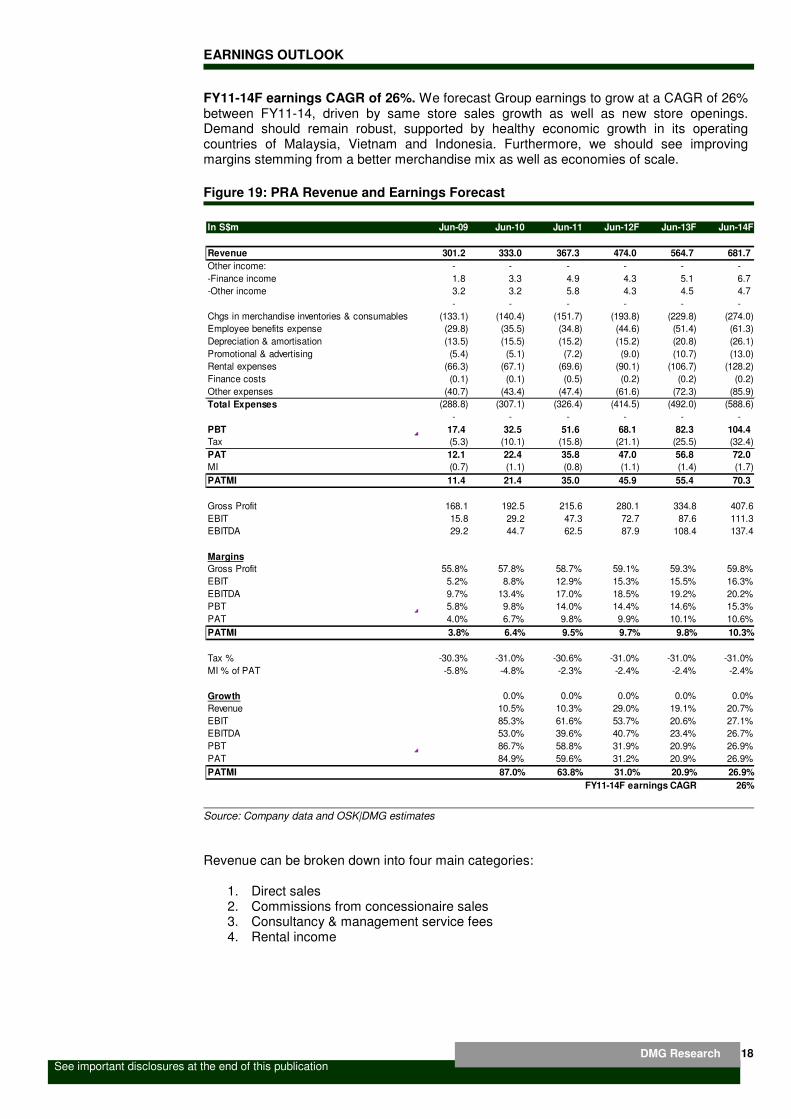
EARNINGS OUTLOOK
FY11-14F earnings CAGR of 26%. We forecast Group earnings to grow at a CAGR of 26% between FY11-14, driven by same store sales growth as well as new store openings. Demand should remain robust, supported by healthy economic growth in its operating countries of Malaysia, Vietnam and Indonesia. Furthermore, we should see improving margins stemming from a better merchandise mix as well as economies of scale.
Figure 19: PRA Revenue and Earnings Forecast
Source: Company data and OSK|DMG estimates Revenue can be broken down into four main categories:
1. Direct sales 2. Commissions from concessionaire sales 3. Consultancy & management service fees 4. Rental income
In S$m Jun-09 Jun-10 Jun-11 Jun-12F Jun-13F Jun-14F
Revenue 301.2 333.0 367.3 474.0 564.7 681.7
Other income: - - - - - -
-Finance income 1.8 3.3 4.9 4.3 5.1 6.7
-Other income 3.2 3.2 5.8 4.3 4.5 4.7
- - - - - -
Chgs in merchandise inventories & consumables (133.1) (140.4) (151.7) (193.8) (229.8) (274.0)
Employee benefits expense (29.8) (35.5) (34.8) (44.6) (51.4) (61.3)
Depreciation & amortisation (13.5) (15.5) (15.2) (15.2) (20.8) (26.1)
Promotional & advertising (5.4) (5.1) (7.2) (9.0) (10.7) (13.0)
Rental expenses (66.3) (67.1) (69.6) (90.1) (106.7) (128.2)
Finance costs (0.1) (0.1) (0.5) (0.2) (0.2) (0.2)
Other expenses (40.7) (43.4) (47.4) (61.6) (72.3) (85.9)
Total Expenses (288.8) (307.1) (326.4) (414.5) (492.0) (588.6)
- - - - - -
PBT 17.4 32.5 51.6 68.1 82.3 104.4
Tax (5.3) (10.1) (15.8) (21.1) (25.5) (32.4)
PAT 12.1 22.4 35.8 47.0 56.8 72.0
MI (0.7) (1.1) (0.8) (1.1) (1.4) (1.7)
PATMI 11.4 21.4 35.0 45.9 55.4 70.3
Gross Profit 168.1 192.5 215.6 280.1 334.8 407.6
EBIT 15.8 29.2 47.3 72.7 87.6 111.3
EBITDA 29.2 44.7 62.5 87.9 108.4 137.4
Margins
Gross Profit 55.8% 57.8% 58.7% 59.1% 59.3% 59.8%
EBIT 5.2% 8.8% 12.9% 15.3% 15.5% 16.3%
EBITDA 9.7% 13.4% 17.0% 18.5% 19.2% 20.2%
PBT 5.8% 9.8% 14.0% 14.4% 14.6% 15.3%
PAT 4.0% 6.7% 9.8% 9.9% 10.1% 10.6%
PATMI 3.8% 6.4% 9.5% 9.7% 9.8% 10.3%
Tax % -30.3% -31.0% -30.6% -31.0% -31.0% -31.0%
MI % of PAT -5.8% -4.8% -2.3% -2.4% -2.4% -2.4%
Growth 0.0% 0.0% 0.0% 0.0% 0.0%
Revenue 10.5% 10.3% 29.0% 19.1% 20.7%
EBIT 85.3% 61.6% 53.7% 20.6% 27.1%
EBITDA 53.0% 39.6% 40.7% 23.4% 26.7%
PBT 86.7% 58.8% 31.9% 20.9% 26.9%
PAT 84.9% 59.6% 31.2% 20.9% 26.9%
PATMI 87.0% 63.8% 31.0% 20.9% 26.9%
FY11-14F earnings CAGR 26%

See important disclosures at the end of this publication 19
See important disclosures at the end of this publication
DMG Research
OSK Research
OSK Research DMG Research
Figure 20: Revenue Breakdown by Category
Source: Company data We have forecast a slight dip in the % of concessionaire sales over direct sales in FY13 as PRA enters Cambodia, a new market. We feel it might take a year before it secures more concessaionaires and will have to initially rely more on direct sales. Figure 21: Merchandise Sales
Source: Company data
55% of merchandise sales from fashion & apparels. PRA derives the bulk of its merchandise sales from the sale of fashion and apparels. Cambodia to start operations in 3QFY13. Management targets to start its Cambodia store in Phnom Penh in 3QFY13 (Jan-Mar 2014). The store will occupy 30,000sqm of retail space. We are forecasting a very conservative S$800 average sales per sqm in FY13 for the one quarter that it will be under operation and estimating a 10% YoY growth in average sales per sm to S$880 in FY14. We have assumed a merchandise sales mix of 80% direct sales and 20% concessionaire sales. In terms of commission rates from concessionaire sales, we are forecasting 20%. Cambodia is expected to contribute S$6.0m to Group revenue in FY13 in its first quarter ofoperations and S$26.4m in FY14.
In S$m Jun-09 Jun-10 Jun-11 Jun-12F Jun-13F Jun-14F
Revenue 301.2 333.0 367.3 474.0 564.7 681.7
By Category
1) Direct Sales 162.6 169.2 180.6 233.4 279.1 347.0
2) Commissions from concessionaire sales 126.3 149.6 169.5 221.5 264.5 311.0
3) Consultancy & management service fees 0.5 0.9 1.4 1.6 1.7 1.9
4) Rental income 11.8 13.2 15.9 17.5 19.4 21.7
Total Revenue 301.2 333.0 367.3 474.0 564.7 681.7
% of revenue
Direct Sales 54% 51% 49% 49% 49% 51%
Commissions from concessionaire sales 42% 45% 46% 47% 47% 46%
Consultancy & management service fees 0% 0% 0% 0% 0% 0%
Rental income 4% 4% 4% 4% 3% 3%
growth %
Direct Sales 0% 4% 7% 29% 20% 24%
Commissions from concessionaire sales 0% 18% 13% 31% 19% 18%
Consultancy & management service fees 0% 85% 53% 10% 10% 10%
Rental income 0% 12% 20% 10% 11% 12%
Total revenue 0% 11% 10% 29% 19% 21%
162.6 169.2 180.6
233.4
279.1
347.0
126.3
149.6 169.5
221.5
264.5
311.0
0
50
100
150
200
250
300
350
400
Jun-09 Jun-10 Jun-11 Jun-12F Jun-13F Jun-14F
Direct sales Commission from concessionaire salesIn S$m

See important disclosures at the end of this publication 20
See important disclosures at the end of this publication
DMG Research
OSK Research
OSK Research DMG Research
Other revenue/income
Other revenue or income apart from merchandise sales are consultancy and management service fee and rental income. Consultancy and management service fee is derived from its managed stores in Vietnam. In FY11, fees rose by 53% or S$0.5m as a result of the opening of one new managed store in Ho Chi Minh City in January 2011.
Figure 22: Consultancy & management service fee Figure 23: Rental income
Source: Bloomberg Source: Bloomberg
Figure 24: Breakdown of FY11 operating expenses
Source: Company data COGS tied only to direct sales not concessionaire sales. In FY11, changes in merchandise, inventories and consumables (COGS) accounted for 46% of total operating expenses. This translated into a gross profit margin of 58.7%, up 0.9ppt from 57.8% in FY10. We note that gross margins have gradually been improving as a result of higher concessionaire sales.
0.5
0.9
1.4
1.6
1.7
1.9
0.4
0.6
0.8
1.0
1.2
1.4
1.6
1.8
2.0
Jun-09 Jun-10 Jun-11 Jun-12F Jun-13F Jun-14F
S$m Consultancy & management service fees
11.8
13.2
15.9
17.5
19.4
21.7
10
12
14
16
18
20
22
24
Jun-09 Jun-10 Jun-11 Jun-12F Jun-13F Jun-14F
S$mRental income
Chgs in merchandise inventories &
consumables, 46%
Employee benef its
expense, 11%
Depreciation & amortisation, 5%
Promotional & advertising, 2%
Rental expenses, 21%
Finance costs, 0%
Other expenses, 15%
See important disclosures at the end of this publication 21
See important disclosures at the end of this publication
DMG Research
OSK Research
OSK Research DMG Research
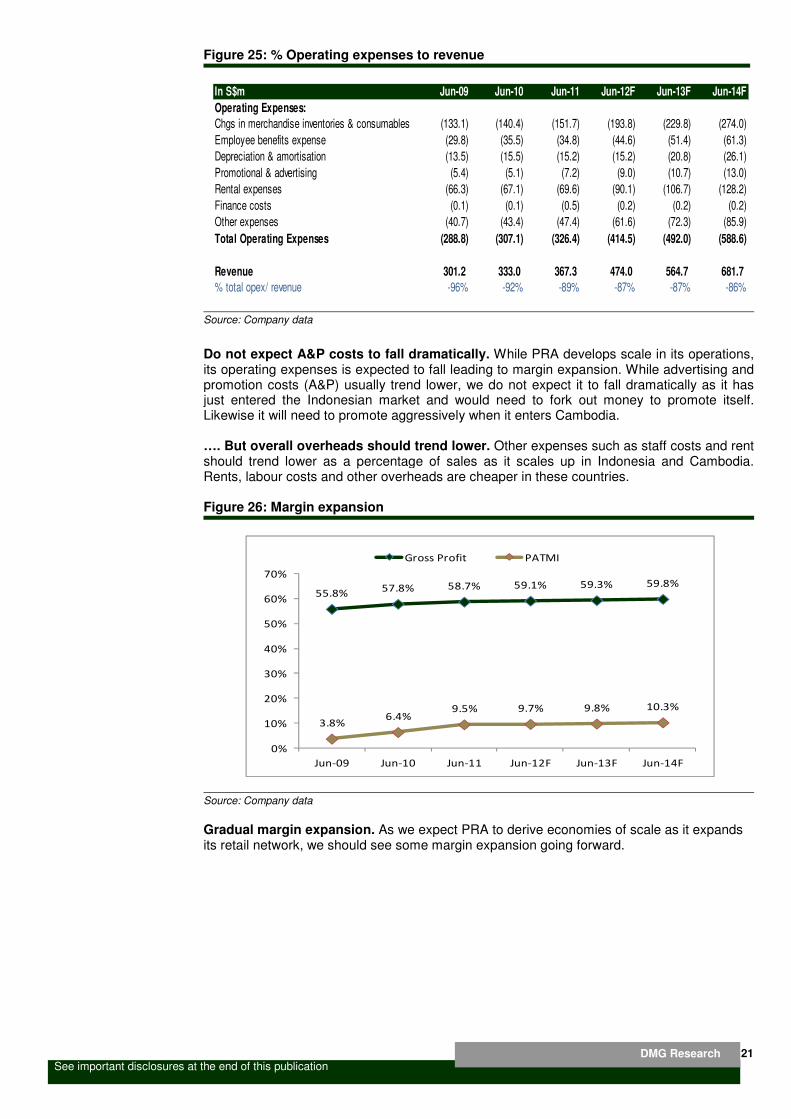
Figure 25: % Operating expenses to revenue
Source: Company data
Do not expect A&P costs to fall dramatically. While PRA develops scale in its operations, its operating expenses is expected to fall leading to margin expansion. While advertising and promotion costs (A&P) usually trend lower, we do not expect it to fall dramatically as it has just entered the Indonesian market and would need to fork out money to promote itself. Likewise it will need to promote aggressively when it enters Cambodia. …. But overall overheads should trend lower. Other expenses such as staff costs and rent should trend lower as a percentage of sales as it scales up in Indonesia and Cambodia. Rents, labour costs and other overheads are cheaper in these countries. Figure 26: Margin expansion
Source: Company data Gradual margin expansion. As we expect PRA to derive economies of scale as it expands its retail network, we should see some margin expansion going forward.
In S$m Jun-09 Jun-10 Jun-11 Jun-12F Jun-13F Jun-14F
Operating Expenses:
Chgs in merchandise inventories & consumables (133.1) (140.4) (151.7) (193.8) (229.8) (274.0)
Employee benefits expense (29.8) (35.5) (34.8) (44.6) (51.4) (61.3)
Depreciation & amortisation (13.5) (15.5) (15.2) (15.2) (20.8) (26.1)
Promotional & advertising (5.4) (5.1) (7.2) (9.0) (10.7) (13.0)
Rental expenses (66.3) (67.1) (69.6) (90.1) (106.7) (128.2)
Finance costs (0.1) (0.1) (0.5) (0.2) (0.2) (0.2)
Other expenses (40.7) (43.4) (47.4) (61.6) (72.3) (85.9)
Total Operating Expenses (288.8) (307.1) (326.4) (414.5) (492.0) (588.6)
Revenue 301.2 333.0 367.3 474.0 564.7 681.7
% total opex/ revenue -96% -92% -89% -87% -87% -86%
55.8%57.8% 58.7% 59.1% 59.3% 59.8%
3.8%6.4%
9.5% 9.7% 9.8% 10.3%
0%
10%
20%
30%
40%
50%
60%
70%
Jun-09 Jun-10 Jun-11 Jun-12F Jun-13F Jun-14F
Gross Profit PATMI
See important disclosures at the end of this publication 22
See important disclosures at the end of this publication
DMG Research
OSK Research
OSK Research DMG Research
VALUATION
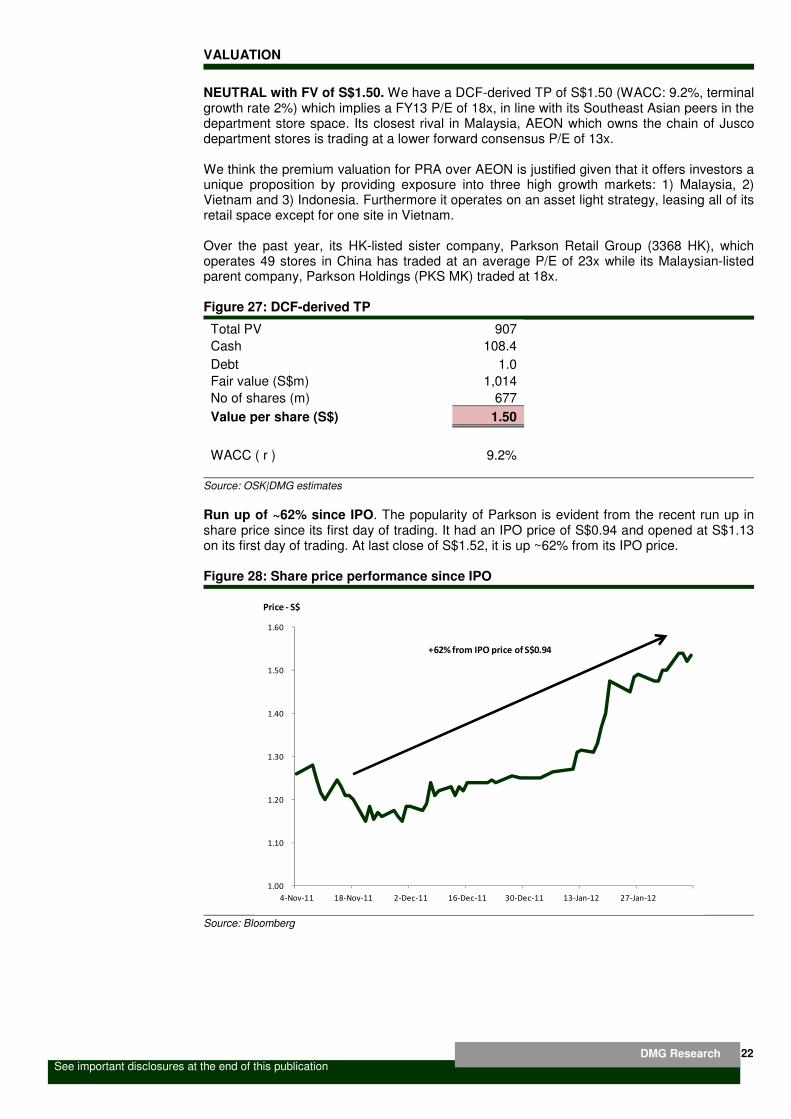
NEUTRAL with FV of S$1.50. We have a DCF-derived TP of S$1.50 (WACC: 9.2%, terminal growth rate 2%) which implies a FY13 P/E of 18x, in line with its Southeast Asian peers in the department store space. Its closest rival in Malaysia, AEON which owns the chain of Jusco department stores is trading at a lower forward consensus P/E of 13x. We think the premium valuation for PRA over AEON is justified given that it offers investors aunique proposition by providing exposure into three high growth markets: 1) Malaysia, 2) Vietnam and 3) Indonesia. Furthermore it operates on an asset light strategy, leasing all of its retail space except for one site in Vietnam. Over the past year, its HK-listed sister company, Parkson Retail Group (3368 HK), which operates 49 stores in China has traded at an average P/E of 23x while its Malaysian-listed parent company, Parkson Holdings (PKS MK) traded at 18x. Figure 27: DCF-derived TP
Total PV 907
Cash 108.4
Debt 1.0
Fair value (S$m) 1,014
No of shares (m) 677
Value per share (S$) 1.50
WACC ( r ) 9.2%
Source: OSK|DMG estimates Run up of ~62% since IPO. The popularity of Parkson is evident from the recent run up in share price since its first day of trading. It had an IPO price of S$0.94 and opened at S$1.13 on its first day of trading. At last close of S$1.52, it is up ~62% from its IPO price. Figure 28: Share price performance since IPO
Source: Bloomberg
1.00
1.10
1.20
1.30
1.40
1.50
1.60
4-Nov-11 18-Nov-11 2-Dec-11 16-Dec-11 30-Dec-11 13-Jan-12 27-Jan-12
Price - S$
+62% from IPO price of S$0.94

See important disclosures at the end of this publication 23
See important disclosures at the end of this publication
DMG Research
OSK Research
OSK Research DMG Research
Figure 29: PRA SP P/E Trading Band
Source: Bloomberg
Figure 30: Sister 3368HK P/E Trading Band
Source: Bloomberg
19.0
20.0
21.0
22.0
23.0
24.0
25.0
26.0
27.0
3-Nov-11 17-Nov-11 1-Dec-11 15-Dec-11 29-Dec-11 12-Jan-12 26-Jan-12 9-Feb-12
Mean: 22x
+1SD: 24x
-1SD: 20x
15.0
20.0
25.0
30.0
35.0
40.0
45.0
30-Sep-08 31-Mar-09 30-Sep-09 31-Mar-10 30-Sep-10 31-Mar-11 30-Sep-11
Mean: 28x
+1SD: 35x
-1SD: 22x

See important disclosures at the end of this publication 24
See important disclosures at the end of this publication
DMG Research
OSK Research
OSK Research DMG Research
Figure 31: PKS MK P/E Trading Band
Source: Bloomberg
PRA’s Malaysian-listed parent, Parkson Holdings Berhad which owns 68% of the latter has been trading at 18x P/E for the past year.
Figure 32: DMG vs consensus
OSK|DMG vs consensus
FY12 FY13 FY14
OSK|DMG Revenue 474.0 564.7 681.7 Consensus as at 9Feb12 454.5 528.3 609.3 variance % 4% 7% 12%
OSK|DMG PATMI 45.9 55.4 70.3 Consensus as at 9Feb12 46.9 57.5 70.0 variance % -2% -4% 0%
Source: Company data
-
5.0
10.0
15.0
20.0
25.0
30.0
35.0
40.0
29-Jun-01 29-Jun-03 29-Jun-05 29-Jun-07 29-Jun-09 29-Jun-11
Mean: 11x
+1SD: 18x
-1SD: 4x

See important disclosures at the end of this publication 25
See important disclosures at the end of this publication
DMG Research
OSK Research
OSK Research DMG Research
Figure 33: Peer Comparison
Source: Bloomberg and OSK|DMG estimates
STOCK Bloomberg Ticker Price Net D/E (x) Yield (%)
9-Feb-12 Yr 1 Yr2 Yr 1 Yr2 Yr 1 Yr2 Yr 1 Yr2 FY12 FY12
Southeast Asia department stores
PARKSON RETAIL ASIA LTD pra sp equity 1.52 22.5 18.6 6.8 5.6 11.4 9.4 30.4 30.0 (71.2) 2.0
AEON CO (M) BHD aeon mk equity 7.65 15.6 13.7 2.2 2.2 6.1 5.4 15.7 14.8 (29.4) 2.1
MITRA ADIPERKASA TBK PT mapi ij equity 5,650.00 28.3 21.6 5.6 5.3 11.9 9.8 14.6 21.8 48.1 0.4
RAMAYANA LESTARI SENTOSA PT rals ij equity 800.00 14.2 12.3 2.0 2.0 6.6 5.9 13.8 15.2 (40.5) 3.8
ROBINSON DEPARTMENT STORE PU robins tb equity 43.00 30.5 24.4 5.7 5.3 16.2 13.0 23.3 20.3 (43.1) 1.4
Industry Average (ex-PRA) 22.1 18.0 3.9 3.7 10.2 8.5 16.8 18.0 (16.2) 1.9
Southeast Asia supermarkets
DAIRY FARM INTL HLDGS LTD dfi sp equity 9.91 28.3 25.9 16.8 14.4 18.2 16.6 65.4 51.3 (28.2) 1.9
SHENG SIONG GROUP LTD ssg sp equity 0.50 17.1 17.7 10.4 5.0 15.7 13.5 48.0 29.0 (99.5) Na
SUMBER ALFARIA TRIJAYA TBK P amrt ij equity 4,000.00 37.1 27.7 10.3 10.7 14.6 11.4 25.9 32.0 38.5 Na
CP ALL PCL cpall tb equity 58.00 32.2 26.4 13.1 12.8 17.1 14.7 36.5 45.2 (112.2) 1.7
BIG C SUPERCENTER PCL bigc tb equity 122.00 25.3 22.2 4.6 4.4 12.3 10.9 14.7 17.1 (25.1) 1.6
SIAM MAKRO PUBLIC CO LTD makro tb equity 259.00 25.1 19.6 6.6 6.4 13.3 11.7 21.0 31.1 (42.9) 3.4
Industry Average 27.5 23.2 10.3 8.9 15.2 13.1 35.2 34.3 (44.9) 2.2
Hong Kong department stores
PARKSON RETAIL GROUP LTD 3368 hk equity 10.06 19.9 17.2 4.4 4.4 11.4 9.9 23.5 24.3 (50.7) 2.0
GOLDEN EAGLE RETAIL GROUP 3308 hk equity 18.20 23.7 19.1 7.1 6.4 15.5 12.3 29.1 30.5 (47.9) 1.0
LIFESTYLE INTL HLDGS LTD 1212 hk equity 17.96 18.2 15.8 3.9 3.6 13.4 11.5 21.1 21.4 (14.5) 2.1
INTIME DEPARTMENT STORE 1833 hk equity 9.24 18.2 14.4 2.5 2.4 14.9 11.9 15.6 15.8 26.2 2.0
SPRINGLAND INTERNATIONAL HOL 1700 hk equity 4.86 17.2 14.1 2.6 2.4 9.7 7.9 15.5 16.1 (38.0) 2.3
MAOYE INTERNATIONAL HLDGS 848 hk equity 1.89 12.9 9.3 1.5 1.6 8.7 6.4 15.8 16.2 45.4 Na
NEW WORLD DEPT STORE CHINA 825 hk equity 4.86 12.8 10.5 1.5 1.4 3.5 2.9 16.5 12.7 (74.5) 3.3
PCD STORES GROUP LTD 331 hk equity 1.29 11.0 8.9 1.8 1.7 6.2 4.7 15.2 19.0 (12.9) 3.5
Industry Average 16.7 13.6 3.2 3.0 10.4 8.4 19.0 19.5 (20.9) 2.3
United States Department Stores
MACY'S INC m us equity 35.86 12.8 10.9 2.6 2.5 6.0 5.8 16.6 20.9 107.8 1.0
J.C. PENNEY CO INC jcp us equity 42.35 34.9 23.6 2.0 2.2 9.6 8.1 7.6 8.9 8.7 1.9
SAKS INC sks us equity 10.88 28.4 22.2 1.5 1.7 7.6 6.8 4.3 7.1 26.5 Na
KOHLS CORP kss us equity 50.14 11.7 10.2 2.0 2.0 5.5 5.3 14.5 18.0 21.9 2.0
Industry Average 21.9 16.7 2.0 2.1 7.2 6.5 10.8 13.7 41.2 1.6
Australia Department Stores
DAVID JONES LTD djs au equity 2.52 9.5 9.2 1.6 1.7 5.7 5.4 22.0 18.2 15.3 15.9
MYER HOLDINGS LTD myr au equity 2.06 8.7 8.3 1.4 1.4 5.0 4.8 18.7 17.2 44.4 15.6
Industry Average 9.1 8.7 1.5 1.5 5.3 5.1 20.3 17.7 29.8 15.7
Global Average 19.5 16.1 4.2 3.9 9.7 8.3 20.4 20.6 (2.2) 4.7
P/E (x) P/B (x) EV/EBITDA ROE (%)

See important disclosures at the end of this publication
See important disclosures at the end of this publication
APPENDIX 1: DEPARTMENT STORE INDUSTRY OUTLOOK
Malaysia’s Economy
� Malaysian economy grew at a CAGR of 17.2% from 2005 to 2008 prior to the
financial crisis
� GDP per capita grew at a CAGR of 15% from 2005 to 2008 from US$5,280 to US$8,036
� Between 2011
and 6.4% respectively to reach US$331b and US$10,774 respectively in 2
Malaysia’s Department Store Industry
� The Malaysian department store retail market enjoyed robust double
12.3%, 29.6% and 13.2% in 2006, 2007 and 2008
� Slight decline of 3.1% in 2009 due to the global financial crisis
with a 10.7% growth
� Between 20
� The industry was valued at US$2.5b in 2010 and is projected to
between 2011 to 2015
� PRA ranks number two in terms of retail value sales in 2010
� Have forecasted SSSG of 7% annually for FY12
Figure 34: GDP and GDP per capita (2005
Source: Euromonitor International 2011
Figure 36: Market Share
Source: Euromonitor International 2011* sales for Parkson includes only nonfood products
See important disclosures at the end of this publication
See important disclosures at the end of this publication
APPENDIX 1: DEPARTMENT STORE INDUSTRY OUTLOOK
’s Economy
Malaysian economy grew at a CAGR of 17.2% from 2005 to 2008 prior to the
financial crisis
GDP per capita grew at a CAGR of 15% from 2005 to 2008 from US$5,280 to US$8,036
Between 2011-2015, GDP and GDP per capita are expected to grow at a CAGR of 7.9%
and 6.4% respectively to reach US$331b and US$10,774 respectively in 2
’s Department Store Industry
The Malaysian department store retail market enjoyed robust double
12.3%, 29.6% and 13.2% in 2006, 2007 and 2008
Slight decline of 3.1% in 2009 due to the global financial crisis
10.7% growth
Between 2005-2010, grew at a CAGR of 12.1%
The industry was valued at US$2.5b in 2010 and is projected to
between 2011 to 2015
PRA ranks number two in terms of retail value sales in 2010
forecasted SSSG of 7% annually for FY12-FY14.
GDP and GDP per capita (2005-2015) Figure 35: Consumption expenditure & consumer expenditure per capita (2005
Source: Euromonitor International 2011
Market Share
Euromonitor International 2011 * sales for Parkson includes only non-food sales product sales while others likely to include a mix of food and non
43%
19%
17%
7%
3%3%
3%2% 3%
26
DMG Research
OSK Research
OSK Research DMG Research
APPENDIX 1: DEPARTMENT STORE INDUSTRY OUTLOOK - MALAYSIA
Malaysian economy grew at a CAGR of 17.2% from 2005 to 2008 prior to the global
GDP per capita grew at a CAGR of 15% from 2005 to 2008 from US$5,280 to US$8,036
2015, GDP and GDP per capita are expected to grow at a CAGR of 7.9%
and 6.4% respectively to reach US$331b and US$10,774 respectively in 2015
The Malaysian department store retail market enjoyed robust double-digit growth of
Slight decline of 3.1% in 2009 due to the global financial crisis but rebounded in 2010
The industry was valued at US$2.5b in 2010 and is projected to grow at a CAGR of 4.5%
PRA ranks number two in terms of retail value sales in 2010
Consumption expenditure & consumer expenditure per capita (2005-2015)
International 2011
food sales product sales while others likely to include a mix of food and non-
AEON Co (M) Bhd
Parkson Corp Sdn Bhd
The Store Corp Bhd
Isetan (M) Sdn Bhd
Milimewa Superstore Sdn
Bhd
Robinson & Co Ltd

See important disclosures at the end of this publication
See important disclosures at the end of this publication
AEON Co which owns the Jusco chain of department stores is the leading player in the Malaysian department store market. In terms of retail sales value in 2010 It held a 42.5% market share compared to Parkson’s 19.2%. Its’ other rival, number of outlets in Malaysia however isnt a direct competitor as it the low to middle inc Figure 37: Number of outlets of top players
Source: Company data
In terms of number of outlets in Malaysia, Parkson ranks number two.
Figure 38: Selling space of top players
Source: Company data
515151
0
10
20
30
40
50
60
The Store
Corp Bhd
309309
353
0
50
100
150
200
250
300
350
400
AEON Co
(M) Bhd
Selling space ('000 sm)
See important disclosures at the end of this publication
See important disclosures at the end of this publication
AEON Co which owns the Jusco chain of department stores is the leading player in the Malaysian department store market. In terms of retail sales value in 2010 It held a 42.5% market share compared to Parkson’s 19.2%.
Its’ other rival, The Store which owns the Millimewa and The Store chain, number of outlets in Malaysia but saw its market share declined by
isnt a direct competitor as it targets a different target market than Parkson, serving low to middle income consumers.
Number of outlets of top players
Company data
In terms of number of outlets in Malaysia, Parkson ranks number two.
Selling space of top players
Company data
32
21
17
75
36
21
17
75
51
36
23
17
75
The Store
Corp Bhd
Parkson
Corp Sdn
Bhd
AEON Co
(M) Bhd
Milimewa
Superstore
Sdn Bhd
Metrojaya Robinson &
Co Ltd
2008 2009
319
259
103
83
43
337
259
10384
43
353
315
259
103
84
43
AEON Co Parkson
Corp Sdn
Bhd
The Store
Corp Bhd
Milimewa
Superstore
Sdn Bhd
Metrojaya Isetan (M)
Sdn Bhd
Selling space ('000 sm)
2008 2009 2010
27
DMG Research
OSK Research
OSK Research DMG Research
AEON Co which owns the Jusco chain of department stores is the leading player in the Malaysian department store market. In terms of retail sales value in 2010 It held a 42.5%
the Millimewa and The Store chain, has the most saw its market share declined by 0.8% in 2010. The Store
targets a different target market than Parkson, serving
In terms of number of outlets in Malaysia, Parkson ranks number two.
3 2
28
3 2
28
3 2
32
Isetan (M)
Sdn Bhd
Suiwah
Corp Bhd
Others
2010
18 14
86
18 18
100
4318 18
155
Isetan (M) Robinson &
Co Ltd
Suiwah Corp
Bhd
Others
2010

See important disclosures at the end of this publication
See important disclosures at the end of this publication
APPENDIX 2: DEPARTMENT STORE
Vietnam’s Economy
� Between 2011 to 2015, Vietnam is forecasted to experience GDP growth at a CAGR of
12.1% and GDP per capita growth of 11.2%
� Consumer expenditure and expenditure per capita are forecast to grow at a CAGR of
10.6% and 9.7% respectively between 2011 and 2015
Vietnam’s Department Store Industry
� Vietnam’s
and 2008
� During the global financial crisis in 2009, it grew by 9.9% and a further 5.8% in
� The industry was valued at US$355m in 2010 and is projected to grow at a CAGR of
9.1% between 2011 to 2015
� Have forecasted SSSG of 9% for FY12
Figure 39: GDP and GDP per capita (2005
Source: Euromonitor International 2011
Figure 41: 2010 Market Share
Source: Euromonitor International 2011* Sales for Parksonfood products
See important disclosures at the end of this publication
See important disclosures at the end of this publication
: DEPARTMENT STORE INDUSTRY OUTLOOK
Vietnam’s Economy
Between 2011 to 2015, Vietnam is forecasted to experience GDP growth at a CAGR of
12.1% and GDP per capita growth of 11.2%
Consumer expenditure and expenditure per capita are forecast to grow at a CAGR of
and 9.7% respectively between 2011 and 2015
Vietnam’s Department Store Industry
Vietnam’s department store retail sales value grew by a CAGR of 22.5% between 2005
During the global financial crisis in 2009, it grew by 9.9% and a further 5.8% in
The industry was valued at US$355m in 2010 and is projected to grow at a CAGR of
between 2011 to 2015
Have forecasted SSSG of 9% for FY12-14
GDP and GDP per capita (2005-2015) Figure 40: Consumption expenditure & consumer expenditure per capita (2005
Source: Euromonitor International 2011
2010 Market Share
Euromonitor International 2011 * Sales for Parkson include only non-food sales product sales while others likely to include a mix of food and non
37%
20%
6%
3%
34%
28
DMG Research
OSK Research
OSK Research DMG Research
INDUSTRY OUTLOOK - VIETNAM
Between 2011 to 2015, Vietnam is forecasted to experience GDP growth at a CAGR of
Consumer expenditure and expenditure per capita are forecast to grow at a CAGR of
sales value grew by a CAGR of 22.5% between 2005
During the global financial crisis in 2009, it grew by 9.9% and a further 5.8% in 2010
The industry was valued at US$355m in 2010 and is projected to grow at a CAGR of
Consumption expenditure & consumer per capita (2005-2015)
Euromonitor International 2011
food sales product sales while others likely to include a mix of food and non-
Parkson Corporation
International Business
Center Corp
Hasegawa Vietnam Co
Trang Tien Plaza Co Ltd
Others

See important disclosures at the end of this publication
See important disclosures at the end of this publication
Figure 42: Number of outlets of top players
Source: Company data
Figure 43: Selling space of top players
Source: Company data
56
0
5
10
15
20
25
30
Parkson
Corporation
86
111
0
20
40
60
80
100
120
140
160
180
200
Parkson Corporation
Selling space ('000 sm)
See important disclosures at the end of this publication
See important disclosures at the end of this publication
Number of outlets of top players
Company data
Selling space of top players
Company data
1 1
6
1 1
6
1 1
Parkson
Corporation
International
Business Center
Corp
Hasegawa Vietnam
Co
Trang Tien Plaza
2008 2009 2010
8 7
111
8 7
111
8 7
Parkson Corporation International Business
Center Corp
Hasegawa Vietnam Co Trang Tien Plaza Co Ltd
Selling space ('000 sm)
2008 2009 2010
29
DMG Research
OSK Research
OSK Research DMG Research
1
23
1
24
1
26
Trang Tien Plaza
Co Ltd
Others
12
150
12
154
12
183
Trang Tien Plaza Co Ltd Others

See important disclosures at the end of this publication
See important disclosures at the end of this publication
APPENDIX 3: DEPARTMENT STORE INDUSTRY OUTLOOK
Indonesia’s Economy
� Between 2005 to 2008, Indonesia’s GDP and GDP per capita grew at a CAGR of 21.3%
and 19.8% respectively
� In 2010, it experience double digit GDP growth of 27.9% while GDP per
26.5%
� GDP and GDP per capita are expected to grow at a CAGR of 11.8% and 10.7% from
2011 to 2015
� Consumer expenditure and expenditure per capita are forecast to grow at a CAGR of
11.0% and 10.0% respectively between 2011 and 2015
Indonesia’s Department Store Industry
� Retail value sales are expected to grow at a CAGR of 10.7% between 2011 to 2015
� Have assumed SSSG of 5% for FY12
still new to the market
Figure 44: GDP and GDP per capita
Source: Euromonitor International 2011
Figure 46: Retail value sales market share of departmental store
Source: Euromonitor International 2011* Sales for Parkson include only nonfood products
2.30%2.50%
0.40%
0.20%
See important disclosures at the end of this publication
See important disclosures at the end of this publication
APPENDIX 3: DEPARTMENT STORE INDUSTRY OUTLOOK
Indonesia’s Economy
Between 2005 to 2008, Indonesia’s GDP and GDP per capita grew at a CAGR of 21.3%
and 19.8% respectively
In 2010, it experience double digit GDP growth of 27.9% while GDP per
GDP and GDP per capita are expected to grow at a CAGR of 11.8% and 10.7% from
2011 to 2015
Consumer expenditure and expenditure per capita are forecast to grow at a CAGR of
11.0% and 10.0% respectively between 2011 and 2015
’s Department Store Industry
value sales are expected to grow at a CAGR of 10.7% between 2011 to 2015
Have assumed SSSG of 5% for FY12-14. Assumed rate appears conservative as PRA is
still new to the market
GDP and GDP per capita (2005-2015) Figure 45: Consumption expenditure & consumer expenditure per capita (2005
Source: Euromonitor International 2011
Retail value sales market share of departmental store
Euromonitor International 2011 * Sales for Parkson include only non-food sales product sales while others likely to include a mix of food and non
32.70%
23.20%
10.90%
4.60%
2.30%2.50%
0.40%0.40%
0.20%
22.90%
30
DMG Research
OSK Research
OSK Research DMG Research
APPENDIX 3: DEPARTMENT STORE INDUSTRY OUTLOOK - INDONESIA
Between 2005 to 2008, Indonesia’s GDP and GDP per capita grew at a CAGR of 21.3%
In 2010, it experience double digit GDP growth of 27.9% while GDP per capita grew at
GDP and GDP per capita are expected to grow at a CAGR of 11.8% and 10.7% from
Consumer expenditure and expenditure per capita are forecast to grow at a CAGR of
value sales are expected to grow at a CAGR of 10.7% between 2011 to 2015
14. Assumed rate appears conservative as PRA is
Consumption expenditure & consumer expenditure per capita (2005-2015)
Euromonitor International 2011
Retail value sales market share of departmental store players
food sales product sales while others likely to include a mix of food and non-
PT Matahari Department
Store TbkPT Ramayana Lestari
Sentosa TbkPT Mitra Adiperkasa Tbk
PT Akur Pratama
PT Metropolitan
RetailmartPT Tozy Sentosa
PT Sarinah (Persero)
PT Golden Retailindo Tbk
PT Rimo Surabaya Lestari
TbkOthers

See important disclosures at the end of this publication
See important disclosures at the end of this publication
Dominated by two giantsgiants – PT Matahari Department Store Tbk (spun off from PT Matahari Putra Prima Tbk) and PT Ramayana Lestari Sentosa Tbk. PT Matahari Department Store Tbk (MDS) is expected to retain its top market share in 2010). It plans to open 150 new stores within a 10Generation stores targets the middle and high income consumers while Parkson’s recently acquired Centro department stores target the middle income. PRA’s stores Java Island while one is at Kuta Bali. Figure 47: Number of outlets of top players
Source: Euromonitor International 2011
Figure 48: Selling space of top
Source: Euromonitor International 2011
101102 110
0
50
100
150
200
250
300
350
PT Ramayana
Lestari
Sentosa Tbk
512 525566
0
200
400
600
800
1000
1200
PT Ramayana
Lestari Sentosa
Tbk
Selling space ('000sqm)
See important disclosures at the end of this publication
See important disclosures at the end of this publication
Dominated by two giants. Indonesia’s department store retail market is dominated by two PT Matahari Department Store Tbk (spun off from PT Matahari Putra Prima Tbk)
and PT Ramayana Lestari Sentosa Tbk.
PT Matahari Department Store Tbk (MDS) is expected to retain its top market share in 2010). It plans to open 150 new stores within a 10Generation stores targets the middle and high income consumers while Parkson’s recently acquired Centro department stores target the middle income.
held a 2.5% share of retail sales in 2010. Four out of the five are located on sland while one is at Kuta Bali.
Number of outlets of top players
Euromonitor International 2011
Selling space of top players
Euromonitor International 2011
84
54
17 12 5 4
88
54
176 5
11098
52
188 5
PT Ramayana
Lestari
Sentosa Tbk
PT Matahari
Department
Store Tbk
PT Akur
Pratama
PT Mitra
Adiperkasa
Tbk
PT Sarinah
(Persero)
PT Tozy
Sentosa Metropolitan
Retailmart
2008 2009 2010
425
210156
4966
40
441
210156
49 33 40
566
491
224
156
49 44
Ramayana PT Matahari Department Store Tbk
PT Mitra Adiperkasa
Tbk
PT Akur Pratama
PT Metropolitan Retailmart
PT Sarinah (Persero)
PT Tozy Sentosa
Selling space ('000sqm)
2008 2009 2010
31
DMG Research
OSK Research
OSK Research DMG Research
Indonesia’s department store retail market is dominated by two PT Matahari Department Store Tbk (spun off from PT Matahari Putra Prima Tbk)
PT Matahari Department Store Tbk (MDS) is expected to retain its top position (32.7% market share in 2010). It plans to open 150 new stores within a 10-15 year period. Its New Generation stores targets the middle and high income consumers while Parkson’s recently
held a 2.5% share of retail sales in 2010. Four out of the five are located on
4 7 2
299
4 3 2
315
4 2 2
308
PT
Metropolitan
Retailmart
PT Rimo
Surabaya
Lestari Tbk
PT Golden
Retailindo
Tbk
Others
2010
11 23
892
4011 9
978
4011 5
927
PT Tozy Sentosa
PT Golden Retailindo
Tbk
PT Rimo Surabaya
Lestari Tbk
Others
See important disclosures at the end of this publication 32
See important disclosures at the end of this publication
DMG Research
OSK Research
OSK Research DMG Research
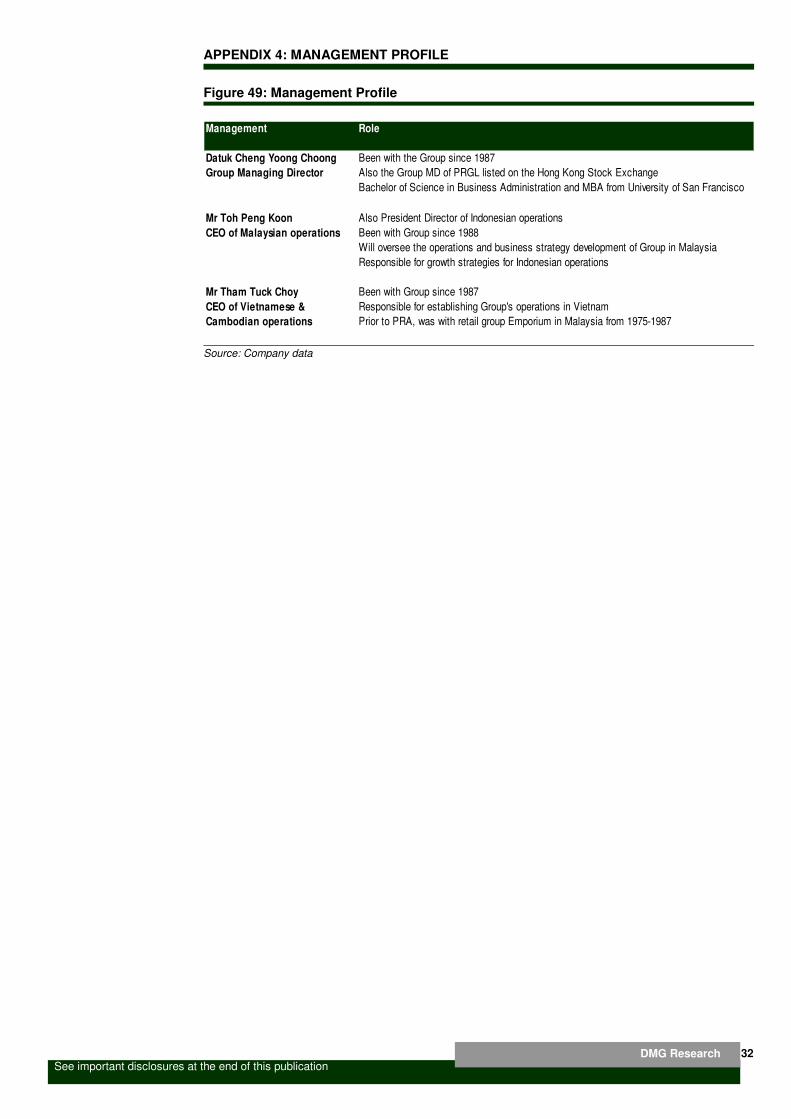
APPENDIX 4: MANAGEMENT PROFILE
Figure 49: Management Profile
Source: Company data
Management Role
Datuk Cheng Yoong Choong Been with the Group since 1987
Group Managing Director Also the Group MD of PRGL listed on the Hong Kong Stock Exchange
Bachelor of Science in Business Administration and MBA from University of San Francisco
Mr Toh Peng Koon Also President Director of Indonesian operations
CEO of Malaysian operations Been with Group since 1988
Will oversee the operations and business strategy development of Group in Malaysia
Responsible for growth strategies for Indonesian operations
Mr Tham Tuck Choy Been with Group since 1987
CEO of Vietnamese & Responsible for establishing Group's operations in Vietnam
Cambodian operations Prior to PRA, was with retail group Emporium in Malaysia from 1975-1987
See important disclosures at the end of this publication 33
See important disclosures at the end of this publication
DMG Research
OSK Research
OSK Research DMG Research
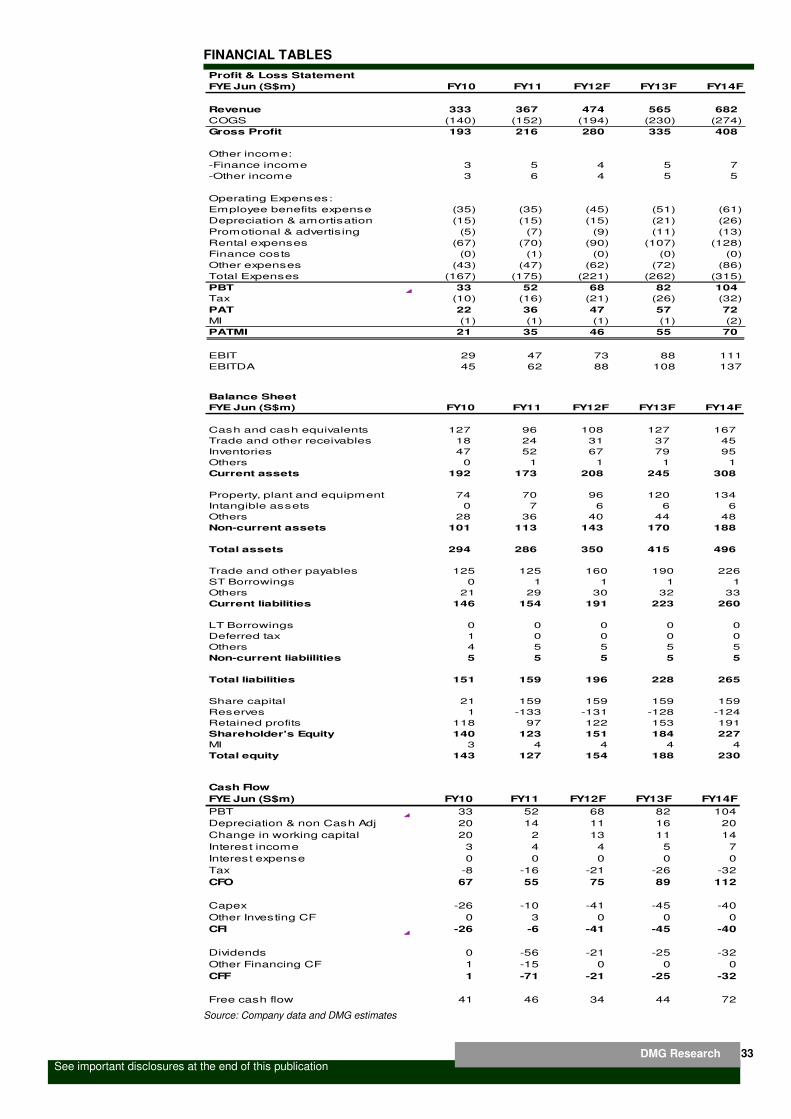
FINANCIAL TABLES
Source: Company data and DMG estimates
Profit & Loss Statement
FYE Jun (S$m) FY10 FY11 FY12F FY13F FY14F
Revenue 333 367 474 565 682
COGS (140) (152) (194) (230) (274)
Gross Profit 193 216 280 335 408
Other income:
-Finance income 3 5 4 5 7
-Other income 3 6 4 5 5
Operating Expenses:
Employee benefits expense (35) (35) (45) (51) (61)
Depreciation & amortisation (15) (15) (15) (21) (26)
Promotional & advertising (5) (7) (9) (11) (13)
Rental expenses (67) (70) (90) (107) (128)
Finance costs (0) (1) (0) (0) (0)
Other expenses (43) (47) (62) (72) (86)
Total Expenses (167) (175) (221) (262) (315)
PBT 33 52 68 82 104
Tax (10) (16) (21) (26) (32)
PAT 22 36 47 57 72
MI (1) (1) (1) (1) (2)
PATMI 21 35 46 55 70
EBIT 29 47 73 88 111
EBITDA 45 62 88 108 137
Balance Sheet
FYE Jun (S$m) FY10 FY11 FY12F FY13F FY14F
Cash and cash equivalents 127 96 108 127 167
Trade and other receivables 18 24 31 37 45
Inventories 47 52 67 79 95
Others 0 1 1 1 1
Current assets 192 173 208 245 308
Property, plant and equipment 74 70 96 120 134
Intangible assets 0 7 6 6 6
Others 28 36 40 44 48
Non-current assets 101 113 143 170 188
Total assets 294 286 350 415 496
Trade and other payables 125 125 160 190 226
ST Borrowings 0 1 1 1 1
Others 21 29 30 32 33
Current liabilities 146 154 191 223 260
LT Borrowings 0 0 0 0 0
Deferred tax 1 0 0 0 0
Others 4 5 5 5 5
Non-current liabiilities 5 5 5 5 5
Total liabilities 151 159 196 228 265
Share capital 21 159 159 159 159
Reserves 1 -133 -131 -128 -124
Retained profits 118 97 122 153 191
Shareholder's Equity 140 123 151 184 227
MI 3 4 4 4 4
Total equity 143 127 154 188 230
Cash Flow
FYE Jun (S$m) FY10 FY11 FY12F FY13F FY14F
PBT 33 52 68 82 104
Depreciation & non Cash Adj 20 14 11 16 20
Change in working capital 20 2 13 11 14
Interest income 3 4 4 5 7
Interest expense 0 0 0 0 0
Tax -8 -16 -21 -26 -32
CFO 67 55 75 89 112
Capex -26 -10 -41 -45 -40
Other Investing CF 0 3 0 0 0
CFI -26 -6 -41 -45 -40
Dividends 0 -56 -21 -25 -32
Other Financing CF 1 -15 0 0 0
CFF 1 -71 -21 -25 -32
Free cash flow 41 46 34 44 72
See important disclosures at the end of this publication 34
See important disclosures at the end of this publication
DMG Research
OSK Research
OSK Research DMG Research
DMG & Partners Research Guide to Investment Ratings Buy: Share price may exceed 10% over the next 12 months
Trading Buy: Share price may exceed 15% over the next 3 months, however longer-term outlook remains uncertain
Neutral: Share price may fall within the range of +/- 10% over the next 12 months
Take Profit: Target price has been attained. Look to accumulate at lower levels
Sell: Share price may fall by more than 10% over the next 12 months
Not Rated: Stock is not within regular research coverage
DISCLAIMERS This research is issued by DMG & Partners Research Pte Ltd and it is for general distribution only. It does not have any regard to the specific investment objectives, financial situation and particular needs of any specific recipient of this research report. You should independently evaluate particular investments and consult an independent financial adviser before making any investments or entering into any transaction in relation to any securities or investment instruments mentioned in this report. The information contained herein has been obtained from sources we believed to be reliable but we do not make any representation or warranty nor accept any responsibility or liability as to its accuracy, completeness or correctness. Opinions and views expressed in this report are subject to change without notice. This report does not constitute or form part of any offer or solicitation of any offer to buy or sell any securities. DMG & Partners Research Pte Ltd is a wholly owned subsidiary of DMG & Partners Securities Pte Ltd, a joint venture between OSK Investment Bank Berhad and Deutsche Asia Pacific Holdings Pte Ltd (a subsidiary of Deutsche Bank Group). DMG & Partners Securities Pte Ltd is a Member of the Singapore Exchange Securities Trading Limited. DMG & Partners Securities Pte Ltd and their associates, directors, and/or employees may have positions in, and may effect transactions in the securities covered in the report, and may also perform or seek to perform broking and other corporate finance related services for the corporations whose securities are covered in the report. As of the day before 9 February 2012, DMG & Partners Securities Pte Ltd and its subsidiaries, including DMG & Partners Research Pte Ltd, do not have proprietary positions in the subject companies, except for: a) Nil b) Nil As of the day before 9 February 2012, none of the analysts who covered the stock in this report has an interest in the subject companies covered in this report, except for:
Analyst Company a) Nil b) Nil
DMG & Partners Research Pte. Ltd. (Reg. No. 200808705N)
Kuala Lumpur Hong Kong Singapore
Jakarta Shanghai Phnom Penh
Bangkok
DMG & Partners Securities Pte. Ltd.
10 Collyer Quay #09-08 Ocean Financial Centre
Singapore 049315 Tel : +(65) 6533 1818 Fax : +(65) 6532 6211
OSK Securities Hong Kong Ltd.
12th Floor, World-Wide House
19 Des Voeux Road Central, Hong Kong
Tel : +(852) 2525 1118 Fax : +(852) 2810 0908
Malaysia Research Office OSK Research Sdn. Bhd.
6th Floor, Plaza OSK Jalan Ampang
50450 Kuala Lumpur Malaysia
Tel : +(60) 3 9207 7688 Fax : +(60) 3 2175 3202
OSK Indochina Securities Limited No. 1-3, Street 271,
Sangkat Toeuk Thla, Khan Sen Sok, Phnom Penh,
Cambodia Tel: (855) 23 969 161 Fax: (855) 23 969 171
OSK (China) Investment Advisory Co. Ltd.
Room 6506, Plaza 66 No.1266, West Nan Jing Road
200040 Shanghai China
Tel : +(8621) 6288 9611 Fax : +(8621) 6288 9633
PT OSK Nusadana Securities Indonesia
Plaza CIMB Niaga, 14th Floor,
Jl. Jend. Sudirman Kav.25, Jakarta Selatan 12920,
Indonesia. Tel : (6221) 2598 6888 Fax : (6221) 2598 6777
OSK Securities (Thailand) PCL 191, Silom Complex Building 16th Floor, Silom Road,Silom,
Bangrak, Bangkok 10500 Thailand
Tel: +(66) 2200 2000 Fax : +(66) 2632 0191