9m/q3 2017 financial results - tadawul€¦ · e-mail: [email protected] office: +966 13 801...
TRANSCRIPT

9M/Q3 2017 FINANCIAL RESULTS
SIPCHEM Q3 2017 EARNINGS CALL
31 OCTOBER 2017, 15:30 KSA, 12:30 UK, 08:30 EST
SIPCHEM Q3 2017 EARNINGS CALL 2
DISCLAIMER
Disclaimer and important information in relation to this presentation
This presentation has been prepared solely for use at the investor presentation concerning the financial results of Saudi International Petrochemical Company(Sipchem). By attending the investor presentation, or by reading the presentation slides, you agree to be bound by the following limitations.This presentation has been prepared by Sipchem solely for use by you at the investor presentation, held in connection with Sipchem’s financial results. Theinformation contained in this presentation does not purport to be comprehensive and has not been independently verified. No representation or warranty,express or implied, is made as to, and no reliance should be placed on, the fairness, accuracy, completeness or correctness of the information or opinionscontained in this presentation. The information set out in this presentation may be subject to updating, revision, verification and amendment and suchinformation may change materially. Sipchem is under no obligation to update or keep current the information contained in this presentation and any opinionsexpressed in it is subject to change without notice. None of Sipchem or any of its affiliates, advisers or representatives: (i) makes any representation or warranty,express or implied, as to the truth, fairness, accuracy or completeness of the information in this presentation (or whether any information has been omitted fromthis presentation); or (ii) shall have any liability whatsoever (in negligence or otherwise) for any loss whatsoever arising from any use of this presentation or itscontents, or otherwise arising in connection with this presentation.
The information in this presentation is given in confidence and may not be reproduced or redistributed to any other persons.This presentation does not constitute or form part of any offer to sell or issue or invitation to purchase or subscribe for, or any solicitation of any offer to purchaseor subscribe for, any securities of Sipchem or any of its subsidiaries or affiliates, nor shall it or any part of it nor the fact of its distribution form the basis of, or berelied on in connection with, any contract or investment decision. The information and opinions contained in this presentation are provided as at the date of thepresentation and are subject to change.
Certain statements in this presentation constitute "forward-looking statements". These statements include records of intentions, beliefs or expectations withrespect to, amongst other things, operations, financial conditions, liquidity, prospects, growth, strategies and the dividend policy of Sipchem, its subsidiaries,affiliates and the industries in which they operate. These statements, which contain the words "anticipate", "believe", "intend", "estimate", "expect" and words ofsimilar meaning, reflect Sipchem’s beliefs and expectations and are subject to risks and uncertainties that may cause actual results to differ materially. These risksand uncertainties include, amongst other factors, commodity price volatility and risks relating to technology, shared utilities, competition and price, financing,litigation, general operations, environment, feedstock supply and price, project interface and foreign exchange, as well as different market conditions and theprospects for growth anticipated by the management of Sipchem. These and other factors could adversely affect the outcome and financial effects of the plansand events described in this presentation. As a result, you are cautioned not to place undue reliance on such forward-looking statements. Sipchem disclaims anyobligation to update its view of such risks and uncertainties or to publicly announce the result of any revisions to the forward-looking statements made in thispresentation, except where it would be required to do so under applicable law.

SIPCHEM Q3 2017 EARNINGS CALL 3
9M/Q3 2017 RESULT
Highlights
Operations
Financials
SIPCHEM Q3 2017 EARNINGS CALL 4
SAR Million 2014 20152016IFRS
9 MOS 2017IFRS
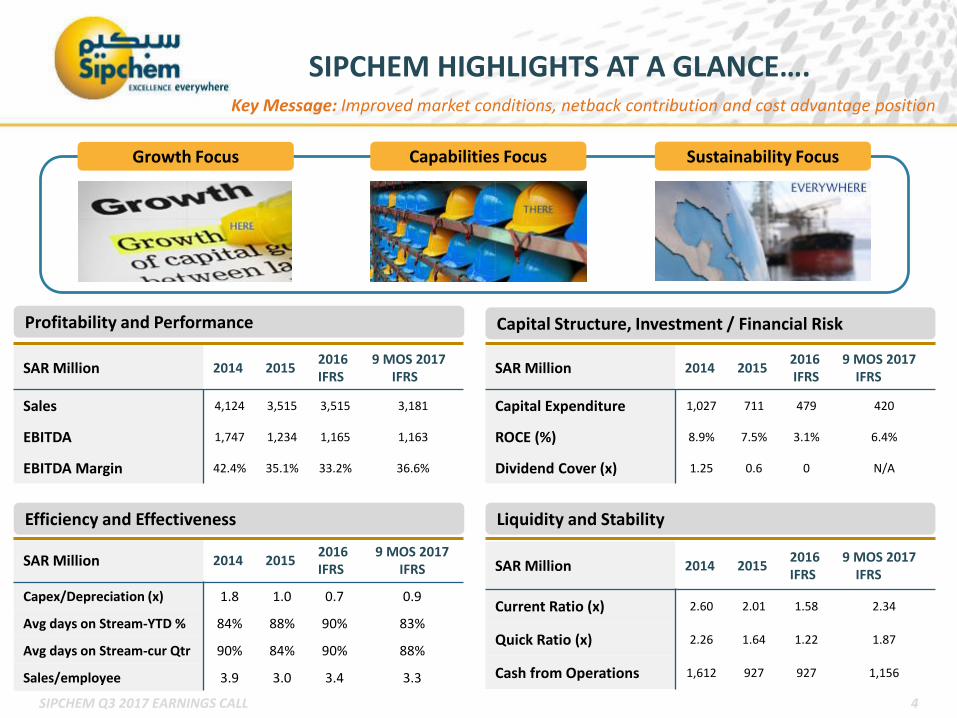
Capex/Depreciation (x) 1.8 1.0 0.7 0.9
Avg days on Stream-YTD % 84% 88% 90% 83%
Avg days on Stream-cur Qtr 90% 84% 90% 88%
Sales/employee 3.9 3.0 3.4 3.3
Profitability and Performance
Sustainability FocusCapabilities FocusGrowth Focus
Efficiency and Effectiveness
Capital Structure, Investment / Financial Risk
Liquidity and Stability
SAR Million 2014 20152016IFRS
9 MOS 2017IFRS
Sales 4,124 3,515 3,515 3,181
EBITDA 1,747 1,234 1,165 1,163
EBITDA Margin 42.4% 35.1% 33.2% 36.6%
SAR Million 2014 20152016IFRS
9 MOS 2017IFRS
Current Ratio (x) 2.60 2.01 1.58 2.34
Quick Ratio (x) 2.26 1.64 1.22 1.87
Cash from Operations 1,612 927 927 1,156
SAR Million 2014 20152016IFRS
9 MOS 2017IFRS
Capital Expenditure 1,027 711 479 420
ROCE (%) 8.9% 7.5% 3.1% 6.4%
Dividend Cover (x) 1.25 0.6 0 N/A
Key Message: Improved market conditions, netback contribution and cost advantage position
SIPCHEM HIGHLIGHTS AT A GLANCE….

SIPCHEM Q3 2017 EARNINGS CALL 5
Plant Performance
PRODUCTIONS SALES
Q2 2017 Q3 2017 Q3 2016
CHEMICALS BUSINESS
Chemical Product Performance
Market Update:
• Most chemicals prices increased during Q3 2017 vs the previous quarter.
25% 5% 16% 48%• Methanol• Butanediol,
Tetrahydrofuran• Maleic Anhydride• Carbon Monoxide• Gamma Butyrolactone• Acetic Acid• Acetic Anhydride• Vinyl Acetate
Monomer and Ethyl / Butyl Acetate

SIPCHEM Q3 2017 EARNINGS CALL 6
Plant Performance
PRODUCTIONS SALES
Q2 2017 Q3 2017 Q3 2016
POLYMERS BUSINESS
Polymers Product Performance
Market Update:
• Polymer prices remained slightly down during Q3 2017 vs. Q2 2017. Polymer prices up vs. last year.
-5% -10% 32% 23%• LDPE• EVA• Cross linkable LDPE• Semi conductive LDPE
SIPCHEM Q3 2017 EARNINGS CALL 7
YTD 2017
OTHER
POLYMERS
CHEMICAL
REVENUESYTD 2016
OTHER
POLYMERS
CHEMICAL
MARGINYTD 2017 YTD 2016
63%
29%
8%
54%
37%
9%
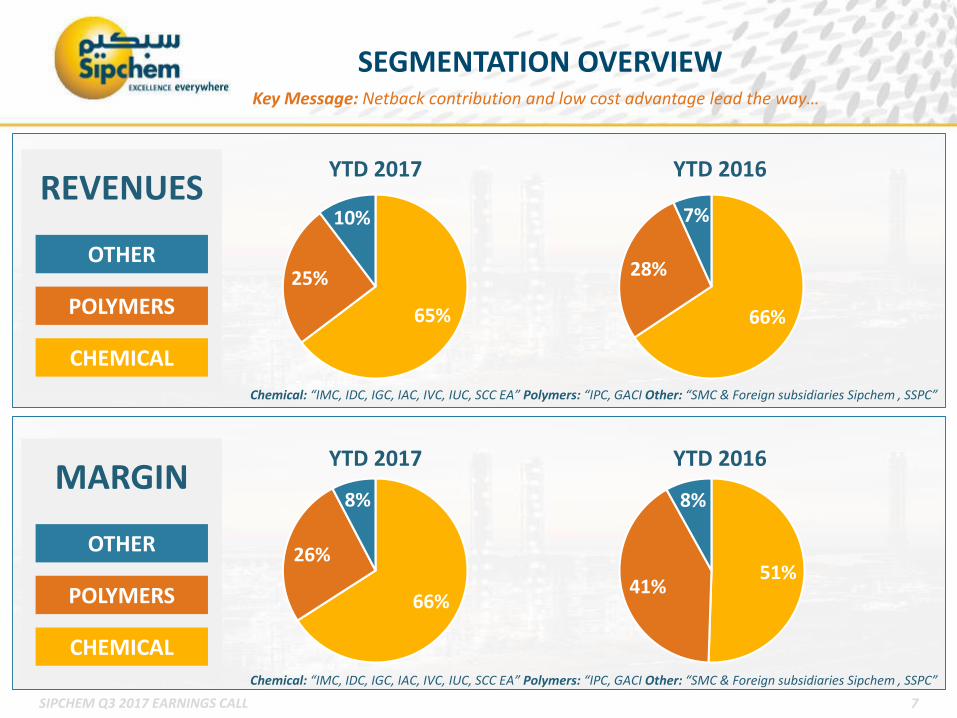
Key Message: Netback contribution and low cost advantage lead the way…
SEGMENTATION OVERVIEW
Chemical: “IMC, IDC, IGC, IAC, IVC, IUC, SCC EA” Polymers: “IPC, GACI Other: “SMC & Foreign subsidiaries Sipchem , SSPC”
Chemical: “IMC, IDC, IGC, IAC, IVC, IUC, SCC EA” Polymers: “IPC, GACI Other: “SMC & Foreign subsidiaries Sipchem , SSPC”
65%
25%
10%
66%
28%
7%
66%
26%
8%
51%41%
8%
SIPCHEM Q3 2017 EARNINGS CALL 8
OTHER
POLYMERS
CHEMICAL
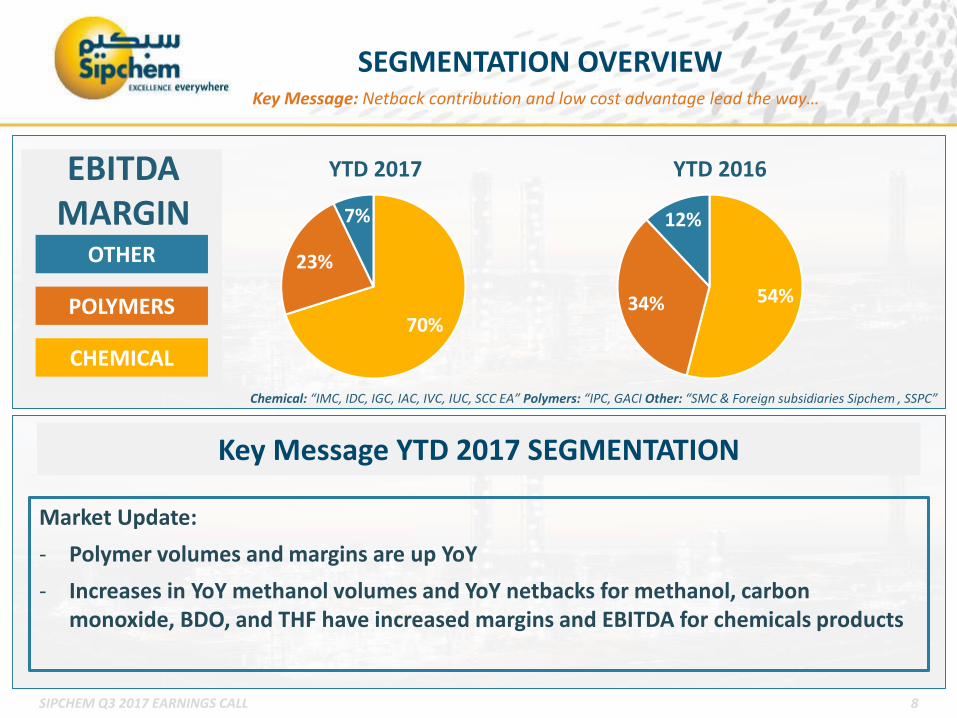
EBITDA MARGIN
Key Message YTD 2017 SEGMENTATION
71%
22%
6%
60%31%
9%
YTD 2017 YTD 2016
Key Message: Netback contribution and low cost advantage lead the way…
SEGMENTATION OVERVIEW
Chemical: “IMC, IDC, IGC, IAC, IVC, IUC, SCC EA” Polymers: “IPC, GACI Other: “SMC & Foreign subsidiaries Sipchem , SSPC”
70%
23%
7%
54%34%
12%
Market Update:
- Polymer volumes and margins are up YoY
- Increases in YoY methanol volumes and YoY netbacks for methanol, carbon monoxide, BDO, and THF have increased margins and EBITDA for chemicals products

SIPCHEM Q3 2017 EARNINGS CALL 10
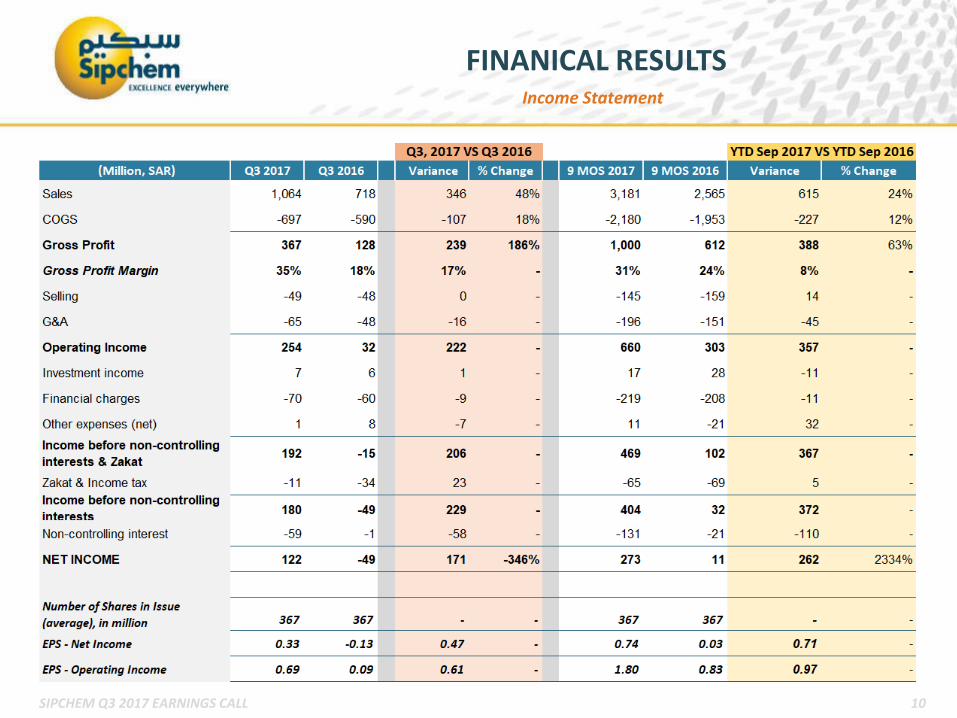
FINANICAL RESULTS Income Statement
SIPCHEM Q3 2017 EARNINGS CALL 11
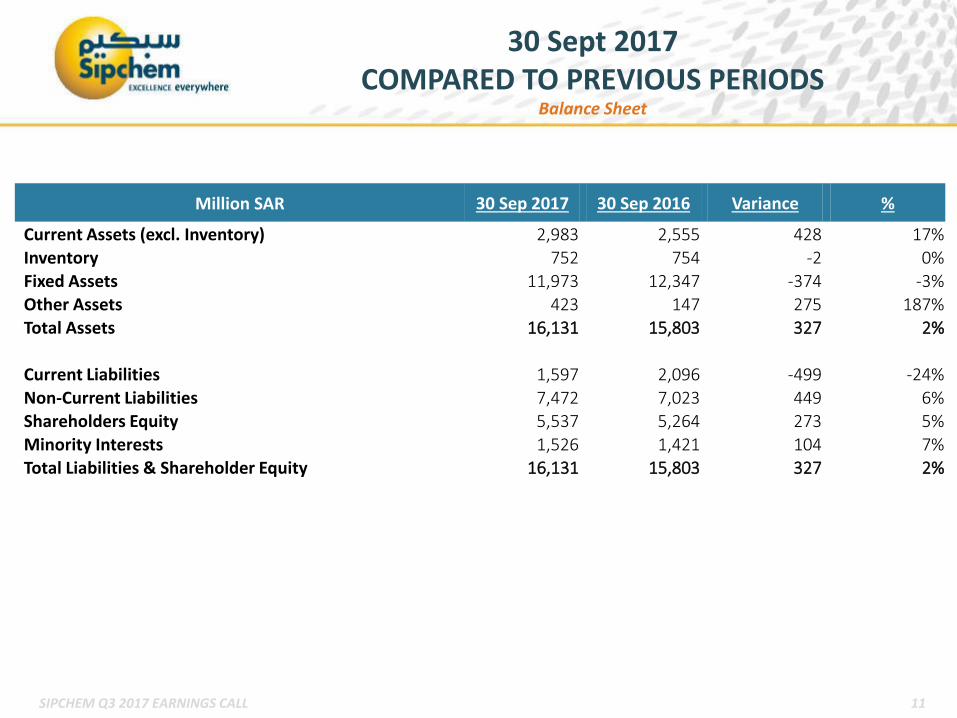
Balance Sheet
30 Sept 2017COMPARED TO PREVIOUS PERIODS
Million SAR 30 Sep 2017 30 Sep 2016 Variance %
Current Assets (excl. Inventory) 2,983 2,555 428 17%Inventory 752 754 -2 0%
Fixed Assets 11,973 12,347 -374 -3%Other Assets 423 147 275 187%
Total Assets 16,131 15,803 327 2%
Current Liabilities 1,597 2,096 -499 -24%Non-Current Liabilities 7,472 7,023 449 6%Shareholders Equity 5,537 5,264 273 5%
Minority Interests 1,526 1,421 104 7%Total Liabilities & Shareholder Equity 16,131 15,803 327 2%

SIPCHEM Q3 2017 EARNINGS CALL 12
Cash flow
9 MOS 2017 VS 2016 CASH FLOW
Million SAR 30 Sep 2017 30 Sep 2016 Variance %
Net Income before Minority, Zakat & Tax 469 102 367 362%
Depreciation of property, plant and equipment 475 429 46 11%
Amortization of intangibles and deferred costs 42 20 22 108%
Provision for employee benefits 24 29 -5 -16%
Loss on disposal of property, plant, and equipment 0.0 31 -31 -100%
Equity settled share based payments 0.4 0.1 0 300%
Net foreign exchange difference 0.1 -3 3 -103%
Finance charges -17 -28 11 -39%
Finance Income 219 208 11 5%
Changes in operating assets and liabilities -56 -95 39 -41%
Net cash provided by operating activities 1,156 694 462 67%
Purchase of property, plant and equipment -419 -272 -147 54%
Purchases of additional shares in subsidiaries 0 -375 375 -100%
Others Investing activities 16 36 -20 -55%
Net cash used in investing activities -403 -611 208 -34%
Changes in short term loans – net -200 -250 50 -20%
Changes in long term loans – net 38 -113 151 -134%
Changes in partners advances – net 8 0 8 100%
Interest paid -170 -184 14 -7%
Net change in Other Financing activities -51 27 -78 -290%
Net cash used in financing activities -375 -520 145 -28%
Changes in cash & cash equivalents 378 -438 815 -186%
Cash & cash equivalents at 1 Jan 1,823 2,127 -304 -14%
Exchange rate Changes Impact -1 2 -2 -133%
Cash & cash equivalents at 30 September 2,200 1,691 509 30%


SIPCHEM Q3 2017 EARNINGS CALL 14
For further enquiries, please contact:
Faisal Al-ModlijManager Investor Relations
E-mail: [email protected]
Office: +966 13 801 9399
SIPCHEM Q3 2017 EARNINGS CALL 15
Q&A
THANK YOU,