9th international icsi conference: budapest 2008 eu demographics: living more and reproducing less...
TRANSCRIPT

9th International iCSi Conference: Budapest 20089th International iCSi Conference: Budapest 2008
EU demographics: EU demographics: living more and living more and
reproducing lessreproducing less
Jitka RychtaříkováJitka RychtaříkováCharles University in Prague, Faculty of ScienceCharles University in Prague, Faculty of ScienceDepartment of Demography and GeodemographyDepartment of Demography and Geodemography
Albertov 6, 128 43 Praha 2, Czech RepublicAlbertov 6, 128 43 Praha 2, Czech Republic
ttel.: 420 221 951 420 e-mail: rychtael.: 420 221 951 420 e-mail: [email protected]@natur.cuni.cz

9th International iCSi Conference: Budapest 20089th International iCSi Conference: Budapest 2008
José Manuel Barroso:José Manuel Barroso:
Demographic changeDemographic change is one of the three major forces is one of the three major forces now remodeling Europe, now remodeling Europe,
alongside globalization and alongside globalization and technological change.technological change.

9th International iCSi Conference: Budapest 20089th International iCSi Conference: Budapest 2008
Reproducing less, Reproducing less, living longer,living longer,
and will age fastand will age fast

9th International iCSi Conference: Budapest 20089th International iCSi Conference: Budapest 2008
StructureStructure Recent fertility change and current fertility Recent fertility change and current fertility
patternspatterns New phenomena: low fertility, postponement, New phenomena: low fertility, postponement,
extramarital fertilityextramarital fertility Country classification based on current Country classification based on current
fertility patternsfertility patterns Mortality changeMortality change Population ageing as the outcome of fertility Population ageing as the outcome of fertility
change change Future fertility prospectsFuture fertility prospects

9th International iCSi Conference: Budapest 20089th International iCSi Conference: Budapest 2008
Shift toward rare and late chilbearingShift toward rare and late chilbearing
Profound Profound fertilityfertility declinedecline ha hass occurred in occurred in Northern and Northern and Western European societies Western European societies since the mid since the mid 1960s, was over by the end of 1960s, was over by the end of the 1980s in Southern Europe, and has the 1980s in Southern Europe, and has emerged since the beginning of the 1990s emerged since the beginning of the 1990s in Eastern Europe.in Eastern Europe.
Late fertilityLate fertility starts being a common widely starts being a common widely accepted pattern. accepted pattern.

9th International iCSi Conference: Budapest 20089th International iCSi Conference: Budapest 2008
Variations in TFR over timeVariations in TFR over time in 30 European countries in 30 European countries
simple reproductionsimple reproduction
low fertilitylow fertility
lowest low fertilitylowest low fertility
9th International iCSi Conference: Budapest 20089th International iCSi Conference: Budapest 2008
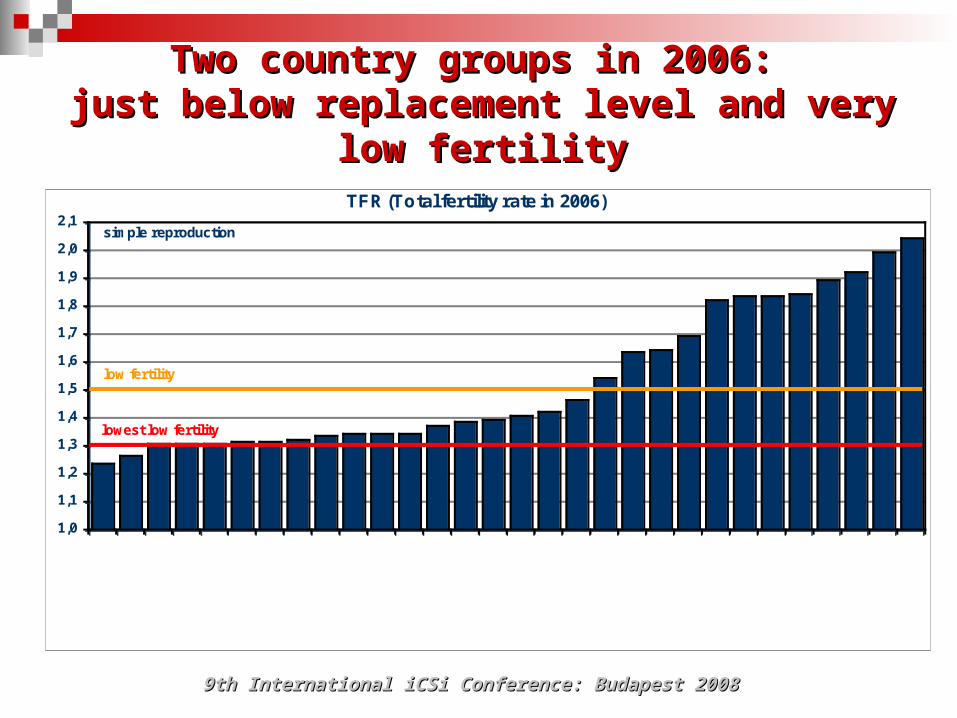
Two country groups in 2006: Two country groups in 2006: just below replacement level and very low fertilityjust below replacement level and very low fertility
1,241,271,311,311,311,321,321,331,341,351,351,351,381,391,401,411,431,471,551,641,651,701,831,841,841,851,901,932,002,051,0
1,1
1,2
1,3
1,4
1,5
1,6
1,7
1,8
1,9
2,0
2,1
SlovakiaPoland
LithuaniaRomaniaSloveniaGermany
Italy
Czech Republic
HungaryLatvia
PortugalSpain
BulgariaGreeceAustria
Malta
Switzerland
CyprusEstoniaBelgium
LuxembourgNetherlands
DenmarkFinland
United Kingdom
SwedenNorwayIrelandFranceIceland
TFR (Total fertility rate in 2006)
simple reproduction
lowest low fertility
low fertility

9th International iCSi Conference: Budapest 20089th International iCSi Conference: Budapest 2008
Low fertility trapLow fertility trap: : two critical tresholdstwo critical tresholds
Low fertility: TFR less than 1,5Low fertility: TFR less than 1,5 Lowest low fertility: TFR less than 1,3Lowest low fertility: TFR less than 1,3
P. McDonald (2005)P. McDonald (2005): : it is much more difficult for it is much more difficult for aa country to raise fertility when the total fertility country to raise fertility when the total fertility rate has fallen below the critical level of 1rate has fallen below the critical level of 1,,5 5 children per woman. children per woman.
The situation becomes even more desperate The situation becomes even more desperate when the lowest low fertility (below 1when the lowest low fertility (below 1,,3) is 3) is reachedreached..

9th International iCSi Conference: Budapest 20089th International iCSi Conference: Budapest 2008
Fertility postponement a partFertility postponement a part of a postponement transition of a postponement transition
Longer educationLonger education Building a professional careerBuilding a professional career Reliable contraceptionReliable contraception ART treatmentART treatment „solving“ also problems „solving“ also problems
of postponed parenthoodof postponed parenthood
Factors behindFactors behind

9th International iCSi Conference: Budapest 20089th International iCSi Conference: Budapest 2008
Younger age does not more mean a higher fertility Younger age does not more mean a higher fertility
24
25
26
27
28
29
30
BulgariaRomaniaLithuania
LatviaEstoniaSlovakia
PolandIceland
Czech Republic
HungaryAustria
PortugalCyprus
BelgiumIrelandNorway
SloveniaFinland
DenmarkGreeceFrance
Sweden
Italy
NetherlandsLuxembourg
Germany
Spain
Switzerland
United Kingdom
Mean age at first childbirth in 2005
9th International iCSi Conference: Budapest 20089th International iCSi Conference: Budapest 2008
Late parenthood (motherhood): Late parenthood (motherhood): miscellaneous impact on fertility levels
North and WestNorth and West of Europe: a higher age at the of Europe: a higher age at the first childbearing does not imply low fertility first childbearing does not imply low fertility levels.levels.
East and SouthEast and South of Europe show a „negative of Europe show a „negative correlation“ between an increasing age of correlation“ between an increasing age of mothers and final low fertility levels, thus mothers and final low fertility levels, thus confirming a classical theory as regards confirming a classical theory as regards the relationship between age at first childbirth the relationship between age at first childbirth and final fertility rate.and final fertility rate.

9th International iCSi Conference: Budapest 20089th International iCSi Conference: Budapest 2008
2006: Cumulative age-specific fertility rates; (country order according to TFR)
0,0
0,2
0,4
0,6
0,8
1,0
1,2
1,4
1,6
1,8
2,0
SlovakiaLithuaniaPoland
SloveniaRomania
Italy
Germany
Czech Republic
HungarySpain
PortugalLatvia
BulgariaGreeceAustria
Malta
Switzerland
CyprusEstoniaBelgium
LuxembourgNetherlands
Denmark
United Kingdom
FinlandSwedenNorwayIrelandFranceIceland
-19 20-24 25-29 30-34 35+

9th International iCSi Conference: Budapest 20089th International iCSi Conference: Budapest 2008
Another new phenomenonAnother new phenomenon
Increase in extra-marital birthsIncrease in extra-marital births
Accelerating in last decadesAccelerating in last decades Reflecting cultural settingsReflecting cultural settings

9th International iCSi Conference: Budapest 20089th International iCSi Conference: Budapest 2008
Extra-marital births per 100 births:Extra-marital births per 100 births:uneven increase over timeuneven increase over time
0
10
20
30
40
50
60
70
GreeceCyprus
Switzerland
Italy
PolandMalta
BelgiumSpain
Slovakia
Luxembourg
RomaniaLithuaniaGermanyPortugalIreland
Czech Republic
Hungary
Netherlands
AustriaFinlandLatvia
United Kingdom
DenmarkSloveniaFrance
BulgariaNorwaySwedenEstoniaIceland
1960
1980
2006

9th International iCSi Conference: Budapest 20089th International iCSi Conference: Budapest 2008
Variations in share of extramarital births Variations in share of extramarital births over time in 30 European countriesover time in 30 European countries

9th International iCSi Conference: Budapest 20089th International iCSi Conference: Budapest 2008
An increase of extra-marital births An increase of extra-marital births does not mean a rising cohabitation does not mean a rising cohabitation as an alternative to family legalized as an alternative to family legalized
by marriage but more oftenby marriage but more oftenmeans a lone motherhoodmeans a lone motherhood
Countries with low nonmarital fertility ratios (Italy, Countries with low nonmarital fertility ratios (Italy, Spain, Belgium) tend to have also low overall Spain, Belgium) tend to have also low overall childhood exposure to single parenting. childhood exposure to single parenting.
Parental cohabitation accounts for much nonmarital Parental cohabitation accounts for much nonmarital fertility in Northern Europe.fertility in Northern Europe.P.Heuveline, J.T. Timberlake, F.F.Furstenberg: Shifting childrearing to single mothers: Results from 17 Western countries, Population and Development Review, 29, 2003, 1

9th International iCSi Conference: Budapest 20089th International iCSi Conference: Budapest 2008
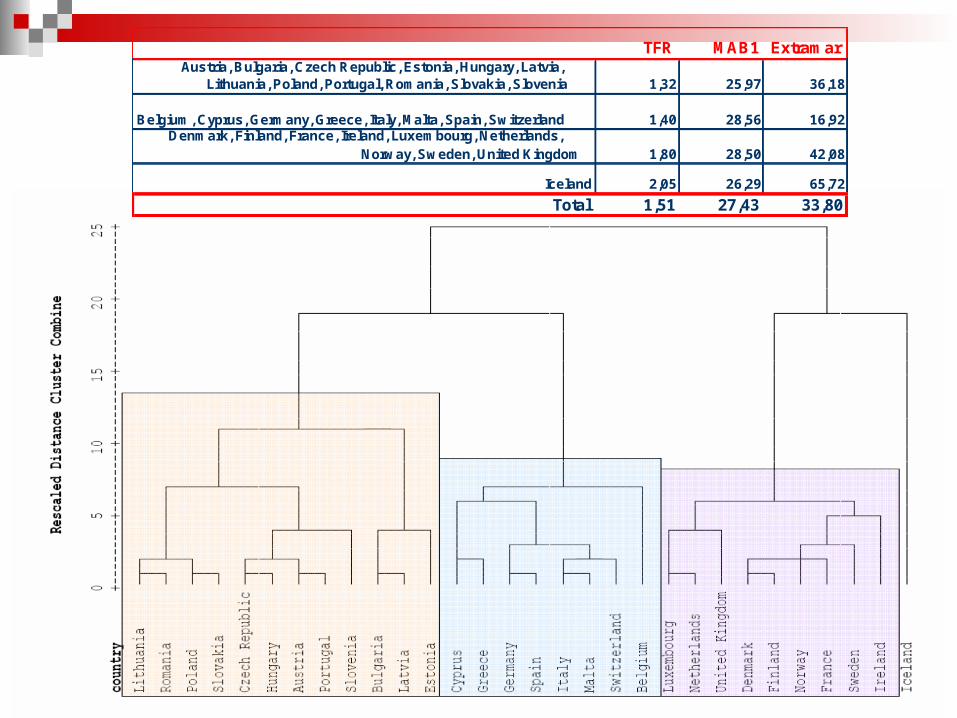
A country classification according to A country classification according to current levels of TFR, mean age at current levels of TFR, mean age at
first chilbearing, and the percentage first chilbearing, and the percentage of extramarital births.of extramarital births.
Three country groups and Three country groups and one outlier can be delimited.one outlier can be delimited.
Three most imortant recent changes: fertility Three most imortant recent changes: fertility decline, increase in mean age at first childbirth, decline, increase in mean age at first childbirth,
increase in the share of extra-marital birthsincrease in the share of extra-marital births
9th International iCSi Conference: Budapest 20089th International iCSi Conference: Budapest 2008
TFR MAB1 Extramar
Total 1,51 27,43 33,80
28,50 42,08
Iceland 2,05 26,29 65,72
25,97 36,18
1,40 28,56 16,92
Austria, Bulgaria, Czech Republic, Estonia, Hungary, Latvia, Lithuania, Poland, Portugal, Romania, Slovakia, Slovenia
Belgium, Cyprus, Germany, Greece, Italy, Malta, Spain, SwitzerlandDenmark, Finland, France, Ireland, Luxembourg, Netherlands,
Norway, Sweden, United Kingdom
1,32
1,80

9th International iCSi Conference: Budapest 20089th International iCSi Conference: Budapest 2008
Cluster characteristics show Cluster characteristics show puzzled fertility patternspuzzled fertility patterns
1.1. GroupGroup (Austria, Bulgaria, Czech Republic, Estonia, Hungary, Latvia, Lithuania, Poland, Portugal, Romania, Slovakia, Slovenia) shows shows the lowest low the lowest low fertility levelfertility level, the youngest age at first childbearing, and medium , the youngest age at first childbearing, and medium frequency of extramarital births.frequency of extramarital births.
2.2. Group Group (Belgium, Cyprus, Germany, Greece, Italy, Malta, Spain, Switzerland) displays low fertility, the oldest age at first childbearing, and low low fertility, the oldest age at first childbearing, and low proportion of extramarital births.proportion of extramarital births.
3.3. Group Group (Denmark, Finland, France, Ireland, Luxembourg, Netherlands, Norway, Sweden, United Kingdom), experiences the highest fertilitythe highest fertility, high , high age at first childbirth, and a high share of nonmarital births.age at first childbirth, and a high share of nonmarital births.
Might this group represent forerunners of Might this group represent forerunners of a suitable/sustainable fertility?a suitable/sustainable fertility?
Traditional demographic correlations are violated: young age and Traditional demographic correlations are violated: young age and low frequency of extra-marital births do no more correlate with low frequency of extra-marital births do no more correlate with
high fertility levels!high fertility levels!

9th International iCSi Conference: Budapest 20089th International iCSi Conference: Budapest 2008
Cohort fertility of women born in 1980:Cohort fertility of women born in 1980:Possible future prospects?Possible future prospects?
Fertility rates for older ages estimated by using the rates observed for previous generationsFertility rates for older ages estimated by using the rates observed for previous generations
1,281,311,311,311,321,331,331,361,371,371,371,391,391,431,431,441,471,571,601,691,721,771,801,811,851,861,951,952,091,0
1,1
1,2
1,3
1,4
1,5
1,6
1,7
1,8
1,9
2,0
2,1
Slovenia
ItalyPoland
SlovakiaSpain
Czech Republic
GreeceHungaryBulgariaGermany
Latvia
LithuaniaRomaniaAustria
Portugal
Switzerland
CyprusEstoniaBelgium
LuxembourgNetherlands
Sweden
United Kingdom
FinlandDenmark
NorwayFranceIrelandIceland
CFR (completed fertility rate: birth cohort 1980)
simple reproduction
lowest low fertility
low fertility

9th International iCSi Conference: Budapest 20089th International iCSi Conference: Budapest 2008
Mortality change and its impactMortality change and its impact
Decrease at older age in all countriesDecrease at older age in all countries
Population 65+: Population 65+: pension systempension system
Population 80+: Population 80+: health care systemhealth care system

9th International iCSi Conference: Budapest 20089th International iCSi Conference: Budapest 2008
Survival in EU27+Survival in EU27+(2)(2): 2005: 2005
10
12
14
16
18
20
22
24
Latvia
LithuaniaBulgariaEstonia
SlovakiaHungaryRomaniaPoland
Czech Republic
SloveniaPortugalDenmark
Malta
Netherlands
Belgium
Luxembourg
ItalyCyprusFinlandIreland
GermanyAustria
United Kingdom
GreeceSpain
SwedenFrance
Males
Females
Life expectancy at age 65

9th International iCSi Conference: Budapest 20089th International iCSi Conference: Budapest 2008
Fertility is the key factor as regards Fertility is the key factor as regards the future population ageingthe future population ageing
Proportion of population aged 65 and over in 2050 Proportion of population aged 65 and over in 2050 is correlated with is correlated with (based on EU27 countries)(based on EU27 countries)::
Total fertility rate (2005) -0,591**
Population 65+ (2005) 0,454*
Male life expectancy at 65 (2004) -0,004
Female life expectancy at 65 (2004) -0,043
** Correlation is significant at the 0,01 level (2- tailed)* Correlation is significant at the 0,05 level (2-tailed)
9th International iCSi Conference: Budapest 20089th International iCSi Conference: Budapest 2008
Very low fertility levels if maintained will lead to Very low fertility levels if maintained will lead to rapid population loss and an extreme form of rapid population loss and an extreme form of
population ageing in individual countries.population ageing in individual countries.
Between 2005 and 2050 the percentage of people aged 65+ will increase from 11,6% (Slovakia) to 33,5% (Bulgaria) in the new member states, while in the original EU15 it will increase from 11,2% (Ireland) to 35,6% (Spain).
The fastest growing age group will be that of oldest-old, people aged 80 and more; while the proportion of 65+ will double, that of 80+ will triple.
The highest figures of 80+ are expected in Italy, Germany, and Spain; the new member states with shorter life expectancies at the age of 80 are lagging behind in this trend.

9th International iCSi Conference: Budapest 20089th International iCSi Conference: Budapest 2008
The percentage of persons The percentage of persons aged 65 and older is expected to almost aged 65 and older is expected to almost
double by 2050 in the EU2double by 2050 in the EU277..
Top six in 2005Top six in 2005 Italy 19,2 Germany 18,6 Greece 17,8 Sweden 17,2 Belgium 17,1 Bulgaria 17,1
Top six in 2050Top six in 2050 Spain 35,6 Italy 35,3 Bulgaria 33,5 Greece 32,5 Portugal 31,9 Germany 31,6
9th International iCSi Conference: Budapest 20089th International iCSi Conference: Budapest 2008
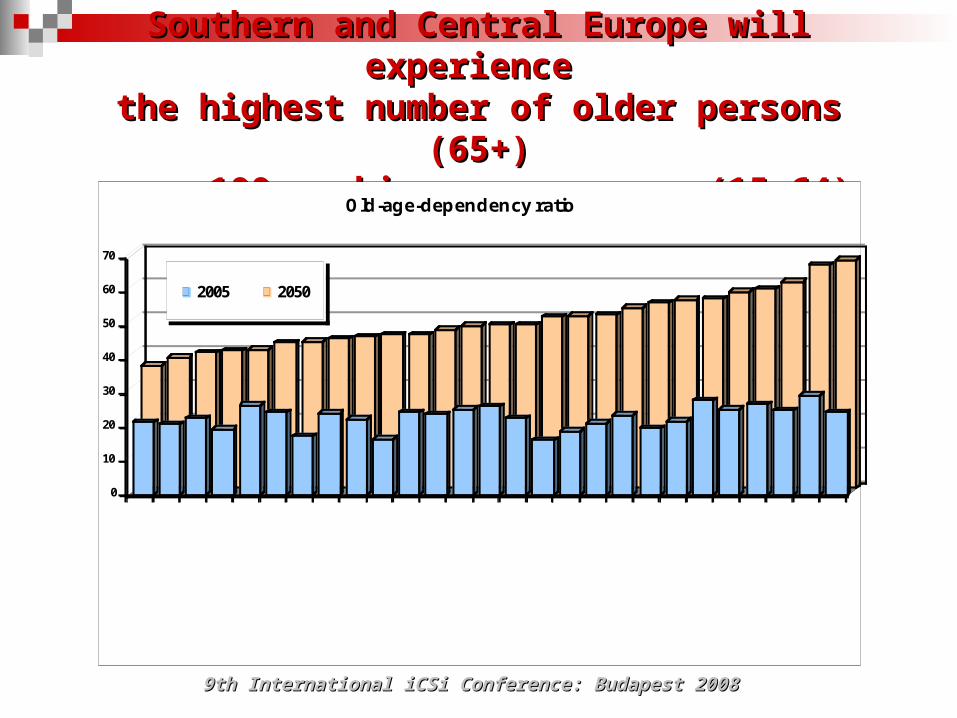
Southern and Central Europe will experience Southern and Central Europe will experience the highest number of older persons (65+)the highest number of older persons (65+)
per 100 working age persons (15-64) per 100 working age persons (15-64)
0
10
20
30
40
50
60
70
LuxembourgNetherlands
Denmark
MaltaSwedenEstoniaCyprusLatvia
LithuaniaIreland
United Kingdom
FinlandFranceBelgiumHungarySlovakia
PolandRomania
Austria
Czech Republic
SloveniaGermanyPortugalGreece
Bulgaria
ItalySpain
2005 2050
Old-age-dependency ratio

9th International iCSi Conference: Budapest 20089th International iCSi Conference: Budapest 2008
Old age dependency ratio: the number of persons aged 65+
per 100 of persons at 15-64
Currently (2005): 16,3 (Slovakia) and 29,3 (Italy)
In the future (2050): 36,1 (Luxembourg) and 67,5 (Spain)

9th International iCSi Conference: Budapest 20089th International iCSi Conference: Budapest 2008
Between 200Between 20055 and 2050, and 2050, the largest declinesthe largest declines in population size in population size are expected to are expected to
occuroccur in the new member statesin the new member states of EU27 of EU27
BulgariaRomaniaLatviaEstonia
Lithuania
Czech Republic
SlovakiaPoland
Hungary
Italy
GermanyPortugal
DenmarkBelgiumFranceUnited KingdomNetherlandsSwedenMaltaCyprusIrelandLuxembourg
AustriaFinlandSpain
SloveniaGreece
-35
-30
-25
-20
-15
-10
-5
0
5
10
15
20
25
30
35
40 %
Percentage increase or decrease of total population between 2005 and 2050
9th International iCSi Conference: Budapest 20089th International iCSi Conference: Budapest 2008
EU Old and New MembersEU Old and New Members:: keep beingkeep being ddividedivided
The most substantial The most substantial percentage percentage decrease decrease will be experienced by the populationswill be experienced by the populations
in the fresh newcomers (Bulgaria, Romania),
then Baltic States (Latvia, Estonia, and Lithuania),
followed by Central Europe (Czech Republic, Slovakia, Poland, and Hungary)

9th International iCSi Conference: Budapest 20089th International iCSi Conference: Budapest 2008
Can fertility be enhanced ?Can fertility be enhanced ?
The role of family policyThe role of family policy
The role of ARTThe role of ART

9th International iCSi Conference: Budapest 20089th International iCSi Conference: Budapest 2008
Two scenarios for the future numbers of Two scenarios for the future numbers of children conceived with ARTchildren conceived with ART
0
10 000
20 000
30 000
40 000
50 000
Malta
Luxembourg
CyprusEstoniaSlovenia
Latvia
LithuaniaBulgariaSlovakiaIrelandFinland
DenmarkAustria
Czech Republic
HungaryGreecePortugalSwedenBelgiumRomania
Netherlands
SpainPoland
Italy
Germany
United Kingdom
France
2025
2050
Projected numbers of ART infants
Assumptions: 2025 in each country 5% ART infants 2050 in each country 7% ART infants

9th International iCSi Conference: Budapest 20089th International iCSi Conference: Budapest 2008
Proposal IProposal I Building a sBuilding a society for all agesociety for all ages Enabling to have family at any ageEnabling to have family at any age Reconciliation of workReconciliation of work//education and education and
familyfamily Freedom of choiceFreedom of choice
One standard life pattern One standard life pattern should be avoidedshould be avoided
education-career-childreneducation-career-children

9th International iCSi Conference: Budapest 20089th International iCSi Conference: Budapest 2008
Proposal IIProposal II
Access to ART treatment for people in Access to ART treatment for people in needneed and and at any ageat any age
Giving priority to policies slowing Giving priority to policies slowing fertility ageing fertility ageing

9th International iCSi Conference: Budapest 20089th International iCSi Conference: Budapest 2008
Thank youThank you