a 2020 survey report
TRANSCRIPT

IRANIANS’ ATTITUDES TOWARD
THE DEATH PENALTY:
A 2020 SURVEY REPORT
The Group for Analyzing and Measuring Attitudes in IRAN (GAMAAN)
AMMAR MALEKI Assistant Professor of Comparative Politics, Tilburg University
POOYAN TAMIMI ARAB Assistant Professor of Religious Studies, Utrecht University
October 2020, The Netherlands
This study was commissioned by Iran Human Rights (IHR) and the World Coalition Against the
Death Penalty (WCADP). We express our sincere gratitude to all the volunteers who, in one way
or another, assisted us in conducting this survey on Iranians’ attitudes toward the death penalty.
Special thanks to Dr. Shirin Ebadi for her consultation on the survey questions.
Iran Human Rights (IHR) is an independent non-partisan NGO struggling for the abolition of the
death penalty and the establishment of the rule of law and universal human rights in Iran. IHR is a
member of the World Coalition Against the Death Penalty since 2009 and an elected member of
the coalition’s steering committee. IHR is registered and based in Norway.
Website: www.iranhr.net E-mail:[email protected]
Twitter: @IHRights Instagram: @IranHumanRights Telegram: IranHumanRightsOrg
The World Coalition Against the Death Penalty is an alliance of more than 150 NGOs, bar
associations, local authorities and unions, that was created in Rome in 2002. The aim of the World
Coalition is to strengthen the international dimension of the fight against the death penalty. Its
ultimate objective is to obtain the universal abolition of the death penalty.
Website: www.worldcoalition.org
Twitter: @WCADP Instagram: @WorldCoalition Facebook: WorldCoalition
Any use of this research or parts thereof is permitted only if properly cited:
Maleki, Ammar and Pooyan Tamimi Arab. 2020. Iranians’ attitudes toward the death penalty: A
2020 survey report. Published online, gamaan.org: GAMAAN.
The Group for Analyzing and Measuring Attitudes in Iran (GAMAAN) is an
independent, non-profit research foundation registered in the Netherlands.
Copyright © 2020 GAMAAN. All rights reserved.
Website: www.gamaan.org E-mail: [email protected]
Twitter: @gamaanresearch Telegram: /gamaanresearch Instagram: /gamaanresearch

1
Survey summary
• The survey titled “Iranians’ attitudes toward the death penalty” was conducted from
September 3 to 11, 2020. Over 24 thousand respondents were surveyed, around
86% of whom lived in Iran.
• This study’s findings reflect the views of literate Iranian residents aged above 19,
who comprise 85% of Iran’s adult population. The results can be generalized to
the target population with a 95% credibility level and credibility intervals of 5%. The
survey aimed to measure and document the attitudes of Iranians toward the death
penalty and related issues, none of which can be openly discussed in Iran due to
the current restrictions.
• The results show that around 44% of the population resolutely oppose the death
penalty, and 26% agree with the death penalty in unique cases only (faqat barāy-i
barkhī mavārid-i khāṣ).
• The highest approval rate for the death penalty is for serial murder or massacre
(qatl-i ‘ām) with 50% of the population agreeing with the death penalty for these
crimes. 32% are in favor of the death penalty for rape, 32% for premeditated
murder, 29% for extensive embezzlement and corruption, 18% for espionage and
treason, 17% for significant drug trafficking, 11% for kidnapping, 9% for armed
robbery and 8% for armed operations against the government. About 14% of the
population agree with the death penalty as a punishment mandated by Sharia law
(for crimes such as apostasy, blasphemy, and adultery).
• 68% of the population disagree with the statement that “the death penalty prevents
crime and makes society safer” and 67% disagree that “the death penalty brings
justice.” Furthermore, 60% believe that the death penalty promotes and normalizes
violence in society, and 57% think that the death penalty does not give the victim’s
family closure.
• 62% believe that the judiciary should set the type and length of the punishment for
murder, not the victim’s family. 46% also think that the right to life should not be
taken, even if the person has committed a crime.
• 85% oppose the death penalty for offenders who were under the age of 18 at the
time of committing murder, and 84% believe that the punishment and diyah (blood-
money) should not depend on the victim’s sex (male or female).
• 86% of the population oppose public executions and 17% of the target population
have witnessed public executions.

2
• In response to the question, “if a member of your immediate family was murdered,
which punishment would you prefer for the killer?” around 48% chose life or long-
term imprisonment and 5% said they would prefer to receive the diyah and forgive
the perpetrator. In contrast, about 22% chose the death penalty or qiṣāṣ
(retribution-in-kind).
• In response to the question asking what punishment should be given to the former
officials of a previous government during a transitional period from an authoritarian
government, about 32% agreed with “punishments other than the death penalty”
for the perpetrators of massacres, while about 5% agree with a general amnesty
(‘afv-i umūmī) and the formation of a truth commission (kumītah-hāy-i ḥaqīqat-yāb).
In contrast, 31% agree with the death penalty for former government officials, as
long as they are sentenced to death in a fair trial. About 7% of the population agree
with the “revolutionary execution” of senior officials of the former government. More
than 24% believe that law experts should decide on such a complex subject matter.
• In response to the question about who should be the final arbiter on the existence
or abolition of the death penalty in Iranian law, 69% hold the opinion that the people
should decide on the abolition of the death penalty through a referendum. About
17% chose a democratically elected parliament as decision makers, and 14%
believe that in an Islamic country, religious authorities should decide on the
existence or abolition of the death penalty.

3
Section 1: Sampling methods and sample characteristics
1.1 Survey and raw sample characteristics
• The Group for Analyzing and Measuring Attitudes in Iran (GAMAAN) conducted
the “Iranians’ attitudes toward the death penalty” survey from September 3 to 11,
2020. This survey was conducted online using a specialized and secure platform.
• The sampling methods were multiple chain-referral sampling (or multiple virtual
snowball sampling) through social media (Telegram, Instagram, WhatsApp,
Twitter, and Facebook). More than 24,000 respondents living inside and outside
Iran participated in the study (see the Appendix for more information on methods).
• According to Iran’s official statistics published in August 2020, 78 million people
(94% of the total population) use the Internet, among whom 69 million are mobile
Internet subscribers. On the other hand, as reported by the Iranian Students Polling
Agency (ISPA) in March 2020, roughly 70% of Iranians use at least one social
media platform. It is therefore possible to reach a substantial percentage of
Iranians through the Internet and ask about their views.
• The survey comprised eight questions about the death penalty as well as eight
general and demographic questions (sex, age group, level of education, province,
urban/rural region, employment status, income level, and voting behavior).
• Respondents took part in the survey anonymously, feeling safer to express their
real opinions than in telephone surveys or surveys conducted at respondents’
residence.
• Approximately 86% of the respondents reported that they live in Iran. Multiple
verification methods showed that around 1%, either intentionally or unintentionally,
reported false information about being inside or outside Iran.
• Iranians living inside Iran who responded to the survey were from all provinces and
both urban and rural areas. The sample characteristics can be found in the
Appendix.
1.2 Preparing the refined sample
• One survey question was designed to detect random responses and bot
submissions. The forms with a wrong response to this question and forms with
contradictory answers were excluded from the sample (for example, those who
declared that they had not reached voting age in the 2017 presidential election but
also chose their age as over 30, or those who declared that they live in Iran in one
question but selected outside Iran in another question).

4
• Having taken into account the standard age groups as outlined in the 2016 Census
report, the refined sample included only respondents above 19 years old who lived
in Iran.
• The refined sample size for respondents inside Iran was 19,646 respondents. All
results in this report are extracted from this refined sample.
• The target population consisted of literate Iranian residents above 19 years old
(who were capable of using the Internet and reading the survey questions). As
reported by the 2016 National Population and Housing Census, around 47 million
Iranians are literate and above 19 years old. This accounts for 85% of the adult
population of Iran.
• In this report, the term “sample” refers exclusively to the refined sample, not the
original raw sample. The term “population” refers only to the “target population,”
not the overall population of Iran.
• Samples obtained from online surveys generally do not properly overlap with the
target population’s characteristics. Weighting is used to obtain a representative
sample. This technique balances the sample in accordance with the characteristics
of the target population in question. The results were also verified through the
sample matching method. The Appendix discusses the employed sample
balancing and weighting methods, as well as the characteristics of the sample
demography and the target population.

5
Section 2: Main findings
All results, diagrams, and tables presented here are based on the “weighted sample”
extracted from respondents inside Iran. The findings can be generalized to the whole
population of literate Iranian residents above 19 years old, who account for 85% of the
total adult population of Iran, with the respective credibility intervals and credibility level
of 5% and 95% (which replace the margin of error and the confidence level in online
non-probability surveys).
2.1 General attitudes
The survey asked respondents about their opinion on the death penalty. About 44%
opposed the death penalty regardless of the crime and 26% agree with the death
penalty in unique cases only. Almost 13% agree with the death penalty as a
punishment mandated by Sharia law and 14% agree with the death penalty as
punishment for premeditated murder.
Figure 1

6
The survey results show that women oppose the death penalty slightly more often than men. Those who voted for Hassan Rouhani or did not vote in the 2017 presidential election are three times more likely to oppose the death penalty than those who voted for Ebrahim Raisi. Of those who voted for Raisi, 37% agree with the death penalty as a punishment mandated by Sharia law.
Figure 2
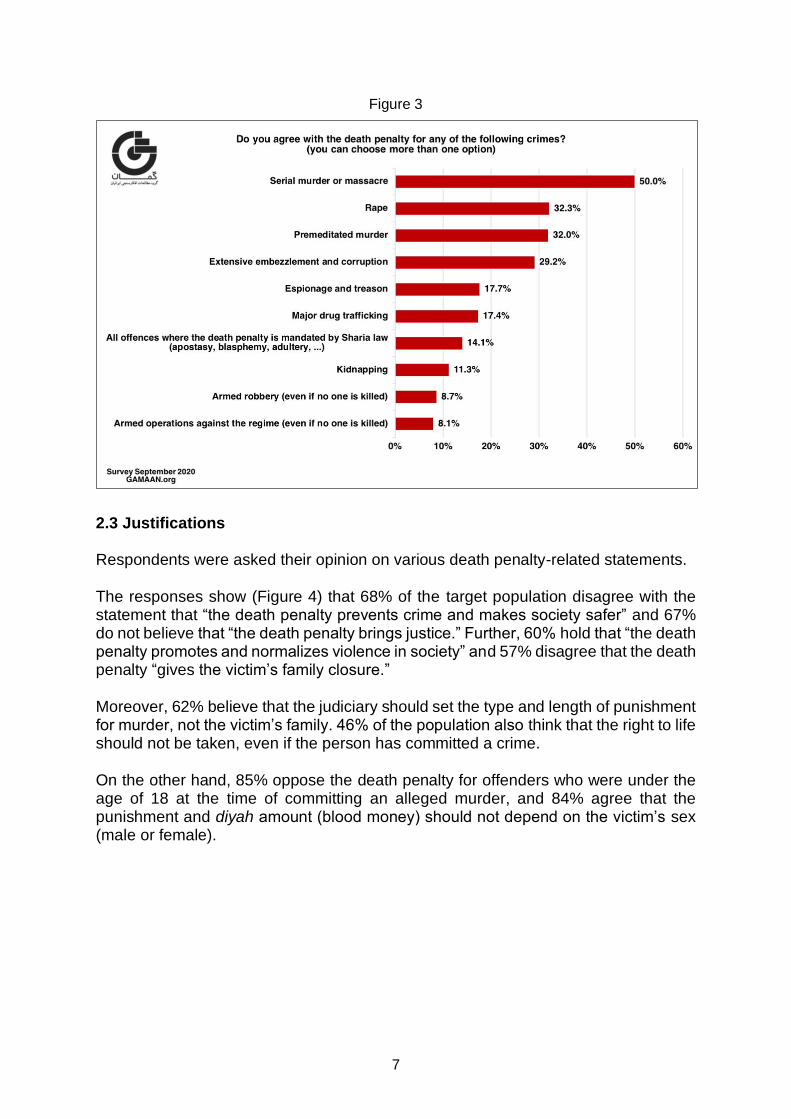
2.2 Cases
Respondents were asked in which cases they agreed with the possibility of the death penalty and could choose multiple options. Figure 3 shows that the highest rate of agreement with the death penalty was for cases of “serial murder and massacre [qatl-i ‘ām],” with 50% of the population in favor of the death penalty for these crimes. 32% also agree with the death penalty for rape, 32% for premeditated murder, 29% for extensive embezzlement and corruption, 18% for espionage and treason, 17% for major drug trafficking, 11% for kidnapping, 9% for armed robbery, and 8% for armed operations against the political regime. About 14% of the population agree with the death penalty as a punishment mandated by Sharia law (for crimes such as apostasy, blasphemy, and adultery).
7
Figure 3
2.3 Justifications Respondents were asked their opinion on various death penalty-related statements. The responses show (Figure 4) that 68% of the target population disagree with the statement that “the death penalty prevents crime and makes society safer” and 67% do not believe that “the death penalty brings justice.” Further, 60% hold that “the death penalty promotes and normalizes violence in society” and 57% disagree that the death penalty “gives the victim’s family closure.”
Moreover, 62% believe that the judiciary should set the type and length of punishment for murder, not the victim’s family. 46% of the population also think that the right to life should not be taken, even if the person has committed a crime. On the other hand, 85% oppose the death penalty for offenders who were under the age of 18 at the time of committing an alleged murder, and 84% agree that the punishment and diyah amount (blood money) should not depend on the victim’s sex (male or female).

8
Figure 4

9
According to the survey results, 86% of the population opposes public executions and 17% have witnessed public executions. The survey results show (Figure 5) that those in favor of the death penalty have witnessed public executions almost twice as often as those who oppose the death penalty.
Figure 5
2.4 Punishments In response to the question, “If a member of your immediate family was murdered, which punishment would you prefer for the murderer?” about 48% of the population selected a life sentence or long-term imprisonment (Figure 6), while 5% preferred to receive the diyah (blood money) and forgive. In contrast, about 22% chose execution or qiṣāṣ (retribution-in-kind) and about a quarter said they “don’t know” which option they favor.

10
Figure 6
2.5 Transitional justice Respondents were asked what kind of punishment they agree with during a transition from an authoritarian regime, to punish the perpetrators of massacres in the previous regime. Figure 7 shows that about one-third of the population disagrees with the death penalty, even if perpetrators are found guilty in a fair trial. About 5% favor a general amnesty (‘afv-i umūmī) and the formation of a truth commission (kumītah-hāy-i ḥaqīqat-yāb). In contrast, about a third think that perpetrators of massacres should be sentenced to death, as long as they are given a fair trial. About 7% agree with the revolutionary execution of the former regime’s officials. A quarter suggest that legal experts should be responsible for deciding on the best form of transitional justice.

11
Figure 7
2.6 Decision-makers A majority of 69% believe that the people should be the final arbiter of the existence or abolition of the death penalty in Iranian law (Figure 8), to be determined in a public referendum. About 17% chose an elected parliament as the final decision-making body, and about 14% think that religious authorities should decide on the abolishing of the death penalty in an Islamic country.

12
Figure 8

13
Appendix: Methodology
Sampling method
This study aimed to measure and document attitudes and opinions in a closed society,
which cannot be obtained using conventional methods. Studies employing opt-in
online surveys face methodical challenges that are inherent to online sampling
methods, which are nevertheless becoming the norm. These shortcomings include the
so-called network effect, which means that the survey is more likely to reach
respondents who hold beliefs similar to those held by the organizers, as well as self-
selection, which means that those with a special interest in the survey topic are more
likely to participate.
To reduce these effects, the survey was spread through individuals as well as social
media groups, channels, and pages representing radically diverse social layers of
society and political perspectives. Using multiple chain-referral sampling to reach a
diverse audience, the online survey was shared by platforms belonging to specific
groups such as ethnic and religious minorities and pro-regime networks. The survey
was also shared by platforms visited by a mass audience consuming social, political,
and entertainment contents. The targeted Instagram pages and Telegram channels
ranged between tens of thousands to a few million followers. These measures also
increased the sample size, further minimizing bias.
Based on the responses to one of the survey questions, fewer than 15% of the refined
sample had participated in GAMAAN’s previous surveys. This is a promising indication
that the survey circulation strategy among diverse groups has reached individuals
outside GAMAAN researchers’ social circles.
Balancing and weighting methods
The raking weighting method was employed to generate a representative sample from
the refined sample. As a study conducted by the PEW Research Center shows, this
weighting method is among the most effective and reliable for samples derived from
online surveys. As suggested by PEW, a variable reflecting respondents’ political
orientation was introduced in the survey and used for weighting to decrease the
sampling bias while increasing generalizability. Sample balancing and weighting were
carried out in cooperation with and using the tools of the Dutch company, Spinnaker
Research.
To obtain a representative sample, the refined sample drawn from respondents living
inside Iran was weighted based on sex, age group, level of education, province,
urban/rural areas, and respondents’ voting behavior in the 2017 presidential election.
The data from the Islamic Republic of Iran’s reports, Selected Findings of the 2016
National Population and Housing Census and A Selection of Labor Force Survey

14
Results – Spring 2020), were used to extract the target population characteristics.
Having run the weighting computations based on the aforementioned six variables, an
effective sample size of 1,867 was estimated. This sample size is more than
appropriate, given the respective credibility intervals and credibility level of 5% and
95% (which replace the margin of error and the confidence level in online non-
probability surveys).
Weighting results
The target population of this survey is literate Iranian residents above 19 years old. As
the data from the 2016 National Population and Housing Census shows, this
population accounts for 47 million Iranians, who comprise 85% of the adult population
of Iran.
Tables 1 to 6 compare the demographic variables of the refined sample and the target
population. The demographic characteristics of the weighted sample are consistent
with those of the target population.
Table 1: Sex Distribution
Sex Refined
sample
Weighted
sample
Population of literate
individuals above 19
years old (from the
2016 Census)
Female 30.1% 47% 47%
Male 69.9% 53% 53%
Table 2: Age Group Distribution
Age groups Refined
sample
Weighted
sample
Population of literate
individuals above 19
years old (from the
2016 Census)
Between 20 and 29 years old 23.3% 30.1% 30.1%
Between 30 and 49 years old 60.3% 51.1% 51.1%
At least 50 years old 16.4% 18.8% 18.8%
Table 3: Education Level Distribution
Level of education Refined
sample
Weighted
sample
Population of literate
individuals above 19
years old (from the
2016 Census)
High school diploma and
lower degrees 13.8% 72.3% 72.3%
Higher education degree 86.2% 27,7% 27.7%

15
Table 4: Urban/Rural Distribution
Region Refined
sample
Weighted
sample
Population of literate
individuals above 19
years old (from the
2016 Census)
Rural Areas 3.7% 21.1% 21.2%
Urban Areas 96.3% 78.8% 78.8%
Table 5: Province Distribution
Province of Residence Refined
sample
Weighted
sample
Population of literate
individuals above 19
years old (from the
2016 Census)
East Azerbaijan 2.7% 4.8% 4.8%
West Azerbaijan 1.6% 3.6% 3.6%
Ardabil 0.6% 1.5% 1.5%
Isfahan 6.6% 6.9% 6.9%
Alborz 4.8% 3.8% 3.8%
Ilam 0.5% 0.7% 0.7%
Bushehr 0.9% 1.5% 1.5%
Tehran 42.6% 19.1% 19.1%
Chaharmahal and Bakhtiari 0.5% 1.1% 1.1%
South Khorasan 0.5% 0.9% 0.9%
Razavi Khorasan 6.9% 7.8% 7.8%
North Khorasan 0.7% 0.9% 0.9%
Khuzestan 3.0% 5.4% 5.4%
Zanjan 0.7% 1.3% 1.3%
Semnan 0.8% 1.0% 1.0%
Sistan and Baluchistan 0.9% 2.1% 2.1%
Fars 4.5% 6.3% 6.3%
Ghazvin 1.2% 1.6% 1.6%
Qom 1.2% 1.6% 1.6%
Kurdistan 1.4% 1.8% 1.8%
Kerman 1.3% 3.6% 3.6%
Kermanshah 1.8% 2.4% 2.4%
Kohgiluyeh and Boyer-Ahmad 0.5% 0.8% 0.8%
Golestan 1.0% 2.2% 2.2%
Gilan 3.4% 3.5% 3.5%
Lorestan 1.2% 2.0% 2.0%
Mazandaran 3.7% 4.5% 4.5%
Markazi 1.4% 1.8% 1.8%
Hormozgan 0.9% 2.0% 2.0%
Hamadan 1.4% 2.1% 2.1%
Yazd 0.9% 1.4% 1.4%
Apart from demographic variables, sample weighting included respondents’ voting
behavior in the 2017 Iranian presidential election (considering that this election’s
results were not controversial and the reliability of the final, formally declared
numbers). Although a smaller number of Ebrahim Raisi voters participated in our

16
survey, their number in the refined sample was still significantly high, facilitating
generalizability to the target population through weighting.
Table 6: Political Voting Behavior Distribution
Voted for candidate in
the 2017 presidential
election
Refined sample Weighted
sample
Official results of the
2017 presidential
election
Hassan Rouhani
(+ Hashemitaba) 63.2% 42.2% 42.2%
Ebrahim Raisi
(+ Mir-Salim) 3.3% 28.8% 28.8%
I did not vote
(+ I cast a blank vote) 33.5% 29.0% 29.0%
Reliability check
One of the methods for examining the reliability and generalizability of a weighted
sample is to compare the results from the weighted sample against external evidence.
Table 7 compares the status of economic activity (percentage of employed individuals)
in the weighted sample with that of the target population on both urban and rural levels.
While the weighted sample includes only literate individuals above 19 years old, the
statistic of those formally employed reflects both literate and illiterate populations of
the labor force. As reported in A Selection of Labor Force Survey Results (Spring
2020), in urban areas, the employment rate of literate people is higher than that of the
illiterate and barely literate population. As can be seen, the employment rate of the
weighted sample is sufficiently consistent with that of the target population.
Table 7: Comparison of Employment Rate Distribution with External Evidence
Moreover, to estimate the reliability of the results drawn from the weighted sample,
computations were run once again using the matching method, and the results were
compared against the original results. First, a random sample of 1,002 respondents
was extracted from the refined sample of 19,646 respondents. This sample was
extracted so that it complied with the demographic and political variables of the target
population – namely sex, age group, education level, province, urban or rural region,
and voting behavior. Having carried out a comparative analysis, the results obtained
from this new sample were consistent with those obtained from the weighted sample,
with a relative difference of about 2%.
Employment
status
Whole country Urban areas Rural areas
Weighted
sample –
literate
Individuals
above 19
years old
Workforce
statistics –
individuals
above 19
years old
(Spring 2020)
Weighted
sample –
literate
individuals
above 19
years old
Workforce
statistics –
individuals
above 19
years old
(Spring 2020)
Weighted
sample –
literate
individuals
above 19
years old
Workforce
statistics for
individuals
above 19
years old
(Spring 2020)
Employed 42.9% 40.0% 42.4% 39.0% 44.5% 41.0%

17
On balance, the weighted sample adequately represents the target population (literate
individuals above 19 years old) and the results obtained can be generalized to a
substantial majority of the Iranian population (that is, 85% of the adult population) with
the aforementioned credibility intervals.
* * *
We at the non-profit research foundation GAMAAN would like to express our sincere
gratitude to all of those who took their time to contribute to this survey.
GAMAAN commits itself to ethical guidelines with regard to protecting respondents’
submitted data. We are professionally committed to sparing no effort in collecting the
opinions and attitudes of Iranians from all levels of society and all walks of life.
GAMAAN strives to employ scientific methods in extracting representative samples.
We pledge to be transparent to the public and in explaining probable error levels.
Our team gladly receives any comments, suggestions, and criticisms at
[email protected]. We are also open to cooperate with research centers and
academic institutions based on our Articles of Association.