a balancing act...6 outlook 2020 key themes our global investment committee expects growth worldwide...
TRANSCRIPT

This commentary reflects the views of the Wealth Management Group of Standard Chartered Bank
A balancing act Outlook 2020 (in-brief)

2 Outlook 2020
Key themes: Cross-Asset
• Equities, led by the Euro
area and the US, to
outperform bonds and
cash
• EM bonds (both USD &
local currency) and Asia
USD bonds to outperform
other bonds
• USD to weaken; EUR,
GBP, INR likely to be
biggest beneficiaries of
this weakness
Starting 2020 with some optimism
Over the next 6-12 months, our Global Investment Committee expects equities (led by the
US and Euro area) to outperform bonds. Emerging Market (EM) bonds should outperform
Developed Market (DM) bonds and the US Dollar should weaken.
Ever-present event risks and a long-in-the-tooth economic cycle mean taking these
exposures within a balanced, well-diversified investment allocation, rather than on a
standalone basis, remains paramount. We continue to see gold as an attractive long-term
counterweight to risky assets.
After a late-summer scare in 2019, we believe economic growth and earnings data will
stabilise, supporting equities and corporate bonds. In our assessment, the Euro area has
the most room for a positive growth surprise given how pessimistic expectations are.
We expect major central banks to either stay on hold or maintain a bias towards easing
policy further, supporting growth. Most major economies are likely to offer some form of
fiscal stimulus, though none are likely to trigger a major upside surprise given already-
significant deficits (such as the US) or legal constraints (in Europe). In the UK, we expect
Brexit to be resolved with a deal relatively early in the year, a view reinforced by the recent
UK election outcome.
Fig. 1 The recent global growth scare may be behind us…
JPMorgan global PMI manufacturing index
Source: Bloomberg, Standard Chartered
Fig. 2 …though economic uncertainty remains high and rising
Global economic policy uncertainty index
Source: Bloomberg, Standard Chartered
2 Investment strategy and key themes
Outlook 2020 3
A lot to continue worrying about
There continues to be plenty for the pessimistic investor to
worry about: (i) Last year’s focus on broad geopolitical risks
is likely to morph into a greater focus on US domestic
political risks as US presidential elections kick off in 2020; (ii)
Questions over US-China trade relations are likely to persist;
(iii) Finally, worries of an abrupt end to the US business
cycle will continue to loom over markets.
We do not downplay any of these risks, but instead have
incorporated them into our views. First, our reasoning
balances these risks against the historical experience of very
strong late-cycle returns and offers the perspective of seeing
2019 as an unfinished rally. Second, we concede the path is
unlikely to be smooth. Third, we see the key factors
supporting our bullish outlook as being much stronger in the
first half of the year, but potentially receding as 2020
matures.
The first point drives our preference for equities over bonds,
particularly if the Fed supports a rise in USD liquidity by
expanding its balance sheet. The second and third is why we
suggest a balanced, diversified approach.
Downward pressure on USD to gather pace
We expect the USD to weaken over the coming 12 months.
Interest rate differentials moved against the USD for most of
2019, but thus far this has failed to weaken the currency. We
believe USD liquidity has been the missing ingredient. Tight
liquidity supported the USD in 2019, but Fed efforts to avoid
a repeat of the spike in overnight borrowing rates, arguably
as a result of low interbank liquidity, means more USD
liquidity should be available in 2020. This should finally start
a modest decline in the USD.
Within currency markets, we expect Developed Market
currencies (mainly the EUR and GBP) to be the biggest
beneficiaries of a weaker Dollar, even if the most significant
impact is likely to be on Emerging Market assets, which have
a track record of doing well in USD-weak environments. We
prefer implementing this weak USD/stronger EM theme via
bonds rather than equities, a reflection of EM bonds’ more
attractive fundamentals and our expectation of a continued
environment favouring income-oriented assets.
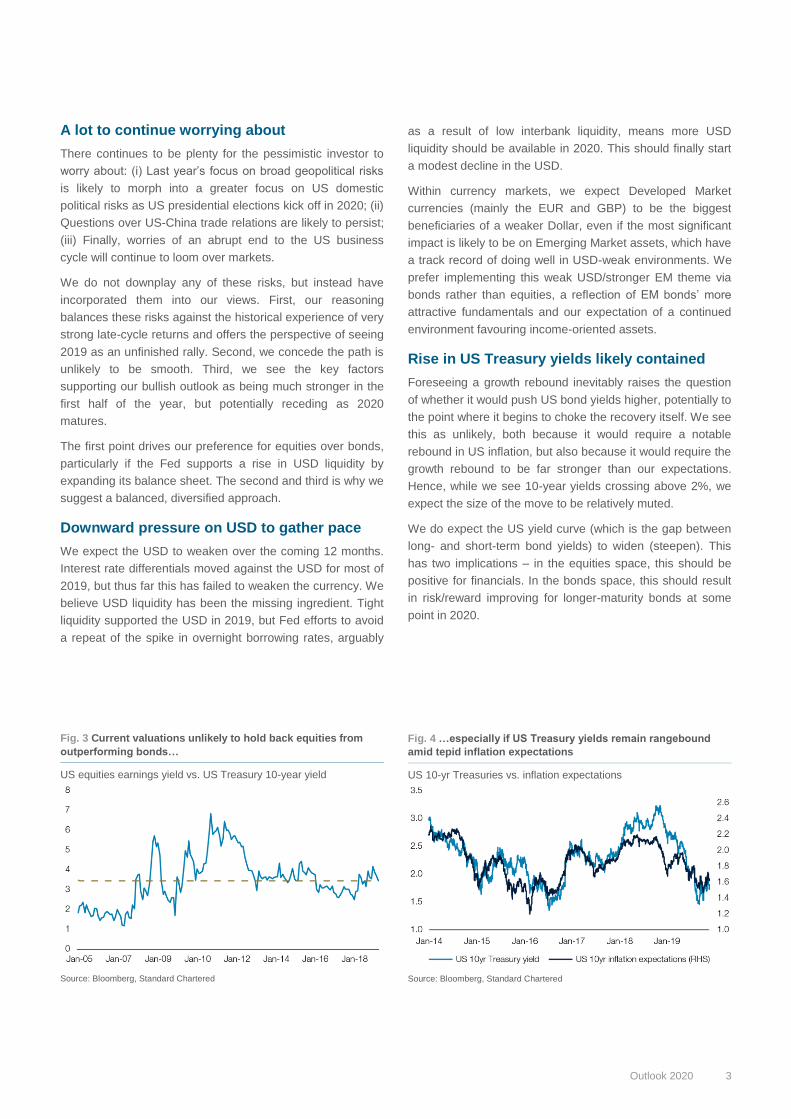
Rise in US Treasury yields likely contained
Foreseeing a growth rebound inevitably raises the question
of whether it would push US bond yields higher, potentially to
the point where it begins to choke the recovery itself. We see
this as unlikely, both because it would require a notable
rebound in US inflation, but also because it would require the
growth rebound to be far stronger than our expectations.
Hence, while we see 10-year yields crossing above 2%, we
expect the size of the move to be relatively muted.
We do expect the US yield curve (which is the gap between
long- and short-term bond yields) to widen (steepen). This
has two implications – in the equities space, this should be
positive for financials. In the bonds space, this should result
in risk/reward improving for longer-maturity bonds at some
point in 2020.
Fig. 3 Current valuations unlikely to hold back equities from
outperforming bonds…
US equities earnings yield vs. US Treasury 10-year yield
Source: Bloomberg, Standard Chartered
Fig. 4 …especially if US Treasury yields remain rangebound
amid tepid inflation expectations
US 10-yr Treasuries vs. inflation expectations
Source: Bloomberg, Standard Chartered
2

4 Outlook 2020
The Euro area and the US should outperform
within equities
Within equities, we prefer the Euro area and the US globally,
and Chinese (offshore), Indian and South Korean equities in
Asia ex-Japan.
In the Euro area, we see potential for an upside growth
surprise relative to consensus. Valuations remain
inexpensive relative to the US as the region lagged both
global and US equity markets through the 2019 rally. Finally,
ECB policy is as supportive as it has ever been and the
possibility of a fiscal surprise is increasing.
In the US, we see room for both economic and earnings data
to stabilise, or improve, amid contained bond yields and a
weaker USD, even if equity valuations are not compelling on
their own. We are also mindful of US equities’ reasonably
strong track record of outperforming global equities in late-
cycle environments.
In Asia ex-Japan, we favour China (offshore), India and
South Korea equity markets. China and South Korea equities
could significantly outperform the region should US-China
trade tensions cool or at least not escalate further. Indian
and Chinese equities should also benefit from policymaker
efforts to support domestic growth.
EM bonds should outperform their DM
counterparts
Within bonds, we expect Emerging Markets (EM) bonds,
broadly, to outperform their Developed Market (DM) peers
across both USD- and local currency-denominated bonds.
Across EM government bonds, USD bonds are still likely to
outperform, in our assessment. The absolute level of their
yields remains attractive in a still-low yield world, their
valuations allow for further price gains and this asset class’
highly diversified nature continues to help shield against
idiosyncratic risk (such as the political uncertainty in Chile,
for example).
In addition, our increasingly bearish USD outlook improves
the outlook for EM local currency bonds. Their yield remains
attractive, as it has been for much of the last two years.
However, what has changed is the EM FX outlook. With FX
movements having been almost as important a driver of
returns as the yield for local currency bonds, we believe a
weaker Dollar (or even a stable Dollar) significantly improves
the risk/reward for EM local currency government bonds.
We also favour Asia USD bonds. While their headline yield is
less attractive than EM government bonds, the asset class
continues to be less volatile than its DM peers. This makes
for a very attractive risk/reward trade-off, in our view.
Finally, within DMs, it is difficult to ignore the level of yield
offered in DM HY bonds. However, we believe this high level
is offset by the risk of rising defaults, particularly in the US
energy sector, and this could result in their total returns, net
of defaults, lagging those in EM bonds.
Fig. 5 EM bonds are still an attractive source of yield in an
income-seeking world…
Yield of major EM and DM bond asset classes
Source: Bloomberg, Standard Chartered
*Yield data as of 9 December 2019
Fig. 6 …with EM local currency-denominated bonds more
attractive if the USD follows its eroding yield advantage lower
USD Index (DXY) vs. its yield differentials relative to other major
economies
Source: Bloomberg, Standard Chartered
2

Outlook 2020 5
Key asset class views
Equities ▲ Bonds (Rates) ▼ Bonds (Credit) ◆ Alternative
Strategies ◆ Cash ▼ Gold ▲
Euro area ▲ Govt EM local ▲ Govt EM USD ▲ Equity hedge ▲ USD ▼
US ▲ Govt DM IG ▼ Asia USD ▲ Event-driven ◆ EUR ▲
Asia ex-Japan ◆ Corp DM HY ◆ Relative value ◆ GBP ▲
UK ◆ Corp DM IG ▼ Global macro ◆ JPY ◆
Japan ◆ CNY ◆
Other EM ▲ AUD ◆
Source: Standard Chartered Global Investment Committee
Legend: ▲ Most preferred | ▼ Less preferred | ◆ Core holding
Key themes Likely out-performers Likely under-performers
Global growth to stabilise Global equities Bonds (rates)
USD to weaken EUR, GBP, INR, EM bonds USD
Treasury yields to stay capped • Multi-asset income strategies
• High dividend yield equities
Senior floating rate loans
Equities: DM to outperform EM US, Euro area equities
Equity sectors: Adding financials • US financials, technology
• Euro area financials, healthcare
• China consumer staples, discretionary
• Euro area communications
• China energy
Bonds: EM to outperform DM • EM USD government bonds
• Asia USD bonds
• EM local currency bonds
• DM IG government bonds
• DM IG corporate bonds
Geopolitics vs. domestic politics • Equity long/short strategies
• Gold
Source: Standard Chartered Global Investment Committee
2

6 Outlook 2020
Key themes
Our Global Investment Committee expects growth worldwide to stabilise around long-term trends and inflation to remain
subdued. Monetary and fiscal stimulus are likely to extend the record US economic expansion and revive Euro area growth;
China should stabilise following targeted policy stimulus and no further escalation in trade tensions, which should also be
supportive for Europe and Emerging Markets. Political uncertainty around the outcome of the US presidential election is a
growing risk.
Key chart
Monetary and fiscal stimulus are likely to support global growth in 2020 G4 central bank balance sheet and US/Euro area fiscal deficits, % of GDP
Renewed expansion of G4 central
bank balance sheets and fiscal
stimulus is likely to help extend the
economic cycle
Source: Bloomberg, Standard Chartered; G4 comprises of the central banks of the US, Euro area, Japan and UK.
US Fed’s dovish policy shift and ongoing fiscal spending should stabilise growth near its long-term trend; strong job
market will sustain consumption; Fed may cut rates once in 2020
◐ Growth ◐ Inflation ○ Benchmark rates ◐ Fiscal deficit
Euro area Monetary and fiscal easing should support a modest growth recovery; ECB should ease further amid subdued
Euro area inflation; German fiscal easing could be a potential game-changer for growth
● Growth ◐ Inflation ○ Benchmark rates ● Fiscal deficit
China We expect significant, but targetted, fiscal and monetary easing to support economic growth amid external
headwinds, such as trade tensions with the US
◐ Growth ◐ Inflation ○ Benchmark rates ● Fiscal deficit
Japan
External risks to the manufacturing sector and exports will be partly offset by resilient business spending due to
structural factors; BoJ on hold for now, but its stance could change as growth slows further
○ Growth ◐ Inflation ◐ Benchmark rates ● Fiscal deficit
UK
PM Johnson’s new majority in parliament means a soft Brexit is likely; reduced uncertainty and a proposed fiscal
stimulus could potentially revive business confidence
◐ Growth ◐ Inflation ◐ Benchmark rates ● Fiscal deficit
Other Emerging Markets
Weaker USD, easier global and domestic monetary policies are likely to support the outlook; idiosyncratic country
risks remain
◐ Growth ◐ Inflation ◐ Benchmark rates ◐ Fiscal deficit
Source: Standard Chartered Global Investment Committee
Legend: ○ Significant deceleration | ◐ Neutral | ● Significant acceleration
3 Macro Overview – at a glance

Outlook 2020 7
Key themes
The strong performance in 2019 across both government and corporate bonds mean they start 2020 with a lower yield and
more expensive valuations than a year ago, leading us to expect lower, but still positive total returns in 2020.
Relatively more attractive valuations, expectations of global growth stabilisation and a weaker USD lead us to prefer EM bonds
over DM bonds, across both government and corporate categories.
Key chart
Strong performance in 2019 mean most bond markets start 2020 at yields close to 10-year lows
Yields largely higher in Emerging
Market bonds relative to their
Developed Market counterparts
Source: Citigroup, J.P. Morgan, Barclays, Bloomberg, Standard Chartered. As of 29 November 2019.
Pre
fere
nce o
rder
EM USD government
▽ ◇ ▲ ▲
Emerging Market (EM) USD government bonds are preferred owing to easing headwinds, the attractive
yield and reasonable valuations. A sharp rebound in Treasury yields is a risk for EM bonds.
● Macro factors ◐ Valuation vs govt bonds ● Rates policy
Asia USD
▽ ◇ ▲
We view Asia USD bonds as a preferred holding given their relatively high credit quality, moderate yield
and defensive characteristics. A sharper than expected growth slowdown in China is a risk for Asia bonds.
● Macro factors ◐ Valuation vs govt bonds ● Rates policy
EM local currency
▽ ◇ ▲
An attractive yield, easier EM central bank policies and our bearish USD outlook lead us to view EM local
currency bonds as a preferred holding. Higher volatility due to currency fluctuations is a risk.
● FX Outlook ● Macro factors ◐ Rates policy
DM HY corporate
▽ ◆ △
We view DM High Yield bonds as a core holding as their attractive yield, reasonable valuations and low
interest rate sensitivity are balanced by the risk of rising defaults.
● Attractive yield ◐ Valuation vs govt bonds ○ Credit fundamentals
DM IG corporate
▼ ◇ △ △
We view the asset class as less preferred. In our assessment, the high credit quality is more than offset by
somewhat expensive valuations, high interest rate sensitivity and increasing corporate leverage.
○ Valuation vs govt bonds ○ Credit fundamentals ◐ Macro factors
DM IG government
▼ ◇ △
DM Investment Grade government bonds are less preferred. Their high credit quality is offset by the low
yields they offer. A renewed growth slowdown is an upside risk for this asset class.
● Rates policy ◐ Macro factors ○ Valuation
Source: Standard Chartered
Legend: ▲ Most preferred | ▼ Less preferred | ◆ Core holding | ○ Not supportive | ◐ Neutral | ● Supportive | ▭ Key driver
15 Bonds – at a glance

8 Outlook 2020
2
Our thoughts on... PREFERRED
EM USD government bonds CORE HOLDING
DM high yield bonds
LESS PREFERRED
DM IG government bonds
DM IG corporate bonds
EM local currency bonds
Asia USD bonds
Well-balanced credit quality (+)
Investment Grade: 54% | High Yield: 46%
Highly-diversified geographically (+)
Gives exposure to 73 countries
Attractive yield (+)
Offers 5%+ yield, with reasonable valuations
Idiosyncratic risks (-)
Watch event risks closely
Attractive yield (+)
Offers ~6% yield
Reasonable valuations (+)
Yield premiums in line with historical averages
14% allocation to energy sector (-)
Deteriorating energy sector credit quality a risk
Easy Central Bank policy (+)
EM Central Banks expected to cut rates further
Attractive yield (+)
Offers a yield of over 5%
EM FX tailwind (+)
Support likely from a weaker USD
Higher volatility (-)
Volatility (~2x vs EM USD govt bonds)
poses a risk
Low absolute yield (-)
Average yield of ~1%
High interest rate sensitivity (-)
1% higher yield = ~8% price decline
Portfolio hedge (+)
Benefits from high credit quality during risk-off
Defensive asset class (+)
Volatility well-contained over the past 5 years
High credit quality (+)
Offers a ~4% yield for an average
BBB+ credit quality
Strong regional demand (+)
Well-supported by regional investors
(>70% of demand)
Concentration risk (-)
Nearly 60% issuers are from mainland
China + Hong Kong
Increasing corporate leverage (-)
Debt/EBITDA has risen to multi-year highs
Expensive valuations (-)
This could limit returns
Strong foreign demand (+)
USD12 trn in negative yielding bonds
adds demand tailwind

Outlook 2020 9
Key themes
The backdrop for global equities in 2020 remains positive, in our assessment. Low interest rates and rising excess liquidity is
expected to encourage investors who have watched from the sidelines to join the bull market. Earnings are forecast to recover
somewhat globally, yet valuations are elevated in the US.
Euro area equities are most preferred in 2020. The outlook for Euro area banks has improved following ECB action to reduce
the impact of negative interest rate on the sector. Historically, Euro area equities tend to outperform global equities when Euro
area banks are outperforming the market. Both Euro area banks and US technology are amongst our preferred sectors.
Key chart
Global equities tend to rally when money supply is rising
MSCI All country World index and Global M1 Money supply
A recovery in global M1 money
supply has historically been
positive for global equities.
Combined with lower interest rates
and a resumption of QE, the
backdrop for equities in 2020 is
positive.
Source: MSCI, Bloomberg, Standard Chartered. As of 20 November 2019.
Pre
fere
nce o
rder
Euro area equities
▽ ◇ ▲ ▲
Euro area equities are preferred. Valuations and forecast fund flows in 2020 are supportive of the market.
Bond yields, while above their recent lows, are not an obstacle to growth.
● Valuations ● Fund flows ◐ Bond yields
US equities
▽ ◇ ▲
US equities are preferred. Low bond yields keep the cost of debt low, providing cheap funding for share
buybacks and investment. Earnings and fund flows are forecast to recover in 2020.
● Bond yields ● Earnings ◐ Fund flows
Asia ex-Japan equities
▽ ◆ △
Asia ex-Japan is a core holding. A weaker USD in 2020 is likely to boost the market. Falling bond yields are
expected to result in a pick-up in fund inflows. China offshore is a preferred market within the region.
● Weaker USD ◐ Bond yields ◐ Fund flows
UK equities
▽ ◆ △
UK is a core holding. Dividends and valuations are attractive relative to peers. Low bond yields and prior
underperformance signal the potential for a recovery in fund flows as political uncertainty is reduced.
● Valuations ◐ Bond yields ◐ Fund flows
Japan equities
▽ ◆ △
Japan is a core holding. Improvement in Chinese leading economic indicators are positive for the Japanese
market. TOPIX index reforms are also a positive and could lead to increased fund inflows.
● Valuations ◐ Earnings ◐ Bond yields
EM ex-Asia equities
▽ ◆ △
EM ex-Asia is a core holding. Valuations are attractive relative to history and peers. Earnings growth in
2020 is forecast at 12%. A weaker USD is supportive of a pick-up in fund inflows.
● Valuations ◐ Earnings ◐ Fund flows
Source: Standard Chartered
Legend: ▲ Most preferred | ▼ Less preferred | ◆ Core holding | ○ Not supportive | ◐ Neutral | ● Supportive | ▭ Key driver
16 Equity – at a glance

10 Outlook 2020
Why do we like...
US Equities
EM ex-Asia Equities
Share buybacks
USD 800 bn
Lower corporate taxes
from 35% to 21%
Less exposed to trade war
S&P500 foreign sales: 38%
Exposure to China growth
Brazil supplies 22% China iron ore imports
Exposure to commodities
30% of the index
Country diversification
15 markets | Brazil is the biggest: 27%

Outlook 2020 11
High dividend yield
FTSE100 5%, MSCI World 2.6%
Exposure to commodities
Energy & materials = 25% of the UK
equities market
Leveraged to global growth
FTSE100 overseas sales: 76%
Improving outlook for banks ECB policies
Innovation leader Semiconductors / automation / robotics
Lower interest rates compared to peers 20-year average
Euro area base rate: 4%,
US: 5%
Leveraged to global growth
Industrials & Auto share of the index: 30%
Corporate reform Higher share buybacks & dividends
Exposure to China growth
38% of index
Superior earnings growth
10-year average annual EPS growth: 12%
Growth at a reasonable price (GARP)
Asia ex-Japan average valuation 10% below global equities
Exposure to China growth
China: Third largest export
destination for Euro area exports
UK Equities
Euro Area Equities
Japan Equities
Asia ex-Japan Equities
12 Outlook 2020
Key themes
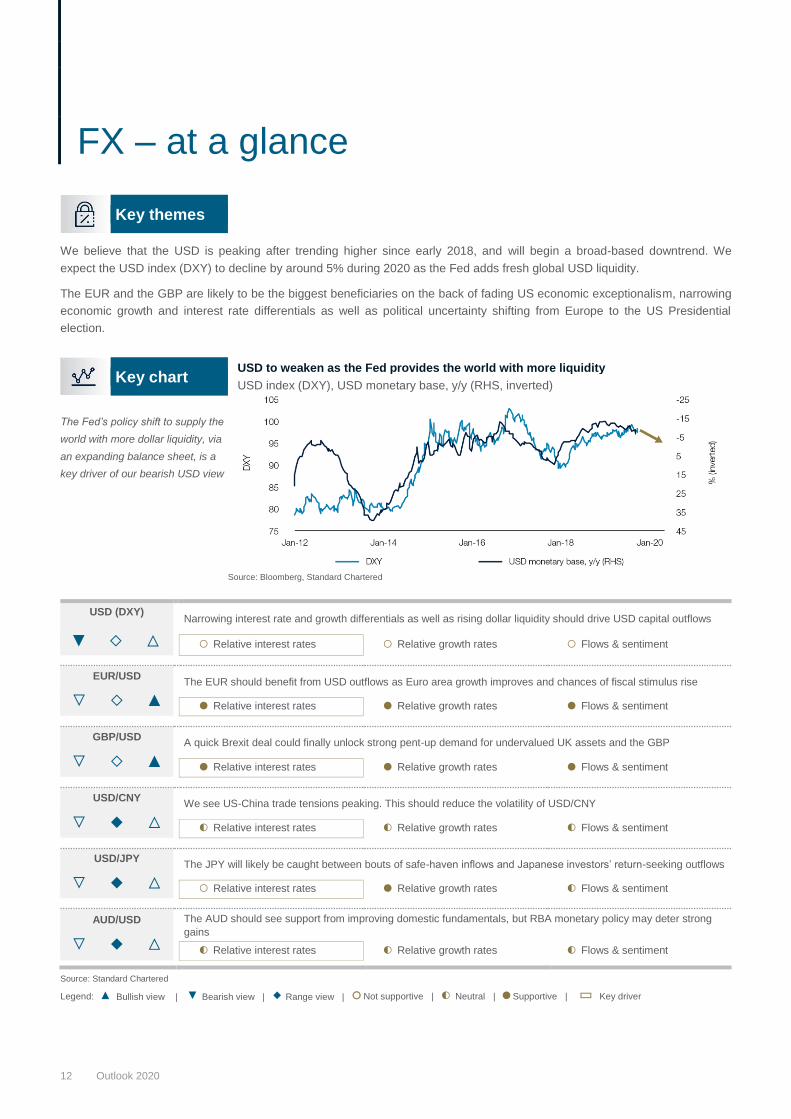
We believe that the USD is peaking after trending higher since early 2018, and will begin a broad-based downtrend. We
expect the USD index (DXY) to decline by around 5% during 2020 as the Fed adds fresh global USD liquidity.
The EUR and the GBP are likely to be the biggest beneficiaries on the back of fading US economic exceptionalism, narrowing
economic growth and interest rate differentials as well as political uncertainty shifting from Europe to the US Presidential
election.
Key chart
USD to weaken as the Fed provides the world with more liquidity
USD index (DXY), USD monetary base, y/y (RHS, inverted)
The Fed’s policy shift to supply the
world with more dollar liquidity, via
an expanding balance sheet, is a
key driver of our bearish USD view
Source: Bloomberg, Standard Chartered
USD (DXY)
▼ ◇ △ ▲
Narrowing interest rate and growth differentials as well as rising dollar liquidity should drive USD capital outflows
○ Relative interest rates ○ Relative growth rates ○ Flows & sentiment
EUR/USD
▽ ◇ ▲
The EUR should benefit from USD outflows as Euro area growth improves and chances of fiscal stimulus rise
● Relative interest rates ● Relative growth rates ● Flows & sentiment
GBP/USD
▽ ◇ ▲
A quick Brexit deal could finally unlock strong pent-up demand for undervalued UK assets and the GBP
● Relative interest rates ● Relative growth rates ● Flows & sentiment
USD/CNY
▽ ◆ △
We see US-China trade tensions peaking. This should reduce the volatility of USD/CNY
◐ Relative interest rates ◐ Relative growth rates ◐ Flows & sentiment
USD/JPY
▽ ◆ △
The JPY will likely be caught between bouts of safe-haven inflows and Japanese investors’ return-seeking outflows
○ Relative interest rates ● Relative growth rates ◐ Flows & sentiment
AUD/USD
▽ ◆ △
The AUD should see support from improving domestic fundamentals, but RBA monetary policy may deter strong
gains
◐ Relative interest rates ◐ Relative growth rates ◐ Flows & sentiment
Source: Standard Chartered
Legend: ▲ Bullish view | ▼ Bearish view | ◆ Range view | ○ Not supportive | ◐ Neutral | ● Supportive | ▭ Key driver
17 FX – at a glance

Outlook 2020 13
Still preferred; opportunistically add long exposure on dips
• We retain gold as a preferred holding and see the current pause in gold’s rally as an
opportunity to add exposure to the precious metal.
• Real (net of inflation) interest rates, inflation expectations and the USD remain key
drivers. We believe the historical negative gold-USD correlation should reassert itself,
which should benefit gold as the USD retreats.
• In the near term, catalysts for gold to move higher are lacking. An unexpected flare up of
trade tensions and/or any indications of global growth weakness could see renewed
upside for gold given its safe-haven characteristics.
Fig. 1 Will gold rise in 2020?
Bullish factors Bearish factors
Opportunity costs of holding gold are still low as
real yields are unlikely to rise significantly
Gold is sensitive to higher interest rates given its
non-yielding attributes. A falling stock of negative-
yielding debt, as global yields gradually rise,
would reduce the attractiveness of holding gold
A broadly weaker USD provides an additional
tailwind for gold prices
Physical demand has been relatively subdued,
but seasonal buying could provide a floor for
prices
The precious metal remains a safe-haven asset
and continues to offer investors diversification
benefits. Central bank buying also remains
supportive of net demand for gold
SCB’s net assessment
bullish
bearish
Source: Standard Chartered Global Investment Committee
Our net assessment:
• Gold remains a preferred
holding
• We expect a test of 1,600
in 2020, but the risk-on
environment may limit
gains near term
• Real interest rates,
inflation expectations and
the USD remain key
drivers of our bullish
outlook
Fig. 2 Still-elevated global policy uncertainty supportive of gold
Gold (USD/oz), Global economic policy uncertainty* (RHS)
Source: Baker, Bloom and Davis, Refinitiv, Standard Chartered
*For more information on the index, visit policyuncertainty.com
Fig. 3 Real bond yields unlikely to rise significantly from here,
limiting gold’s downside
Gold prices (USD/oz), 10-year US TIPS* (%, inverted; RHS)
Source: Refinitiv, Standard Chartered
*Real bond yields are proxied by US Treasury Inflation Protected securities
5 4 3 2 1
2 Gold
Preferred – Fundamentals still supportive

14 Outlook 2020
Asset allocation summary
ASIA FOCUSED GLOBAL
Summary View Conservative Moderate Moderately Aggressive Aggressive Conservative Moderate
Moderately Aggressive Aggressive
Cash ▼ 12 4 2 0 12 4 2 0
Fixed Income ◆ 64 38 27 7 64 38 27 7
Equity ▲ 24 42 57 84 24 42 57 84
Gold ▲ 0 6 5 5 0 6 5 5
Alternative Strategies ◆ 0 10 9 4 0 10 9 4
Asset class
USD Cash ▼ 12 4 2 0 12 4 2 0
DM Government
Bonds* ▼ 4 2 2 0 5 3 2 1
DM IG
Corporate Bonds* ▼ 8 5 3 1 12 7 5 1
DM HY
Corporate Bonds ◆ 8 5 3 1 12 7 5 1
EM USD
Government Bonds ▲ 15 9 6 2 12 7 5 1
EM Local Ccy
Government Bonds ▲ 15 9 6 2 12 7 5 1
Asia USD Bonds ▲ 15 9 6 2 12 7 5 1
North America ▲ 7 13 18 26 13 22 30 43
Europe ex-UK ▲ 6 11 14 21 3 5 7 11
UK ◆ 1 2 3 4 1 2 3 4
Japan ◆ 1 2 3 4 1 2 3 4
Asia ex-Japan ◆ 6 11 15 22 4 7 10 15
Non-Asia EM ◆ 2 4 5 7 2 4 5 7
Gold ▲ 0 6 5 5 0 6 5 5
Alternatives ◆ 0 10 9 4 0 10 9 4
All figures in %. Source: Standard Chartered.
Legend: ▲ Most preferred | ▼ Least preferred | ◆ Core holding
Note: (i) For small allocations we recommend investors to allocate through broader global equity/global bond solutions; (ii) Allocation figures may not sum to 100%
due to rounding effects.
*FX-hedged

Outlook 2020 15
2019 was the year where many sustainability issues came to
the forefront and this is set to accelerate in 2020, with an
increasing number of businesses having it on their corporate
agendas as material risks and opportunities – from climate
change to data privacy and diversity and inclusion.
According to a global survey by the UN Principles for
Responsible Investment (PRI) network and the CFA Institute,
more than 50% of investors in Asia Pacific believe that
environmental and social factors will impact share prices by
20221. The figures are similar for investors in Europe, the
Middle East and Africa2.
Governance is the ESG (environmental, social and
governance) factor most investors are integrating into their
process, while environmental and social factors are
increasingly gaining acceptance. The main drivers of ESG
integration are risk management and increasing client
demand.
With increasing demand, fund managers in both public and
private markets are also building their capabilities to meet
the needs of its investors.
According to Morningstar, approximately USD 41 billion
flowed into European sustainable fund products in the first
half of 2019, more than any other semi-annual period. In
addition, the report also noted that sustainable equity funds
benefited from inflows while conventional equity funds
suffered from net outflows. To match investor demand, there
was a 27% increase in the number of ESG fund launches
from 2017 to 2018, and the pace in 2019 is on track to match
or even exceed the number of new product offerings in 2018.
However, ESG integration remains in its relative infancy, with
investors calling for more guidance on exactly “how” they
can “do ESG” and integrate ESG data into their portfolios.
On top of that, there are also concerns of “greenwashing” or
“ESG-washing”, where fund manager claims of ESG
integration are exaggerated.
Fig. 1 Impact of ESG issues in 2017 and the expected impact in 5 years’ time (2022) on share prices, corporate bond yields/spreads
and sovereign debt yields
AFFECTED IN 2017 AFFECTED IN 2022
ASIA
PACIFIC
EUROPE, THE MIDDLE
EAST AND AFRICA
ASIA
PACIFIC
EUROPE, THE MIDDLE
EAST AND AFRICA
ESG ISSUES IMPACT ON SHARE PRICES
Governance 64% 60% 73% 69%
Environmental 24% 24% 59% 54%
Social 30% 24% 55% 46%
ESG ISSUES IMPACT ON CORPORATE BOND
YIELDS/SPREADS
Governance 43% 47% 60% 58%
Environmental 15% 18% 48% 44%
Social 17% 16% 42% 36%
ISSUES IMPACT ON SOVEREIGN DEBT YIELDS
Governance 32% 39% 49% 45%
Environmental 14% 11% 41% 28%
Social 19% 19% 41% 31%
Note: Percentages represent respondents who answered “often” or “always”
1. ESG Integration in Asia Pacific: Markets, Practices and Data, UN PRI and CFA Institute
2. ESG Integration in Europe, the Middle East and Africa: Markets, Practices and Data, UN PRI and CFA Institute
23 The rise of ESG investing

16 Outlook 2020
Fig. 2 Global sustainable investing assets
Source: Global Sustainable Investment Alliance
How to get started with ESG investing?
ESG investing is the use of ESG criteria as a set of
standards to screen for potential investments, which allows
for alignment with the investor’s values or interests. Investors
can choose from various ESG investment strategies such as:
• Exclusionary screening
When exclusion screens are applied, stocks are excluded
from an investment universe which prevents investors
from investing in companies not aligned with their values.
Some common exclusions are tobacco, pornography,
gambling and civil weapons and most, if not all, ESG
funds employ exclusions to some extent.
• ESG integration
ESG integration refers to the systematic consideration of
ESG factors alongside financial metrics in the analysis of
a company. In a sophisticated ESG integration strategy,
ESG factors will be weighted accordingly by the
materiality of those factors depending on the sector. For
example, health and safety metrics will be more relevant
for a mining company than in the financial industry. A
sample list of high level ESG metrics by category can be
seen below:
Source: Refinitiv
Fig. 3 European ESG fund launches
Number of funds
Source: Morningstar Direct, as of 30 June 2019
• Best-in-class/positive screening
Unlike exclusionary screening, best-in-class or positive
screening is the active and intentional selection of
companies that display leading sustainability practices
based on ESG factors. The idea is that strong ESG
performers are companies better positioned to outperform
their peers, encouraging companies to improve their ESG
score. For example, some industries may face a higher
stranded asset risk due to environmental issues. How a
company responds to future risks can be teased out by
analysing specific ESG factors.
• Sustainability-themed investing
Thematic investing focuses on assets linked to a specific
area of ESG interest for an investor. These interest areas
will address a social and/or environmental issue,
sometimes aligned with the Sustainable Development
Goals, such as clean water and sanitation, climate action
or good health and well-being.
• Impact investing
Impact investing are investments made that have specific
targets, typically social or environmental, that the investor
would like to solve. This is a strategy more commonly
seen in the private markets, although there are also listed
equity fund managers launching impact funds.
Of course, ESG investing strategies are not mutually
exclusive as multiple strategies can be applied at once, and
there are various investment instruments an investor can
invest in, both in the public and private markets, where some
are higher risk and have a longer lock-in period than others.
What is critical is selecting the strategy and investment
instrument, that is in line with the investor’s risk profile and
financial/non-financial goals are taken into consideration.
Sustainable investing is a space that will continue to grow
and evolve as new lessons emerge through successes and
failures. Some are ahead of the curve and others are playing
catch up, but it has gone mainstream and it is here to stay.
USD22.9 trn
USD30.7 trn
2016 2018
Environmental Resource Use
Emissions
Innovation
Social
Workforce
Human Rights
Community
Product Responsibility
Governance Management
Shareholders
Corporate Social Responsibility (CSR Strategy)

Outlook 2020 17
ANNUAL
OUTLOOK
annually
GLOBAL
MARKET
OUTLOOK
monthly
The Annual Outlook highlights our key investment themes for the
year, the asset classes we expect to outperform and the likely
scenarios as we move through the year.
Our monthly publication which presents the key investment
themes and asset allocation views of the Global Investment
Committee for the next 6-12 months.
WEEKLY
MARKET
VIEW
weekly
GLOBAL
WEALTH
DAILY
daily
Our weekly publication which provides an update on recent
developments in global financial markets and their implications for
our investment views.
Global Wealth Daily is an early morning update of major economic
and political events and their day-to-day impact on various assets
classes the previous day.
MARKET
WATCH
ad hoc
360
PERSPECTIVES
ad hoc
Market Watch focuses on major events or market developments
and their likely impact on our investment views. 360 Perspectives provides a balanced assessment of the outlook
for an asset class. It presents both the positives and negatives of
the asset class, as well as the major drivers, instead of offering a
specific view.
INVESTMENT
BRIEF
ad hoc
Investment Brief explains the rationale behind our views on an
asset class, incorporating the fundamental and technical drivers.
24 Wealth management

18 Outlook 2020
THIS IS NOT A RESEARCH REPORT AND HAS NOT BEEN PRODUCED BY A RESEARCH UNIT.
Disclosures
This document is confidential and may also be privileged. If you are not the intended recipient, please destroy all copies and notify the sender immediately. This
document is being distributed for general information only and is subject to the relevant disclaimers available at https://www.sc.com/en/regulatory-
disclosures/#market-commentary-disclaimer. It is not and does not constitute research material, independent research, an offer, recommendation or solicitation to
enter into any transaction or adopt any hedging, trading or investment strategy, in relation to any securities or other financial instruments. This document is for
general evaluation only. It does not take into account the specific investment objectives, financial situation or particular needs of any particular person or class of
persons and it has not been prepared for any particular person or class of persons. You should not rely on any contents of this document in making any investment
decisions. Before making any investment, you should carefully read the relevant offering documents and seek independent legal, tax and regulatory advice. In
particular, we recommend you to seek advice regarding the suitability of the investment product, taking into account your specific investment objectives, financial
situation or particular needs, before you make a commitment to purchase the investment product. Opinions, projections and estimates are solely those of SCB at
the date of this document and subject to change without notice. Past performance is not indicative of future results and no representation or warranty is made
regarding future performance. Any forecast contained herein as to likely future movements in rates or prices or likely future events or occurrences constitutes an
opinion only and is not indicative of actual future movements in rates or prices or actual future events or occurrences (as the case may be). This document must
not be forwarded or otherwise made available to any other person without the express written consent of the Standard Chartered Group (as defined below).
Standard Chartered Bank is incorporated in England with limited liability by Royal Charter 1853 Reference Number ZC18. The Principal Office of the Company is
situated in England at 1 Basinghall Avenue, London, EC2V 5DD. Standard Chartered Bank is authorised by the Prudential Regulation Authority and regulated by
the Financial Conduct Authority and Prudential Regulation Authority. Standard Chartered PLC, the ultimate parent company of Standard Chartered Bank, together
with its subsidiaries and affiliates (including each branch or representative office), form the Standard Chartered Group. Standard Chartered Private Bank is the
private banking division of Standard Chartered. Private banking activities may be carried out internationally by different legal entities and affiliates within the
Standard Chartered Group (each an “SC Group Entity”) according to local regulatory requirements. Not all products and services are provided by all branches,
subsidiaries and affiliates within the Standard Chartered Group. Some of the SC Group Entities only act as representatives of Standard Chartered Private Bank,
and may not be able to offer products and services, or offer advice to clients. They serve as points of contact only. ESG data has been provided by Refinitiv. Refer
to https://www.refinitiv.com/en/financial-data/company-data/esg-research-data.
Copyright: Standard Chartered Bank 2019. Copyright in all materials, text, articles and information contained herein is the property of, and may only be reproduced
with permission of an authorised signatory of, Standard Chartered Bank. Copyright in materials created by third parties and the rights under copyright of such
parties are hereby acknowledged. Copyright in all other materials not belonging to third parties and copyright in these materials as a compilation vests and shall
remain at all times copyright of Standard Chartered Bank and should not be reproduced or used except for business purposes on behalf of Standard Chartered
Bank or save with the express prior written consent of an authorised signatory of Standard Chartered Bank. All rights reserved. © Standard Chartered Bank 2019.
Market Abuse Regulation (MAR) Disclaimer
Banking activities may be carried out internationally by different branches, subsidiaries and affiliates within the Standard Chartered Group according to local
regulatory requirements. Opinions may contain outright “buy”, “sell”, “hold” or other opinions. The time horizon of this opinion is dependent on prevailing market
conditions and there is no planned frequency for updates to the opinion. This opinion is not independent of Standard Chartered Group’s trading strategies or
positions. Standard Chartered Group and/or its affiliates or its respective officers, directors, employee benefit programmes or employees, including persons
involved in the preparation or issuance of this document may at any time, to the extent permitted by applicable law and/or regulation, be long or short any
securities or financial instruments referred to in this document or have material interest in any such securities or related investments. Therefore, it is possible, and
you should assume, that Standard Chartered Group has a material interest in one or more of the financial instruments mentioned herein. Please refer to
https://www.sc.com/en/banking-services/market-disclaimer.html for more detailed disclosures, including past opinions/recommendations in the last 12 months and
conflict of interests, as well as disclaimers. A covering strategist may have a financial interest in the debt or equity securities of this company/issuer. This document
must not be forwarded or otherwise made available to any other person without the express written consent of Standard Chartered Group.
Country/Market Specific Disclosures
Botswana: This document is being distributed in Botswana by, and is attributable to, Standard Chartered Bank Botswana Limited which is a financial institution
licensed under the Section 6 of the Banking Act CAP 46.04 and is listed in the Botswana Stock Exchange.
Brunei Darussalam: This document is being distributed in Brunei Darussalam by, and is attributable to, Standard Chartered Bank (Brunei Branch) | Registration
Number RFC/61. Standard Chartered Bank is incorporated in England with limited liability by Royal Charter 1853 Reference Number ZC18 and Standard
Chartered Securities (B) Sdn Bhd, which is a limited liability company registered with the Registry of Companies with Registration Number RC20001003 and
licensed by Autoriti Monetari Brunei Darussalam as a Capital Markets Service License Holder with License Number AMBD/R/CMU/S3-CL.
China Mainland: This document is being distributed in China by, and is attributable to, Standard Chartered Bank (China) Limited which is mainly regulated by
China Banking and Insurance Regulatory Commission (CBIRC), State Administration of Foreign Exchange (SAFE), and People’s Bank of China (PBOC).
Hong Kong: In Hong Kong, this document, except for any portion advising on or facilitating any decision on futures contracts trading, is distributed by Standard
Chartered Bank (Hong Kong) Limited (“SCBHK”), a subsidiary of Standard Chartered PLC. SCBHK has its registered address at 32/F, Standard Chartered Bank
Building, 4-4A Des Voeux Road Central, Hong Kong and is regulated by the Hong Kong Monetary Authority and registered with the Securities and Futures
Commission (“SFC”) to carry on Type 1 (dealing in securities), Type 4 (advising on securities), Type 6 (advising on corporate finance) and Type 9 (asset
management) regulated activity under the Securities and Futures Ordinance (Cap. 571) (“SFO”) (CE No. AJI614). The contents of this document have not been
reviewed by any regulatory authority in Hong Kong and you are advised to exercise caution in relation to any offer set out herein. If you are in doubt about any of
the contents of this document, you should obtain independent professional advice. Any product named herein may not be offered or sold in Hong Kong by means
of any document at any time other than to “professional investors” as defined in the SFO and any rules made under that ordinance. In addition, this document may
not be issued or possessed for the purposes of issue, whether in Hong Kong or elsewhere, and any interests may not be disposed of, to any person unless such
person is outside Hong Kong or is a “professional investor” as defined in the SFO and any rules made under that ordinance, or as otherwise may be permitted by
that ordinance. In Hong Kong, Standard Chartered Private Bank is the private banking division of Standard Chartered Bank (Hong Kong) Limited.
28 Important information

Outlook 2020 19
Ghana: Standard Chartered Bank Ghana Limited accepts no liability and will not be liable for any loss or damage arising directly or indirectly (including special,
incidental or consequential loss or damage) from your use of these documents. Past performance is not indicative of future results and no representation or
warranty is made regarding future performance. You should seek advice from a financial adviser on the suitability of an investment for you, taking into account
these factors before making a commitment to invest in an investment. You are advised not to send any confidential and/or important information to the Bank via e-
mail, as the Bank makes no representations or warranties as to the security or accuracy of any information transmitted via e-mail. The Bank shall not be
responsible for any loss or damage suffered by you arising from your decision to use e-mail to communicate with the Bank.
India: This document is being distributed in India by Standard Chartered Bank in its capacity as a distributor of mutual funds and referrer of any other third party
financial products. Standard Chartered Bank does not offer any ‘Investment Advice’ as defined in the Securities and Exchange Board of India (Investment
Advisers) Regulations, 2013 or otherwise. Services/products related securities business offered by Standard Charted Bank are not intended for any person, who is
a resident of any jurisdiction, the laws of which imposes prohibition on soliciting the securities business in that jurisdiction without going through the registration
requirements and/or prohibit the use of any information contained in this document.
Indonesia: This document is being distributed in Indonesia by Standard Chartered Bank, Indonesia branch, which is a financial institution licensed, registered and
supervised by Otoritas Jasa Keuangan (Financial Service Authority).
Jersey: In Jersey, Standard Chartered Private Bank is the Registered Business Name of the Jersey Branch of Standard Chartered Bank. The Jersey Branch of
Standard Chartered Bank is regulated by the Jersey Financial Services Commission. Copies of the latest audited accounts of Standard Chartered Bank are
available from its principal place of business in Jersey: PO Box 80, 15 Castle Street, St Helier, Jersey JE4 8PT. Standard Chartered Bank is incorporated in
England with limited liability by Royal Charter in 1853 Reference Number ZC 18. The Principal Office of the Company is situated in England at 1 Basinghall
Avenue, London, EC2V 5DD. Standard Chartered Bank is authorised by the Prudential Regulation Authority and regulated by the Financial Conduct Authority and
Prudential Regulation Authority. The Jersey Branch of Standard Chartered Bank is also an authorised financial services provider under license number 44946
issued by the Financial Sector Conduct Authority of the Republic of South Africa. Jersey is not part of the United Kingdom and all business transacted with
Standard Chartered Bank, Jersey Branch and other SC Group Entity outside of the United Kingdom, are not subject to some or any of the investor protection and
compensation schemes available under United Kingdom law.
Kenya: This document is being distributed in Kenya by, and is attributable to Standard Chartered Bank Kenya Limited. Investment Products and Services are
distributed by Standard Chartered Investment Services Limited, a wholly owned subsidiary of Standard Chartered Bank Kenya Limited (Standard Chartered
Bank/the Bank) that is licensed by the Capital Markets Authority as a Fund Manager. Standard Chartered Bank Kenya Limited is regulated by the Central Bank of
Kenya.
Malaysia: This document is being distributed in Malaysia by Standard Chartered Bank Malaysia Berhad. Recipients in Malaysia should contact Standard
Chartered Bank Malaysia Berhad in relation to any matters arising from, or in connection with, this document.
Nigeria: This document is being distributed in Nigeria by Standard Chartered Bank Nigeria Limited, a bank duly licensed and regulated by the Central Bank of
Nigeria.
Pakistan: This document is being distributed in Pakistan by, and attributable to Standard Chartered Bank (Pakistan) Limited having its registered office at PO Box
5556, I.I Chundrigar Road Karachi, which is a banking company registered with State Bank of Pakistan under Banking Companies Ordinance 1962 and is also
having licensed issued by Securities & Exchange Commission of Pakistan for Security Advisors. Standard Chartered Bank (Pakistan) Limited acts as a distributor
of mutual funds and referrer of other third party financial products.
Singapore: This document is being distributed in Singapore by, and is attributable to, Standard Chartered Bank (Singapore) Limited (Registration No.
201224747C/ GST Group Registration No. MR-8500053-0, “SCBSL”). Recipients in Singapore should contact SCBSL in relation to any matters arising from, or in
connection with, this document. SCBSL is an indirect wholly-owned subsidiary of Standard Chartered Bank and is licensed to conduct banking business in
Singapore under the Singapore Banking Act, Chapter 19. Standard Chartered Private Bank is the private banking division of SCBSL. IN RELATION TO ANY
SECURITY OR SECURITIES-BASED DERIVATIVES CONTRACT REFERRED TO IN THIS DOCUMENT, THIS DOCUMENT, TOGETHER WITH THE ISSUER
DOCUMENTATION, SHALL BE DEEMED AN INFORMATION MEMORANDUM (AS DEFINED IN SECTION 275 OF THE SECURITIES AND FUTURES ACT,
CHAPTER 289 (“SFA”)). THIS DOCUMENT IS INTENDED FOR DISTRIBUTION TO ACCREDITED INVESTORS, AS DEFINED IN SECTION 4A(1)(a) OF THE
SFA, OR ON THE BASIS THAT THE SECURITY OR SECURITIES-BASED DERIVATIVES CONTRACT MAY ONLY BE ACQUIRED AT A CONSIDERATION OF
NOT LESS THAN S$200,000 (OR ITS EQUIVALENT IN A FOREIGN CURRENCY) FOR EACH TRANSACTION. Further, in relation to any security or securities-
based derivatives contract, neither this document nor the Issuer Documentation has been registered as a prospectus with the Monetary Authority of Singapore
under the SFA. Accordingly, this document and any other document or material in connection with the offer or sale, or invitation for subscription or purchase, of the
product may not be circulated or distributed, nor may the product be offered or sold, or be made the subject of an invitation for subscription or purchase, whether
directly or indirectly, to persons other than a relevant person pursuant to section 275(1) of the SFA, or any person pursuant to section 275(1A) of the SFA, and in
accordance with the conditions specified in section 275 of the SFA, or pursuant to, and in accordance with the conditions of, any other applicable provision of the
SFA. In relation to any collective investment schemes referred to in this document, this document is for general information purposes only and is not an offering
document or prospectus (as defined in the SFA). This document is not, nor is it intended to be (i) an offer or solicitation of an offer to buy or sell any capital markets
product; or (ii) an advertisement of an offer or intended offer of any capital markets product. Deposit Insurance Scheme: Singapore dollar deposits of non-bank
depositors are insured by the Singapore Deposit Insurance Corporation, for up to S$75,000 in aggregate per depositor per Scheme member by law. Foreign
currency deposits, dual currency investments, structured deposits and other investment products are not insured.
Taiwan: Standard Chartered Bank (“SCB”) or Standard Chartered Bank (Taiwan) Limited (“SCB (Taiwan)”) may be involved in the financial instruments contained
herein or other related financial instruments. The author of this document may have discussed the information contained herein with other employees or agents of
SCB or SCB (Taiwan). The author and the above-mentioned employees of SCB or SCB (Taiwan) may have taken related actions in respect of the information
involved (including communication with customers of SCB or SCB (Taiwan) as to the information contained herein). The opinions contained in this document may
change, or differ from the opinions of employees of SCB or SCB (Taiwan). SCB and SCB (Taiwan) will not provide any notice of any changes to or differences
between the above-mentioned opinions. This document may cover companies with which SCB or SCB (Taiwan) seeks to do business at times and issuers of
financial instruments. Therefore, investors should understand that the information contained herein may serve as specific purposes as a result of conflict of
interests of SCB or SCB (Taiwan). SCB, SCB (Taiwan), the employees (including those who have discussions with the author) or customers of SCB or SCB
(Taiwan) may have an interest in the products, related financial instruments or related derivative financial products contained herein; invest in those products at
various prices and on different market conditions; have different or conflicting interests in those products. The potential impacts include market makers’ related
activities, such as dealing, investment, acting as agents, or performing financial or consulting services in relation to any of the products referred to in this
document.
UAE: DIFC – Standard Chartered Bank is incorporated in England with limited liability by Royal Charter 1853 Reference Number ZC18.The Principal Office of the
Company is situated in England at 1 Basinghall Avenue, London, EC2V 5DD. Standard Chartered Bank is authorised by the Prudential Regulation Authority and
regulated by the Financial Conduct Authority and Prudential Regulation Authority. Standard Chartered Bank, Dubai International Financial Centre having its offices

20 Outlook 2020
at Dubai International Financial Centre, Building 1, Gate Precinct, P.O. Box 999, Dubai, UAE is a branch of Standard Chartered Bank and is regulated by the
Dubai Financial Services Authority (“DFSA”). This document is intended for use only by Professional Clients and is not directed at Retail Clients as defined by the
DFSA Rulebook. In the DIFC we are authorised to provide financial services only to clients who qualify as Professional Clients and Market Counterparties and not
to Retail Clients. As a Professional Client you will not be given the higher retail client protection and compensation rights and if you use your right to be classified
as a Retail Client we will be unable to provide financial services and products to you as we do not hold the required license to undertake such activities. For Islamic
transactions, we are acting under the supervision of our Shariah Supervisory Committee. Relevant information on our Shariah Supervisory Committee is currently
available on the Standard Chartered Bank website in the Islamic banking section at: https://www.sc.com/en/banking/islamic-
banking/http://www.standardchartered.com/en/banking-services/islamic-banking/shariah-supervisory-committee.html.
UAE: For residents of the UAE – Standard Chartered Bank UAE does not provide financial analysis or consultation services in or into the UAE within the meaning
of UAE Securities and Commodities Authority Decision No. 48/r of 2008 concerning financial consultation and financial analysis.
Uganda: Our Investment products and services are distributed by Standard Chartered Bank Uganda Limited, which is licensed by the Capital Markets Authority as
an investment adviser.
United Kingdom: Standard Chartered Bank (trading as Standard Chartered Private Bank) is an authorised financial services provider (license number 45747) in
terms of the South African Financial Advisory and Intermediary Services Act, 2002.
Vietnam: This document is being distributed in Vietnam by, and is attributable to, Standard Chartered Bank (Vietnam) Limited which is mainly regulated by State
Bank of Vietnam (SBV). Recipients in Vietnam should contact Standard Chartered Bank (Vietnam) Limited for any queries regarding any content of this document.
Zambia: This document is distributed by Standard Chartered Bank Zambia Plc, a company incorporated in Zambia and registered as a commercial bank and
licensed by the Bank of Zambia under the Banking and Financial Services Act Chapter 387 of the Laws of Zambia.