a benchmark for semantic image … been constructed, there is no suitable benchmark for semantic...
TRANSCRIPT
A BENCHMARK FOR SEMANTIC IMAGE SEGMENTATION
Hui Li1, Jianfei Cai1, Thi Nhat Anh Nguyen2, Jianmin Zheng1
1Nanyang Technological University, Singapore, 2Danang University of Technology, Vietnam
ABSTRACT
Though quite a few image segmentation benchmark datasetshave been constructed, there is no suitable benchmark forsemantic image segmentation. In this paper, we construct abenchmark for such a purpose, where the ground-truths aregenerated by leveraging the existing fine granular ground-truths in Berkeley Segmentation Dataset (BSD) as well asusing an interactive segmentation tool for new images. Wealso propose a percept-tree-based region merging strategyfor dynamically adapting the ground-truth for evaluatingtest segmentation. Moreover, we propose a new evaluationmetric that is easy to understand and compute, and does notrequire boundary matching. Experimental results show that,compared with BSD, the generated ground-truth dataset ismore suitable for evaluating semantic image segmentation,and the conducted user study demonstrates that the proposedevaluation metric matches user ranking very well.
Index Terms— Benchmark, Evaluation, Semantic ImageSegmentation, Dataset
1. INTRODUCTION
Semantic image segmentation refers to the task of segmentingan image into a set of non-overlapped meaningful regionscorresponding to objects or parts of the objects which candeliver semantics or high-level structure information. Agood semantic image segmentation can benefit many othercomputer vision tasks and multimedia applications such asobject recognition, content-based image indexing, summaryand retrieval, and image editing.
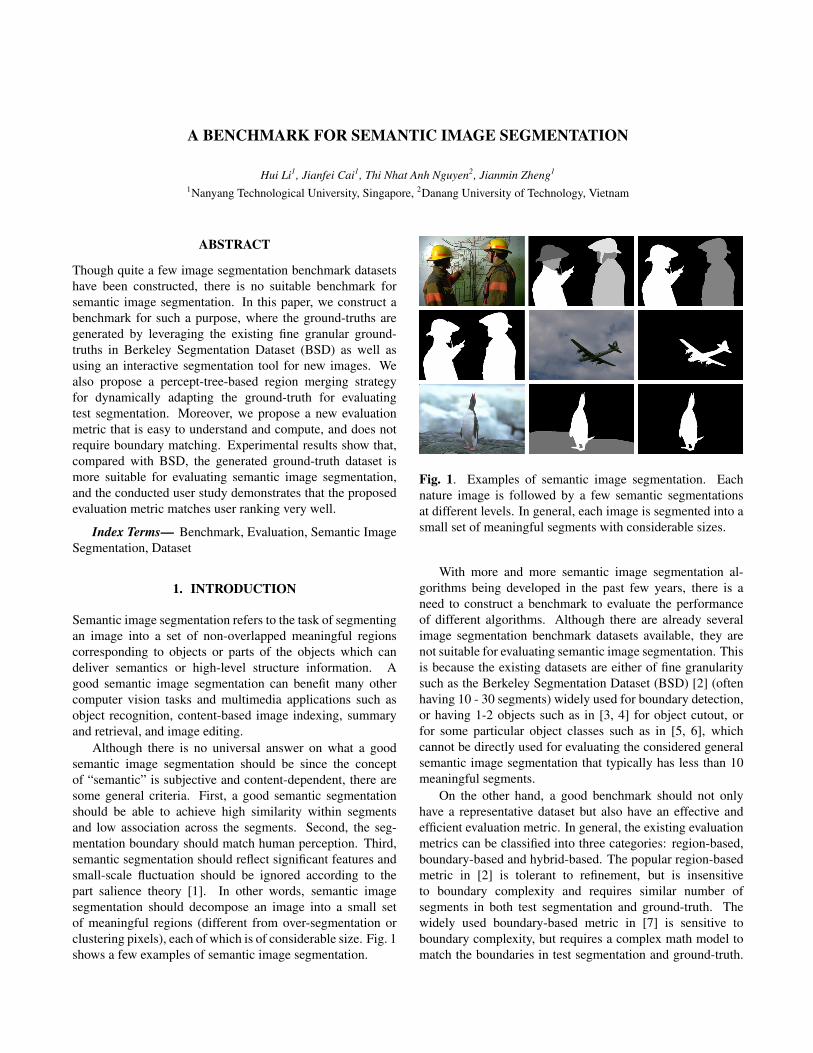
Although there is no universal answer on what a goodsemantic image segmentation should be since the conceptof “semantic” is subjective and content-dependent, there aresome general criteria. First, a good semantic segmentationshould be able to achieve high similarity within segmentsand low association across the segments. Second, the seg-mentation boundary should match human perception. Third,semantic segmentation should reflect significant features andsmall-scale fluctuation should be ignored according to thepart salience theory [1]. In other words, semantic imagesegmentation should decompose an image into a small setof meaningful regions (different from over-segmentation orclustering pixels), each of which is of considerable size. Fig. 1shows a few examples of semantic image segmentation.
Fig. 1. Examples of semantic image segmentation. Eachnature image is followed by a few semantic segmentationsat different levels. In general, each image is segmented into asmall set of meaningful segments with considerable sizes.
With more and more semantic image segmentation al-gorithms being developed in the past few years, there is aneed to construct a benchmark to evaluate the performanceof different algorithms. Although there are already severalimage segmentation benchmark datasets available, they arenot suitable for evaluating semantic image segmentation. Thisis because the existing datasets are either of fine granularitysuch as the Berkeley Segmentation Dataset (BSD) [2] (oftenhaving 10 - 30 segments) widely used for boundary detection,or having 1-2 objects such as in [3, 4] for object cutout, orfor some particular object classes such as in [5, 6], whichcannot be directly used for evaluating the considered generalsemantic image segmentation that typically has less than 10meaningful segments.
On the other hand, a good benchmark should not onlyhave a representative dataset but also have an effective andefficient evaluation metric. In general, the existing evaluationmetrics can be classified into three categories: region-based,boundary-based and hybrid-based. The popular region-basedmetric in [2] is tolerant to refinement, but is insensitiveto boundary complexity and requires similar number ofsegments in both test segmentation and ground-truth. Thewidely used boundary-based metric in [7] is sensitive toboundary complexity, but requires a complex math model tomatch the boundaries in test segmentation and ground-truth.
Hybrid-based metric [8] combines the region and boundarymeasurements through a weighted summation, which alsointroduces the additional issue of how to set the combinationweight.
In this paper, we develop a benchmark for semantic imagesegmentation. Particularly, we construct a new dateset thatis suitable for testing and evaluating semantic segmentation.Unlike BSD, which costs 30 people 8 months to generate theground-truths by manual labelling, we construct our ground-truth dataset by making use of the existing fine granularground-truths in BSD as well as generating ground-truth fornew images via an interactive segmentation tool that supportsunlimited refinements. We also propose a percept-tree-basedregion merging strategy that allows to dynamically adaptthe stored ground-truth so as to provide the most suitableground-truth for the input test segmentation. Moreover, wepropose a new evaluation metric that is easy to understand andcompute, and does not require boundary matching. Experi-mental results show that, compared with BSD, the generatedground-truth dataset is more suitable for evaluating semanticimage segmentation, and the user study demonstrates that theproposed evaluation metric matches user ranking very well.
2. RELATED WORK
2.1. Review of image segmentation datasets
Several image segmentation datasets have been constructedfor testing and evaluating different algorithms [9, 5, 3, 6, 4,2]. In particular, the dataset of image segmentation with abounding box prior contains 50 images with only one salientobject in each image and it targets for foreground extraction.PASCAL VOC 2009 dataset [5] is for recognizing objectsfrom a number of visual object classes in realistic scenes.It has 20 object classes and totally 14743 images. Withobject segmentation ground-truths included, PASCAL VOC2009 dataset can also be used to test and evaluate object-level segmentations. CMU-Cornell iCoseg dataset [3] is arecent co-segmentation dataset with 38 groups and totally643 images. Each group contains a common foregroundand each image has a ground-truth that separates foregroundand background. Weizmann horses dataset [6] contains 328images of horses. To avoid potential ambiguities when eval-uating different segmentation algorithms, the segmentationevaluation dataset [4] selects 200 gray level image with only1 or 2 objects in each of the images. BSD [2] is a widely usedimage segmentation benchmark which includes 500 imageswith 5 to 10 manually labelled ground-truths for each image.BSD is targeted for boundary detection and general imagesegmentation.
2.2. Review of evaluation metrics
Here we briefly review the two widely used segmentationevaluation metrics. The first one is a region-based metric
called consistency error proposed in [2] which evaluates theconsistency of segment interiors. One property of this metricis that it is tolerant to refinement. For example, suppose wehave two segmentations S1 and S2 for an image. Let R(S, p)denote the region in segmentation S that contains pixel p. IfR(S1, pi) is a proper subset of R(S2, pi), then pi lies in aregion of refinement and there is no local error; otherwise,the local error is non-zero. Two different ways named GlobalConsistency Error (GCE) and Local Consistency Error (LCE)are introduced to combine individual local errors into anoverall error measurement for the entire image. Both GCEand LCE are symmetric and tolerant to refinement. Theproblem with this metric is that it is meaningless when thenumber of segments in the test segmentation is quite differentfrom that of the ground-truth. For example, the segmentationwith each pixel being a segment is a refinement of anysegmentation, which results in an overall zero error.
The second metric is a boundary based metric calledboundary matching proposed in [7]. Boundary matching eval-uates a segmentation algorithm by matching the boundariesof the test segmentation to the boundaries of ground-truths,and then sums the matching quality. It first converts theboundary matching problem into a minimum cost bipartiteassignment problem. After solving the problem, by using aparticular threshold as localization error, boundary pixels areclassified into hits, misses, and false positives. With thesenumbers, precision and recall for a single segmentation canbe computed as a summary of the matching quality. Theadvantages of this metric is that it is sensitive to boundarycomplexity and does not need to match interior pixels.
3. GROUND-TRUTH GENERATION
Before constructing the benchmark dataset, we need to ad-dress two issues: what type of ground-truths is needed andhow to generate the ground-truths. For the first issue, asaforementioned, the semantic image segmentation is expectedto segment an image into a small number of meaningful re-gions with considerable size. With such a definition, differentpeople are still likely to draw different semantic segmentationresults for the same image since the semantic interpretationsare different (see Fig. 1 for example). One way to deal withthis is to store multiple ground-truths for one image, justlike that in the Berkeley segmentation dataset, which howevermisses the connections among different ground-truths and isalso storage-inefficient.
In this research, we use percept tree to represent the objecthierarchy in an image. In a percept tree, each node representsan object and a child node is a sub-segment of its parentnode. Nodes at the same level of the percept tree shouldhave equal importance. Fig. 2 gives an example of the percepttree, where the image is first segmented into the foregroundand the background in level 1, the foreground is then furthersegmented into left man and right man in level 2, and at the

Fig. 2. An example of percept tree.
last level, each person is further segmented into three objects:helmet, head and body. The number of levels is small sinceour semantic image segmentation requires small number ofsegments with considerable sizes. Based on the percepttree, we propose to use the segmentation corresponding tothe leaf-level of the percept tree as the ground-truth for oursemantic image segmentation benchmark. Moreover, weembed the percept tree into the group-truth map by usingdifferent color codes for different nodes at the same leveland using parent’s color codes as a suffix for its children’scolor codes. In this way, one ground-truth map can generatemultiple ground-truths corresponding to different levels of thepercept tree through region merging, which will be discussedin Section 4.1.
For the second issue on how to generate ground-truths,a common approach is through manual labelling to reachpixel-level segmentation accuracy, which is very tediousand time-consuming. Here, we consider two methods togenerate the ground-truths. One method is to leverage theexisting interactive segmentation tools such as [10], whichcan achieve high segmentation accuracy with a small amountof user effort. The other method is to adapt the ground-truthsavailable in the existing segmentation datasets such as BSDthat have been produced by laborious manual labelling. Thesetwo methods are complement to each other, where the formeris to generate ground-truths for new images and the latter isfor the images in the existing datasets. The combination ofthese two methods makes the construction of our semanticimage segmentation benchmark faster and easily extendable.
In particular, we make use of the fine granularity ground-truths available in BSD. A C++ software is developed tomerge the BSD ground-truths into those suitable for evaluat-ing semantic segmentations as well as embedding the percepttree information into each ground-truth. Fig. 3(a) showsa snapshot of the software, where the upper left window,upper right window and the lower window are the originalground-truth from BSD with 16 segments, adapted ground-truth for our benchmark with 7 segments and the percept tree,respectively. Fig. 4 illustrates a few generated ground-truthsby adapting those in BSD.
(a) Ground-truth generator (b) Region merging
Fig. 3. (a) Software snapshot for generating the semanticground truths from BSD. (b) Dynamic region merging forsegmentation evaluation.
(a) Images (b) BSD (c) BSD (d) Ours
Fig. 4. Generating the semantic ground-truths from theBSD ground-truths. (a) original images; (b) correspondingBSD ground-truth with the least number of segments; (c)corresponding BSD ground-truth with the most number ofsegments; (d) adapted ground-truths for evaluating semanticimage segmentation.
4. PROPOSED EVALUATION METHODOLOGY
Based on the generated ground-truths, in this section wedescribe our proposed evaluation methodology, which takestwo segmentations, i.e. test segmentation and ground-truth,as the input and produces a score indicating how good the testsegmentation result is. Our evaluation methodology consistsof two steps: region merging and metric computation.
4.1. Region merging strategy
The first step in our proposed evaluation is to dynamical-ly merge regions in the ground-truth so as to provide themost suitable ground-truth for the input test segmentation.Recall that for each image we only store one ground-truthmap/image at the leaf-level of the percept tree. However,the input test segmentation results by different semanticsegmentation algorithms could be quite diverse in terms ofthe number of segments. It is hard to have a fair evaluationif the numbers of segments in the test segmentation and theground-truth are quite different. Thus, we propose to merge
regions according to the percept tree so as to generate the mostsuitable ground truth that has the closest number of segmentscompared to the test segmentation.
This region merging step follows the rule that nodes atthe same level of the percept tree are either all merged ormerged none since all the segments at the same level haveapproximately equal importance. Fig. 3(b) is a snapshottaken during the evaluating process which shows the mergedground-truth (bottom-left) automatically generated from theground-truth (up-right) for evaluating test segmentation (up-left).
4.2. Evaluation Metric
Our proposed evaluation metric belongs to the type ofboundary-based metrics, which compare boundaries betweenthe test segmentation and the ground-truth. Unlike the state-of-the-art boundary metric proposed in [7], which seeks theoptimal boundary matching, here we propose an intuitiveand simple boundary metric that is easy to understand andcompute.
Our basic idea is to check each boundary pair in asegmentation against that in the other segmentation, rewardthe matching cases and punish the mismatching cases. Math-ematically, we define the evaluation function as
E =∑i
∑j∈Nk(i)
Wij(pi ⊗ pj) (1)
with:
pi ⊗ pj =
{1, R(S1, pi) 6= R(S1, pj)
0, otherwise
Wij =
{W+ij , R(S2, pi) 6= R(S2, pj)
W−ij , otherwise.
pi ⊗ pj can be considered as an XOR operation whichreturns 1 when pixel i and its k-ring neighbor pixel j donot belong to the same segment in the segmentation S1, i.e.R(S1, pi) 6= R(S1, pj), and returns 0 otherwise. Eq. (1)enforces that a reward weight W+
ij (e.g. 1) is given to aboundary pair, i.e. pi ⊗ pj = 1, if the corresponding pair inthe other segmentation S2 also belongs to different segments,i.e. R(S2, pi) 6= R(S2, pj); otherwise, a punish weight W−ij(e.g. -1) is given. A higher E value means a better matchingbetween the two segmentations.
With S1 being the test segmentation and S2 being theground-truth, (1) becomes computing precision P , whichmeasures how accurate the boundaries of the test segmenta-tion are. On the other hand, with S1 being the ground-truthand S2 being the test segmentation, (1) becomes computingrecall R, which measures how many ground-truth boundariesare correctly labelled. Following [7], we use Fα-measure tocombine the precision and the recall into one score:
Fα =P̂ · R̂
(1− α)R̂+ αP̂(2)
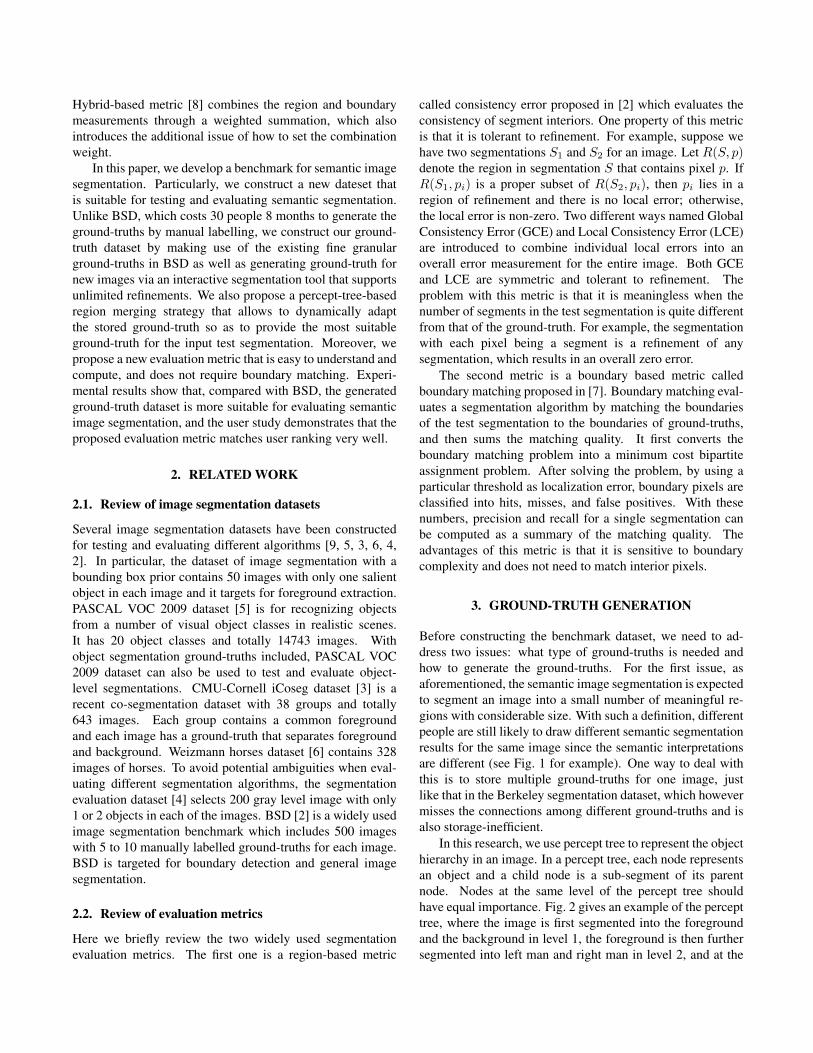
(a) Test segmentation (b) Ground-truth segmentation
Fig. 5. Segmentation evaluation for a pixel, where the blackrectangle represents the checking window (1-ring neighbor-hood here), solid lines indicate reward and dashed linesindicate punish.
where P̂ and R̂ are normalized P and R values, and α is thetradeoff factor. Since P and R are defined in the same wayand of the same importance, we set α = 0.5 and use it for allthe experiments.
Fig. 5 illustrates the segmentation evaluation of individualpixels. Particularly, at each location, we evaluate those pixelswithin a checking window that belong to a segment differentfrom that of the center pixel. Since the computation is onlyneeded for boundary pairs, the computation cost is low.
4.3. Weight Function
In this subsection, we discuss how to design the weightfunction Wij . One intuitive way is to set the reward/punishweights to be crisp values (e.g. 1 and -1). However, such asetting does not distinguish different test segmentations withdifferent distances away from the ground-truth boundaries.For example, for two test segmentations where one is closeto the ground-truth boundary and the other is far away, theintuitive setting might lead to similar evaluation scores, whichis not reasonable. In addition, considering that the boundariesin digital images are imperfect due to digitization and aboundary with 1 or 2 pixels away from the ground-truthmight not be perceived as a difference, emphasizing perfectboundary alignment by crisp values is not necessary.
Inspired by the Fuzzy-evaluation function proposed in [8],we define our reward and punish functions as:
W+ij =
1, 0 ≤ d(i, j) < a
1− 0.5(d−ab−a )2, a ≤ d(i, j) < b
0.5( c−dc−b )2, b ≤ d(i, j) < c
0, c ≤ d(i, j)
(3)
W−ij =
0, 0 ≤ d(i, j) < a
−0.5(d−ab−a )2, a ≤ d(i, j) < b
0.5( c−dc−b )2 − 1, b ≤ d(i, j) < c
−1, c ≤ d(i, j) < c+ a
0, c+ a ≤ d(i, j)
(4)
where a, b, c are parameters for localization error, controllingthe function slope, and dense evaluation complexity, respec-
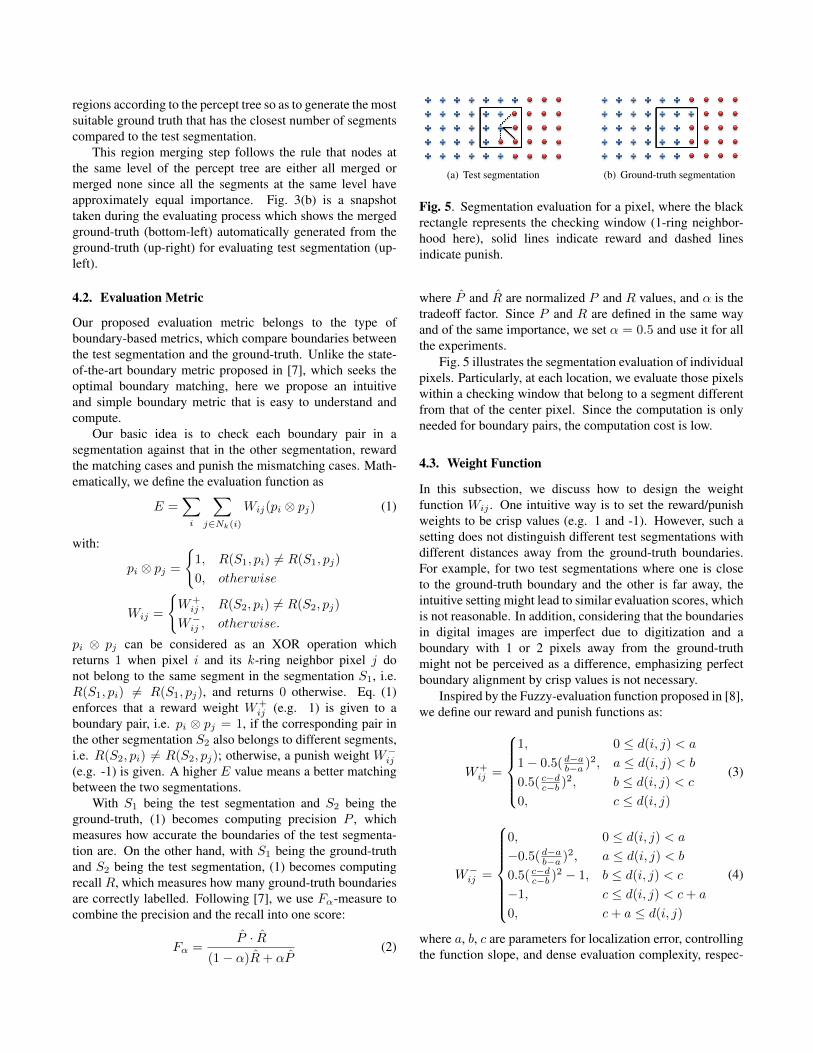
(a) Image (b) Ground-truth (c) BSD (d) Test
(e) Test (f) Test (g) Test (h) Test
Fig. 6. Examples of a few test segmentations. (c)-(h):different test segmentations.
Table 1. Evaluations of the test segmentations in Fig. 6.
Tests Precision Recall F-measure(c) 0.43 0.77 0.55(d) 0.80 0.78 0.79(e) 0.59 0.54 0.57(f) 0.79 0.78 0.79(g) 0.50 0.48 0.49(h) 0.38 0.35 0.36
tively, and d(i, j) is the Euclidean distance between pi andpj .
5. EXPERIMENTAL RESULTS
In this section, we evaluate the quality of the generatedbenchmark ground-truths and the effectiveness of the pro-posed quantitative metric. We choose 100 images from theBSD, which contain unambiguous objects in human visionperception. The original ground-truths in BSD are adaptedaccording to the percept tree to generate the wanted ground-truths for evaluating semantic image segmentation, as de-scribed in Section 3. For the proposed evaluation metric,unless it is specified, the default values for parameters a, b,c are set to a = 2, b = (c+ a)/2 and c = 10.
5.1. An example
Fig. 6 gives an example of a natural image with our ground-truth, one original BSD ground-truth, and several test seg-mentations, which are generated by based on the interactivesegmentation method in [10] with different user strokes.Table 1 lists the corresponding quantitative evaluation resultsof precision P , recallR and F-measure Fα with respect to ourgenerated ground-truth. In particular, Fig. 6(c) is a case thatone original BSD ground-truth is taken as a test segmentation,which is considered as an over-segmentation. Thus, (c) has ahigher recall value than its precision. Fig. 6(d) and (e) are thetest results with seven segments, where (d) has better visualquality than (e). Correspondingly, the scores of (d) in Table 1
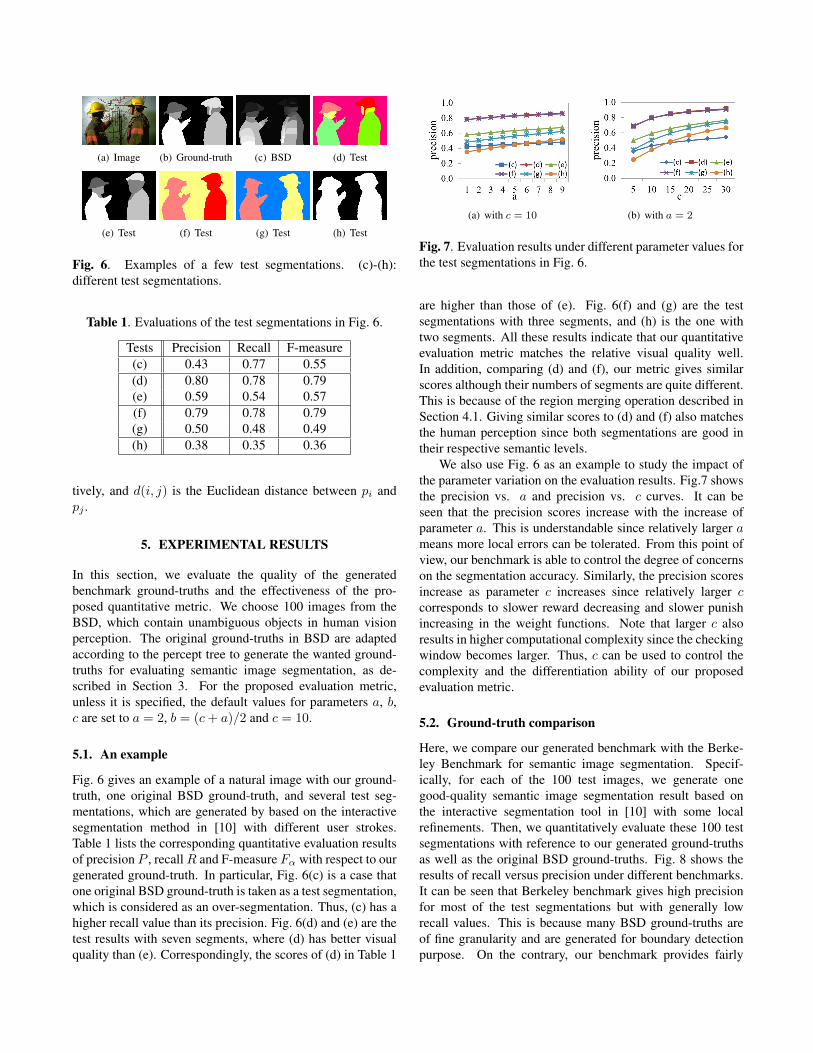
(a) with c = 10 (b) with a = 2
Fig. 7. Evaluation results under different parameter values forthe test segmentations in Fig. 6.
are higher than those of (e). Fig. 6(f) and (g) are the testsegmentations with three segments, and (h) is the one withtwo segments. All these results indicate that our quantitativeevaluation metric matches the relative visual quality well.In addition, comparing (d) and (f), our metric gives similarscores although their numbers of segments are quite different.This is because of the region merging operation described inSection 4.1. Giving similar scores to (d) and (f) also matchesthe human perception since both segmentations are good intheir respective semantic levels.
We also use Fig. 6 as an example to study the impact ofthe parameter variation on the evaluation results. Fig.7 showsthe precision vs. a and precision vs. c curves. It can beseen that the precision scores increase with the increase ofparameter a. This is understandable since relatively larger ameans more local errors can be tolerated. From this point ofview, our benchmark is able to control the degree of concernson the segmentation accuracy. Similarly, the precision scoresincrease as parameter c increases since relatively larger ccorresponds to slower reward decreasing and slower punishincreasing in the weight functions. Note that larger c alsoresults in higher computational complexity since the checkingwindow becomes larger. Thus, c can be used to control thecomplexity and the differentiation ability of our proposedevaluation metric.
5.2. Ground-truth comparison
Here, we compare our generated benchmark with the Berke-ley Benchmark for semantic image segmentation. Specif-ically, for each of the 100 test images, we generate onegood-quality semantic image segmentation result based onthe interactive segmentation tool in [10] with some localrefinements. Then, we quantitatively evaluate these 100 testsegmentations with reference to our generated ground-truthsas well as the original BSD ground-truths. Fig. 8 shows theresults of recall versus precision under different benchmarks.It can be seen that Berkeley benchmark gives high precisionfor most of the test segmentations but with generally lowrecall values. This is because many BSD ground-truths areof fine granularity and are generated for boundary detectionpurpose. On the contrary, our benchmark provides fairly
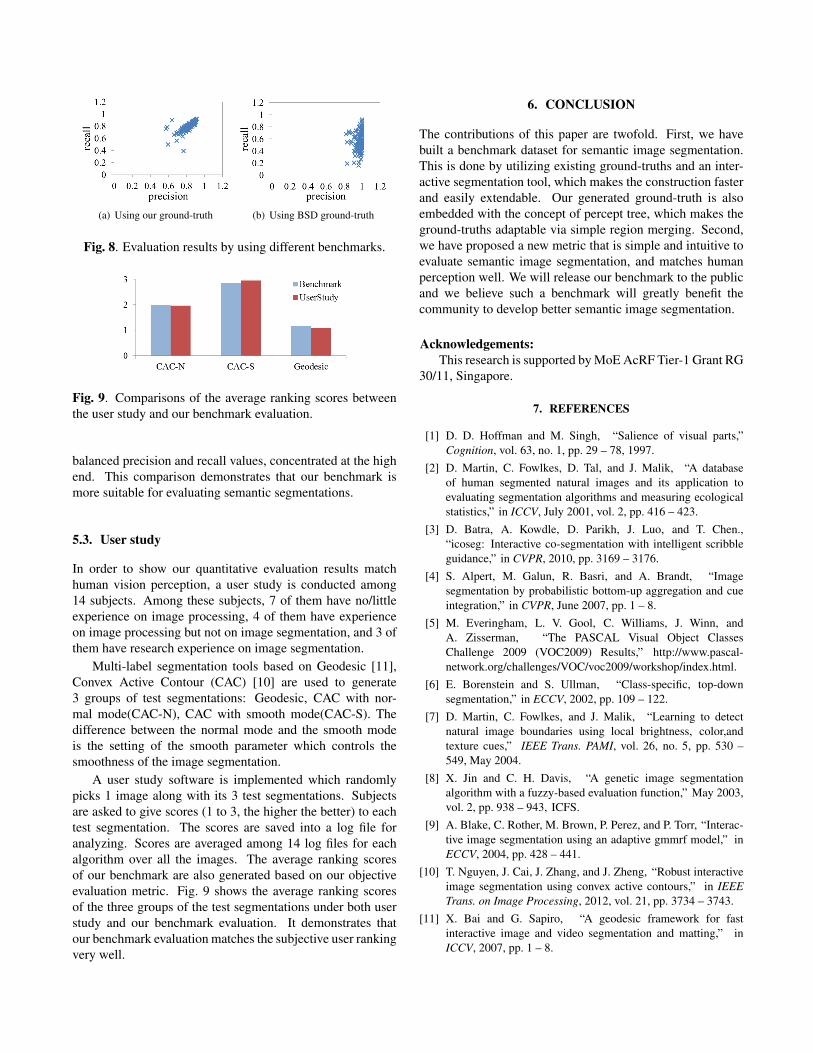
(a) Using our ground-truth (b) Using BSD ground-truth
Fig. 8. Evaluation results by using different benchmarks.
Fig. 9. Comparisons of the average ranking scores betweenthe user study and our benchmark evaluation.
balanced precision and recall values, concentrated at the highend. This comparison demonstrates that our benchmark ismore suitable for evaluating semantic segmentations.
5.3. User study
In order to show our quantitative evaluation results matchhuman vision perception, a user study is conducted among14 subjects. Among these subjects, 7 of them have no/littleexperience on image processing, 4 of them have experienceon image processing but not on image segmentation, and 3 ofthem have research experience on image segmentation.
Multi-label segmentation tools based on Geodesic [11],Convex Active Contour (CAC) [10] are used to generate3 groups of test segmentations: Geodesic, CAC with nor-mal mode(CAC-N), CAC with smooth mode(CAC-S). Thedifference between the normal mode and the smooth modeis the setting of the smooth parameter which controls thesmoothness of the image segmentation.
A user study software is implemented which randomlypicks 1 image along with its 3 test segmentations. Subjectsare asked to give scores (1 to 3, the higher the better) to eachtest segmentation. The scores are saved into a log file foranalyzing. Scores are averaged among 14 log files for eachalgorithm over all the images. The average ranking scoresof our benchmark are also generated based on our objectiveevaluation metric. Fig. 9 shows the average ranking scoresof the three groups of the test segmentations under both userstudy and our benchmark evaluation. It demonstrates thatour benchmark evaluation matches the subjective user rankingvery well.
6. CONCLUSION
The contributions of this paper are twofold. First, we havebuilt a benchmark dataset for semantic image segmentation.This is done by utilizing existing ground-truths and an inter-active segmentation tool, which makes the construction fasterand easily extendable. Our generated ground-truth is alsoembedded with the concept of percept tree, which makes theground-truths adaptable via simple region merging. Second,we have proposed a new metric that is simple and intuitive toevaluate semantic image segmentation, and matches humanperception well. We will release our benchmark to the publicand we believe such a benchmark will greatly benefit thecommunity to develop better semantic image segmentation.
Acknowledgements:This research is supported by MoE AcRF Tier-1 Grant RG
30/11, Singapore.
7. REFERENCES
[1] D. D. Hoffman and M. Singh, “Salience of visual parts,”Cognition, vol. 63, no. 1, pp. 29 – 78, 1997.
[2] D. Martin, C. Fowlkes, D. Tal, and J. Malik, “A databaseof human segmented natural images and its application toevaluating segmentation algorithms and measuring ecologicalstatistics,” in ICCV, July 2001, vol. 2, pp. 416 – 423.
[3] D. Batra, A. Kowdle, D. Parikh, J. Luo, and T. Chen.,“icoseg: Interactive co-segmentation with intelligent scribbleguidance,” in CVPR, 2010, pp. 3169 – 3176.
[4] S. Alpert, M. Galun, R. Basri, and A. Brandt, “Imagesegmentation by probabilistic bottom-up aggregation and cueintegration,” in CVPR, June 2007, pp. 1 – 8.
[5] M. Everingham, L. V. Gool, C. Williams, J. Winn, andA. Zisserman, “The PASCAL Visual Object ClassesChallenge 2009 (VOC2009) Results,” http://www.pascal-network.org/challenges/VOC/voc2009/workshop/index.html.
[6] E. Borenstein and S. Ullman, “Class-specific, top-downsegmentation,” in ECCV, 2002, pp. 109 – 122.
[7] D. Martin, C. Fowlkes, and J. Malik, “Learning to detectnatural image boundaries using local brightness, color,andtexture cues,” IEEE Trans. PAMI, vol. 26, no. 5, pp. 530 –549, May 2004.
[8] X. Jin and C. H. Davis, “A genetic image segmentationalgorithm with a fuzzy-based evaluation function,” May 2003,vol. 2, pp. 938 – 943, ICFS.
[9] A. Blake, C. Rother, M. Brown, P. Perez, and P. Torr, “Interac-tive image segmentation using an adaptive gmmrf model,” inECCV, 2004, pp. 428 – 441.
[10] T. Nguyen, J. Cai, J. Zhang, and J. Zheng, “Robust interactiveimage segmentation using convex active contours,” in IEEETrans. on Image Processing, 2012, vol. 21, pp. 3734 – 3743.
[11] X. Bai and G. Sapiro, “A geodesic framework for fastinteractive image and video segmentation and matting,” inICCV, 2007, pp. 1 – 8.