a better world through creativity - design … · 4 1. wis dhainesignt daba? design indaba was...
TRANSCRIPT

A BETTER WORLD THROUGH CREATIVITY

What is Design Indaba? Design Indaba HighlightsEconomic Impact Design Indaba MarketingSponsorship Architecture (2013)Sponsorship Branding RightsRights Property Evaluation (2013) Prepared by: Prof Kamilla Swart: Kamilla – SA Sport and Tourism Consultancy (May 2013)
Design Indaba ConfEREnCEDesign Indaba ExPoDesign Indaba fIlMDesign Indaba Do TAnKDesign Indaba MuSICDesign Indaba .CoM
Economic Contribution of the 2013 Design IndabaPrepared by: Barry Standish, Graduate School of Business, university of Cape Town
In Association with: Antony Boting, Strategic Economic Solutions
(May 2013)
Table Of COnTenTs
Page4689141626
404448525660
65
1.2.3.4.5.6.7.
8.9.10.11.12.13.
14.

RighTs PROPeRTy Prepared by Prof Kamilla Swart: Kamilla – SA Sport and Tourism Consultancy
POsT evenT RePORT baCkBy Interactive Africa

4
1. WhaT is Design inDaba?
Design Indaba was borne from the upsurge of confidence in South Africa’s democratic future, with a vision that the creative will inherit the earth. Its concept was bigger than design – one inspired by societal issues and intrinsically tied to the story of Africa. Since 1995, Design Indaba has attracted the world’s brightest talent from across the creative fields. Some of the biggest names in graphic design, advertising, film, music, fashion, industrial design, architecture, urban upliftment, sustainable design, craft, visual art, digital design, publishing, broadcasting and performance art have contributed, year after year, to Design Indaba’s international reputation.
our vision rests on the notion that South Africa should be to design what India is to IT: a globally recognised outsourcing hub. Could fTSE 100 companies outsource their creative production services to South Africa, while they send their IT back-end to India? As a people, South Africans are creative and immensely resourceful; we are image-aware, savvy
and endowed with a great oral history and innate knack for storytelling. In the future, a picture of the Johannesburg Stock Exchange should add a new booming sector – astride mining, financial services and industrials – a listing of the creative industries, South Africa’s greatest export.
our continent’s natural resources are both a blessing and a curse, having led to minimal investment in human capital. We identified a need to redress that. We envisage a society that places store by ideas. When we signed on to this journey, however, we did not expect just-add-water instant gratification. We thought it would take a generation to make a dent. Well, we are still at it.
The Design inDaba bRanD
Besides the flagship Conference and Expo, Design Indaba has grown into a multi-tiered experience that incorporates other events, media, education, training, publishing and business development.

5
ltd
insight
TRUST
Design Indaba Brand Architecture 2013
6
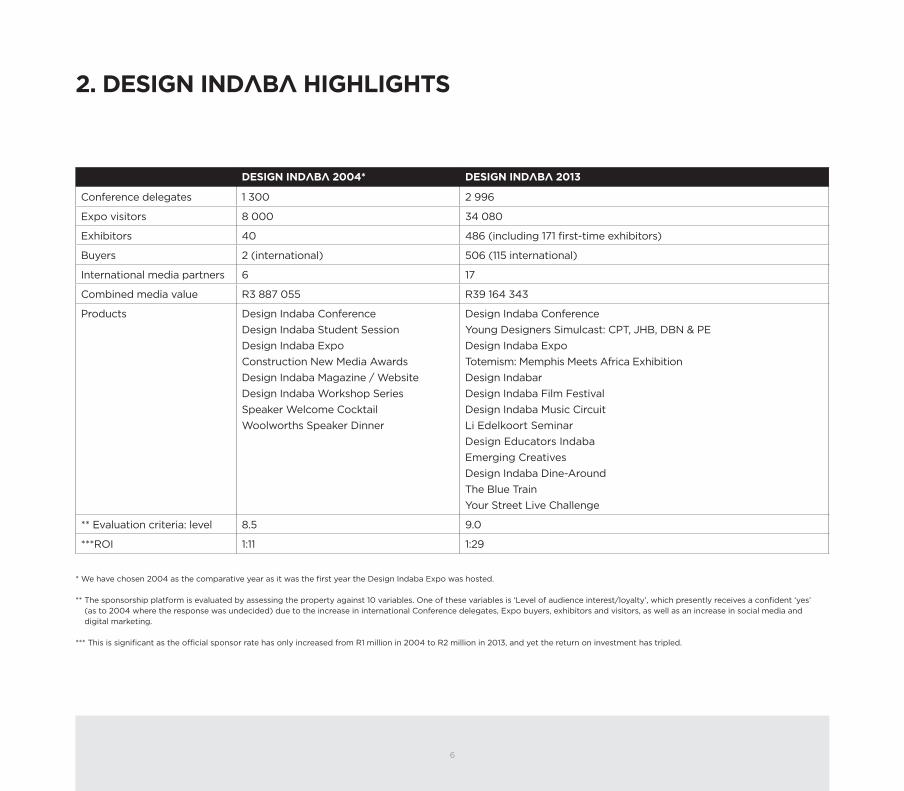
2. Design inDaba highlighTs
Design inDaba 2004* Design inDaba 2013
Conference delegates 1 300 2 996
Expo visitors 8 000 34 080
Exhibitors 40 486 (including 171 first-time exhibitors)
Buyers 2 (international) 506 (115 international)
International media partners 6 17
Combined media value R3 887 055 R39 164 343
Products Design Indaba Conference Design Indaba Student SessionDesign Indaba ExpoConstruction new Media AwardsDesign Indaba Magazine / WebsiteDesign Indaba Workshop SeriesSpeaker Welcome Cocktail Woolworths Speaker Dinner
Design Indaba Conference Young Designers Simulcast: CPT, JHB, DBn & PEDesign Indaba ExpoTotemism: Memphis Meets Africa ExhibitionDesign Indabar Design Indaba film festivalDesign Indaba Music Circuitli Edelkoort SeminarDesign Educators IndabaEmerging CreativesDesign Indaba Dine-AroundThe Blue TrainYour Street live Challenge
** Evaluation criteria: level 8.5 9.0
***RoI 1:11 1:29
* We have chosen 2004 as the comparative year as it was the first year the Design Indaba Expo was hosted.
** The sponsorship platform is evaluated by assessing the property against 10 variables. one of these variables is ‘level of audience interest/loyalty’, which presently receives a confident ‘yes’ (as to 2004 where the response was undecided) due to the increase in international Conference delegates, Expo buyers, exhibitors and visitors, as well as an increase in social media and digital marketing.
*** This is significant as the official sponsor rate has only increased from R1 million in 2004 to R2 million in 2013, and yet the return on investment has tripled.

7

8
Design inDaba 2009 Design inDaba 2013
Contribution to Western Cape Gross Geographic Product (GGP) R63.4 million R105.8 million
of which were business orders R37.3 million R58.0 million
Contribution to national Gross Domestic Product (GDP) R191.9 million R329.8 million
of which were business orders R113.1 million R184.2 million
Direct and indirect job creation 875 full and part-time jobs 1 071 full and part-time jobs
The uCT Graduate School of Business has been assessing the economic impact of the Design Indaba since 2009.
3. eCOnOmiC imPaCT
R1.3 billiOnTO The gROss DOmesTiC PRODuCT OveR 5 yeaRs

9
4. Design inDaba maRkeTing
TaRgeT maRkeT
When Design Indaba first launched, it attracted largely the young hipsters of the advertising industry, as well as academics and players involved specifically in the creative industry. However, research analysis indicates that as Design Indaba has evolved, the audience has evolved significantly and now plays host to:• Middle and senior management, marketers from
corporate South Africa • Design practitioners including architects, interior
decorators, artists, writers, fashion designers, jewellery designers and graphic designers
• Students – both high school and tertiary level • The advertising industry • Financial services and manufacturing industry • The general public – specifically regarding the
Design Indaba Expo • Academics • Small business owners and entrepreneurs
The corporate sector’s increased acknowledgement of the importance of design, creativity, innovation and inspiration in their businesses – from strategic initiatives to the daily running of the business – has
resulted in this major shift and expansion of the current audience.
The maRkeTing miX
Design Indaba has a comprehensive promotional platform that employs the marketing aspects of both international and local media.
2013 Design inDaba CamPaign over the years Design Indaba had been hosting a number of unique creative experiences. It all started with the Conference, extended to the Expo and then onto the film festival.
This year, with the exciting addition of the Design Indaba Music Circuit, we felt that the campaign should be a hardworking identity job aimed at making sure that the public were aware of the full spectrum of unique experiences that the Design Indaba brand has to offer.
In a complete 180 from our previous restrained identities, this year’s campaign embraces boldness and colour in an attempt to capture the resultant effect that all the experiences have on an event-goer who has been to Design Indaba.

10
lOCal meDia COveRage
TelevisionDStv, enews, e.tv, SABC 2, SABC 3
RadioBush Radio, Cape Talk, Heart 104,9, SAfm, Talk Radio 702, 5fm
MagazinesAdVantage, ArtMuch?, City Press, Conde nast, House & Garden, Designing Ways, DRuM, Elle Decoration, Equinox, fairlady, Good Housekeeping, Good Taste, Grazia South Africa, Habitat, Hello Cape Town, High life South Africa, Home, Huisgenoot, Ideas, Idees, Indwe, Mens Inc, 021, Passport, Prestige, Property Magazine, SA Plastics, Saltwater Girl, Sawubona, Skyways, South African Garden and Home, Southern African Real Estate Investor, Succeed, The Big Issue, Tuis, VISI, Wealthwise, Women’s Choice, Your lMG (live Music Guide)
NewspapersBeeld, Berea Mail, Business Day, Business Day Wanted, Cape Argus, Cape Business news, Cape Times, City Press, City Views, City Vision, Daily Dispatch, Daily news, Designtimes, Die Burger, financial Mail, Herald, Hillcrest fever, Hospitality Market Place, Mail & Guardian, Mum’s Mail, People’s Post, Pretoria news, SA Affordable Housing, Sake 24, Saturday Weekend Argus, Sunday Times, Sunday Tribune, Sunday Weekend Argus, Sunday World, The Event, The Mercury, The new Age, The Star, The Times, Volksblad, Witness Weekend

11
Online021magazine.co.za, 2oceansvibe.com, 48hours.co.za, 10and5.com, advantagemagazine.co.za, adfocus.co.za, afashionfriend.co.za, africareport.com, algoafm.co.za, all4women.co.za, andlollipops.com, artslink.co.za, arttimes.co.za, bandwidthblog.com, basa.co.za, bdlive.co.za, becomingyou.co.za, beeld.com, bizcommunity.com, blaque.co.za, bpmmag.co.za, businessday.co.za, businesstrade.co.za, capetown.gov.za, capetownlive.com, capegateway.gov.za, capetownmagazine.com, capetownpartnership.co.za, capetown.travel, cbn.co.za, channel24.co.za, cherryflava.com, citypress.co.za, designmind.com, destinyman.com, dieburger.com, dievolksblad.co.za, dmma.co.za, dontparty.co.za, dressedbystyle.com, dstv.com, durbanzone.co.za, eat-in.co.za, eatout.co.za, ecr.co.za, electrotrash.co.za, elle.co.za, emergingstars.co.za, emmajanenation.com, eventsnow.co.za, fairlady.com, fastmoving.co.za, fm.co.za, furturecapetown.com, getitonline.co.za, glamour.co.za, golegal.co.za, gq.co.za, handsomethings.com, hy-se-sy-se.com, iafrica.com, iammagazine.co.za, ifashion.co.za, iheartyouroutfit.com, iolproperty.co.za, itonline.co.za, itssimplyheaven.com, itweb.co.za, iwantthat.co.za, jip.co.za, kimgray.co.za, kissblushandtell.com, lanaloustyle.blogspot.com, leadsa.co.za, liveoutloud.co.za, loveaffaircapetown.com, manofthecloth.co.za, marieclairevoyant.com, marcelaospina.com, marketingupdate.co.za, marklives.com, mediaupdate.co.za, mg.co.za, missmoss.co.za, msn.co.za, mycitybynight.co.za, nadiavandermescht, ngopulse.org, onesmallseed.com, picknpay.co.za, plascontrends.co.za, politicsweb.co.za, polity.org.za, popularmechanics.co.za, propertyposer.co.za, publicityupdate.co.za, sacreativenetwork.co.za, sadecor.co.za, sagoodnews.co.za, sahomeowner.co.za, samusicscene.co.za, shadesofgold.co.za, sharmanator.com, shesthegeek, showbizone.co.za,sikidesign.blogspot.com, simplygreen.co.za, skinnylaminx.com/blog, southafrica.net, spice4life.co.za, styleguidecapetown.blogspot.com, stylesociety.co.za, sundayworld.co.za, superficialgirls.com, thecallsheet.co.za, thedailymaverick.co.za, thedesigntabloid, theevent.co.za, thegremlin.co.za, theherald.co.za, themarketingsite.com, themedia.co.za, thenewage.co.za, theprettyblog.com, thepropertymag.co.za,timeslive.co.za, tonight.co.za, totallymad.co.za, trendlives.info, ventureburn.com, visi.co.za, volksblad.com, we-are-awesome.com, wecanchange.co.za, whalecottage.com/blogwhatson.co.za, whatsupcapetown.com, whatsupjozi.com, wine.co.za, zaplurk.com
atlargewithwanted.tumblr.com,
engineeringnews.co.za,
tailsofamermaid.com,
theridgeonline.co.za,

12
inTeRnaTiOnal meDia COveRage
MagazinesAxIS, Casa Vogue, Creative Review, DAMn, Ideat, Icon, Idn, novum, +81,
Onlineartsthread.com, australiandesignreview.com, axisjiku.com, blog.artsthread.com, casavogue.globo.com, coolhunting.com, core77.com, creativereview.co.uk, damnmagazine.net, designboom.com, dezeen.com, dwell.com, egodesign.ca, iconeye.com, idnworld.com, novumnet.de, plus81.com, trendtablet.com, wgsn-hbl.blogspot.com, wgsn.com, yatzer.com
40208 Design Indaba Print Ad "Design Times" 420x290mm.indd 1 2013/01/30 12:34 PM
SUPPLIERS: THE JUPITER DRAWING ROOM (CAPE TOWN), XANITA, MINI, GROLSCH, FINE BRANDY. BY DESIGN. ASSOCIATES: ADAMS&ADAMS, WESGRO.
DEVELOPMENTAL PARTNERS: PRODUCED BY:WEB PARTNER: BROUGHT TO YOU BY:
THEBEST OFGLOBAL
CREATIVITY24 / 7
365
TJD
R (C
T) 40
411/
E
40411 DI16 +81 Mag DPS.indd 1 2013/01/16 9:36 AM
designweek.co.uk,
psfk.com,

13
aDveRTising
Advertising placement occurred in all significant channels of communication including broadcast, print and online to a booked media value of R16 250 000.
The advertising was implemented regionally, nationally and internationally. Print advertising started in october 2012, followed by online and television advertising. for the Design Indaba 2013 campaign, television advertising aired from January 2012 until the end of the Design Indaba event on 3 March 2013. The street pole posters, flags and flyers were distributed two weeks prior to the event, highlighting both the Design Indaba as a whole but specifically the Design Indaba Expo.
Local advertising was placed in/on:
DStv, Elle Decoration, House and leisure, Advantage, Mail & Guardian, Sunday Times, 021 Magazine, Marklives.com, Bizcommunity, Between 10 and 5, Hello Cape Town, Primedia and VISI.
Design Indaba places advertising with sponsor branding in the following international print and online publications:
AxIS (Japan), Casa Vogue (Brazil), Cool Hunting (uSA), Core77 (uSA), Creative Review (uK), DAMn (Belgium), designboom (Italy), Design Week (uK), Dezeen (uK), EgoDesign (Canada), Icon (uK), Idn (Hong Kong), novum (Germany), Yatzer (Cyprus), +81 (Japan) and WGSn (uK)
PubliCiTy
The publicity received by the Design Indaba event for 2013 was valued at R40 million. The media interest has increased over the past few years and the publicity programme rolls out six months prior to the Design Indaba event.
The free publicity generated continues throughout the year in many design, fashion, lifestyle and décor publications. The Design Indaba advocacy work adds significantly to the publicity portfolio, both locally and internationally, as the corporate sector is increasingly turning to Design Indaba as the standard for design, creativity and innovation.

14
TieR 1
Main sponsors- 4 (lIMITED To 6)- loGo SIzE: 100%
TieR 2
various- 4- loGo SIzE: 60%
TieR 3
suppliers- 6 (lIMITED To 6) - loGo SIzE: 50%
& lISTInGS
5. sPOnsORshiP aRChiTeCTuRe (2013)
BRouGHT To You BY:
WEB PARTnER:
offICIAl SuPPlIERS:
PRoDuCED BY:DEVEloPMEnTAl PARTnER:HoSTED In:
®

15
TieR 4
associates- 2 (lIMITED To 6) - loGo SIzE: 40%
& lISTInGS
TieR 5
Media partners- 17- loGo SIzE: 30%
& lISTInGS
TieR 6
Media supporters- 6- lISTInGS onlY
offICIAl MEDIA SuPPoRTERS:
Arts Thread, Creative Review, Design Week, EgoDesign Magazine, Marklives.com, 021 Magazine
ASSoCIATES:
offICIAl MEDIA PARTnERS:
AFRICA’S BEST READ

16
6. sPOnsORshiP bRanDing RighTs
main sPOnsORs
• Industry exclusivity in area of business • First option on all Design Indaba associated leverage
projects and activation opportunities • First right of refusal on leverage opportunities • Opportunity to host Design Indaba speakers and media
partners at an official Design Indaba function • Invitations & speaking platform to the first
speaker function • Complimentary banner ad on designindaba.com
(January – March) • Written sponsor statements in the Conference
programme and website • Ten-second animation on Conference and Expo
stage screens • Networking access to all international speakers • Invitations to all the official Design Indaba events • Direct marketing opportunity to delegates & media • Opportunity to host a Design Indaba Dine-Around • Profile page on Design Indaba website • Logo and hotlink on all Design Indaba newsletters • Ten tickets to Design Indaba Conference • Ten tickets to Young Designers Simulcast in either CPT,
JHB, DBn or PE • Thirty tickets to Design Indaba Expo • Tickets to all Design Indaba social events (number of
tickets are related to scope & size of event) • Access to Design Indaba Delegate Clubhouse • Logo and hotlink on Design Indaba website: Conference,
Expo, Sponsor & Partners pages • Full branding rights and logo on all Design Indaba
collateral, event branding and at associated events • Nine square metres of complimentary floor space to
activate at Conference or Expo • Receive an official activation video
suPPlieRs
• Category exclusivity • Invitations to selected official Design Indaba events • Direct marketing opportunity to delegates & media • Opportunity to host a Design Indaba Dine-Around • Profile page on Design Indaba website • Five tickets to Design Indaba Conference • Five tickets to Young Designers Simulcast in either CPT,
JHB, DBn or PE • Twenty tickets to Design Indaba Expo • Tickets to all Design Indaba social events (number of
tickets are related to scope & size of event) • Logo and hotlink on Design Indaba website: Conference,
Expo, Sponsor & Partners pages • Partial branding rights at the event and listings on the
marketing collateral • Six square metres complimentary floor space to activate
at Conference or Expo • Featured on Design Indaba official video footage
Ass
oci
ates
: r25
0 0
00
Mai
n S
po
nso
rs: r
2 m
illio
n
Dev
elo
pm
enta
l Par
tner
s: r
1.5
mill
ion
Sup
plie
rs: r
1 m
illio
n
Med
ia P
artn
ers:
r75
0 0
00

17
meDia PaRTneRs
• Access international speakers for interviews • Invitations to some of the official Design Indaba events • Direct marketing opportunity to delegates & media • Opportunity to host a Design Indaba Dine-Around • Profile page on Design Indaba website • Hotlink on the Design Indaba newsletters • One ticket to Design Indaba Conference and two
YDS tickets • Tickets to all Design Indaba social events (number of
tickets are related to scope & size of event) • Ten tickets to Design Indaba Expo • Logo and hotlink on Design Indaba website: Conference,
Expo, Sponsor & Partners pages • Partial branding rights at the event and listings on the
marketing collateral • Four square metres complimentary floor space to
activate at Conference or Expo • Logo on official Design Indaba footage
assOCiaTes
• Opportunity to host a Design Indaba Dine- Around• Hotlink on the Design Indaba newsletters• One ticket to Design Indaba Conference & two tickets
to YDS• Five tickets to Design Indaba Expo• Tickets to all Design Indaba social events (number of
tickets are related to scope & size of event)• Logo and hotlink on Design Indaba website: Conference,
Expo, Sponsor & Partners pages• Hotlink on the Design Indaba website event section• Partial branding rights at the event and listings on the
marketing collateral• Promotional opportunities to delegates or visitors limited
to direct marketing opportunites to delegates & media at Conference or Expo
• Listing on official Design Indaba footage
meDia suPPORTeRs
• One ticket to Design Indaba Conference & two tickets to YDS
• Five tickets to Design Indaba Expo • Partial branding rights at the event and listings on the
marketing collateral • Listing on official Design Indaba footage
18
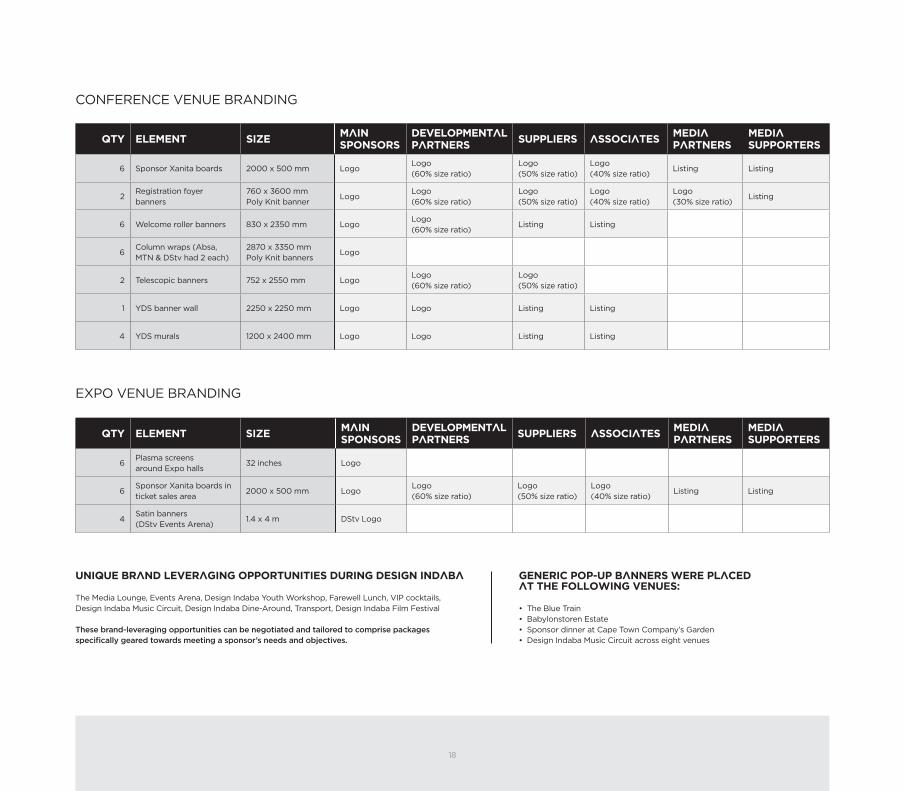
QTy elemenT siZe main sPOnsORs
DevelOPmenTal PaRTneRs suPPlieRs assOCiaTes meDia
PaRTneRsmeDia suPPORTeRs
6 Sponsor xanita boards 2000 x 500 mm logologo (60% size ratio)
logo (50% size ratio)
logo (40% size ratio)
listing listing
2Registration foyer banners
760 x 3600 mm Poly Knit banner
logologo (60% size ratio)
logo (50% size ratio)
logo(40% size ratio)
logo(30% size ratio)
listing
6 Welcome roller banners 830 x 2350 mm logologo (60% size ratio)
listing listing
6Column wraps (Absa, MTn & DStv had 2 each)
2870 x 3350 mm Poly Knit banners
logo
2 Telescopic banners 752 x 2550 mm logologo (60% size ratio)
logo (50% size ratio)
1 YDS banner wall 2250 x 2250 mm logo logo listing listing
4 YDS murals 1200 x 2400 mm logo logo listing listing
QTy elemenT siZe main sPOnsORs
DevelOPmenTal PaRTneRs suPPlieRs assOCiaTes meDia
PaRTneRsmeDia suPPORTeRs
6Plasma screens around Expo halls
32 inches logo
6Sponsor xanita boards in ticket sales area
2000 x 500 mm logologo (60% size ratio)
logo (50% size ratio)
logo (40% size ratio)
listing listing
4Satin banners (DStv Events Arena)
1.4 x 4 m DStv logo
ConfEREnCE VEnuE BRAnDInG
ExPo VEnuE BRAnDInG
geneRiC POP-uP banneRs WeRe PlaCeD aT The fOllOWing venues:
• The Blue Train • Babylonstoren Estate • Sponsor dinner at Cape Town Company’s Garden • Design Indaba Music Circuit across eight venues
uniQue bRanD leveRaging OPPORTuniTies DuRing Design inDaba
The Media lounge, Events Arena, Design Indaba Youth Workshop, farewell lunch, VIP cocktails, Design Indaba Music Circuit, Design Indaba Dine-Around, Transport, Design Indaba film festival
These brand-leveraging opportunities can be negotiated and tailored to comprise packages specifically geared towards meeting a sponsor’s needs and objectives.

19
QTy elemenT siZe main sPOnsORs
DevelOPmenTal PaRTneRs suPPlieRs assOCiaTes meDia
PaRTneRsmeDia suPPORTeRs
6 Sponsor xanita boards 2000 x 500 mm logologo (60% size ratio)
logo (50% size ratio)
logo (40% size ratio)
listing listing
2Registration foyer banners
760 x 3600 mm Poly Knit banner
logologo (60% size ratio)
logo (50% size ratio)
logo(40% size ratio)
logo(30% size ratio)
listing
6 Welcome roller banners 830 x 2350 mm logologo (60% size ratio)
listing listing
6Column wraps (Absa, MTn & DStv had 2 each)
2870 x 3350 mm Poly Knit banners
logo
2 Telescopic banners 752 x 2550 mm logologo (60% size ratio)
logo (50% size ratio)
1 YDS banner wall 2250 x 2250 mm logo logo listing listing
4 YDS murals 1200 x 2400 mm logo logo listing listing
QTy elemenT siZe main sPOnsORs
DevelOPmenTal PaRTneRs suPPlieRs assOCiaTes meDia
PaRTneRsmeDia suPPORTeRs
6Plasma screens around Expo halls
32 inches logo
6Sponsor xanita boards in ticket sales area
2000 x 500 mm logologo (60% size ratio)
logo (50% size ratio)
logo (40% size ratio)
listing listing
4Satin banners (DStv Events Arena)
1.4 x 4 m DStv logo
QTy elemenT siZe main sPOnsORs
DevelOPmenTal PaRTneRs suPPlieRs assOCiaTes meDia
PaRTneRsmeDia suPPORTeRs
20 Printed adverts Various logologo (60% size ratio)
listing listing
1 Website –logo & copy with hotlink
logo (60% size ratio)
listing listing listing listing
Weekly Electronic newsletter – logologo (60% size ratio)
listing listing
250Emerging Creatives posters
A2 logo logo
2 000 Street pole posters A1 logologo (60% size ratio)
listing listing
418 Street pole flags 1 200 x 2 700 mm1 x logo per flag
200Young Designers Simulcast posters
A1 logo logo listing listing
1 400Young Designers Simulcast programmes
A6 logo logo logo (50% size ratio)
logo (40% size ratio)
logo (30% size ratio)
listing
700Young Designers Simulcast delegate bags
– logo
2 200Conference speaker programme
A5logo & 250 word write-up
logo (60% size ratio)
logo (50% size ratio)
listinglogo (30% size ratio)
listing
10 000 Visitors Guide A3logo & advertisement
logo (60% size ratio)
listing listing listing listing
800 Buyers Guide A6logo & 250 word write-up
logo (60% size ratio)
logo (50% size ratio)
logo (40% size ratio)
logo (30% size ratio)
listing
3 Television commercials – logologo (60% size ratio)
–Design Indaba official video footage
–logo & interview
logo (60% size ratio)
logo (50% size ratio)
logo (30% size ratio)
– CTICC screens – logologo (60% size ratio)
logo (50% size ratio)
logo (40% size ratio)
logo (30% size ratio)
listing
– Various 10-second animations
– logologo (60% size ratio)
logo (50% size ratio)
logo (40% size ratio)
logo (30% size ratio)
listing
PRoMoTIonAl ElEMEnTS WITH loGo VISIBIlITY AnD WEIGHTInG
20

21
PRODUCED BY:
OFFICIAL SUPPLIERS:
ASSOCIATES:
OFFICIAL MEDIA PARTNERS: Axis, Bizcommunity, Casa Vogue, Cool Hunting, Core77, DAMn, Designboom, Dezeen, Icon, IdN, Mail & Guardian, Novum, +81,
Sunday Times, WGSN-Homebuildlife, Yatzer, 567 CapeTalk
OFFICIAL MEDIA SUPPORTERS:Arts Thread, Creative Review, Design Week, EgoDesign Magazine,
MarkLives.com, 021 Magazine
Design Indaba is the founding event of Cape Town Design Festival™ and South African Design Festival™
®
DI2013 Sponsor Boards.indd 2 2013/02/22 8:43 AM
WEB PARTNER:
BROUGHT TO YOU BY:
HOSTED IN:
DEVELOPMENTAL PARTNER:
DI2013 Sponsor Boards.indd 1 2013/02/22 8:43 AM
PRESENTED BY: BROUGHT TO YOU BY: PRODUCED BY:HOSTED IN:WEB PARTNER:
Design Indaba is the founding event of Cape Town Design Week® and South African Design Week®
BROUGHT TO YOU BY:PRESENTED BY: WEB PARTNER: DEVELOPMENTAL PARTNER:
PRODUCED BY:
2013
YOUNG DESIGNERS
27.02 –01 .03
OFFICIAL SUPPLIERS: The Jupiter Drawing Room (Cape Town), Xanita, MINI, Fine Brandy. By Design ASSOCIATES: Adams & Adams, Wesgro
YDS2013 Poster V3.indd 3 2013/01/21 4:07 PM

22

23

24
SPONSORED BY
Lemonade Stand front bottom.indd 1 2013/02/21 12:17 PM
WORKSHOPS
10:30 – 12:00 DECORATE A COLLAR OR CUFFPresented by Elizabeth Galloway Academy of Fashion DesignAGES 8 – 18 FREE OF CHARGE 20 spots available
Presented by Keri Muller, SimpleIntrigueAGES 8 – 12 R150 10 spots available
Presented by Stellenbosch Academy of Design and PhotographyAGES 8 – 18 FREE OF CHARGE 20 spots available
Presented by Woodhead’sAGES 4 – 16 R15020 spots available
Presented by Woodhead’sAGES 4 – 16 R15020 spots available
Presented by Cape Peninsula University of TechnologyAGES 8 – 18 FREE OF CHARGE 20 spots available
Presented by ConduitAGES 5 – 13 R150 10 spots available
Presented by ConduitAGES 5 – 13 R150 10 spots available
Presented by Stellenbosch University’s Visual Arts and Jewellery departmentAGES 8 – 18 FREE OF CHARGE 20 spots available
Presented by ConduitAGES 5 – 13 R150 10 spots available
Presented by ConduitAGES 5 – 13 R150 10 spots available
12:30 – 14:00 CRAZY CLAY CUSTOM FLASH DRIVE
14:30 – 16:00 MAKE YOUR OWN SKATEBOARD GRAPHIC
16:30 – 18:00 TURN PAPER INTO JEWELLERY
10:30 – 12:00 CREATE A FLYING WIND SCULPTURE
12:30 – 14:30 MAKE A STOP MOTION MOVIE FOR DSTV: UNDERWATER WORLD
10:30 – 12:30 MAKE A STOP MOTION MOVIE FOR DSTV: UNDERWATER WORLD
15:00 – 16:30 WHAT ANIMAL ARE YOU?
13:00 – 14:30 WHAT ANIMAL ARE YOU?
17:00 – 19:00 MAKE A STOP MOTION MOVIE FOR DSTV: DEEP SPACE
15:00 – 17:00 MAKE A STOP MOTION MOVIE FOR DSTV: DEEP SPACE
A1 DIY Programme.indd 1 2013/02/20 10:56 AM

25
VISITORS GUIDE
DESIGN INDABA IS THE FOUNDING EVENT OF CAPE TOWN DESIGN WEEK® AND SOUTH AFRICAN DESIGN WEEK®
DI2013 Expo Visitor's Guide.indd 1 2013/02/20 8:37 AM
HE WAS HYPNOTISED TOBELIEVE HE WAS IN PARISVIEW WHAT HE AND OTHER ARTISTSCREATED AT ABSAL ATELIER.CO.ZATHEN SUBMIT YOUR ENTRY AND YOU COULD EXPERIENCE AN ACTUAL RESIDENCY IN PARIS, NEW YORK OR ON THE ISLAND OF SYLT.
ENTRIES CLOSE: 8 MARCH 2013
Camera No.2 19:55:31 Camera No.2 21:14:11
Camera No.3 00:31:17
Camera No.4 02:09:44 Camera No.1 18:37:01
DI2013 BuyersGuide Cover.indd 1 2013/02/19 9:13 AM
BROUGHT TO YOU BY:
WEB PARTNER: HOSTED IN:
PRODUCED BY: OFFICIAL SUPPLIERS:
The Jupiter Drawing Room (CT)XanitaMINIFine Brandy. By DesignTM
AngloGold Ashanti
ASSOCIATES:
Adams & Adams AttorneysWesgro
OFFICIAL MEDIA PARTNERS: Axis, Bizcommunity, Casa Vogue, Cool Hunting, Core77, DAMn, Designboom, Dezeen, Icon, IdN, Mail & Guardian, Novum, +81, Sunday Times, WGSN-Homebuildlife, Yatzer, 567 CapeTalk
OFFICIAL MEDIA SUPPORTERS:Arts Thread, Creative Review, Design Week, EgoDesign Magazine, MarkLives.com, 021 Magazine
Design Indaba is the founding event of Cape Town Design Week® and South African Design Week®
DEVELOPMENTAL PARTNER:
Irene Boshoff.indd 19 2013/02/22 3:39 PM
CHRISTOPH NIEMANN
Rehearsal: 28 February from 15:10 – 15:20Presentation: 1 March at 10:50
Transfer to the airport: 2 March at 18:10Departure: 2 March at 20:45
Speaker Itin Cover.indd 53 2013/02/22 3:02 PM
BROUGHT TO YOU BY:
WEB PARTNER:
PRODUCED BY:
HOSTED IN:
DEVELOPMENTAL PARTNER:
DESIGN INDABA IS THE FOUNDING EVENT OF CAPE TOWN DESIGN WEEK® AND SOUTH AFRICAN DESIGN WEEK®

26
7. RighTs PROPeRTy evaluaTiOn (2013)Prepared by Prof Kamilla Swart – Kamilla-SA Sport and Tourism Consultancy (May 2013)
inTRODuCTiOn
for over a decade Interactive Africa, the owners of Design Indaba®, have been advocating design to explore how it contributes to solving problems in an emerging country. now in its 18th year, the Design Indaba® 2013 took place at the Cape Town International Convention Centre and included the Design Indaba® Conference and Young Designers Simulcast from 27 february to 1 March as well as the Design Indaba® Expo from 1 to 3 March.
The Design Indaba® Conference provides a platform for the exchange of ideas and insights while the Design Indaba® Expo presents a marketplace for South Africa’s top design talent. Each year the Design Indaba Event gains growing impetus assembling some of the world’s most pioneering and perceptive creative minds. It has built up brand equity together with a great reputation nationally and internationally. Recently at the 2012 Annual Business Day Business and Arts South Africa (BASA) Awards, Design Indaba was honoured amongst 14 other winners for the Youth Street Challenge, which it inspired. The Your Street Challenge provided a platform to showcase how design thinking can be used to transform lives, cities and streets and involved members from creative and design communities finding ways of enhancing the way people experienced their streets and their living and working environments. The challenge has been carried out across various cities in South Africa as well as in Eindhoven in the netherlands and Risør in norway, with future plans to extend the project further.
Sponsors sponsoring Design Indaba™ are given the opportunity to support culturally orientated activities as opposed to more commonly sponsored sporting activities. The events provide an opportunity to connect with people in a different space and Design Indaba™ is one of the biggest design, creative and innovation platforms forming part of the Cape Town World Design Capital (WDC) 2014.
Interactive Africa has taken a proactive approach in evaluating the rights offered to potential sponsors, and have done so on an ongoing and consistent basis, hence making the event more marketable to prospective sponsors. An independent evaluation has been undertaken in order to evaluate Design Indaba® as a sponsorship property.
The methodology used is based on IEG’s model, the uS sponsorship specialists, which provides an assessment of the rights inventory (rights package acquired by the sponsor) and the quality of the opportunity (in terms of credibility of the rights owner, sponsor clutter, prestige of the association and rights owner initiated marketing campaigns) is applied to each element of Design Indaba®. A total package evaluation is further presented.
using the IEG evaluation model, the rights values (consisting of both tangible and intangible benefits) are presented in the table below. The Return on Investment (RoI) offered for each sponsorship tier is presented in the final column. While there is no industry standard regarding costs vs. RoI, when valuing a rights package upfront, the generally accepted rule is that a package that includes guaranteed media exposure should look for a potential sponsorship value of at least three times the asking price. Thus it is evident that there is tremendous value in being associated with the Design Indaba® brand.
Why sPOnsOR Design inDaba®?
for sponsors, the Design Indaba® provides the following benefits:• Substantial return on investment• Steadily increasing consumer audience and audience profile• Brand exclusivity• Opportunity to showcase product attributes• Opportunity to leverage brand• Opportunity for strategic partnerships to be formed• Significant media coverage• Brand exposure onthe Design Indaba® website throughout the year• Contributes to the South African economy• Award-winning event• Social activism
Design inDaba®PRODuCTs COsTs RighTs value ROi
DESIGN INDABA® (Conference and Expo)
official Sponsors 2 000 000 71 406 275 1:36
Development Partners 1 500 000 47 092 260 1:31
official Suppliers 1 000000 19 988 019 1:20
Associate Suppliers 250 000 4 230 275 1:17
DESIGN INDABA® Conference
Young Designers Simulcast (CPT, JHB, DBn & PE)
650 000 14 125 195 1:22
ToTAl R 5 400 000 R 156 842 024 1:29

27
The fOllOWing shOulD be nOTeD:
• Costs supplied are illustrative figures and can be negotiated per sponsor.• In terms of the official sponsors and suppliers of the various Design Indaba® products as per the table above, the costs are deemed to be appropriate. It is also worth considering current trends
in sponsorship negotiation which point towards creating tailored packages around a potential sponsor’s needs rather than standard, inflexible rights packages. Sponsors value being granted an element of exclusivity within the overall sponsorship programme as this allows them to create a point of difference amongst other event sponsors and drive share of impact for their brand through this. Whilst still having a structured commercial programme with strict sponsorship tiers and a limited number of sponsors within each category to maintain the property’s exclusivity, it is still possible to negotiate tailored packages that are specifically geared towards meeting a sponsor’s needs and objectives, within these parameters.
• Irrespective of the level of the sponsorship, all sponsors/suppliers/partners of Design Indaba® receive the full benefit of the brand and what it represents in the market place. • It is important to underscore that the various Design Indaba® products lend itself to through-the-year activation, thus extending the Design Indaba® brand and hence association throughout the
year. In so doing, potential sponsors will be able to leverage their sponsorship more efficiently. In addition Design Indaba® as a combination of both the conference and the exhibition extends leveraging opportunities for a brand even further.
• The evaluation has been conducted within the context of business tourism which is an increasingly important segment of our growing industry. Business travel is a lucrative sector of the market, which ramps up tourism’s contribution to the economy in general. on average, business travellers spend three times more than leisure travellers and up to 40% of business travellers’ return to a destination within five years. There is also significant crossover into the leisure market.

28
The Design inDaba® COnfeRenCe & eXPO RighTs invenTORy assessmenT
DESIGn InDABA® offICIAl SPonSoRS (ConfEREnCE AnD ExPo) (R2 MIllIon ExCluDInG VAT)
RighT value
Confirmed international media space (including print, electronic) 10 750 000
Confirmed local media space (including print, broadcast, electronic) 5 500 500
Conceptualisation and production of advertising campaign and event branding 5 000 000
2 Blue Train boarding passes, 10 complimentary tickets to Conference, 5 Complimentary tickets to YDS, 20 complimentary tickets to Expo, 6 VIP & 15 general admission tickets to Music Circuit, 20 tickets to film festival, multi-access to Design Indabar Clubhouse
96 000
Event registration and access control 600 000
Exhibition stand (maximum 3m x 3m at R2 350 per square metre) at either Conference or Expo 21 150
Design Indaba Website 2 500 000
feature on a Design Indaba DVD 450 000
Conference & YDS venue, catering and AV 3 500 000
Delegate bag insert 504 600
Pre-event communication (manuals etc) (Pre-event production costs, i.e. additional staff, exhibitor briefing expenses, marketing materials, visitor guide costs etc) 720 000
Expo conceptualisation of event layout, venue and facilities 1 500 000
Construction of exhibition areas 2 800 000
functions and events 780 000
Access to international speakers 2 700 000
Branding on all Music Circuit marketing and advertising collateral 160 000
Total value of Rights Inventory 37 582 250
note 1: PR and other incidental rights that are not guaranteed sponsor benefits have been excluded from the above as they are taken into consideration as part of the evaluation criteria for assessing the quality of the opportunity.
note 2: This is a standard rights package, however additional rights can be negotiated individually with respective partners, depending on their requirements.

29
DESIGn InDABA® DEVEloPMEnT PARTnERS (ConfEREnCE AnD ExPo) (R1.5 MIllIon ExCluDInG VAT)
RighT value
Confirmed international media space (including print and electronic – uS, Europe, Asia, uK) 5 375 000
Confirmed local media space (including print, broadcast, electronic) 2 750 250
Conceptualisation and production of advertising campaign and event branding 5 000 000
1 Blue Train boarding pass, 8 complimentary tickets to Conference, 5 complimentary tickets to YDS, 20 complimentary tickets to Expo, 6 VIP & 6 general admission tickets to Music Circuit, 10 tickets to film festival, multi-access to Design Indabar Clubhouse
76 150
Event registration and access control 300 000
Exhibition stand (maximum 2m x 2m at R2 350 per square metre) at either Conference or Expo 9 400
Design Indaba Website 1 250 000
feature on a Design Indaba DVD 450 000
Conference venue, catering and AV 3 500 000
Delegate bag insert 504 600
Pre-event communication (manuals etc) 360 000
Expo conceptualisation of event layout, venue, facilities 750 000
Construction of exhibition areas 980 000
functions and events 780 000
Access to international speakers 2 700 000
Total value of Rights Inventory 24 785 400
note: Development partners have in the past been government departments and therefore not been in competition to the Design Indaba® commercial sponsors and suppliers.

30
The Design inDaba® COnfeRenCe & eXPO RighTs invenTORy assessmenT
DESIGn InDABA® offICIAl SuPPlIERS (ConfEREnCE AnD ExPo) (R1 MIllIon ExCluDInG VAT)
RighT value
Confirmed international media space (including print, electronic) 4 300 000
Confirmed local media space (including print, broadcast, electronic) 2 200 200
Conceptualisation and production of advertising campaign and event branding 2 000 000
1 Blue Train boarding pass, 5 complimentary tickets to Conference, 2 complimentary tickets to YDS, 15 complimentary tickets to Expo, 6 VIP & 6 general admission tickets to Music Circuit, 10 tickets to film festival, multi-access to Design Indabar Clubhouse
47 210
Design Indaba® Website 1 000 000
feature on a Design Indaba DVD 180 000
Delegate bag insert 504 600
Pre-event communication (manuals) 288 000
Total value of Rights Inventory 10 520 010
note 1: PR and other incidental rights that are not guaranteed sponsor benefits have been excluded from the above as they are taken into consideration as part of the evaluation criteria for assessing the quality of the opportunity.
note 2: This is a standard rights package, however additional rights can be negotiated individually with respective partners, depending on their requirements.

31
DESIGn InDABA® ASSoCIATE SuPPlIERS (ConfEREnCE AnD ExPo) (R250 000 ExluDInG VAT)
RighT value
Conceptualisation and production of advertising campaign and event branding 1 250 000
1 Complimentary ticket to Conference, 2 complimentary tickets to YDS, 5 complimentary tickets to Expo, 6 General admission tickets to Music Circuit, 10 tickets to film festival, multi-access to Design Indabar Clubhouse
13 110
Design Indaba® Website 312 500
feature on a Design Indaba DVD 56 250
Delegate bag insert 504 600
Pre-event communication (manuals) 90 000
Total value of Rights Inventory 2 226 460
note 1: PR and other incidental rights that are not guaranteed sponsor benefits have been excluded from the above as they are taken into consideration as part of the evaluation criteria for assessing the quality of the opportunity.
note 2: This is a standard rights package, however additional rights can be negotiated individually with respective partners, depending on their requirements.
It is further noted that a bespoke package can be negotiated for sponsors/suppliers who contribute less than R250 000. This package will be based on rights in proportion to the value of rights obtained for other sponsorship tiers.

32
Design inDaba® yOung DesigneRs simulCasT
Since 2006, the Young Designers Simulcast has catered for emerging designers, design students and other young people (under 25 years) from across all creative fields. At a reduced rate, these delegates watch a live broadcast of the speakers in an auditorium close to the main venue. In 2013, 870 young professionals attended the simulcast of the conference in Cape Town and a further 263 delegates attended the YDS in Johannesburg with 116 in Durban.
for the first time, 52 delegates also had the opportunity to participate via the simulcast in Port Elizabeth. It is anticipated that this exposure will grow the creative talent in the country and make for even more impressive events in future. Moreover, it is important for sponsors to engage with young creatives and students, and consequently contribute to the process of growing the creative industry towards sustainable job creation and development
DESIGn InDABA® YounG DESIGnERS SIMulCAST (CAPE ToWn, JoHAnnESBuRG, DuRBAn AnD PoRT ElIzABETH) (R750 000 ExluDInG VAT)
RighT value
Conceptualisation and production of advertising campaign and event branding 3 400 000
Confirmed local media space (including print and electronic) 1 787 663
30 Complimentary tickets to YDS, 15 complimentary tickets to Expo, 5 general admission tickets to Music Circuit, 10 tickets to film festival, Access to Design Indaba Delegate Clubhouse
52 800
YDS delegate bag insert 97 600
Design Indaba® Website 812 500
feature on a Design Indaba DVD 146 250
Venue, catering and AV 1 137 500
Total value of Rights Inventory 7 434 313

33

34
QualiTy Of The OPPORTuniTy Design inDaba® 2013 COnfeRenCe anD eXPO
evaluaTiOn CRiTeRia yes/nO
Prestige of Property
largest and only event of its kind in the Southern Hemisphere supported by local and international designers, exhibitors and creative industry business people. In 2005, Design Indaba® was voted the best conference in the world at a prestigious European tradeshow, the EIBTM Awards, and it has been declared the best design conference in the world on numerous occasions by both speakers and international media. The event takes place at the Cape Town International Convention Centre, hence enhancing the profile of the property.
YES
Recognition / Awareness
The promotional campaign for the event neared R21 million this year locally and creates significant awareness around the event among the target audiences within the industry (i.e. Primary: M.A.D; and secondary: architecture, product design, fashion, interiors, film, media/publishing, retail and jewellery design). The primary audience are those interested in design and innovation. The event also attracts experienced designers, academics and networkers. An increasing corporate audience is also in attendance as they have recognised the importance of design, creativity and innovation in business. Design Indaba® attracts large numbers of people locally (34 080 attended the Expo and there were 4 166 conference delegates in attendance). There were over 400 exhibitors at this year’s Expo. Design Indaba® is also growing internationally as well as a result of the website. The average page views per month was 40 000 in 2012 and around the period of the event in 2013, visitor numbers increased significantly (page views were 68 750 with 48 980 unique visitors from 17 february – 3 March 2013).
YES
Category Exclusivity
The contract guarantees category exclusivity to a sponsor. YES
Level of Audience Interest / Loyalty
over 500 leading speakers from SA and around the world have participated in the event in its lifetime. In 2013, some 3 329 delegates attended including international delegates from france, the netherlands, the united Kingdom, the uSA, namibia, Congo, Australia, Belgium, finland, Germany, India, zimbabwe and the united Arab Emirates. 53% of the audience was male and 42% female. 23% of the audience in 2013 was from Cape Town and surrounds with 19% of the delegates from Gauteng, 2% from other parts of South Africa and 2% international. 46% of the Design Indaba® attendees are repeat delegates, with many attending the last 3 or 4 editions.The Expo is also an exciting retail environment and attracts the average mall shopper in need of new hunting grounds. 2013 saw 506 buyers register to attend, with 115 of these being international buyers. As mentioned above, the Design Indaba® community is testimony to the loyalty the brand attracts. With the increasing proliferation of social media and digital marketing, it is important to underscore that Design Indaba® is a brand that has a community, where people identify and feel a sense of belonging. It is also worth noting that the website has grown in stature: before it only attracted the local community and was visited only around the period of Design Indaba but it now has a wider international and local community and is updated and visited all-year-round.
YES
Ability to Activate
Because of the growth of the event, more platforms have been developed and activation and leveraging opportunities for sponsors have increased substantially, however it depends on how the sponsor takes up this opportunity
n/A
The sponsorship platform is evaluated by assessing the property against 10 variables. As the official sponsor to Design Indaba® will have rights to both the Design Indaba® Conference and the Design Indaba® Expo, the quality of the opportunity for both properties need to be considered and is presented below.

35
evaluaTiOn CRiTeRia yes/nO
Limited Degree of Sponsor Clutter
The 2013 event secured four official sponsors, one web partner, one developmental partner, six official suppliers, two official associates, four official local media partners and 13 international media partners as well as two local and four international media supporters who trade exchange with the Design Indaba® increasing the exposure of the event and sponsors. While the number of sponsors, suppliers and media partners may look cluttered, it is important to note that there is no more than 6 major sponsors or suppliers. The media partners service a purpose with respect to broadcasting the event and do not compete in the same space as the other sponsors.
YES
Non-ambushability of Property
Mechanisms are in the process of being put in place to protect the rights of official sponsors from ambush marketing by non-sponsors, especially in relation to the guest speakers. YES
Network Opportunities
Good networking opportunities in the creative industries including the design fraternity, fashion, film, architecture, craft, visual art, publishing, advertising and new media. official sponsors and suppliers received complimentary tickets to the Design Indaba® Conference and Expo, and other related events such as the Design Indabar Clubhouse, film festival and the Design Indaba® Music Circuit (see rights value table).
YES
Newsworthiness
The advertising campaign was conducted across all media nationally and internationally, and generated a value of over R16 million. In addition, the free media, nationally, generated a value of nearly R40million (up to mid-April). There has also been significant global exposure via various websites (a Google search will attest to this).In terms of social media, Design Indaba® had 365 new fans per month in 2012 on facebook and 1 367 new fans during the period of Design Indaba® 2013. Design Indaba® had 739 new followers per month on Twitter in 2012 and received 2 364 new followers during the period of the event in 2013. The event generated an online brand exposure of over 875 000 people. This was due to the number of highly influential people talking about the event and how quickly the event was shared on Twitter.
YES
Established Track Record
The Design Indaba® event has been going since 1995. Design Indaba® is well established and is recognised both globally and locally as a significant event in the design and innovation space while the introduction of the Design Indaba® Expo and projects, like the Your Street Challenge, bears testimony to its continuing growth. The event promoter, Interactive Africa, has a reputation for hosting successful events.
YES
TOTal numbeR Of yes ResPOnses 9

36
OveRall value Of sPOnsORshiP RighTs PaCkages TO Design inDaba® PROPeRTies
We have determined the value for the sponsorship rights package of the 2013 Design Indaba® (includes rights to the Design Indaba® Conference and Expo) as an Official Sponsor using the following formula:
In addition, we have determined the value for the sponsorship rights package of the 2013 Design Indaba® as a Development Partner using the following formula:
The value of the sponsorship rights package to the 2013 Design Indaba® Conference as a Sponsor of the Young Designers Simulcast (Cape Town, Johannesburg, Durban and Port Elizabeth) using the following formula:
The value of the sponsorship rights package to the 2013 Design Indaba® as an Official Supplier using the following formula:
The value of the sponsorship rights package to the 2013 Design Indaba® as an Associate Supplier using the following formula:
Rights Inventory Assessment Value 37 582 250
Quality of the opportunity Assessment Score 9
Rand Value Equivalent 33 824 025
Total value 71 406 275
Rights Inventory Assessment Value 24 785 400
Quality of the opportunity Assessment Score 9
Rand Value Equivalent 22 306 860
Total value 47 092 260
Rights Inventory Assessment Value 10 520 010
Quality of the opportunity Assessment Score 9
Rand Value Equivalent 9 468 009
Total value 19 988 019
Rights Inventory Assessment Value 2 226 460
Quality of the opportunity Assessment Score 9
Rand Value Equivalent 2 003 814
Total value 4 230 274
Rights Inventory Assessment Value 7 434 313
Quality of the opportunity Assessment Score 9
Rand Value Equivalent 6 690 882
Total value 14 125 195

37
sOCial meDia anD DigiTal maRkeTing
Social media is an important component of marketing strategies and tactics. Mobile phones have a larger penetration in Africa than the internet currently, and the ability to operate social networks via mobile phones has created new opportunities for users to interact. Bloggers can also make use of their mobile phones to blog, and mobile users often access the web via their phones.
Social media platforms such as facebook, Twitter and linkedIn have seen dramatic growth in recent times and are now recognised as valuable marketing tools. Some project facebook’s users will grow to number 1.3 billion to 1.5 billion by the end of 2013 (Kirkpatrick, 2013) and in December 2012 Twitter announced that it has more than 200 million monthly active users; this is double the 100 million noted in September 2011.
In South African social media has become as a core pillar of internet activity, along with email, news and banking (fuseware and World Wide Worx, 2011). According to their findings, Mxit and facebook have the most users, while Twitter has seen the most significant growth in social networking in 2011, and BlackBerry Messenger is the fastest growing network in the second half of 2011.
Their research further shows that there were 1.1-million Twitter users in South Africa in mid-2011, making South Africa the tenth largest Twitter using country in the world. This number was expected to increase 20 fold in a space of less than a year (net Age, 2012).
sOCial meDia aT Design inDaba®@designindaba has a an active Twitter following of close to 28 000. It averages around 740 new followers per month. over the 2013 Design Indaba event, @designindaba received 2 364 more Twitter followers. .
The Design Indaba™ facebook page has over 11 000 likes and averages about 365 new page likes during the year. over the 2013 Design Indaba event, the Design Indaba facebook page received 1 367 new facebook fans.
In terms of the value of presence of a sponsor’s (South African Tourism) banner on the Design Indaba® website, the cost per thousand (CPM) impressions range from as low as $2 but more typically $5-$30 depending on the potential value of the audience the website reaches. Given the typical profile of the Design Indaba® audience (well educated and wealthier), it is expected that the value would be higher at $10 CPM.
The more interaction in social media the greater the reach platforms like facebook will provide. The growth in the rate of interaction and size of the Design Indaba® online community will push up the value to Design Indaba’s® other partners for future years.
Recent trends in sponsorship space include more branded activities which have always been there but are becoming more prominent as companies are more frequently looking at the cost of sponsorship and looking to create either completely separate activities that fit with their brand; and staff engagement which is traditionally an overlooked part of the sponsorship RoI model. lower turnover, higher retention rates, increased desirability as an employer and higher quality of talent are all drivers of substantial returns for the company that compare well and often better than other programs corporate run (IEG, 2013).
It is forecasted that for 2013 sponsorship will become even more competitive. In order to add value for sponsor’s properties can add value to their sponsorships by acting as marketing consultants to increase the success of sponsors, measure results, conduct audience research, offer off-site extensions of events and conduct community outreach projects. Many events are now finding new sponsorship opportunities through customer rewards programmes as well as through employee engagement programmes (Kalish, 2013).
Globally the sponsorship industry showed a growth of 5.1% in 2012, higher than the expected 4.9% with revenue of $51.1 billion. It is projected that in 2013 global spending will increased at a slower 4.2%. The largest marketing, the u.S. and Canada, had a 4.4% growth in 2012, showing a faster rate than traditional advertising for the last few years. Europe, the second largest market, in 2012 had sponsorship revenue of $14.1 billion with a 4.7% growth. Asia Pacific experienced a healthy 6.7% growth rate with sponsorship revenue of $12 billion in 2012 due to strong sponsorship markets in Russia, China and India. Central and South America have largely benefitted from the build up to the 2014 fIfA World Cup™ and the 2016 olympic Games in Brazil, however the sponsorship market has not grown as much as was anticipated. Sponsorship in Africa and the Middle East grew 5.1% in 2012 and generated $2.2 billion in revenue (Kalish, 2013).
In terms of the customer, forecasts have shown that for 2013 customers will spend less on convenience and look for product value and novelty, that multi-generational and combined living arrangements will influence spending patterns, that health and leisure time will become more valued, that food will become more than just a life staple, that gender specific outlooks and consumption will fade and that locally produced products will become more appealing. It is also predicted that older consumers and parents will play a larger role in the market and that tech-driven shopping will become more popular (Kalish, 2013).
The recent economic recession has continued to have an impact on sponsorship and during the recession emerging markets were quite negatively affected. Brazil and South Africa experienced negative economic growth, China’s manufacturing sector and India’s services sector suffered slowdowns (Sports Marketing Association, 2010). The table on the next page illustrates global sponsorship spend by region.
sPOnsORshiP TRenDs

38
60
Sp
ons
ors
hip
Sp
end
ing
(in
Bill
ion
uS
Do
llars
)
2009
16.5 17.2 18.1 18.9 19.9
12.112.9
13.514.1
14.5
10.0
10.611.2
12.012.63.5
3.6
3.7
3.94.0
1.9
2.0
2.1
2.2
2.3
2010 2011 2012 2013
GloBAl SPonSoRSHIP SPEnD BY REGIon (IEG, STATISTA 2013)
All other countries Central / South America Asia Pacific Europe north America
20
40

39
It is evident that over the years, Design Indaba® has grown in stature and prominence. It has built up brand equity together with a great reputation nationally and internationally. This event has the potential to grow exponentially, especially with Cape Town being awarded World Design Capital status in 2014, and can offer sponsors a platform to associate themselves with a unique event and a valuable sponsorship platform for companies and brands operating in this environment.
While there is no industry standard regarding costs vs. RoI, when valuing a rights package upfront, the generally accepted rule is that a package that includes guaranteed media exposure should look for a potential sponsorship value of at least three times the asking price. It is evident that each of the Design Indaba® properties has rights attached to it that are considerably higher than the costs. This makes sponsoring one of the Design Indaba® properties a lucrative option for prospective sponsors. Moreover, irrespective of the level of the sponsorship, all sponsors/suppliers/partners of Design Indaba® receive the full benefit of the brand and what it represents in the market place.
In terms of the official sponsors and suppliers of the various Design Indaba® products, the costs are deemed to be appropriate. It is also worth considering current trends in sponsorship negotiation which point toward creating tailored packages around a potential sponsor’s needs rather than standard, inflexible rights packages. Sponsors value being granted an element of exclusivity within the overall sponsorship programme as this allows them to create a point of difference amongst other event sponsors and drive share of impact for their brand through this. Whilst still having a structured commercial programme with strict sponsorship tiers and a limited number of sponsors within each category to maintain the property’s exclusivity, it is still possible to negotiate tailored packages that are specifically geared towards meeting a sponsor’s needs and objectives, within these parameters. We would recommend this approach be taken in this case.
It is also worth noting that the various Design Indaba® products lend itself to through the year activation, thus extending the Design Indaba® brand and hence association throughout the year. In so doing, potential sponsors will be able to leverage their sponsorship more efficiently. In addition, Design Indaba® as a combination of both the conference and the exhibition, along with new products such as film and music that are constantly evolving, extend leveraging opportunities for a brand even further.
In conclusion, the value of the Design Indaba® brand is immense as a sponsor of a particular Design Indaba® component is associated with the Design Indaba® brand as a whole. It is evident that the Design Indaba® is a category leader, and attracts a targeted, monied market – image merchants of the world that invent and dictate trends for consumers at large. In so doing, it is a niche event and attracts a distinctive target audience, thus providing a unique sponsorship opportunity.
COnClusiOn


41
2013 faCTsCape Town International Convention Centre
27 feb – 1 March 201331 speakers
2 996 delegates (Including Young Designers Simulcast)

42
COnfeRenCe
A cocoon descending from the ceiling containing one of South Africa’s most exciting contemporary artists, a music video of dancing sperm, a venerated typographer on creating a font for Yale university, a Smart Highway that responds to prevailing traffic conditions, the complex and fascinating redesign of the uK government’s digital services, a social project encouraging designers to better the lives of individuals through fixing stuff, explorations in synthetic biology, a chef who evokes the deforestation of the Amazon by infusing burnt flavours into his food…
The Design Indaba Conference has never been the place for instant answers to defining the coming trends or copy-and-paste ideas to apply back at the office. It has established itself as one of the most outstanding of its kind – set apart from other global design conferences by a signature that is defined by speakers (and subjects) that are as extensive as they are eclectic.
eDuCaTORs inDaba
The 2013 Educators Indaba was led by neville Brody (professor and Dean of the School of Communication
at the Royal College of Art in london). Presenting alongside Brody was lawrence zeegen, Dean of Design at london College of Communication, university of the Arts london.
The topic of discussion was “Creative Education in Developing Communities”. A round-table discussion followed each speaker’s presentation, with the intended outcome of coming up with a new strategy for creative education in developing communities.
Design inDabaR
Design Indabar is not your typical watering hole. Comprising two steel shipping containers, Design Indabar is a beautifully designed portable bar and multifunctional mobile gallery.
Situated within walking distance from the CTICC, Design Indabar 2013 was the perfect way to end creatively packed days. Delegates enjoyed ice-cold beverages and artisanal snacks while relaxing to the sounds of South Africa’s best up- and-coming musicians.

43


45
2013 faCTs34 080 visitors over the four days
lSM level of shoppers 8-102 500 school children attended the event
486 exhibitors (including 171 first-time exhibitors)506 buyers (391 local vs 115 international)
300 media

46
Design Indaba Expo is a showcase of the very best South African design products. Bespoke, curated and 100% local, it’s all about creative distinction! A gathering point for South Africa’s blossoming creative sector, it is regarded as a “must-attend” event by designers, buyers and the public.
As the country’s premier showcase of high-end, homegrown design, Design Indaba Expo is also the only platform that welcomes advertising, craft, decor, fashion, product design, industrial design, new media, publishing, visual art, jewellery design and graphic design, all under one roof.
2013 highlighTs:
Totemism: Memphis meets Africa – A Design Indaba project conceptualised and curated by li Edelkoort & sponsored by Woolworths.
Trend forecaster li Edelkoort discerned a kinship between the bold Memphis Design Movement of the 1980s and the vibrancy of South African style. She charged South African designers to take a leaf from the style book of the Memphis designers by setting
themselves free with colourful and patterned laminates, tactile materials, historical form, wild animal materials, printed glass, loud celluloid, neon tubes and metal plates finished with spangles and glitter. The show at the centre of the expo featured work by 53 South African designers across a range of disciplines.
• Design Indaba Youth (DIY) workshops• Pecha Kucha presentations by Design Indaba
Conference Speakers in the DSTV Event Arena• The largest ever gathering of food trucks in Cape Town• 20 Fashion shows by new and established designers• Cape Town Fashion Council (CTFC) had double the
number of designers from the previous year• DStv Event Arena featuring live music, design talks and
award ceremonies• MBOISA Award: Gavin Rajah’s Pebble dress• Most Creative stand award: Thingking• Innovation award: Wintech Innovation• DStv Miniplex featuring 30 three-minute movies• Design Indaba TV Studio on the Expo floor• Debut of World Design Capital 2014 stand • Showcasing of the “Green Shack” created by Touching
the Earth lightly

47


49
2013 faCTs15 films15 days
All in 1 cityAll on 1 rooftop

50
Design Indaba filmfest 2013 once again treated Cape Town audiences to a world-class film and documentary festival highlighting the power of creativity.
In a continuous effort to broaden the scope of creativity across multiple platforms, Design Indaba presented its annual film festival at The Bank in Cape Town’s fringe district, recognised as a hub for design, art, creativity and innovation.
Design Indaba filmfest screened an array of feature films and documentaries from 17 february to 3 March 2013.
fifteen films on the best of the world’s creativity were enjoyed on a rooftop cinema with stunning views of Table Mountain, the Mother City’s world-renowned natural wonder.
A highlight on this year’s programme was the screening of Ai Weiwei: Never Sorry. first-time director Alison Klayman’s unprecedented access to China’s most famous international artist results in an astounding
detailed portrait of a man with unrelenting spirit and defiance. The film documents Ai Weiwei’s mission to uncover the truths hidden by the Chinese government, while simultaneously providing an eye-opening inside story of contemporary China.
Another festival hit was Big Easy Express, which documents the extraordinary musical journey of folk rock and indie rock bands Mumford & Sons, old Crow Medicine Show and Edward Sharpe and the Magnetic zeros as they depart on a “tour of dreams” across America.
This year the filmfest also extended to Design Indaba Expo with a “Miniplex” on the Expo floor. In a mini cinema visitors could watch a three-minute documentary series, produced by focus forward films. The focus forward films also appeared on desigindaba.com as part of our first-ever online film festival in october 2012.
Design Indaba filmfest was presented in association with DStv and supported by the national film and Video foundation (nfVf).

51


53
2013 faCTsYour Street live
4 winnersR250 000 prize
own, love and improve Your Street!

54
on 28 february 2013 the four winners of the Your Street live Challenge were announced at a prize-giving ceremony at Design Indaba Expo. The R250 000 total prize money, generously sponsored by MTn, was presented by Cape Town Mayor Patricia de lille.
The Your Street Challenge is about seeing the potential of urban spaces, being in touch with the needs of the community and thinking creatively to make urban spaces smarter, safer, healthier and more sustainable for everyone who uses it.
After careful selection by an independent jury, comprising Hannah Williams (previous Your Street winner), luyanda Mpahlwa (architect) and Anton Groenewald (City of Cape Town representative), the following winners were announced:
R50 000 – The Eduvator by Batandwa Alperstein, Jacqui Watson, Blaise Dobson, Mbali Sikakana: A crowd-sourced funding platform that allows citizens to make a small contribution towards a
big change in underprivileged schools and see the results in real time.
R50 000 – Mountain Road nest by Ricky lee Gordon and Greenpop: Creating a community recreation area on an unused piece of land near a primary school.
R50 000 – Barrack lane by the laneway lab (Gareth Pearson, Alexandra Jongens and Danielle Ehrlich): Barrack lane is an alleyway that will be used as a place for the public to sit, eat, meet, work, and socialise.
R100 000 – Soundwaves for Change by one love Studio: An initiative that aims to spread socially conscious messages via the medium of music, providing HIV education, life skills and mentorship to youth.
With successful projects already on the streets of Cape Town, Johannesburg and Eindhoven in the netherlands, Your Street is looking to accelerate this phenomenon by investing in streets around the world.

55


57
2013 faCTs32 artists8 venues
All in 1 cityAll in 3 days

58
Believing that Cape Town resonates with the sound of music as much as it does artful design, architecture and natural beauty, in 2013 Design Indaba curated an ambitious musical tour of the city that drew Design Indaba, attendees and the music-loving public up close and personal with the very sound of Cape Town.
offering intimate musical experiences in eight venues across the city over three nights with some 32 music acts, the Design Indaba Music Circuit presented live music in ways generally not experienced outside of music festivals.
The Design Indaba Music Circuit was about experiences, collaborations, having fun and giving fresh talent a platform on which to showcase their talents.
While Design Indaba functions as a one-stop design portal for the sort of highly curated, bespoke multimedia content that is bread and butter to the global creative industries, music has always been a large part of every Design Indaba.
As with previous Design Indaba music events, the diverse lineup of acts reflected a combination of
musicians, producers and DJs, musicians both long established and rising stars.
The deciding factor behind curation of the lineup was that the art be unique or pioneering in their chosen field of music and wholly representative of the “sound of South Africa”.
So whether it was absorbing the spectacle of South African jazz legend Hugh Masekela on stage with American jazz-fusion rock pianist larry Willis in the intimacy of The Mahogany Room jazz bar, getting sweaty on The Assembly’s dancefloor to 10SuI (uK), Haezer, Gazelle and niskerone, or revelling in the raw rock ‘n roll of Beast and Taxi Violence at Aces ‘n’ Spades, the Design Indaba Music Circuit truly catered to even the most discerning music lover.
“Design Indaba really is at the forefront of creativity. I’m a big fan of what Design Indaba does and a bigger fan of what they bring to South Africa. Concepts, innovation and ideas bring all the creatives together. I love everything they represent,” says DJ Anthea Scholtz.

59


61
2013 faCTsHalf a million visits per year
35 000 unique visits per month1.2 million page impressions per year
Dwell time: readers spend on average 3.5 minutes per visit27 000 Twitter followers
10 850 facebook fans20 000 Design Indaba newsletter subscribers

62
Design for change. Design for good. Design for a better world.
These are the premises that fuel Design Indaba’s drive for a better world through design, creativity and innovation.
Designindaba.com is the online culmination of the Design Indaba experience, serving as a one-stop design resource for highly curated, bespoke multimedia content on global creativity. Its primary goal is to publish content on world design happenings, thought leadership on the creative industries and insight into how a better world is possible through creativity. Key sections are news and TV (opposite), as well as Profiles and Galleries, which feature prominent creative figures and their work, respectively. The website is also an information hub for all Design Indaba events and projects.
Online auDienCe
Designindaba.com was relaunched in november 2012 with a newly designed layout, engine and information architecture, all aimed at channelling our online audience into our vast offering of quality content and improving overall user experience.
Since then, our web traffic has seen a substantial increase. our number of visits in April 2013 is 29% higher than the same period in 2012, and pageviews have increased 50% across the same period, showing higher levels of audience retention and engagement. We now get almost 500 000 visits a year, and traffic is growing every month.
naturally our event period yields a higher traffic influx, and the Design Indaba 2013 event period alone saw over 70 000 visits to the website. During this time over 40% of pageviews were event pages – all of which carry sponsor logos and hotlinks to our suppliers, associates and partners.
our online audience is increasingly global, with 60% of visits in the last calendar year being international. outside of South Africa, the majority of visits come from Europe (16%), the uSA (11%), Asia (10%) and the uK (7%).
Design Indaba offers a range of ways to reach our global audience of creative professionals and influential consumers, including targeted banners, editorial promotions and bespoke sponsorship opportunities.

63
neWs
not limiting itself to a narrow definition of design, Design Indaba heralds the broader creative industry and innovation as a whole.
Designindaba.com provides a 24/7/365 offering of creative inspiration and information. our in-house editorial team publishes several daily updates on global creativity, featuring news headlines and in-depth articles on topics such as architecture and interiors, fashion and jewellery, graphic design and illustration, product design, design thinking, art and photography, food design and more. Guest bloggers are also invited to contribute, giving a stage to thought-leaders for sharing their work, opinions and ideas.
our key channels for spreading the word about Design Indaba news are our weekly newsletter, and via our growing social networks on Twitter, facebook and Pinterest.
Tv
Design Indaba TV is a video channel dedicated to global design, creativity and innovation. We interview the world’s creative leaders and local designers, and feature
all the live talks from Design Indaba Conference. We also cover global design events, featuring a mix of the established and the emerging from within the creative sectors.
Design Indaba TV’s key platforms are the designindaba.com website, Vimeo and the official YouTube channel. With each platform catering to a distinct online audience, Design Indaba TV has a rapidly expanding, diverse global audience across these three channels.
aPP
The Design Indaba App is a mobile design resource and event guide. Created to supplement Design Indaba’s event programme, it provides information on speakers, exhibitors and music artists, as well as access to venue maps and ticket sales. users can interact with other delegates online, upload photos with Design Indaba Photoframes, write on our fanwall and share content with key social networks. It also features news and video content updated live from designindaba.com. This mobile app is free for download for ioS and Android. Geared primarily (but not solely) towards Design Indaba event-goers, the app has had over 3 000 downloads to date.

64
lTD
Design Indaba’s lTD Edition launched in early 2012 as an all-new, format-free publication, taking the place of Design Indaba Magazine. It has seen two annual editions to date, the most recent being launched at Design Indaba Conference 2013.
The key premise behind this free-form publication is that each edition is commissioned to a friend of Design Indaba and its format is open to that person’s creative medium of choice.
The first edition is a coffee-table publication on South African design, titled Where It’s At. It was curated and designed by 2011 Conference speaker Richard Hart and his design studio, disturbance.
The second lTD Edition, also created by a Design Indaba Conference speaker, is a mobile app called Petting zoo by Christoph niemann. Created for ioS and Android, the app features 21 hand-drawn animals by the world-renowned illustrator, each of which is fully interactive and behaves differently depending on how the user swipes or taps their device’s screen. Described as a “picture-book
app”, this unique creation has seen worldwide acclaim, with sterling media and user reviews and over 60 000 downloads in less than four months.
The lTD Edition is part of Design Indaba’s commitment to supporting and promoting creative work, and provides a unique outlet for giving back to the design community.

65
eCOnOmiC COnTRibuTiOn
Of The 2013 Design inDaba
Prepared for: Interactive Africa (May 2013)Prepared by: Barry Standish, Graduate School of Business, university of Cape Town
In Association with: Antony Boting, Strategic Economic Solutions
ContactBarry Standish021 790 3282083 457 5252
ContactAntony Boting021 794 9406083 320 8670

66
Introduction Executive SummaryMacroeconomic Contribution of the 2013 Design Indaba Conventions, Exhibitions and Economic Benefits Delegate and Visitor Days overall Macroeconomic Contribution of the Design Indaba
6.1. Contribution to Gross Domestic Product 6.2. Contribution to Western Cape Gross Geographic Product 6.3. Direct and indirect job creation 6.4. other macroeconomic effects
Table Of COnTenTs
lisT Of Tables anD figuRes
Table 1: Macroeconomic Contribution of the 2013 Design IndabaTable 2: Attendance at the 2013 Design Indaba and Associated EventsTable 3: number of Delegate and Visitor DaysTable 4: Contribution to Gross Domestic ProductTable 5: Contribution to Western Cape Gross Geographic Product Table 6: Contribution to Direct Jobs in the ProvinceTable 7: Contribution to Indirect Jobs throughout South AfricaTable 8: Contribution to TaxesTable 9: Contribution to Indirect Household IncomeTable 10: Generation and use of foreign Exchange
figure 1: Congress Delegate Days and Exhibition Visitor Days for 2013figure 2: Delegate and Visitor Days - 2009 to 2013figure 3: Itemised Contribution to South African GDP
Page67687071727677797980
70727377797980808081
747578
1.2.3.4.5.6.

67
1. inTRODuCTiOn
Design Indaba is a truly remarkable event on the South African calendar. It attracts the brightest and most creative talent in the country. Year after year it forces this talent to innovate and improve – exhibitors generally do not display the same wares as the previous year. Then, coming from all over the country and the world are the buyers. from a Western Cape perspective this generates income, creates jobs and sustains livelihoods. from a national perspective Design Indaba showcases the country and contributes significantly to export revenues.
Yet this is not just an exhibition. It is also an enlightening experience for those who attend the coference that is held in conjunction with the exhibition. Here one can be inspired by local and international creative talent. The Design Indaba raises the profile and awareness of the industry, portraying a dynamic image, particularly in light of Cape Town being awarded the Design Capital of 2014.
This is the fifth year that the economic contribution of the Indaba is reported. The report starts with a snapshot of the macroeconomic contribution of the 2013 Design Indaba. This is followed by a general description of the types of economic benefits that are generated by conventions and exhibitions and then a more detailed review of the macroeconomic contribution of Design Indaba is given. This report also compares the economic contribution of the 2013 Indaba with that of the last four years.
68
Design Indaba is a truly remarkable event on the South African calendar. It attracts the brightest and most creative talent in the country. Year after year it forces this talent to innovate and improve – exhibitors generally do not display the same wares as the previous year. Then, coming from all over the country and the world are the buyers. from a Western Cape perspective this generates income, creates jobs and sustains livelihoods. from a national perspective Design Indaba showcases the country and contributes significantly to export revenues.
Yet this is not just an exhibition. It is also an enlightening experience for those who attend the conference that is held in conjunction with the exhibition. Here one can be inspired by local and international creative talent. Design Indaba raises the profile and awareness of the industry, portraying a dynamic image, particularly in light of Cape Town being awarded the Design Capital of 2014.
Starting from humble beginnings in 1995 Design Indaba has grown in size and stature to be the foremost of this type of event in the country. In 2004 there were 40 exhibitors and 8 000 people attended. In 2013 there were 10 events, attracting in excess of 40 000 visitors. This includes 650 design students who attended the simulcast of the conference and 800 scholars who attended the expo (of whom 450 were given free transport and entrance to the exhibition).
Yet the exposure is not limited to just Cape Town. The conference presentations were simulcast to Johannesburg, Durban and Port Elizabeth where some 438 tertiary design students and young advertising, design and marketing professionals were in attendance, ensuring that the broadcasts reach as many people in the industry throughout the country as possible. Design Indaba is committed to broadening its creative scope.
The conference and exhibition business is big business. It brings people in and boosts spending in the host province. It brings people in from other countries, boosts spending in the country and generates foreign exchange. However the business is bigger than that. Where conventions bring in delegates from other countries they showcase the city, province and country. Where the showcasing is successful some of the delegates return as tourists. In turn some of these tourists become regular visitors to our shores. for some conventions and exhibitions the business is even bigger than tourism. Where a convention or exhibition draws business to the country or where exhibitions nurture the growth of local industry – particularly small start up business – the economic benefits are spread far and wide. Design Indaba is an outstanding example of such an initiative.
DelegaTe anD visiTOR Days
Design Indaba contributes in part to the provincial and national economies by attracting local and foreign delegates and visitors to Cape Town. These have increased over the years
until the phenomenal attendance in 2012. unfortunately 2013 has not been able to match 2012 but certainly rivals the earlier years.
In 2009 there were 29 175 visitors, increasing to 35 382 in 2010, 38 051 in 2011 and 50 461 in 2012. In 2013 there were 40 771 visitors. The economic analysis modifies these numbers to take account of the fact that some visitors are scholars, some are multi-day visitors, some spend time in the City and country before and after the event and some have other members in their party who may not attend the event.
It is estimated that, after these adjustments, the 2013 conference and exhibition generated a total of 51 849 delegate and visitor days that make an economic contribution. This is a decrease of 21% over the 65 467 days of 2012 but is only slightly lower than 2010. of these 51 849 delegate and visitor days 24 029 days (46%) were from people from the Western Cape, 19 541 days (38%) by people from elsewhere in South Africa and 8 280 days (16%) from the rest of the world. The exhibition generated about three and a half times as many visitor days as the conference. The greatest proportion of delegates to the 2013 conference was from elsewhere in South Africa (51%), followed closely by the Western Cape (45%). The rest were international delegates (4%).
maCROeCOnOmiC COnTRibuTiOn Of The 2013 Design inDaba
While there are a number of different types of macroeconomic effects, the two most important are contribution to gross domestic product (GDP) and creation of jobs. The importance of job creation is obvious. Increases in GDP are synonymous with increases in peoples’ economic standards of living. Increased GDP – i.e. increased production – is experienced in the form of more jobs, higher wages and reduced economic hardship. It is clearly an important measure.
COnTRibuTiOn TO gROss DOmesTiC PRODuCT
Gross Domestic Product is the total value of all final goods and services produced in the country. It is clearly fundamental to the economic quality of life of people in the country. It is also the most important and all-encompassing measure of the macroeconomic effect of the Indaba. Total contribution to GDP has increased annually from R191.9m in 2009 to R329.8m in 2013. The contribution to GDP in 2013 is made up of:
• Host / Organiser expenditure of R69.5m. This is an increase on the R60.2m in 2012. • Exhibitor expenditure of R11.3m which is up from R9.5m in 2012.• Delegate expenditure of R64.8m. This is a decrease from the R76.2m in 2012. The decrease
is due to a drop in the visitor numbers mainly to the expo rather than a reduction in the average spend per visitor. The organisers feel that there were a number of competing events taking place in Cape Town at the time of the Design Indaba and that this has an impact on
2. eXeCuTive summaRy

69
attendance figures. They are attempting to find ways to address this issue, of which one is to split the timing of the expo and the congress.
• Business orders of R184.2, which is up slightly from the R180.9m in 2012.• GDP is important not just because it is income but also because income has the capacity
to add to wealth.
Based on these estimates the Design Indaba has made a cumulative contribution to GDP in excess of R1.3bn over the last five years.
COnTRibuTiOn TO WesTeRn CaPe gROss geOgRaPhiC PRODuCT
Gross Geographic Product (GGP) is the provincial equivalent of national GDP. naturally while many of the direct effects will be felt within the province there will be indirect effects on other provinces. As delegates spend money in hotels, for example, hotels use materials from all over the country and from other countries. Although the Western Cape can boast about producing the best wine and some of the best food in the country, other products such as paper tissues, toilet soaps and cleaning materials are often brought in from other provinces. Hence the contribution of an event to provincial GGP, in the province that the project is located, can often be much less than its contribution to GDP. After taking account of all multiplier effects it is estimated that the Design Indaba made a total contribution to Western Cape GGP of R105.8m. This is an increase of R4.3m on 2012. once again, at R58.0m, it is the business orders that make the greatest contribution to the economic success of the Indaba. This is followed, at R22.5m, by host expenditure.
Cumulatively, over the last five years the Indaba has added R433.8m to Western Cape GGP.
DiReCT anD inDiReCT jOb CReaTiOn
The Design Indaba helps create and/or sustain both direct and indirect jobs. Direct jobs are those that result from hosting the event. Indirect jobs are those that are due to multiplier effects resulting from the different types of spending. A distinction should also be made between jobs that are created and existing jobs that are sustained. Jobs are sustained when there are at least as many jobs in the current year as the previous year. If there are more jobs than in the previous year then these are newly created jobs.
There were 552 direct jobs associated with the 2013 Indaba. • This is down slightly on the 598 direct jobs of 2012.• The majority of new jobs are the result of business orders and delegate expenditure.
There were 519 indirect jobs associated with the 2012 Indaba. • These indirect jobs are down slightly on the 553 of 2012. • Once again the main contribution is from the business orders.
The 2013 Design Indaba sustained a total of 1 071 full time job equivalents made up of both direct and indirect jobs. This is a decrease of 80 jobs compared to the Indaba of last year.
Business orders created the most direct and indirect jobs over the last three years. for the 2013 Design Indaba, 3.1 direct jobs and 2.3 indirect jobs are created for every R1m of sales. If direct and indirect jobs are combined then a total of 5.4 jobs are created throughout the country as a result of every R1m increase in business orders.
OTheR maCROeCOnOmiC effeCTs
Apart from the key macroeconomic effects presented above, there are many other macroeconomic effects that flow from the Indaba. These include the generation of income tax, company tax and indirect household income as well as the generation of foreign exchange. • Tax generation is expected to total R31.0m by the end of 2013, an increase of R0.5m on 2012.
of this amount, host / organiser expenditure contributes R7.1m (through both direct and indirect means), exhibitors R1.1m, delegate expenditure R5.8m and business orders R17.1m. The cumulative contribution to direct and indirect taxes since 2009 amounts to over R123m.
• Indirect household income is set to grow by R169.5m from the 2013 Design Indaba, compared to the R168.3m of the 2012 event. Households have cumulatively benefited by more than R688m since 2009.
• Design Indaba is a net generator of foreign exchange: - The 2013 Indaba, including the indirect effects and the business orders that are
generated, is expected to have used foreign exchange to the value of R68.5m. - At the same time it is estimated that international delegates brought R8.8m into the
country by attending the events. - In addition it is expected that the 2013 Indaba will generate international business
orders to the value of R60.7m. Total foreign exchange earnings are therefore R69.5m.
- This means that Design Indaba in 2013 was a net generator of R1.0m in foreign exchange.
- The cumulative effect over the last five years is that the Design Indaba brought a net total of R16.4m in foreign exchange into the country.
Although the 2013 macroeconomic performance of Design Indaba in real terms was down on the stellar performance of 2012, Design Indaba still continues to make a major contribution to provincial and national economies and showcase the industry to society.
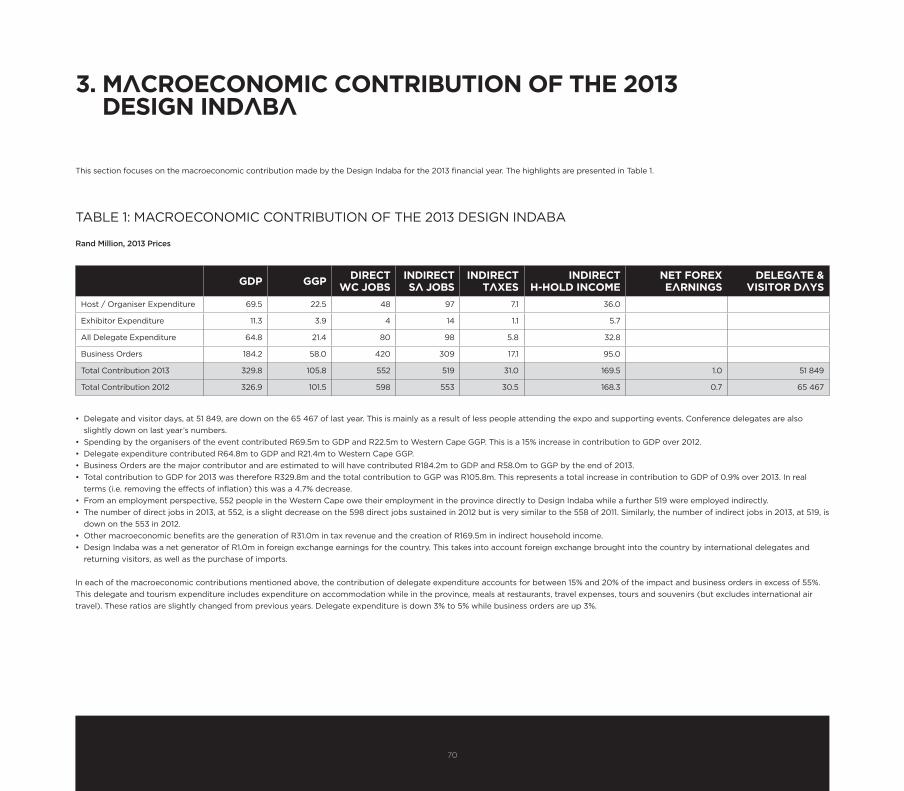
70
3. maCROeCOnOmiC COnTRibuTiOn Of The 2013 Design inDaba
This section focuses on the macroeconomic contribution made by the Design Indaba for the 2013 financial year. The highlights are presented in Table 1.
• Delegate and visitor days, at 51 849, are down on the 65 467 of last year. This is mainly as a result of less people attending the expo and supporting events. Conference delegates are also slightly down on last year’s numbers.
• Spending by the organisers of the event contributed R69.5m to GDP and R22.5m to Western Cape GGP. This is a 15% increase in contribution to GDP over 2012.• Delegate expenditure contributed R64.8m to GDP and R21.4m to Western Cape GGP.• Business Orders are the major contributor and are estimated to will have contributed R184.2m to GDP and R58.0m to GGP by the end of 2013. • Total contribution to GDP for 2013 was therefore R329.8m and the total contribution to GGP was R105.8m. This represents a total increase in contribution to GDP of 0.9% over 2013. In real
terms (i.e. removing the effects of inflation) this was a 4.7% decrease. • From an employment perspective, 552 people in the Western Cape owe their employment in the province directly to Design Indaba while a further 519 were employed indirectly.• The number of direct jobs in 2013, at 552, is a slight decrease on the 598 direct jobs sustained in 2012 but is very similar to the 558 of 2011. Similarly, the number of indirect jobs in 2013, at 519, is
down on the 553 in 2012.• Other macroeconomic benefits are the generation of R31.0m in tax revenue and the creation of R169.5m in indirect household income.• Design Indaba was a net generator of R1.0m in foreign exchange earnings for the country. This takes into account foreign exchange brought into the country by international delegates and
returning visitors, as well as the purchase of imports.
In each of the macroeconomic contributions mentioned above, the contribution of delegate expenditure accounts for between 15% and 20% of the impact and business orders in excess of 55%. This delegate and tourism expenditure includes expenditure on accommodation while in the province, meals at restaurants, travel expenses, tours and souvenirs (but excludes international air travel). These ratios are slightly changed from previous years. Delegate expenditure is down 3% to 5% while business orders are up 3%.
gDP ggP DiReCT WC jObs
inDiReCT sa jObs
inDiReCT TaXes
inDiReCT h-hOlD inCOme
neT fOReX eaRnings
DelegaTe & visiTOR Days
Host / organiser Expenditure 69.5 22.5 48 97 7.1 36.0
Exhibitor Expenditure 11.3 3.9 4 14 1.1 5.7
All Delegate Expenditure 64.8 21.4 80 98 5.8 32.8
Business orders 184.2 58.0 420 309 17.1 95.0
Total Contribution 2013 329.8 105.8 552 519 31.0 169.5 1.0 51 849
Total Contribution 2012 326.9 101.5 598 553 30.5 168.3 0.7 65 467
TABlE 1: MACRoEConoMIC ConTRIBuTIon of THE 2013 DESIGn InDABA
Rand Million, 2013 Prices

71
gDP ggP DiReCT WC jObs
inDiReCT sa jObs
inDiReCT TaXes
inDiReCT h-hOlD inCOme
neT fOReX eaRnings
DelegaTe & visiTOR Days
Host / organiser Expenditure 69.5 22.5 48 97 7.1 36.0
Exhibitor Expenditure 11.3 3.9 4 14 1.1 5.7
All Delegate Expenditure 64.8 21.4 80 98 5.8 32.8
Business orders 184.2 58.0 420 309 17.1 95.0
Total Contribution 2013 329.8 105.8 552 519 31.0 169.5 1.0 51 849
Total Contribution 2012 326.9 101.5 598 553 30.5 168.3 0.7 65 467
4. COnvenTiOns, eXhibiTiOns anD eCOnOmiC benefiTs
There are a number of economic benefits that can be generated by successful conventions and exhibitions.
The first and most obvious is the spending on setting up and running the convention and exhibition. This includes spending by convention and exhibition organisers, exhibitors at the event, delegates attending the conventions and visitors attending the exhibitions. This spending was calculated using costs supplied by the event organisers and from a sample of exhibitors. of the 485 exhibitors a sample of 86 was surveyed, most of whom were willing to give their exhibition costs. This information was supplemented from surveys used to determine overall exhibitor spending patterns that were done for other events at the CTICC.
The second is from the other spending by delegates that is not directly on the convention or exhibition. This includes accommodation, travel, sightseeing, buying meals, souvenirs, etc. Typically this spending is determined through general spending surveys of delegates and these trends have been measured by previous surveys of a range of other conventions hosted at the CTICC. However there are two potential types of delegate spending that are not identified through such surveys.
• The first is that anecdotal evidence suggests that many delegates from other countries on the continent often make large purchases of consumer durables.
• The second is that some international delegates return with their family as tourists in later years. Some of these tourists become regular visitors to South Africa. This has been measured through previous surveys of a range of other conventions hosted at the CTICC.
In the case of Design Indaba the benefits go further. Here we find at least three other economic benefits:
• Business to business benefits. Business to business conventions and exhibitions are a key meeting place for agreement to be reached on a wide range of different types of potential business agreements. These can be orders, cooperation agreements and foreign direct investment, to name a few. In turn the deals can be between business people within the Western Cape, between the Western Cape and other provinces and between South Africa and other countries. Various events supporting both the conference and the expo, such as the various workshops and Dine Around, are specifically designed to promote networking experiences.
• SMME business development. Small business development is a key component of any poverty alleviation policies. SMMEs offer a way out of poverty through economic empowerment that is far more efficient than reliance on hand-outs.
• Promotion of design. Design Indaba promotes the industry and attracts people into associated professions. It is now part of the school Design Curriculum for scholars in Grades 11 and 12 to attend Design Indaba. It is difficult to overstate the importance the contribution Design Indaba makes to developing and inspiring future business professionals in the creative industries.
one of the more difficult challenges faced in this study was to determine the value of orders that were placed during the Indaba and those that will be placed over the course of this year as a result of the 2013 Design Indaba. It is clear from discussions with both the organisers and exhibitors that, while there are some orders placed during the Indaba itself, there are more significant sales later in the year.
This is particularly so in the run up to the end of year festive season. However what the event organisers have also found is that exhibitors are not overly enthusiastic about revealing the value of orders from previous Indabas. As a result while estimates have been made about the value of orders these should be treated as indicative rather than robust.
The starting point in determining the value of orders was to use the survey sent out by Interactive Africa to the exhibitors shortly after the 2013 Design Indaba. In this survey exhibitors were asked whether national and international buyers had been in contact with them and, if so, the value of orders placed. • The results of the exhibitors survey, in which 17.7% of all exhibitors responded, was scaled up
to account for all exhibitors. of this 17.7%, 56 respondents were established exhibitors while 30 were Emerging Creative exhibitors.
• The results of the exhibitor surveys were supplemented by a survey of the buyers. This is the first year in which the buyers were surveyed and 33 of them responded, forming 6.7% of all the buyers. Although this percentage itself is low this information was used to enrich that determined from the exhibitor survey.
• In the surveys respondents reported sales for a six week period after the Indaba. These results were scaled up to represent a full year equivalent. This is justified by the long buying cycles. As mentioned in the above discussion not only do business orders increase in the run-in towards the end of year season but that in some instances orders take place 2 to 3 years after initial contact has been made with the exhibitors.
• The survey made a distinction between national and international buyers. This was used to calculate the value of exports. The survey of exhibitors indicated that 45% of orders received so far were from international buyers (a proportion that was largely the same as last year).
• Finally, sales to the general public are included in these orders. The survey showed the value of sales to the public averaged approximately R390 per visitor. This is slightly higher than the general CTICC surveys of exhibitions of R312 per domestic visitor and R344 per international visitor (for a weighted average of R313 per visitor).
Clearly there is no way of knowing, at this stage, the size of orders that will be placed over the rest of this year. Rather than merely guess at what this could be an estimate has been made based on previous years’ business orders and the value of orders disclosed in surveys that were undertaken at the same time in the buying cycle as this year. The result is that the nominal value of orders from the 2013 Design Indaba is expected to amount to R134m. Although this is only 3% greater in nominal terms than the R130m estimate for last year this is 34% more than the amount estimated for 2011.

72
5. DelegaTe anD visiTOR Days
Design Indaba contributes in part to the provincial and national economies by attracting local and foreign delegates and visitors to Cape Town.
The starting point of the economic analysis is to determine the number of days that these visitors and delegates spend in the region. These numbers are reported in Table 2, Table 3, figure 1 and figure 2. The makeup of visitors to the 2013 Indaba is illustrated in Table 2.
CaTegORy numbeR Days aTTenDanCe aT evenTs numbeR useD in analysis
Ticket sales 16 274 1 16 274 16 274
Kids under 10 250 3 750 0
Guest passes 1 581 1 1 581 1 581
MTDTD Kids 450 1 450 0
li Edelkoort (Cape Town) 220 1 220 220
Wesgro breakfast 10 1 10 20
Pecha Kucha presenters & entertainment 34 1 34 35
Media 350 4 1 400 350
VIP Buyers 486 4 1 944 486
Exhibitor and additional accreditation 892 4 3 568 0
Additional accreditation 105 1 105 105
Staff badges (Incl. Suppliers) 56 4 224 56
Emerging Creatives accreditation 68 4 272 68
fashion accreditation 184 4 736 184
Conference (Thursday) 1 691 3 5 073 1 691
Young Designers Simulcast (CT) 650 3 1 950 650
Young Designers Simulcast (Jhb) 287 3 861 0
Young Designers Simulcast (Dbn) 91 3 273 0
Young Designers Simulcast (PE) 60 3 180 0
Design Indabar (3 Day Event) 401 3 1 203 0
film festival (Incl. workshop & opening) 1 066 15 1 066 1 066
Design Indaba Music Circuit 2 127 1 2 127 2 127
Design Educators workshop 60 1 60 0
Emerging Creatives workshop 40 1 40 0
Design Indaba Dine-Around 300 1 300 340
Blue Train 70 1 70 0
Total attendance 40 771 25 253
TABlE 2: ATTEnDAnCE AT THE 2013 DESIGn InDABA AnD ASSoCIATED EVEnTS

73
finanCial yeaR 2009 2010 2011 2012 2013
Delegates and Visitors
Western Cape 17 286 19 934 21 008 27 681 20 626
Rest of South Africa 2 828 3 178 3 440 4 140 3 397
International 1 044 1 223 1 287 1 510 1 179
Total Delegates and Visitors 21 158 24 335 25 735 33 331 25 202
Conference Delegate Days
Western Cape 4 863 4 711 4 211 4 407 4 456
Rest of South Africa 5 528 5 729 6 456 7 397 6 868
International 717 882 834 796 658
Total Delegate Days 11 108 11 322 11 502 12 600 11 982
Exhibitions and Other Events Visitor Days
Western Cape 16 160 18 844 20 034 26 639 19 573
Rest of South Africa 11 334 13 216 14 051 16 417 12 672
International 7 324 8 541 9 080 9 811 7 622
Total Visitor Days 34 819 40 601 43 165 52 867 39 867
Total Delegate and Visitor Days
Western Cape 21 024 23 555 24 244 31 046 24 029
Rest of South Africa 16 862 18 945 20 507 23 814 19 541
International 8 041 9 422 9 914 10 607 8 280
Total 45 926 51 923 54 666 65 467 51 849
TABlE 3: nuMBER of DElEGATE AnD VISIToR DAYS
The economic analysis has not used visitor numbers because this would have overestimated the economic impact. The last column in Table 2 indicates how the actual attendance at the event is modified to reflect the days used in the economic analysis. The important changes are: • The Making the Difference Through Design scholars are given free transport and entrance to the
event. It is highly unlikely that they would have spending patterns similar to other visitors. As a result these numbers are excluded from the economic contribution. Similarly, children under 10 are excluded from the analysis.
• The Exhibitor accreditation numbers are reduced to exclude two exhibitors for each exhibition because this is captured elsewhere in the analysis.
• For the Media, Buyers, additional accreditation, Emerging Creatives accreditation and Fashion accreditation the actual numbers are used and not the number multiplied by the days. In calculating their economic impact the duration of their stay is taken into account in the analysis.
• The average number of people attending the three-day conference has been used and not the total for the three days (because it is largely the same people attending all three days).
• The people attending Design Indaba would also be attending some of the other events such as Design Indabar, the Emerging Creatives workshop and the Blue Train and have therefore been excluded from the analysis. Including them would result in double counting.
• Those attending the Film Festival, the Music Circuit and the Design Indaba Dine-Around are included as additional visitors in the analysis.
In addition the economic impact must also take into account the fact that visitors also spend time in the city (or country) before and after the event and some visitors have other members in their party who come to Cape Town but do not necessarily attend the Indaba. The numbers that have been used in this regard are taken from regular surveys done by the CTICC over a range of conventions and exhibitions.
The number of delegate and visitor days used in the economic analysis is given in Table 3. These are calculated after taking into account the adjustments in Table 2 and the additional members of the party as well as the extra days spent in the city. It is estimated that the conference, exhibition and other events generated a total of 51 849 delegate and visitor days for the 2013 Indaba. This is a drop of 21% over the 65 467 days of 2012. However, 2012 was a phenomenal year in terms of attendance, particularly on the back of Cape Town being appointed the 2014 Design Capital of the World. The total delegate and visitor days of 51 849 in 2013 is only slightly lower than 2011, the same as 2010 and up on 2009.
of the total delegate and visitor days 24 029 days (46%) were by people from the Western Cape, 19 541 days (38%) by people from elsewhere in South Africa and 8 280 days (16%) were from international visitors. These proportions, as well as the comparison between the conference and the exhibition, are illustrated in figure 1.
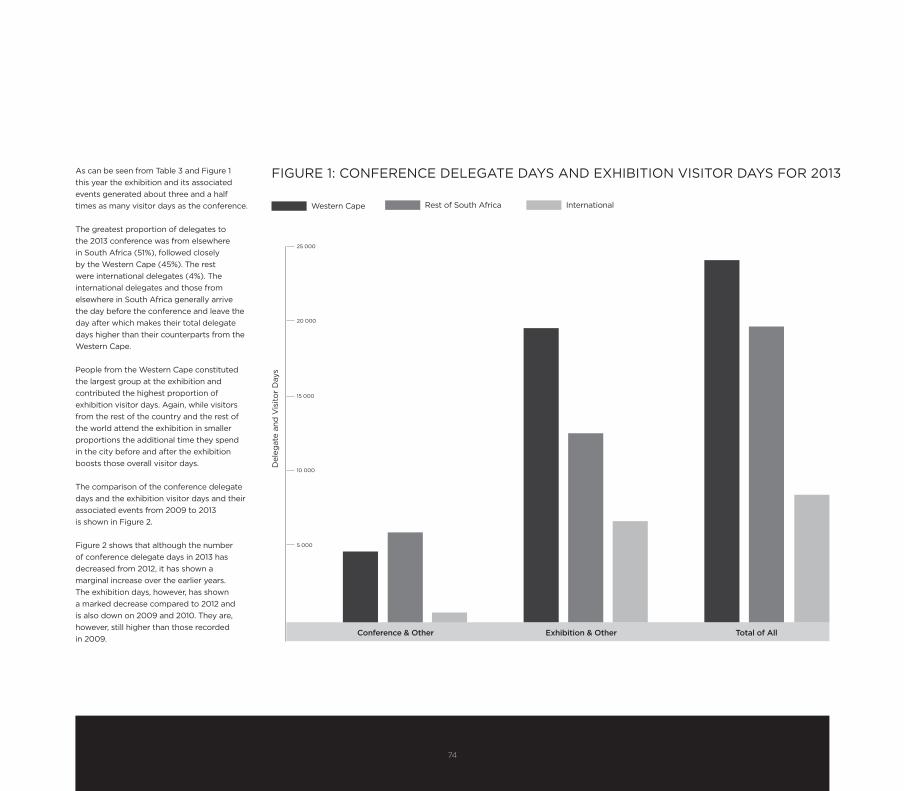
74
As can be seen from Table 3 and figure 1 this year the exhibition and its associated events generated about three and a half times as many visitor days as the conference.
The greatest proportion of delegates to the 2013 conference was from elsewhere in South Africa (51%), followed closely by the Western Cape (45%). The rest were international delegates (4%). The international delegates and those from elsewhere in South Africa generally arrive the day before the conference and leave the day after which makes their total delegate days higher than their counterparts from the Western Cape.
People from the Western Cape constituted the largest group at the exhibition and contributed the highest proportion of exhibition visitor days. Again, while visitors from the rest of the country and the rest of the world attend the exhibition in smaller proportions the additional time they spend in the city before and after the exhibition boosts those overall visitor days.
The comparison of the conference delegate days and the exhibition visitor days and their associated events from 2009 to 2013 is shown in figure 2.
figure 2 shows that although the number of conference delegate days in 2013 has decreased from 2012, it has shown a marginal increase over the earlier years. The exhibition days, however, has shown a marked decrease compared to 2012 and is also down on 2009 and 2010. They are, however, still higher than those recorded in 2009.
fIGuRE 1: ConfEREnCE DElEGATE DAYS AnD ExHIBITIon VISIToR DAYS foR 2013
5 000
10 000
15 000
20 000
25 000
Del
egat
e an
d V
isito
r D
ays
Western Cape Rest of South Africa International
Conference & Other Exhibition & Other Total of All

75
fIGuRE 2: DElEGATE AnD VISIToR DAYS - 2009 To 2013
60 000
50 000
40 000
30 000
20 000
10 000
Del
egat
e an
d V
isito
r D
ays
Conference Exhibition
2009 2010 2011 2012 2013 2009 2010 2011 2012 2013

76
6. OveRall maCROeCOnOmiC COnTRibuTiOn Of The Design inDaba
The size of a national or regional economy is measured in terms of the total of all economic activities taking place within the area concerned, both in the public and private sectors. for countries like South Africa, this necessarily includes measures of informal sector activity as well. The name given to the measure of the size of the economy is Gross Domestic Product (GDP) for the country as a whole or Gross Geographic Product (GGP) for a province or other sub division of the nation.
While there are a number of different types of macroeconomic effects, the two most important are contribution to Gross Domestic Product (GDP) and creation of jobs. The importance of job creation is obvious. Increases in GDP are synonymous with increases in peoples’ economic standard of living. Increased GDP – i.e. increased production – is experienced in the form of more jobs, higher wages and reduced economic hardship. It is clearly an important measure.
The effects of any project on the size of the GDP arise as a result of the myriad ways in which businesses, public service providers and ordinary people find their normal daily activities affected, hopefully for the better, by the changes brought about by the new infrastructure.
The actual task of calculating the macroeconomic impact of the Indaba demands a detailed and multifaceted approach not least because of the so-called multiplier effects. It is well recognised that the simple act of spending – hosting an exhibition, for example, - leads to other economic effects. Demand for building supplies to construct exhibition stands can lead to increased production in those industries. Increased demand for steel and wood, in turn, leads to increased demand for mining output which uses wood, water, electricity and so on. These are the so-called multiplier effects. While this process unfolds, each industry employs people and pays wages. Employees, in turn, spend their wages and cause further multiplier effects through the economy. Measuring this is further complicated by the fact that different industries demand different types of skills. This leads to different wage structures across the various industries. People earning different wages have different spending patterns. Thus, the change in overall spending patterns is dependent on which industries are affected.
Input-output analysis was used for the measurement of the macroeconomic impact of Design Indaba. This approach demands that all expenditure in and around the event be identified and estimated. This expenditure, in turn, needs to be linked to the Standard Industrial Classification of all Economic Activity (SIC codes). In addition, if employment
is part of the expenditure then estimates must be made of the likely items of expenditure as a result of wage payments. Allowances must also be made for the fact that workers at different income levels have different spending patterns.
The eXPenDiTuRe aReas ThaT WeRe iDenTifieD aRe:
• Spending by Interactive Africa, the organisers of the 2013 Design Indaba. This includes the travel costs of the speakers at the conference and what is termed “in-kind” costs. In-kind costs are budget-relieving costs to the organisers that are received on a value exchange basis;
• Spending by exhibitors at the Indaba, as well as travel costs and accommodation expenditure from those who do not live in Cape Town;
• Spending by convention delegates and exhibition visitors on hotels, travel, gifts, etc.;• The impact of business orders from buyers who attended the Indaba. These orders
exclude purchases by members of the public.
five sTePs aRe ReQuiReD TO measuRe The OveRall eCOnOmiC imPaCT Of
The inDaba.
• First, to identify appropriate costs. These costs are based on surveys of events staged at the CTICC as well as information supplied by the hosts.
• Second, to determine the relative proportions of profit, labour, plant and material for each cost line item.
• Third, to assign each item of material and plant to the appropriate SIC code.• Fourth, to decompose labour and profit into income categories and apportion the total
wages and profits to each income category. following this, estimates of expenditure patterns by income category are used to determine total spending patterns.
• Finally, all the SIC coded items are brought together. The total multiplier effect is calculated as the aggregate product SIC coded spending on plant and material, as well as SIC coded spending by workers multiplied through the national multipliers. The national multipliers are known through the South African input output tables.
As a result the macroeconomic estimates that are made in this report relate directly to the actual cost of hosting Design Indaba conference and exhibition, as well as the spending by delegates and visitors to the events and the business orders placed by buyers attending the exhibition. Included in the macroeconomic calculations are all the backward economic linkages for the event and the forward economic linkages where workers spend their salaries. not included in the economic analysis are those costs that are incurred by Interactive Africa, the organisers of Design Indaba, throughout the year while indirectly promoting the events. Such costs would include their website development, the sponsoring of community projects, the salaries and wages of their staff and other

77
office running expenses. These projects and costs all help to raise the awareness of not only Design Indaba but also the design industry.
Direct jobs are calculated with the use of a Social Accounting Matrix (SAM) for South Africa. from the SAM both the average salary that is paid in any one sector and the proportion of salaries to overall turnover in that sector are known. Direct jobs can then be calculated based on the spending that occurs in each economic sector because of the Indaba.Indirect jobs are determined following a similar process described above but making use of input-output multipliers. The estimation of indirect jobs is, however, a contentious issue. The estimates are based on the official South African input-output tables which show quite generous estimates for indirect jobs. In the light of the historic ‘jobless’ economic growth that this country has had indirect job estimates have been downplayed. for want of any better estimate only a quarter of the impact from the official input-output tables is used.
6.1 COnTRibuTiOn TO gROss DOmesTiC PRODuCT
Gross Domestic Product is the total value of all final goods and services produced in the country. It is clearly fundamental to the economic quality of life of people in the country. It is also the most important and all-encompassing measure of the macroeconomic effect of the Indaba.
Table 4 and figure 3 report on the contribution to GDP. Total contribution to GDP has increased each year from R191.9m in 2009 to R329.8m in 2013.
The COnTRibuTiOn TO gDP in 2013 is maDe uP Of:
• Host / Organiser expenditure of R69.5m. This is an increase on the R60.2m in 2012. • Exhibitor expenditure of R11.3m which is up from R9.5m in 2011.• Delegate expenditure of R64.8m. This is a decrease from the R76.2m in 2012. The decrease
is due to a drop in the visitor numbers mainly to the Expo rather than a reduction in the average spend per visitor. The organisers feel that there are a number of competing events taking place in Cape Town at the time of Design Indaba and that this has an impact on attendance figures.
• Business orders of R184.2m, which is up slightly from the R180.9m in 2012.• GDP is important not just because it is income but also because income has the capacity
to add to wealth. Based on these estimates Design Indaba has made a cumulative contribution to GDP in excess of R1.3bn over the last five years.
• Also shown in Table 4 is the contribution to GDP of the 2013 Design Indaba expressed in 2009 values. This shows that although there has been a 0.9% increase in nominal GDP over 2012 in real terms (i.e. the effect of inflation is removed) there is a reduction of 4.7% compared to last year’s event.
finanCial yeaR 2009 2010 2011 2012 2013
Host / organiser Expenditure 28.1 45.2 51.3 60.2 69.5
Exhibitor Expenditure 5.1 9.1 9.3 9.5 11.3
Delegate Expenditure 45.5 54.7 59.6 76.2 64.8
Business orders 113.1 123.0 141.3 180.9 184.2
Total Contribution 191.9 232.0 261.5 326.9 329.8
Cumulative Contribution 191.9 423.8 685.3 1 012.2 1 342.0
Real GDP (2009 Values) 191.9 218.8 238.5 283.9 270.7
TABlE 4: ConTRIBuTIon To THE GDP
Gross Domestic Product – South Africa (Rand Million, Nominal Prices)
The relative contribution of each of the expenditure items to GDP in nominal terms and their comparison over the five years is illustrated in figure 3. for Host / organiser Expenditure, Exhibitor Expenditure and Business orders the general trend has been an increasing one and even though the Business orders are only up marginally on the 2012 values they still show a substantial increase over the 2009 to 2011 values. The only item that has shown a decrease is the delegate expenditure and even then it has only reduced in nominal terms relative to the 2012 value.

78
20
40
60
80
100
120
140
160
180
200
Co
ntri
but
ion
to t
he G
DP
(R
Mill
ions
)
Host Organiser Expenditure Exhibitor Expenditure Delegate Expenditure Business Orders
fIGuRE 3: ITEMISED ConTRIBuTIon To SouTH AfRICAn GDP
2009 2010 2011 2012 2013

79
6.2 COnTRibuTiOn TO WesTeRn CaPe gROss geOgRaPhiC PRODuCT
Gross Geographic Product (GGP) is the provincial equivalent of national GDP. naturally while many of the direct effects will be felt within the province there will be indirect effects on other provinces. As delegates spend money in hotels, for example, hotels use materials from all over the country and from other countries. Although the Western Cape can boast about producing the best wine and some of the best food in the country, other products such as paper tissues, toilet soaps and cleaning materials are often brought in from other provinces. Hence the contribution of an event to provincial GGP, in the province that the project is located, can often be much less than its contribution to GDP. The contribution of Design Indaba to provincial GGP is reported in Table 5 below.
After taking account of all multiplier effects it is estimated that Design Indaba made a total contribution to Western Cape GGP of R105.8m. This is an increase of R4.3m on 2012. once again, at R58.0m, it is the business orders that make the greatest contribution to the economic success of the Indaba. This is followed, at R22.5m, by the host expenditure.
TABlE 5: ConTRIBuTIon To WESTERn CAPE GRoSS GEoGRAPHIC PRoDuCT
6.3 DiReCT anD inDiReCT jOb CReaTiOn
Design Indaba helps create and/or sustain various types of jobs. of these the first distinction that should be made is between direct and indirect jobs.
• Direct jobs are those that result from hosting the event. • Indirect jobs are those that are due to multiplier effects resulting from the different types
of spending.
additionally a distinction should be made between jobs that are created and existing jobs that are sustained. In this report jobs are considered to have been sustained when there are at least as many jobs in the current year compared to the previous year. If there are more jobs than in the previous year the incremental jobs are regarded as jobs that have been created.
Jobs include people employed directly by Interactive Africa, the event organisers. The numbers that are presented in Table 6 are full-year job equivalents. Indirect jobs are presented in Table 7 and are also full-year job equivalents.
TABlE 6: ConTRIBuTIon DIRECT JoBS In THE WESTERn CAPE
finanCial yeaR 2009 2010 2011 2012 2013
Host / organiser Expenditure 9.1 14.7 16.7 19.6 22.5
Exhibitor Expenditure 1.8 3.1 3.2 3.3 3.9
Delegate Expenditure 15.2 18.3 19.9 25.2 21.4
Business orders 37.3 40.6 46.6 53.5 58.0
Total Contribution 63.4 76.7 86.4 101.5 105.8
Cumulative Contribution 63.4 140.1 226.5 328.0 433.8
finanCial yeaR 2009 2010 2011 2012 2013
Host / organiser Expenditure 23 36 39 44 48
Exhibitor Expenditure 4 4 4 4 4
Delegate Expenditure 70 79 83 100 80
Business orders 378 388 431 449 420
Total Direct Jobs 474 507 558 598 552
Gross Geographic Product – Western Cape (Rand Million, Nominal Prices)
Provincial Direct Jobs – Western Cape
Cumulatively, over the last five years the Indaba has added R433.8m to Western Cape GGP.
The number of direct jobs in the province is presented in Table 6. It can be seen from the table that there are 552 direct jobs associated with the Indaba. These jobs would all have been sustained from the previous year but are down by 46 on the 2012 jobs.
Table 7 indicates that there are at least 519 indirect jobs resulting from the Indaba.

80
TABlE 7: ConTRIBuTIon To InDIRECT JoBS THRouGHouT SouTH AfRICA
TABlE 8: ConTRIBuTIon To TAxES – SouTH AfRICA
TABlE 9: ConTRIBuTIon To InDIRECT HouSEHolD InCoME
finanCial yeaR 2009 2010 2011 2012 2013
Host / organiser Expenditure 48 72 79 89 97
Exhibitor Expenditure 8 13 13 13 14
Delegate Expenditure 85 97 102 122 98
Business orders 261 267 297 329 309
Total Indirect Jobs 401 450 491 553 519
finanCial yeaR 2009 2010 2011 2012 2013
Host / organiser Expenditure 2.8 4.6 5.2 6.1 7.1
Exhibitor Expenditure 0.5 0.9 0.9 0.9 1.1
Delegate Expenditure 4.0 4.9 5.3 6.8 5.8
Business orders 9.8 10.7 12.3 16.7 17.1
Total Contriburion 17.2 21.0 23.7 30.5 31.0
Cumulative Contribution 17.2 38.2 61.9 92.5 123.5
finanCial yeaR 2009 2010 2011 2012 2013
Host / organiser Expenditure 14.4 23.2 26.4 31.0 36.0
Exhibitor Expenditure 2.6 4.6 4.7 4.8 5.7
Delegate Expenditure 23.1 27.7 30.2 38.6 32.8
Business orders 58.0 63.0 72.4 94.0 95.0
Total Contriburion 98.1 118.6 133.7 168.3 169.5
Cumulative Contribution 98.1 216.6 350.4 518.7 688.2
Contribution to National Indirect Jobs – South Africa Contribution to Taxes – South Africa (Rand Million, Nominal Prices)
Indirect Household Income – South Africa (Rand Million, Nominal Prices)
The 2013 Design Indaba sustained a total of 1 071 full time job equivalents made up of both direct and indirect jobs.
The business orders have created the most direct and indirect jobs over the last five years. for the 2013 Design Indaba, 3.1 direct jobs and 2.3 indirect jobs are created for every R1m of sales. If direct and indirect jobs are combined then a total of 5.4 jobs are created throughout the country as a result of every R1m increase in business orders. It will be appreciated that these jobs are an average for all the industries that exhibit at Design Indaba and that there will be variation between those industries (such as the jewellery, clothes or textile industries). furthermore, these job indices per R1m of orders are only correct for 2013 because they vary each year as salaries and wages change.
6.4 OTheR maCROeCOnOmiC effeCTs
Apart from the key macroeconomic effects discussed above, there are many other macroeconomic effects that flow from the Indaba. These include the generation of income tax, company tax and indirect household income as well as the generation of foreign exchange.
Table 8 reports on total income tax that was generated, while Table 9 does the same for the indirect generation of household income. Table 10 reports on the generation and use of foreign exchange.
Tax generation is expected to total R31.0, an increase of R0.5m on 2012. of this amount, host / organiser expenditure contributes R7.1m (through both direct and indirect means), exhibitors R1.1m, delegate expenditure R5.8m and business orders R17.1m. The cumulative contribution to direct and indirect taxes since 2009 amounts to over R123m.

81
TABlE 10: GEnERATIon AnD uSE of foREIGn ExCHAnGE
Foreign Exchange Earnings – South Africa (Rand Million, Nominal Prices)
Indirect household income, shown in Table 9, is set to benefit by R169.5m from the 2013 Design Indaba, compared to the R168.3m of the 2012 event. Households have cumulatively benefited by more than R688m since 2009.
International delegates and visitors to the events and overseas purchases bring a significant amount of foreign exchange into the country. It will also be appreciated that the hosting of the event and production of goods sold at the Indaba also have import components. Delegates consume some imported food and are moved around in buses running on imported fuels (and so on).
Table 10 reports on the generation and use of foreign exchange. The foreign exchange use includes the indirect import effects as well. for example, if an international buyer orders jewellery from an exhibitor then some materials used in the manufacture of that jewellery may have been imported. These indirect effects are captured in the analysis. In addition foreign exchange usage also includes imports that result from increases in income through the multiplier effect. for example an order that is placed with a fabric design company might result in increased employment in that company. The new employees might then purchase imported clothing or shoes. These are imports resulting from the multiplier effects and are included in foreign exchange usage.
The staging of the 2013 Design Indaba, including the indirect effects and the business orders that are generated, is expected to have used foreign exchange to the value of R68.5m. At the same time, though, it is estimated that international delegates brought R8.8m into the country just by attending the events. Based on the discussion in Section 3 it is expected that the 2013 Indaba will generate international business orders to the value of R60.7m. Total foreign exchange earnings are therefore R69.5m.
This means that Design Indaba in 2013 was a net generator of about R1.0m in foreign exchange. This is up slightly on the estimated R0.7m net generation of foreign exchange in 2012 but down on the estimated R3.8m of 2011. The cumulative effect over the last five years is that Design Indaba brought a net total of R16.4m in foreign exchange into the country.
finanCial yeaR 2009 2010 2011 2012 2013
Foreign Exchange Earnings
International Delegate Spend 8.3 10.4 10.6 10.5 8.8
Business orders 40.0 34.8 43.7 56.9 60.7
Total forex Earnings 48.3 45.2 54.3 67.4 69.5
Foreign Exchange Use
Host / organiser Expenditure 4.6 7.3 8.3 9.7 11.3
Exhibitor Expenditure 0.8 1.4 1.4 1.5 1.7
All Delegates Expenditure 7.5 9.0 9.8 12.5 10.6
Business orders 24.9 27.1 31.1 43.0 44.9
Total Imports 37.7 44.8 50.6 66.7 68.5
net forex Earnings 10.6 0.4 3.8 0.7 1.0
Cumulative Contribution 10.6 11.0 14.8 15.4 16.4
