a bio-economic model for the ecosystem-based management of the
TRANSCRIPT

GRETHA UMR CNRS 5113
Univers ité Montesquieu Bordeaux IV Avenue Léon Duguit - 33608 PESSAC - FRANCE
Tel : +33 (0)5.56.84.25.75 - Fax : +33 (0)5.56.84.86.47 - www.gretha.fr
A bio-economic model for the ecosystem-based management
of the coastal fishery in French Guiana
Abdoul CISSE
IFREMER-Guyane et CEREGMIA, UAG
Sophie GOURGUET
IFREMER, UMR AMURE et CNRS-CERSP-MNHN
Luc DOYEN
CNRS-CERSP-MNHN
Fabian BLANCHARD
IFREMER-Guyane
Jean-Christophe PEREAU
GREThA, CNRS, UMR 5113, Université de Bordeaux
Cahiers du GREThA
n° 2011-38

Cahiers du GREThA 2011 – 38
GRETHA UMR CNRS 5113
Univers i té Montesquieu Bordeaux IV Avenue Léon Dugui t - 33608 PESSAC - FRANCE
Te l : +33 (0 )5 .56 .84.25 .75 - Fax : +33 (0 )5 .56 .84.86 .47 - www.gretha.f r
Un modèle bio-économique de gestion écosystèmique de la pêche côtière en Guyane
Française
Résumé
Cet article propose une modélisation théorique de gestion éco-systémique appliquée à la
pêche côtière en Guyane Française. Un modèle multi-espèces, multi-flottilles intégrant une
dynamique de type Lokta-Volterra est développé. Cette pêcherie artisanale, caractérisée par
un haut niveau de biodiversité halieutique, des flottilles non sélectives, doit aujourd’hui
répondre à une hausse de la demande locale due à la croissance démographique. Le modèle
est calibré sur 13 espèces et 4 flottilles à partir de données mensuelles d’effort et de
prélèvement entre 2006 et 2009. Plusieurs types de scénarios de prélèvement sont envisagés
allant du status quo, à la fermeture, à des stratégies économiques ou de viabilité. Dans
chaque cas, les performances en termes de préservation de la biodiversité marine et les
performances socio-économiques sont analysées et comparées. Nos résultats montrent que
la demande croissante et la profitabilité des flottilles sont soutenables mais qu’une perte
significative de biodiversité ne peut pas être évitée.
Mots-clés : pêche artisanale, biodiversité, soutenabilité, profitabilité, sécurité alimentaire,
multi-espèces, multi-flottilles
A bio-economic model for the ecosystem-based management of the coastal fishery in
French Guiana
Abstract
This paper offers a theoretical and empirical modeling for ecosystem-based fishery
management (EBFM). A multi-species and multi-fleets model integrating Lokta-Volterra
trophic dynamics and profit functions is developed for the coastal fishery of French Guiana.
This small-case fishery constitutes a challenging example with high fish biodiversity, several
non selective fleets and a potentially increasing local food demand due to demographic
pressure. The dynamic model is calibrated with thirteen species and four fleets using catch
and effort data on a monthly basis from 2006 to 2009. Several contrasting fishing scenarios
including status quo, total closure, economic and viable strategies are simulated and
compared from both biodiversity preservation and socio-economic performance viewpoints.
We show that fishing outputs including food supply and profitability of fleets can be
sustained although a significant loss of biodiversity cannot be avoided.
Keywords: Small-scale fishery, biodiversity, sustainability, profitability, food security, multi-
species, multi-fleets
JEL: Q22, Q56
Reference to this paper:, CISSE Abdoul, GOURGUET Sophie, DOYEN Luc, BLANCHARD Fabian, PEREAU
Jean-Christophe (2011) A bio-economic model for the ecosystem-based management of the coastal
fishery in French Guiana, Cahiers du GREThA, n°2011-38.
http://ideas.repec.org/p/grt/wpegrt/2011-38.html.
1. Introduction
Marine fishery resources are under extreme pressure worldwide. According to recent
studies (FAO, 2004; Garcia and Grainger, 2005), three quarters of fish stocks are maxi-
mally exploited or over-exploited. Moreover, the proportion of marine fish stocks which
are intensively exploited is growing. Hence sustainability is nowadays a major concern of
international agreements and guidelines to fisheries management (FAO, 1999; ICES, 2004).
Standard approaches for the sustainable management of fisheries such as MSY (Maximum
Sustainable Yield), MEY (Maximum Economic Yield) or ICES (International council for the
Exploration of the Sea) precautionary approaches usually address every exploited species
separately (Grafton et al., 2007). These kinds of management are apparently not effec-
tive enough to avoid loss of biodiversity, over-exploitation and overcapacity worldwide (Hall
and Mainprize, 2004). The Ecosystem Approach for Fisheries (EAF) or Ecosystem-Based
Fisheries Management (EBFM) advocate an integrated management of marine resources to
promote sustainability (FAO, 2003). Such a management requires first to account for the
complexity of ecological mechanisms that encompass community dynamics, trophic webs,
geographical processes and environmental uncertainties (habitat, climate). Furthermore,
by putting emphasis on sustainability, it strives to balance ecological, economic and social
objectives for present and future generations and to cope with a large range of goods and
services provided by marine ecosystems (Jennings, 2005) including both monetary and non
monetary values.
Finding a way to implement the EBFM approach effectively and practically remains un-
clear and challenging. Regarding such a difficult goal, models, indicators, reference points
and adaptive management strategies are essential in implementing the approach. Plaganyi
(2007) provides an overview of the main types of modeling approaches and analyses their rel-
ative merits for fisheries assessment in an ecosystem context. Modeling approaches and met-
rics useful for planning, implementing, and evaluating EBFM are also discussed in Marasco
et al. (2007), with particular emphasis on management strategy evaluation. For ecosystem
indicators, a recent review is proposed by Cury and Christensen (2005) - see also Rice (2000).
2

In particular, Link (2005) emphasizes the need for a multi-criteria approach to achieve eco-
logical, economic and social objectives.
This article deals with the sustainable management of a multi-species and multi-fleets
fishery in an ecosystem based perspective. It especially focuses on the small scale fishery of
French Guiana. This case study is challenging with respect to the EBFM approach because
of the complexities underlying the ecosystem with a high fish biodiversity (tropical area)
together with several non selective fleets impacting such biodiversity and a human local
demographic pressure potentially affecting the demand and consequently the production
of this fishery. Moreover it is acknowledged that small-scale fisheries are poorly managed
because there is a lack of tools adapted to this complexity, while these fisheries are crucial
to sustain many communities especially in developing countries (Garcia, 2008).
2. Case study
The continental shelf of French Guiana is a tropical ecosystem under the influence of the
Amazon estuary, as the whole North Brazil Shelf Large Marine Ecosystem (LME) that con-
tains a high biodiversity (Leopold, 2004). With 350 km of coastline, French Guiana benefits
from an 130,000 km2 exclusive economic zone (EEZ) including 50,000 km2 of continental
shelf. The coastal fishery operates to 10 miles offshore between 0 and 20 m depths. Sev-
eral landing points are spread along the coastline and this fishery currently concerns about
200 wooden boats. Bellail and Dintheer (1992) identified four kinds of vessel : “pirogues”
(P), “canots creoles” (CC), “canots creoles ameliores” (CCA) and “tapouilles” (T). The
“pirogues” are canoes with out-board engine, fishing for periods of a few hours essentially
in estuaries and using ice stored in an old fridge. The “canots creoles” are vessels more
adapted to sea navigation as compared to “pirogues”. The “canots creoles ameliores” have
cabins and ice tanks allowing several fishing days. The “tapouilles” are wider boats with
cabin desk and in-board gazole engine. The gears used are drifting or fixed nets, mesh sizes
between 40 and 100 mm. It is to note that the length of gill nets, the number of days
spent at sea and the area of fishing activities have an influence on the pressure imposed over
3

the resources, so the quantity of landed fishes differs from a type of fleet to another. On
the numerous coastal species, 30 are exploited and about 15 species, including weakfishes,
catfishes and sharks, represent more than 90% of the production. The annual landings are
estimated around 2,700 tonnes for last years as detailed in the Ifremer1 Information System
(http://www.ifremer.fr/sih). The coastal fishery has a great importance for the socio-
economic context of all the small cities along the coastline where more than 90% of the
population is located. However, the first comprehensive assessment of this fishery really be-
gan in 2006 with daily surveys in each landing point to get the fishing effort and production
data associated. Economic assessment started in 2009 with a survey on production costs
and selling prices carried out on the field.
Coastal fishery in French Guiana remains broadly informal despite 1) the foundation of
the cooperative of the fishers of French Guiana (Codepeg) in 1982, 2) the installation of
a system of professional licenses in territorial waters by the regional committee of fisheries
in 1995, 3) the progressive application of national and European regulations (role of crew,
security visits of ships, etc.). There is no quota for catches, and no limitation concerning
exploited species and their size. This coastal fishery provides an interesting case study
from the perspective of ecosystem management. Since the biodiversity associated with this
resource does not seem threatened and the economic activity of this fishery appears stable,
the current state is usually postulated as safe. Nevertheless, the sustainability of the fishery
can be questioned mainly because of the local fish demand. Indeed, demographic projections
suggest a 100% increase of the local population over 30 years. Consequently, the demand for
local fish could increase as the fishing pressure. Therefore arises the question whether both
the marine ecosystem and the fishing sector can cope with such changes in fishing demand
and food security.
To deal with such issues, this paper proposes a theoretical and empirical modeling, related
to an ecosystem-based fishery management (EBFM). A multi-species and multi-fleets model
1French Research Institute for Exploration of the Sea.
4
integrating Lokta-Volterra trophic dynamics and profit functions is used. The dynamic
model is calibrated on a monthly basis with thirteen species and four fleets (“P”, “CC”,
“CCA”, “T”) through catch and effort data from 2006 to 2009 derived from the Ifremer
fishery information system. The ecological and economic performances of contrasting fishing
scenarios including “status quo”, “total closure”, “economic” and “viable” strategies are
examined. The paper is structured as follows. Section 3 is devoted to the description of the
ecosystem-based model, bio-economic indicators and scenarios. Section 4 provides the results
related to the fishing scenarios with respect to biodiversity and socio-economic indicators.
Results are discussed in terms of sustainability, EBFM and management tool in section 5.
The last section concludes.
3. Methods
The numerical implementations of the model are realized with the scientific software
SCILAB 5.2.2 2.
3.1. The ecosystem-based model
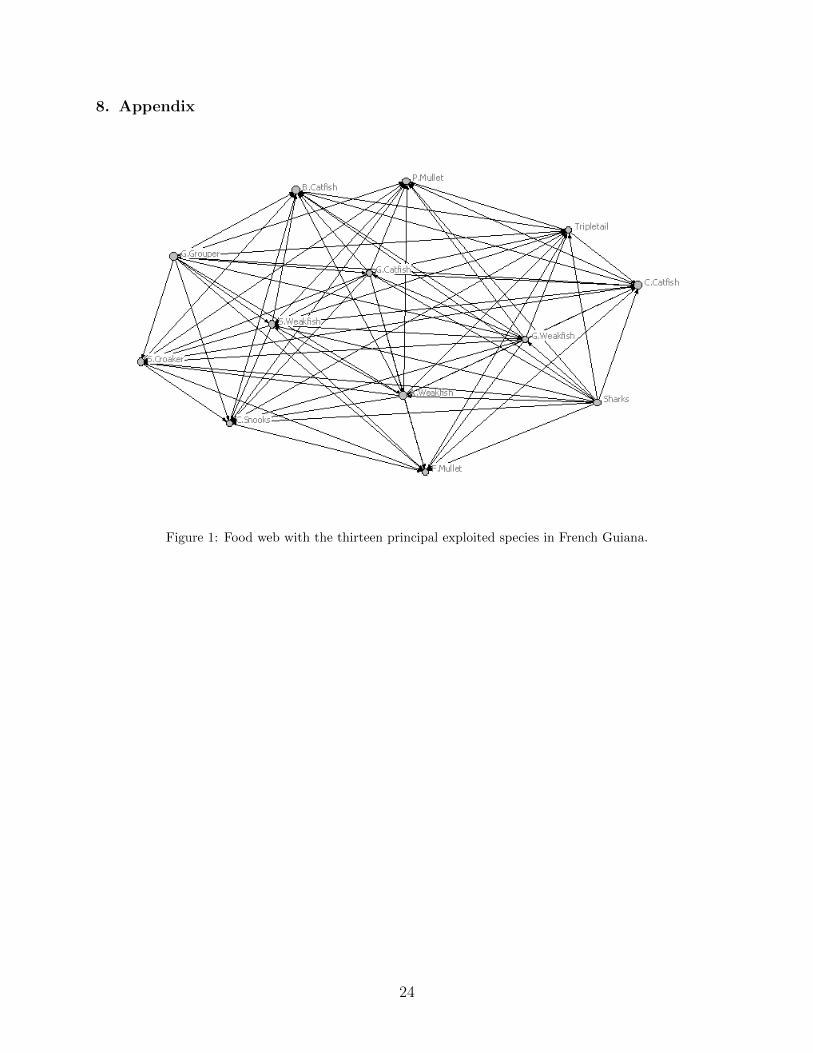
Among the thirty exploited species, thirteen are selected for the model as shown in table
(1). These species represent 88% of the total landing for years 2006 to 2009. Is added
a virtual fourteenth species which stands for all the other marine producers. A potential
trophic web displayed in figure (1) is built with these selected species, according to their diet
(Leopold, 2004) and their trophic level (table 1).
The ecosystem-based model is a multi-species, multi-fleets dynamic model described in
discrete time with a monthly step. The states of the species in the ecosystem-based model
are supposed to be governed by a complex dynamic system based on Lotka-Volterra trophic
interactions and fishing efforts from the different fleets which play the role of controls in the
system. Thus, at each step t, the biomass Bi(t + 1) (kg) of species i at time t + 1 depends
2SCILAB (http://www.scilab.org) is an open-source software dedicated to scientific calculus.
5

on other stocks Bj(t) and fishing efforts ek(t) of fleet k (time spent in sea, in hour) through
the relation:
Bi(t+ 1) = Bi(t)
(1 + ri +
14∑species j=1
Si,jBj(t)−4∑
fleets k=1
qi,kek(t)
)Here ri stands for the intrinsic growth rate of the population i and Si,j the trophic effect
of species j on species i (positive if j is a prey of i and negative if j is a predator of i).
The parameter qi,k measures the catchability of species i by fleet k. It corresponds to the
probability that a biomass unit of species i is caught by a boat of fleet k during one fishing
effort unit. The fleet k = 1 is associated with “canots creoles”, k = 2 with “canots creoles
ameliores”, k = 3 with “pirogues” and k = 4 with “tapouilles”.
The catches hi,k of species i by fleet k at time t are thus given by the Schaefer production
function:
hi,k(t) = qi,kek(t)Bi(t) (1)
3.2. Model and calibration inputs
Values used to define the model parameters come from different sources. Daily observa-
tions (catches and fishing efforts) from the landing points all along the coast are available
from January 2006 up to December 2009. The literature (Leopold (2004), Fishbase3) pro-
vides qualitative trophic interactions and intrinsic growth rates to start the calibration.
Initial stocks, catchabilities, trophic intensities and refined intrinsic growth rates values of
this ecosystem have been estimated by a least square method. This method consists of min-
imizing the error between the monthly observed catches hdatai,k and the one hi,k simulated by
the model as defined in equation (1):
minB0; S; q; r
2009∑t=2006
13∑i=1
4∑k
(hdatai,k (t)− hi,k(t)
)2Here (B0; S; q; r) is the set of parameters to be identified. B0 is the vector (14 × 1) of
initial stocks (December 2005), S the matrix (14× 14) of trophic interactions, q the matrix
3http://www.fishbase.org
6

(14× 4) of catchabilities and r a vector (14× 1) of intrinsic growth rates.
3.3. Model outputs : ecological indicators
After the calibration, ecological and economic indicators are computed to assess the
performance of both the ecosystem and the fishery. We first focus on biodiversity index.
Although the choice of a biodiversity metric remains controversial as pointed out in Magurran
(2007), we selected the species richness, Simpson and marine trophic indexes.
Species richness. The species richness (SR) gives the estimated number of species repre-
sented in the ecosystem. It is measured by an indicator function depending on the abun-
dances Ni(t) computed as the ratio between the biomass Bi(t) and the common weight wi
of each species, derived from the Fishbase information system:
SR(t) =∑i
1R∗+
(Ni(t)), with Ni(t) =Bi(t)
wi
where the set R∗+ is defined by R∗
+ = {Ni | Ni > 0}, the function 1R∗+
corresponds to the
characteristic function4 of the set R∗+. Through the constraint in R∗
+, it is assumed that a
species vanishes whenever its abundance falls to zero (Worm et al., 2006). It has to be noted
that rare species have a huge impact in the species richness index.
Simpson’s diversity. The Simpson index (SI) is expressed as:
SI(t) = 1−∑i
f 2i (t), with fi(t) =
Ni(t)
N(t)(2)
where N(t) =∑i
Ni(t). The index SI measures the probability that two individuals belong
to the same species. The index varies between 0 and 1. A perfectly homogeneous community
would have a Simpson diversity index score of 1. Such a metric gives more weight to the
more abundant species. The addition of rare species causes only small changes in the value.
4 1R∗+
(x) =
1 if x > 0
0 otherwise
7

Marine trophic index. Trophic level measures the position of a species in a food web,
starting with producers (eg phytoplankton, plants) at level 0, and moving through primary
consumers that eat primary producers (level 1) and secondary consumers that eat primary
consumers (level 2), and so on. In marine fishes, the trophic levels vary from two to five (top
predators). The marine trophic index (MTI) of the ecosystem is computed from the trophic
level of each species Ti (table 1) and their relative abundances fi (equation 2), (Pauly et al.,
1998; Pauly and Watson, 2005):
MTI(t) =∑i=1
fi(t)Ti
3.4. Model outputs : economic indicators
We now turn to the assessment of the fishing sector through productive and profitability
values of the fishery.
Food supply. We first consider the total catches (H(t)) within the fishery which play the
role of the food supply:
H(t) =∑k
∑i
hi,k(t)
The supply of seafood has to be compared with the food demand which is predicted to
increase at a significant rate for the years to come with population growth.
Profits. The profit (πk(t)) of each fleet k is derived from the landings of each species, fixed
costs (cfk) and variable costs (cvk) as follows:
πk(t) = (1− βk)
(∑i
pi,khi,k(t)− cvkek(t)
)− cfk
where βk stands for the crew share earnings and pi,k the price of species i landed by fleet
k. Share contract is the salary system commonly used in this fishery for “canots creoles
ameliores” (fleet k=2) and “tapouilles” (fleet k=4) . Crews are remunerated as a part of the
landing value lessened by the variable costs. “Canots creoles” (fleet k=1) and “pirogues”
(fleet k=3) crews are mostly made up of boat owners sometimes assisted by a family member.
If there is a pay system for these fleets, it differs from one owner to another. To simplify,
8

wages are not computed or deducted in the profit calculus for “canots creoles” and “pirogues”
(βk = 0% ). We assume βk = 50% for the other fleets. The variable costs include fuel
consumption, ice, food and lubricants. Equipment depreciation, maintenance and repairs
are incorporated in the fixed costs. Fish selling prices are contingent on marketing channels,
the “pirogues” ones are the highest, their catches are directly sold to consumers. The prices,
variable costs and fixed costs are those collected for 2008 (table 2) and they are assumed to
remain fixed for the duration of the simulation. The total profit Π(t) is the sum of profits
of all fleets:
Π(t) =∑k
πk(t)
3.5. Fishing scenarios
From the calibrated model, scenarios are simulated according to different fishing efforts
over forty years. We distinguish four scenarios: “closure” (CL), “status quo” (SQ), “eco-
nomic” (PV) and “co-viability” (CVA). The ecological and economic indicators mentioned
previously are evaluated for these four scenarios.
The “closure” scenario (CL). This scenario corresponds to the implementation of a no
fishing zone on the whole French Guiana coastal area.
• ek(t) = 0, for every fleet k = 1, 2, 3, 4 and for every t = t1, t1 + 1, . . . , tf ,
where t1 and tf correspond to January 2010 and December 2050 respectively.
The “status quo” scenario (SQ). This scenario simulates a stable fishing effort corre-
sponding to the mean pattern of the efforts between 2006 and 2009:
• ek(t) = ek, for every fleet k = 1, 2, 3, 4 and for every t = t1, t1 + 1, . . . , tf ,
with ek the mean efforts between 2006-2009 for the fleet k, captured in the equation
below:
ek =1
t1 − 1
t1−1∑t=t0
ek(t)
where t0 and t1 − 1 correspond to January 2006 and December 2009 respectively.
9

The “economic” scenario (PV). This scenario maximizes the present value of all the
future profits aggregated among the fleets (Π(t)):
maxek(t)
tf∑t=t1
(1 + γ)−tΠ(t)
where γ is the discount factor (we assume that γ = 3%).
The efforts ek(t) represent a control strategy that can be adapted every five years5. In other
words, eight decisions (ek(t1), ek(t2), · · · , ek(t8)) are available for each fleet k as follows
ek(t) =
ek(t1) for t = t1, ..., t1 + 60
ek(t2) for t = t2, ..., t2 + 60
...
ek(t8) for t = t8, ..., t8 + 60
(3)
where t1 and tn = tn−1 + 60, for n = 2 to 8, are decisive months.
The “co-viability” scenario (CVA). It intends to provide a satisfying balance through-
out time between profitability of fleets, biodiversity and local food demand. Thus levels of
fishing efforts ek(t) are sought that comply with the bio-economic constraints below:
• A profitability constraint:
πk(t) ≥ 0, ∀ t = t1, ..., tf , ∀ k = 1, . . . , 4
• A species richness constraint:
SR(t) ≥ 11, ∀ t = t1, ..., tf
• Food security constraint:
5A refined time decomposition for fishing intensities (for instance a one year time step) would have
improved the analysis but requires very demanding computation times. However strategic changes each five
years capture some intertemporal flexibility in fishing strategy. We plan to expand the time decision in
future models.
10
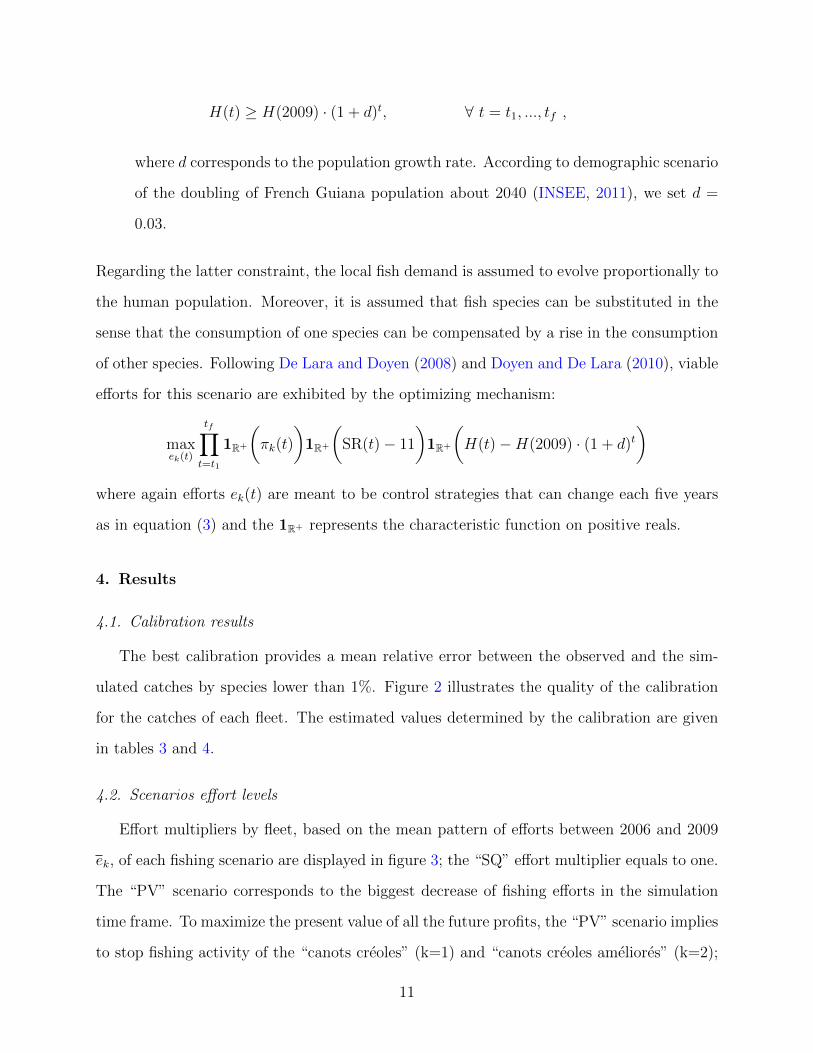
H(t) ≥ H(2009) · (1 + d)t, ∀ t = t1, ..., tf ,
where d corresponds to the population growth rate. According to demographic scenario
of the doubling of French Guiana population about 2040 (INSEE, 2011), we set d =
0.03.
Regarding the latter constraint, the local fish demand is assumed to evolve proportionally to
the human population. Moreover, it is assumed that fish species can be substituted in the
sense that the consumption of one species can be compensated by a rise in the consumption
of other species. Following De Lara and Doyen (2008) and Doyen and De Lara (2010), viable
efforts for this scenario are exhibited by the optimizing mechanism:
maxek(t)
tf∏t=t1
1R+
(πk(t)
)1R+
(SR(t)− 11
)1R+
(H(t)−H(2009) · (1 + d)t
)where again efforts ek(t) are meant to be control strategies that can change each five years
as in equation (3) and the 1R+ represents the characteristic function on positive reals.
4. Results
4.1. Calibration results
The best calibration provides a mean relative error between the observed and the sim-
ulated catches by species lower than 1%. Figure 2 illustrates the quality of the calibration
for the catches of each fleet. The estimated values determined by the calibration are given
in tables 3 and 4.
4.2. Scenarios effort levels
Effort multipliers by fleet, based on the mean pattern of efforts between 2006 and 2009
ek, of each fishing scenario are displayed in figure 3; the “SQ” effort multiplier equals to one.
The “PV” scenario corresponds to the biggest decrease of fishing efforts in the simulation
time frame. To maximize the present value of all the future profits, the “PV” scenario implies
to stop fishing activity of the “canots creoles” (k=1) and “canots creoles ameliores” (k=2);
11
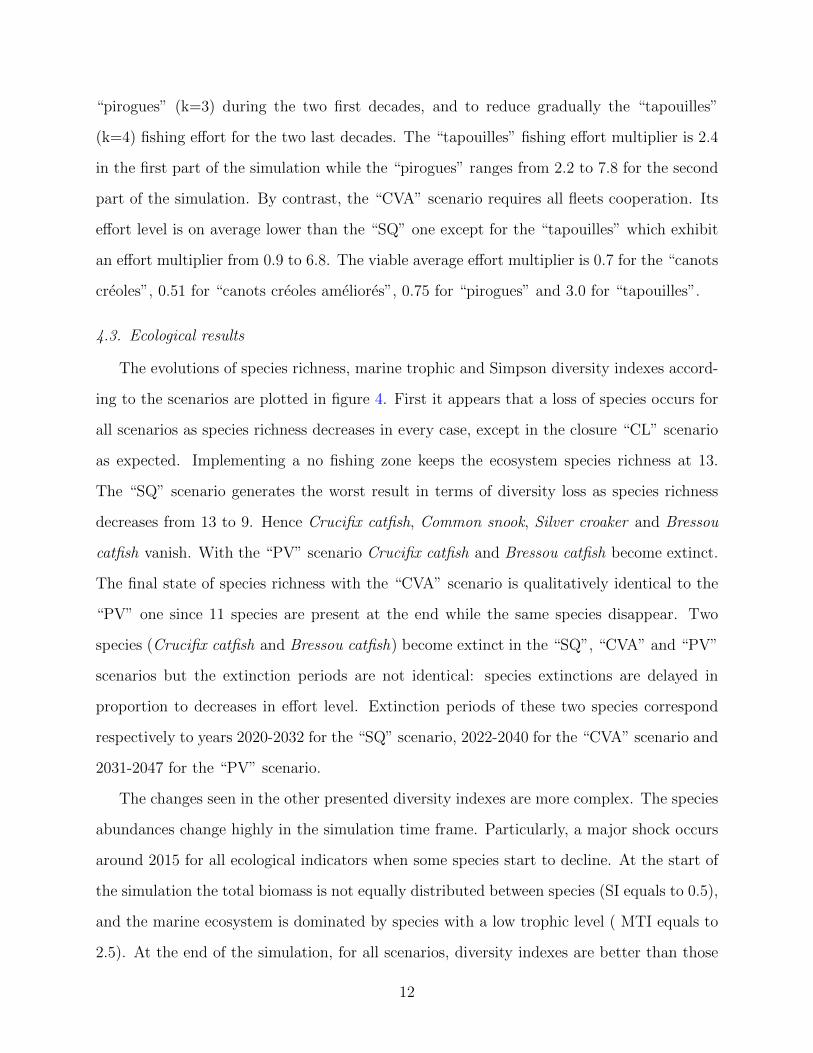
“pirogues” (k=3) during the two first decades, and to reduce gradually the “tapouilles”
(k=4) fishing effort for the two last decades. The “tapouilles” fishing effort multiplier is 2.4
in the first part of the simulation while the “pirogues” ranges from 2.2 to 7.8 for the second
part of the simulation. By contrast, the “CVA” scenario requires all fleets cooperation. Its
effort level is on average lower than the “SQ” one except for the “tapouilles” which exhibit
an effort multiplier from 0.9 to 6.8. The viable average effort multiplier is 0.7 for the “canots
creoles”, 0.51 for “canots creoles ameliores”, 0.75 for “pirogues” and 3.0 for “tapouilles”.
4.3. Ecological results
The evolutions of species richness, marine trophic and Simpson diversity indexes accord-
ing to the scenarios are plotted in figure 4. First it appears that a loss of species occurs for
all scenarios as species richness decreases in every case, except in the closure “CL” scenario
as expected. Implementing a no fishing zone keeps the ecosystem species richness at 13.
The “SQ” scenario generates the worst result in terms of diversity loss as species richness
decreases from 13 to 9. Hence Crucifix catfish, Common snook, Silver croaker and Bressou
catfish vanish. With the “PV” scenario Crucifix catfish and Bressou catfish become extinct.
The final state of species richness with the “CVA” scenario is qualitatively identical to the
“PV” one since 11 species are present at the end while the same species disappear. Two
species (Crucifix catfish and Bressou catfish) become extinct in the “SQ”, “CVA” and “PV”
scenarios but the extinction periods are not identical: species extinctions are delayed in
proportion to decreases in effort level. Extinction periods of these two species correspond
respectively to years 2020-2032 for the “SQ” scenario, 2022-2040 for the “CVA” scenario and
2031-2047 for the “PV” scenario.
The changes seen in the other presented diversity indexes are more complex. The species
abundances change highly in the simulation time frame. Particularly, a major shock occurs
around 2015 for all ecological indicators when some species start to decline. At the start of
the simulation the total biomass is not equally distributed between species (SI equals to 0.5),
and the marine ecosystem is dominated by species with a low trophic level ( MTI equals to
2.5). At the end of the simulation, for all scenarios, diversity indexes are better than those
12

of the beginning (computed SI ranges from 0.61 to 0.77, the MTI one ranges from 2.79 to
3.08, according to scenarios).
4.4. Economic results
Catches and profits for the “SQ”, “PV” and “CVA” scenarios are plotted in figures 5
and 6. Biomass shock in years 2015-2020 is found again in catches and profits. Note that
the prices (pi,k) are fixed, therefore fish demand is exogenous. The “SQ” scenario seems
economically viable, annual profits are positive during the whole period for all fleets except
for the “canots creoles” (k=1) in the first year simulation and the “pirogues” (k=3) for
2010-2011 and 2026-2034 periods. Not surprisingly, the “PV” scenario yields the biggest
cumulative discounted profit, 1.810 billion euros, versus 159.3 million for “SQ” scenario and
108.5 million for “CVA” scenario. The highest fishing activity occurs in the second part
of the simulation for the “pirogues” (k = 3). Note that the “pirogues” selling prices are
the highest (table 2). The “CVA” scenario provides positive annual profits for each fleet all
simulation long despite the fact that the “CVA” fishing effort is lower than the “SQ” one.
By comparing the fish demand curve with the supply curves through the catches by
scenario (figure 5), it is apparent that yield levels of the scenarios do not have the same
trend as the local fish demand. For a period of several years, the production is lower than
the fish demand, except for the “CVA” scenario6. The cumulative fish demand over forty
years reaches 144,726 tons while the total catches of the “CVA” scenario is one that comes
closest with 262,430 tons. The “SQ” scenario yields 284,211 tons whereas the “PV” scenario
produces 986,254 tons.
5. Discussion
5.1. Co-viability as a step towards sustainability
With regard to sustainability, a total fishery closure is obviously not a satisfactory solution
either economically or socially since an entire profession will disappear leading to a loss of
6We assume that prices are fixed and do not clear the market.
13

income for fishermen and nutritional deficiencies for the local population. It turns out
that maintaining constant efforts through the “SQ” scenario is also not a well-suited and
sustainable strategy. In fact, in addition to two fleets making no profit (k=1 and k=3)
over several years, the “SQ” scenario does not satisfy the constraint of local consumption
from years 2028 to 2038 and provides the worst species richness output. Economic data
are based on year 2008 which was unusual: fuel prices reached a record, production costs
rose a lot,· · · . More generally, the low prices at first sale and the production costs did not
allow all vessels to generate profits (Cisse, 2009). This context explain the negative profits
of some fleets at the beginning of the simulation. Economically, the largest cumulative
discounted profit and the most important total catch is obtained with the “PV” scenario.
However the “PV” scenario is not socially sustainable as profits are not evenly distributed
between fleets over time. This scenario implies stopping the activities of “canots creoles”
(k=1) and “canots creoles ameliores” (k=2), inducing negative profits for these fleets due
to fixed costs (figure 6). The “PV” scenario must be understood as a social planner trying
to maximize the present value of the global prospective profits and aiming to maintain the
potential productive capacity. The existence of some fleets exhibiting negative profits is not
problematic under the social planner viewpoint, since overall profits remain positive for each
step of the simulation. Moreover the exit of inactive fleets would increase the overall profit
even more, since fixed costs are saved. As no unique Pareto optimum emerges, a better bio-
economic compromise between biodiversity and socio-economic performances can be reached
with the “CVA” scenario. Although two species vanish, this scenario appears as the best
compromise : it allows annual positive profits for all fleets and satisfies local consumption
during the forty years simulation.
Beyond the analysis on the case study, this work advocates an integrated and multi-
criteria approach involving many scientific disciplines, in broad collaborative efforts as sug-
gested by Rice (2010). A wide range of stakeholders are involved in fisheries, including
industrial, artisanal, subsistence and recreational fishermen; suppliers and workers in allied
industries; managers, environmentalists, biologists, economists; public decision makers and
14
the general public (Hilborn, 2007). Each of these groups has an interest in particular out-
comes from fisheries and the outcomes that are considered desirable by one stakeholder may
be undesirable to another group (Hilborn, 2008). The consideration of this multi-dimensional
nature of marine fisheries management is a way of guaranteeing a reasonable exploitation
of aquatic resources, allowing the creation of conditions for sustainability from economic,
environmental and social viewpoints. This work is in direct line with these considerations.
First of interest is the use of bio-economic models and assessments articulating ecological and
socio-economic processes and goals. Moreover by focusing on sustainability and viability, the
present model exhibits management strategies and scenarios that account for intergenera-
tional equity and allows a conciliation between the present and the future. As emphasized
in Martinet and Doyen (2007) and De Lara and Doyen (2008), viability is closely related to
the maximin (Rawlsian) approach with respect to intergenerational equity. In this respect,
the CVA strategy turns out to be a promising approach.
5.2. Co-viability as a step towards EBFM
Several authors (e.g. Cury et al. (2005)) have proposed the viability approach as a new,
innovative and well-suited modeling framework for EBFM. They argue that the viability
approach and especially co-viability is relevant in handling EBFM issues because it may
account simultaneously for dynamic complexities, bio-economic risks and sustainability ob-
jectives balancing ecological, economic and social dimensions for fisheries. In particular,
Cury et al. (2005) and Doyen et al. (2007) show how the approach can potentially be useful
to integrate ecosystem considerations for fisheries management. Mullon et al. (2004), Doyen
et al. (2007), Bene and Doyen (2008) and Chapel et al. (2008) put emphasis on the abil-
ity to address complex dynamics in this framework. The computational and mathematical
modeling methods proposed in this paper through the CVA strategy are motivated by a
similar prospect. One major interest of the co-viability approach is the fact that viability
framework is dynamic, thus it allows the capture of the interactions and co-evolution of
marine biodiversity and fishing. The dynamics can potentially include complex mechanisms
such as trophic interactions, competition, metapopulation dynamics or economic investment
15

process to quote a few. Here the focus is both on trophic and technical interactions through
a multi-fleets and multi-species context.
Projections over forty years of different fishing scenarios point out the complexity of
mechanisms at play, particularly their non linearity. In regards to this, the trajectories of
ecological indicators is representative and should not be interpreted separately. The species
richness for the “CL” scenario remains stable to 13 species, meaning that all species are
present at the end of the simulation. However, the Simpson and marine trophic indexes
reveal that species abundances change through the simulation frame time. Diversity indexes
(SI, MTI) values at the end of simulation lead to the following findings : 1) total biomass is
better distributed among species and 2) the species with a high trophic level are better rep-
resented. Thus, fishing effects on the species can be deduced: fishing leads to the ecosystem
specialization and has contrasted effects according to species and fishing efforts. In addition,
changes within trophic networks depend on the intensity of the trophic interactions and on
the presence of species called “keystones” which are sometimes responsible for major changes
within ecosystems (Stevens et al., 2000).
5.3. Decision support for the Guiana small-scale fishery
Small-scale fisheries remain poorly managed because of their heterogeneity, the difficulties
in getting consistent and perennial data and the lack of regulation tools. This is more acute
in a tropical context where informal activities often dominate and where biodiversity is
higher, often with lower stock biomass (this is typically valid for reef ecosystems). In French
Guiana, waters are very turbid and productive because of the proximity of the Amazon
river. There are no reefs but biodiversity is high, as well as biomass. The bio-economic
database monitored from 2005 with observers from local communities who collected time
series data, offers the opportunity to go a step further for building management tools. Since
the decline of the French Guiana industrial shrimp fishery (Chaboud et al., 2008), the coastal
fishery increasingly appears as a sector with a high potential for development. Indeed, the
coastal fishery production has increased continuously until it overtook the shrimp and red
snapper landings in 2008. However, as previously stated, there is no quota for catches,
16

and no limitation concerning exploited species and their size. Regulation instruments are
derived from national and European usual fisheries management. The standards are related
to the gear selectivity (mesh size) and the global size of the fleet (total engine power and
total vessel capacity)(Cisse, 2009). As the stock status of the main exploited species has not
been studied yet, the norm concerning the global size of the fleet was not adapted to the
changing level of fish stocks and the management only aimed at displacing the unauthorized
boats. The present bio-economic study should contribute to the design of more scientific
and relevant assessments and regulations for both the marine ecosystem and this small case
fishery.
The fishing scenario outputs show that fishing performances, including food supply and
profitability of fleets, can be increased or sustained respectively. In particular, this suggests
that the marine ecosystem and the fishing sector could cope with the food demand and
contribute to food security. This could have positive consequences for the development of
French Guiana, since the coastal fishery plays an important socio-economic role for the small
cities along the coastline where more than 90% of the population is located. However, a fish
biodiversity loss can occur. This biodiversity erosion could potentially alter some ecosystem
services (not taken into account in the current model) and the outcomes of the fishery itself in
the long run. Thus some fish stocks should be evaluated more specifically in order to antici-
pate their depletion (Crucifix catfish, Bressou catfish). Depending on the endangered stocks,
conservative measures on productive and reproductive capacity of these stocks should be
taken. This will go through the banning of fishing in nursery areas or the incentive for more
selective fishing techniques. Thereby, the co-viability approach can allow a long-term man-
agement of the French Guiana coastal fishery, taking into account the multi-specific catches
of this case. This approach seems the most appropriate in responding both to the poten-
tial food demand, keeping a maximum of species diversity in the ecosystem, and providing
profits for fishermen. The CVA scenario suggests that such multi-functional sustainability
holds with moderate reinforcement of one fleet (“tapouille”) and relative reduction for others
(“canots creoles”, “canots creoles ameliores” or “pirogues”).
17

6. Conclusion
This work aims at contributing to sustainable exploitation systems taking into account
interactions between several species and between different fleets exploiting them. The imple-
mentation of multi-functionality appears to be a way to warrant an adequate management of
aquatic resources allowing the creation of sustainable conditions for economic, environmental
and social performances (Lesueur et al., 2006). However sustainability needs to be carefully
defined because economic and ecological sustainabilities easily conflict (Pitcher, 2001). It
is definitely a question to balance between exploitation (social and economic dimensions)
and carrying capacity (environmental dimension). Fisheries are invited to transform their
practices progressively, to favor eco-friendly technologies, to reinforce quality and reliabil-
ity of products and services, and to search for activities generating jobs (Lesueur et al.,
2006). Human sciences have to be integrated in the long term to allow management choices
to be made according to given public priorities (Blanchard and Maneschy, 2010). A next
step would be to integrate social indicators to evaluate also the scenarios regarding social
performances such as job satisfaction (Bavinck and Monnereau, 2007).
Of course, the whole results must be moderated, particularly because of the uncertainties
underlying the model and data. In particular, some parameters needs to be reinforced to
obtain a more accurate model. Up to now, only shrimps and red snappers fisheries have
been widely studied in French Guiana, unlike coastal fishery. Thus, some parameters of
the coastal fishery model are estimated from fishbase or from literature. Consequently, it
would be fruitful to integrate more values from local field studies dedicated to this ecosys-
tem (for instance, intrinsic growth rates and trophic levels). Stomach content data analysis
would especially improve the trophic interactions. Similarly, as landings are computed from
catchabilities and initial stocks, it would be important to obtain refined estimation of these
parameters. Furthermore, the ecosystem-based model is based on simplified dynamics. Ac-
counting for uncertainties would significantly improve the model and favor a bio-economic
risk management and a stochastic analysis (Doyen and De Lara, 2010). It may significantly
strengthen the robustness of outcomes and assertions from this dynamic complex model.
18
Other challenges are numerous, like expanding the number of species to include effects of
the fishing activities on the dynamics of other species (as mammals, turtles, birds) and on
plankton dynamics. In line with this, comparisons with the Ecopath (EwE) approach can
be informative. Another interesting goal is to include the effects of climatic changes, for
instance sea surface temperatures (Thebaud and Blanchard, 2011). A spatial expansion of
this model can also be considered to integrate for instance the effects of protected surfaces.
Acknowledgment
This work was supported by the ANR (French National Agency for Research) through
the project entitled ADHOC, the FRB (Fondation for the Research on Biodiversity) through
the project entitled BIOMER and the Ifremer. We thank all the fishermen who accepted to
give the economic data as well as all the observers collecting the other fishery data sets each
day.
19

7. Bibliography
Bavinck, M. and Monnereau, I. (2007), ‘Assessing the social costs of capture fisheries: an
exploratory study’, Social Science Information Sur Les Sciences Sociales 46(1), 135–152.
Bellail, R. and Dintheer, C. (1992), La peche maritime en guyane francaise, flottilles et engins
de peche, Technical report, Ifremer.
Bene, C. and Doyen, L. (2008), ‘Contribution values of biodiversity to ecosystem perfor-
mances: A viability perspective’, Ecological Economics 68(1-2), 14–23.
Blanchard, F. and Maneschy, C. (2010), Amaz’hommes, sciences de l’homme et sciences
de la nature en Amazonie, chapter Vers un developpement durable des pecheries tradi-
tionnelles cotieres amazoniennes: integrer les sciences humaines aux sciences naturelles et
economiques, pp. 371–382.
Chaboud, C., Vendeville, P., Blanchard, F. and Viera, A. (2008), Bio-economic modelling as
an integrative tool assess the dynamics of fisheries facing global economic environmental
changes : the example of the french guyana shrimp fishery, in ‘Coping with global change
in marine social-ecological systems : programme and abstracts’, p. 23.
Chapel, L., Deffuant, G., Martin, S. and Mullon, C. (2008), ‘Defining yield policies in a
viability approach’, Ecological Modelling 212(1-2), 10–15.
Cisse, A. A. (2009), Premiers elements de diagnostic economique de la pecherie cotiere en
guyane, Master’s thesis, University of French West Indies and Guiana.
Cury, P. A. and Christensen, V. (2005), ‘Quantitative ecosystem indicators for fisheries
management’, Ices Journal of Marine Science 62(3), 307–310.
Cury, P. M., Mullon, C., Garcia, S. M. and Shannon, L. J. (2005), ‘Viability theory for an
ecosystem approach to fisheries’, Ices Journal of Marine Science 62(3), 577–584.
De Lara, M. and Doyen, L. (2008), Sustainable management of natural resources: mathe-
matical models and methods, Springer Verlag.
20

Doyen, L. and De Lara, M. (2010), ‘Stochastic viability and dynamic programming’, Systems
and Control Letters 59, 629–634.
Doyen, L., De Lara, M., Ferraris, J. and Pelletier, D. (2007), ‘Sustainability of exploited
marine ecosystems through protected areas: A viability model and a coral reef case study’,
Ecological Modelling 208(2-4), 353–366.
FAO (1999), Indicators for sustainable development of marine capture fisheries, FAO Tech-
nical Guidelines for Responsible Fisheries-No.8, FAO.
FAO (2003), The ecosystem approach to fisheries, FAO Technical Guidelines for Responsible
Fisheries -No.4,Suppl.2, FAO.
FAO (2004), The State of World Fisheries and Aquaculture, State of World Fisheries and
Aquaculture, FAO.
Garcia, S. (2008), Towards integrated assessment and advice in small-scale fisheries : prin-
ciples and processes, FAO fisheries and aquaculture technical paper;515, Food and Agri-
culture Organization of the United Nations, Rome.
Garcia, S. M. and Grainger, R. J. R. (2005), ‘Gloom and doom? the future of marine
capture fisheries’, Philosophical Transactions of the Royal Society B-Biological Sciences
360(1453), 21–46.
Grafton, R. Q., Kompas, T. and Hilborn, R. W. (2007), ‘Economics of overexploitation
revisited’, Science 318(5856), 1601–1601.
Hall, S. J. and Mainprize, B. (2004), ‘Towards ecosystem-based fisheries management’, Fish
and Fisheries 5(1), 1–20.
Hilborn, R. (2007), ‘Defining success in fisheries and conflicts in objectives’, Marine Policy
31(2), 153–158.
21

Hilborn, R. (2008), ‘Knowledge on How To Achieve Sustainable Fisheries’, Fisheries for
Global Welfare and Environment, 5th World Fisheries Congress pp. 45–56.
ICES (2004), Report of the ICES Advisory Committee on Fishery Management and Advisory
Committee on Ecosystems, Vol. 1 of ICES Advice, ICES.
INSEE (2011), Projections de population a l’horizon 2040, plus d’un demi-million de
guyanais, Technical report, INSEE.
Jennings, S. (2005), ‘Indicators to support an ecosystem approach to fisheries’, Fish and
Fisheries 6(3), 212–232.
Leopold, M. (2004), Guide des poissons de mer de Guyane, ifremer edn, IFREMER.
Lesueur, M., Bourde, J. and Le Goffe, P. (2006), ‘La multifonctionnalite des peches mar-
itimes et des cultures marines a la lumiere de la multifonctionalite de l’agriculture’, Les
publications Amure pp. 49–81.
Link, J. S. (2005), ‘Translating ecosystem indicators into decision criteria’, Ices Journal of
Marine Science 62(3), 569–576.
Magurran, A. E. (2007), ‘Species abundance distributions over time’, Ecology Letters 10, 347–
354.
Marasco, R. J., Goodman, D., Grimes, C. B., Lawson, P. W., Punt, A. E. and Quinn, T. J.
(2007), ‘Ecosystem-based fisheries management: some practical suggestions’, Canadian
Journal of Fisheries and Aquatic Sciences 64(6), 928–939.
Martinet, V. and Doyen, L. (2007), ‘Sustainability of an economy with an exhaustible re-
source: a viable control approach’, Resource and Energy Economics 29(1), 17–39.
Mullon, C., Cury, P. and Shannon, L. (2004), ‘Viability model of trophic interactions in
marine ecosystems’, Natural Resource Modeling 17(1), 27–58.
22

Pauly, D., Christensen, V., Dalsgaard, J., Froese, R. and Torres, F. (1998), ‘Fishing down
marine food webs’, Science 279(5352), 860–863.
Pauly, D. and Watson, R. (2005), ‘Background and interpretation of the ’marine trophic
index’ as a measure of biodiversity’, Philosophical Transactions of the Royal Society B-
Biological Sciences 360(1454), 415–423.
Pitcher, T. J. (2001), ‘Fisheries managed to rebuild ecosystems? reconstructing the past to
salvage the future’, Ecological Applications 11(2), 601–617.
Plaganyi, E. E. (2007), Models for an ecosystem approach to fisheries, FAO Fisheries Tech-
nical Paper, FAO.
Rice, J. (2010), ‘Science dimensions of an Ecosystem Approach to Management of Biotic
Ocean Resources (SEAMBOR)’, ESF Marine Board Position Paper 14, 92.
Rice, J. C. (2000), ‘Evaluating fishery impacts using metrics of community structure’, Ices
Journal of Marine Science 57(3), 682–688.
Stevens, J. D., Bonfil, R., Dulvy, N. K. and Walker, P. A. (2000), ‘The effects of fishing on
sharks, rays, and chimaeras (chondrichthyans), and the implications for marine ecosys-
tems’, Ices Journal of Marine Science 57(3), 476–494.
Thebaud, O. and Blanchard, F. (2011), Fishing the Food Web: integrated analysis of changes
and drivers of change in fisheries of the Bay of Biscay, Wiley-Blackwell, pp. 90–104.
Worm, B., Barbier, E. B., Beaumont, N., Duffy, J. E., Folke, C., Halpern, B. S., Jackson, J.
B. C., Lotze, H. K., Micheli, F., Palumbi, S. R., Sala, E., Selkoe, K. A., Stachowicz, J. J.
and Watson, R. (2006), ‘Impacts of biodiversity loss on ocean ecosystem services’, Science
314(5800), 787–790.
23
8. Appendix
Figure 1: Food web with the thirteen principal exploited species in French Guiana.
24
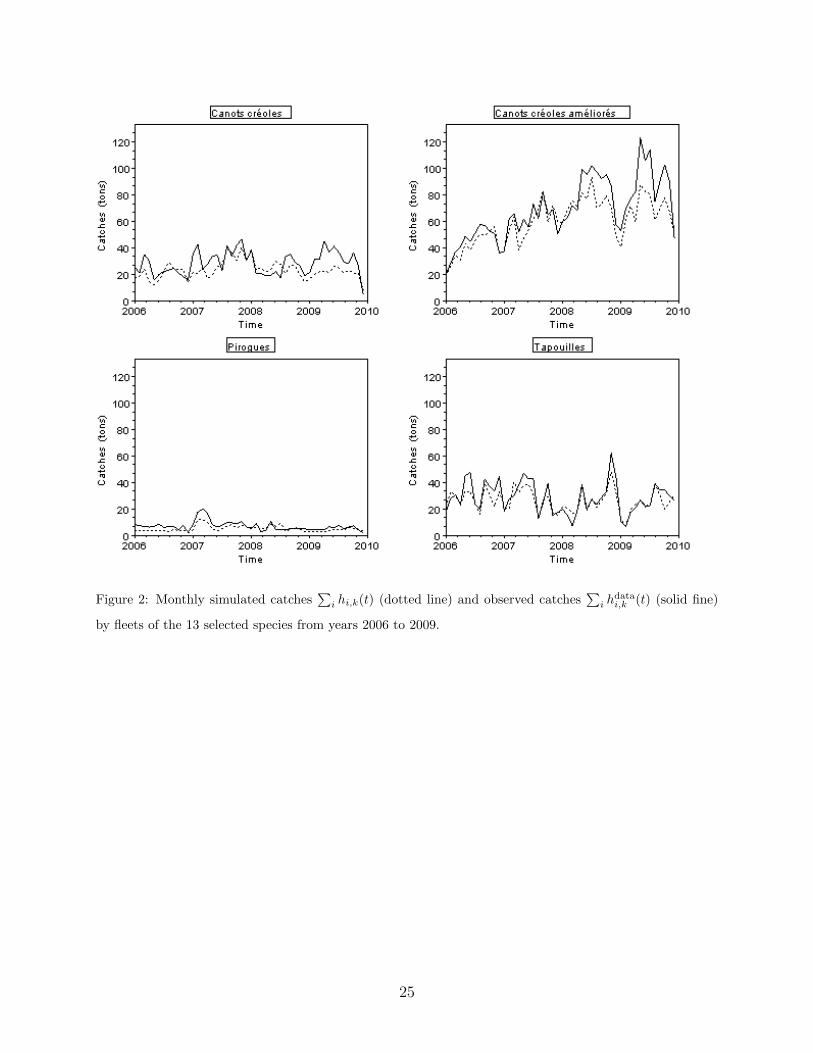
Figure 2: Monthly simulated catches∑
i hi,k(t) (dotted line) and observed catches∑
i hdatai,k (t) (solid fine)
by fleets of the 13 selected species from years 2006 to 2009.
25

Figure 3: Fishing effort multiplier by fleet and scenario, “Status quo” (black solid line), “Economic” (green
dotted line), “Co-viability” (blue dashed line).
26

Table 1: the thirteen selected species representing about 90% of the catches of the fishery.Common name Scientific name Trophic level
(Fishbase)
Acoupa weakfish Cynoscion acoupa 4.05
Crucifix sea catfish Hexanematichtys proops 4.35
Green weakfish Cynoscion virescens 4.03
Common snooks Centropomus parallelus, Centropomus undecimalus 4.2
Sharks Sphyrna lewini, Carcharhinus limbatus, Mustelus higmani 4.5
Smalltooth weakfish Cynoscion steindachneri 3.25
South american silver croaker Plagioscion squamosissimus 4.35
Tripletail Lobotes surinamensis 4.04
Gillbacker sea catfish Arius parkeri 4.11
Bressou sea catfish Aspistor quadriscutis 3.5
Goliath grouper Epinephelus itajara 4.09
Flathead grey mullet Mugil cephalus 2.13
Parassi mullet Mugil incilis 2.01
27

Table 2: 2008 economic data (variable costs, fixed costs and selling prices).Fleets
“canots creoles ” “canots creoles “pirogues” “tapouilles”
ameliores”
(fleet k = 1) (fleet k = 2) (fleet k = 3) (fleet k = 4)
2006-2009 average 71 60 45 10
boats number
Variable costs 5.83 5.40 8.52 8.22
per fishing hour( e )
Annual fixed costs 8610 8958 3770 29833
per boat( e )
Selling prices ( e )
A.weakfish 3.08 2.31 4.00 2.23
C.catfish 1.85 1.49 3.00 1.25
G. weakfish 1.45 1.42 2.50 1.56
C. snooks 2.83 2.09 4.00 2.23
Sharks 1.78 1.07 3.00 0.94
S.weakfish 2.40 1.98 3.28 2.23
S. croaker 1.68 1.89 3.71 1.50
Tripletail 1.97 1.29 1.65 1.97
G. catfish 5.68 4.23 6.00 4.00
B. catfish 1.74 1.73 3.00 1.73
G.grouper 3.73 3.98 4.00 2.43
F. mullet 3.96 2.48 4.20 2.50
P. mullet 3.81 2.00 5.00 2.00
28

Table 3: Initial stocks and intrinsic growth rate of selected species from calibration.Initial stocks Intrinsic Intrinsic Catchability Catchability Catchability Catchability
(December 2005) growth rate growth rate fleet k = 1 fleet k = 2 fleet k = 3 fleet k = 4
Bi(0) ri (qi,1) (qi,2) (qi,3 ) (qi,4 )
Species(i) unit tons ∗10−2(Fisbase) ∗10−2(Calibration) ∗10−7 ∗10−7 ∗10−7 ∗10−7
A. weakfish 7,152 2.08 1.97 2 4 0.95 10
C. catfish 301 5.95 5.95 68 31 33 24
G. weakfish 26,816 0.16 0.15 0.41 0.39 0.2 0.88
C. snooks 144 4.21 4.08 41 26 47 4
Sharks 10,370 - 4.72 - 3.67 0.38 0.46 0.25 2
S. weakfish 25,825 0.64 0.69 0.06 0.09 0.1 0.
S.croaker 129 3.44 3.08 13 16 54 0.
Tripletail 1,307 9.34 8.87 0.14 0.08 0.02 0.02
G. catfish 67 2.59 2.70 28 37 68 0.31
B. catfish 36 4.21 4.66 48 18 143 0.
G. grouper 2,040 - 2.26 - 1.92 4 0.49 0.3 0.12
F. mullet 28,902 5.31 3.33 0.005 0.003 0.004 0.
P. mullet 38,718 7.03 5.62 0.002 0.0001 0.004 0.
29

Table 4: Trophic relations matrix, Si,j (∗10−12) from calibration.Species A.weak. C.cat. G. weak. C. snoo. Sharks S.weak. S. croa. Triple. G. cat. B. cat. G.grou. F. mul. P. mul.
A.weak. - 24.41 25.59 - 216.8 3.02 - 39.81 1.81 0.70 0.64 - 23.06 1.72 - 202.6 28.57 36.22
C.cat. - 204.8 - 104.9 - 14.41 - 46.93 - 4.41 - 36.96 5779 - 267.9 - 45.73 2228 - 18.62 7.27 17.28
G. weak. 22.30 1.80 - 3.98 2.14 - 44.67 2.21 6.41 1.48 - 54.18 10.40 - 28.08 1.22 14.43
C. snoo. - 24.18 - 17.25 - 17.10 - 16.34 - 85.37 - 1.57 - 133.2 - 71.13 - 121.5 0.43 - 26.01 1.76 2.90
Sharks 4.98 0.551 5.58 10.67 - 4.86 0.40 23.51 5.45 35.10 1.30 - 147.7 29.35 25.10
S.weak. - 59.91 4.62 - 23.82 0.19 - 3.22 - 0.17 22.16 5.67 - 7.16 3.87 - 9.92 6.27 9.47
S. croa. - 5.64 -46338 - 51.29 16.65 - 188.1 - 177.2 - 26.26 - 2.07 - 10.47 6.98 - 21.08 5.30 20.94
Triple. - 5.1 28.05 - 11.86 8.53 - 43.61 - 45.36 - 8.12 - 256.2 - 134.7 8.96 - 26.35 4.39 0.78
G. cat. 2.88 5.72 6.77 15.19 - 280.8 0.89 1.31 16.84 - 114.53 4.76 - 9.48 4.93 8.10
B. cat. - 13.77 -17831 - 83.25 - 3.43 - 10.43 -30.93 - 55.84 - 71.71 - 38.12 0. - 206.5 0. 0.
G.grou. 25.33 2.33 3.51 3.25 - 30.49 1.24 2.63 3.29 1.18 25.82 - 10.74 22.79 3.86
F. mul. - 228.5 - 58.2 - 9.79 - 14.05 - 234.8 - 50.19 - 42.4 - 35.12 - 39.44 0. - 182.3 0. 0.
P. mul. - 289.8 - 138.3 - 115.5 - 23.2 - 200.8 - 75.72 - 167.5 - 6.22 - 64.79 0. - 30.88 0. 0.
30

Figure 4: Species richness, Marine trophic and Simpson indexes according to scenarios : “Protected area”
(red dash-dotted line), “Status quo” ( black solid line), “Economic” (green dotted line), “Co-viability” (blue
dashed line).
31

Figure 5: Total catches by scenario, “Status quo” (black solid line), “Economic” (green dotted line), “Co-
viability” (blue dashed line); Local fish demand growth (red dash-dotted line).
32

Figure 6: Profits by fleet and scenario, “Status quo” (black solid line), “Economic” (green dotted line),
“Co-viability” (blue dashed line), Profitability threshold (red dash-dotted line).
33

Cahiers du GREThA
Working papers of GREThA
GREThA UMR CNRS 5113
Université Montesquieu Bordeaux IV
Avenue Léon Duguit
33608 PESSAC - FRANCE
Tel : +33 (0)5.56.84.25.75
Fax : +33 (0)5.56.84.86.47
http://gretha.u-bordeaux4.fr/
Cahiers du GREThA (derniers numéros – last issues)
2011-24 : BECUWE Stéphane, BLANCHETON Bertrand, Politique commerciale et croissance entre
1850 et 1913, Synthèse critique des contributions
2011-25 : PETIT Emmanuel, TCHERKASSOF Anna, GASSMANN Xavier, Anticipated regret and self-
esteem in the Allais paradox
2011-26 : BONNEFOND Céline, CLEMENT Matthieu, An analysis of income polarization in rural and
urban China
2011-27 : FRIGANT Vincent, Egyptian pyramid or Aztec pyramid: How should we describe the
industrial architecture of automotive supply chains in Europe?
2011-28 : BEN MIM Sami, MABROUK Fatma, Transferts des migrants et croissance économique :
quels canaux de transmission ? 2011-29 : MABROUK Fatma, Migration de retour, de la théorie à la pratique 2011-30 : MOYES Patrick, GRAVEL Nicolas, Utilitarianism or Welfarism: Does it Make a Difference?
2011-31 : BROUILLAT Eric, Durability of consumption goods and market competition: an agent-
based modelling
2011-32 : BONIN Hubert, En quête des étapes de renouveau de l’esprit d’entreprise français dans
les années 1950-2000
2011-33 : MONTALBAN Matthieu, RAMIREZ-PEREZ Sigfrido, SMITH Andy, EU Competition Policy
Revisited: Economic Doctrines Within European Political Work
2011-34 : FRIGANT Vincent, Three uncertainties looming over the European auto industry
2011-35 : MOYES Patrick, Rearrangements and Sequential Rank Order Dominance. A Result with
Economic Applications
2011-36 : MOYES Patrick, GRAVEL Nicolas, Ethically Robust Comparisons of Bidimensional
Distributions with an Ordinal Attribute
2011-37 : LEE Ji-Yong, Crises et transformation des modèles de gouvernance d’entreprise en Asie
2011-38 : CISSE Abdoul, GOURGUET Sophie, DOYEN Luc, BLANCHARD Fabian, PEREAU Jean-
Christophe, A bio-economic model for the ecosystem-based management of the coastal
fishery in French Guiana
La coordination scientifique des Cahiers du GREThA est assurée par Sylvie FERRARI et Vincent FRIGANT. La mise en page est assurée par Anne-Laure MERLETTE.