a bio-mechanical model for coupling cell contractility...
TRANSCRIPT
ARTICLE IN PRESS
0022-5096/$ - se
doi:10.1016/j.jm
�CorrespondE-mail addr
Journal of the Mechanics and Physics of Solids 56 (2008) 1484–1510
www.elsevier.com/locate/jmps
A bio-mechanical model for coupling cell contractility with focaladhesion formation
Vikram S. Deshpandea,c,�, Milan Mrksichb,Robert M. McMeekingc, Anthony G. Evansc
aDepartment of Engineering, University of Cambridge, Trumpington Street, Cambridge CB2 1PZ, UKbHoward Hughes Medical Institute/Department of Chemistry, University of Chicago, Chicago, IL 60637, USA
cMechanical Engineering Department and Materials Department, University of California, Santa Barbara, CA 93106, USA
Received 15 April 2007; received in revised form 9 August 2007; accepted 15 August 2007
Abstract
Focal adhesions (FAs) are large, multi-protein complexes that provide a mechanical link between the cytoskeletal
contractile machinery and the extracellular matrix. They exhibit mechanosensitive properties; they self-assemble upon
application of pulling forces and dissociate when these forces are decreased. We rationalize this mechano-sensitivity from
thermodynamic considerations and develop a continuum framework in which the cytoskeletal contractile forces generated
by stress fibers drive the assembly of the FA multi-protein complexes. The FA model has three essential features: (i) the low
and high affinity integrins co-exist in thermodynamic equilibrium, (ii) the low affinity integrins within the plasma
membrane are mobile, and (iii) the contractile forces generated by the stress fibers are in mechanical equilibrium and
change the free energies of the integrins. A general two-dimensional framework is presented and the essential features of
the model illustrated using one-dimensional examples. Consistent with observations, the coupled stress fiber and FA model
predict that (a) the FAs concentrate around the periphery of the cell; (b) the fraction of the cell covered by FAs increases
with decreasing cell size while the total FA intensity increases with increasing cell size; and (c) the FA intensity decreases
substantially when cell contractility is curtailed.
r 2007 Elsevier Ltd. All rights reserved.
Keywords: Mechano-sensitivity; Self-assembly; Focal adhesions; Stress fibers; Myosin.
1. Introduction
Cells interact with substrates coated with extracellular matrix proteins (ECM) through the formation ofmulti-molecular complexes referred to as focal adhesions (FAs). The FAs form the mechanical link betweenthe cytoskeleton within the cell and the ECM. They are typically 1–3 mm in extent. The FA comprises a layerof trans-membrane integrin molecules and a multi-protein sub-membrane plaque. The integrins are integralmembrane hetero-dimeric proteins with extracellular domains that bind to ligands attached to the substrate, as
e front matter r 2007 Elsevier Ltd. All rights reserved.
ps.2007.08.006
ing author.
ess: [email protected] (V.S. Deshpande).

ARTICLE IN PRESSV.S. Deshpande et al. / J. Mech. Phys. Solids 56 (2008) 1484–1510 1485
well as intracellular domains that provide docking sites for the assembly of the plaque. In turn, the plaqueconsists of many different proteins including talin, a-actinin, filamin, FA kinase, vinculin, paxillin, and tensin.Some of these proteins form the structural scaffold of the adhesion site, while others mediate signalingprocesses. This FA plaque also serves as a platform for nucleation and development of stress fibers within thecell (bundles of actin filaments containing myosin and various actin-binding proteins). The stress fibers aremajor generators of intracellular contractile forces, transmitted through the FA plaque and the integrins to thesubstrate. Namely, there is an intimate linkage between the formation of the FAs around the cell peripheryand the development of stress fibers within the cell. To characterize and predict the bio-chemo-mechanicalinteractions between a cell and the ECM, a model must be devised that incorporates the influence of the forcesexerted by the stress fibers on the formation of FA. Developing such a model is the primary intent of thisarticle. The FA component of the model will be intimately linked with a cell contractility scheme developed byDeshpande et al. (2006, 2007) that characterizes the organization of the stress fibers and the tractions theyexert on the substrate.
A growing body of experimental evidence suggests that FA formation is itself controlled mechanically, withthe tractions generated at the contact sites increasing the rate of assembly of the FAs (Balaban et al., 2001;Tan et al., 2003; Petroll et al., 2003). Recent results (Parker et al., 2002; Brock et al., 2003; Chen et al., 2003)also demonstrate that the global shape of cells and their internal cytoskeletal structure play an important rolein constraining the magnitude, distribution, and direction of such tractions across the cell surface, and therebycontrol local FA assembly and organization. In particular, stationary cells tend to organize long stress fibers,with large FAs concentrating at the cell periphery (Fig. 1a) and in high curvature regions. Moreover, FAformation also can be increased or decreased by, respectively, raising or lowering the cytoskeletal tension,using pharmacological agents that curtail acto-myosin activity (Fig. 1b). A number of important questionsarise from these observations. Does an adhesion/stress fiber interaction leads to this self-organizing behavior,with the FAs concentrating at the cell periphery? What determines the time-scale of FA redistribution?Following the pioneering studies of Bell (1978) and Bell et al. (1984), Dembo et al. (1988) described adhesion
Fig. 1. (a) Fluorescent confocal micrographs of individual, vinculin-labeled Bovine capillary endothelial cells cultured on square islands of
different sizes (lengths of sides are indicated). (b) Immunofluorescence images of vinculin in Bovine capillary endothelial cell (i–iv) and
Human vascular endothelial cells (v–viii) cells on 5mm islands that were untreated (i, v) or exposed to thrombin (ii, vi), BDM (iii, vii), or
KT5926 (iv, viii). Scale bars indicate a 10 mm length. Reproduced from Chen et al. (2003).
ARTICLE IN PRESSV.S. Deshpande et al. / J. Mech. Phys. Solids 56 (2008) 1484–15101486
by a chemical rate reaction theory, whereas Evans (1985) employed a traditional cohesive zone approach.Freund and Lin (2004) investigated the role of binder mobility in the development of adhesive contacts.
Because FAs contain components that interact with a large number of signaling cascades (Burridge andChrzanowska-Wodnicka, 1996), shape-regulated FA formation could provide a molecular mechanism forhow cell structure and physical distortion of cell shape can be transduced into biochemical signals inside thecell. Thus, this inside—out regulation of FA assembly may be critical in integrating many physical cues—cellshape, ECM compliance, intracellular tension, and cytoskeletal architecture—into signals that partiallydetermine cell function. The fact that many proteins perform both structural and signaling functions hindersthe ability of traditional genetic approaches to parse the mechanisms that regulate FA dynamics, sinceknocking out a protein by genetic manipulation may also eliminate an essential structural component.Consequently, to understand how specific molecular features give rise to the observed behavior it is essential tocombine experimental studies of adherent cells—including the use of microscopy to observe the structure anddynamics of the cytokskeleton and FAs—with computational models that include the salient mechanics.
A generalized model must be capable of characterizing the assembly of the FAs in terms of the basicinteractions between the forces, the assembly and dissolution of stress fibers and the compliance of thesubstrate. Moreover, once calibrated, it must explain such effects as the preference for FA formation at the cellperiphery, the strong influence of substrate compliance on the forces exerted on the substrate, the influence ofcell size on FA formation and on the magnitude of the forces, as well the influence of cell shape and boundaryconditions on the orientations of the fibers. Although the nature of mechanical sensing by FA is not fullyunderstood, several possible mechanisms have been proposed (Bershadsky et al., 2003; Zhu et al., 2000) and anumber of phenomenological models have been developed that account for the growth of FAs with increasingtraction forces at the adhesion sites (Novak et al., 2004, Nicolas et al., 2004; Nicolas and Safran, 2006). All ofthese models assume a-priori that traction forces developed at the contact sites increase the rate of assembly offocal adhesions and have the limitation that they do not present a consistent thermodynamic framework.Furthermore, these models either just take into account elastic stresses developed in the cell (Nicolas et al.,2004; Nicolas and Safran 2006) or assume an ad hoc relation for the forces generated by acto/myosin stressfibers (Novak et al., 2004; Shemesh et al., 2005). Here we pursue a mechano-sensitive model of the processesthat form FAs. The model incorporates contributions to the free energies of the integrins from the storedenergy caused by stretching of the integrin–ligand complexes and the potential energy due to the mechanicalwork done by the cytoskeleton—it is the combination of these two contributions that governs the stability ofthe receptor–ligand complex. This model is then coupled with a biochemically motivated stress fiber model(Deshpande et al., 2006, 2007) that accurately predicts a large number of observations including: (i) the scalingof forces generated by cells on a bed of microneedles (Deshpande et al., 2007); (ii) the sensitivity of thecontractile response to the stiffness of the substrate (Deshpande et al., 2006), and (iii) the evolution of stressfiber orientations in cells subjected to cyclic stretch (Wei et al., 2007). It will be shown that the new, integratedmodel is capable of rationalizing many experimental observations of FA formation.
The article is organized in the following manner. First, the basic observations of FA formation aresummarized as a motivation for the modeling approach. This is followed by a description of the model interms of the chemical potentials and the fluxes. Thereafter, the application of the model in one dimension ispresented in three parts. In the first, the parameters to be used in the model are summarized. Then two singlecell phenomena are analyzed. One examines a cell on an ‘‘infinite’’ substrate. The other addresses a cell on apatterned substrate. In both cases, the predictions of FA formation are compared with experimentalobservations. Finally, an example of the implementation of the model in two dimensions is presented for a cellon a stiff substrate with a V-shaped micro-patterned ligand patch. Additional two-dimensional examples arepresented in a companion article (Pathak et al., 2007).
2. Brief review of the biochemistry of the binding proteins (integrins)
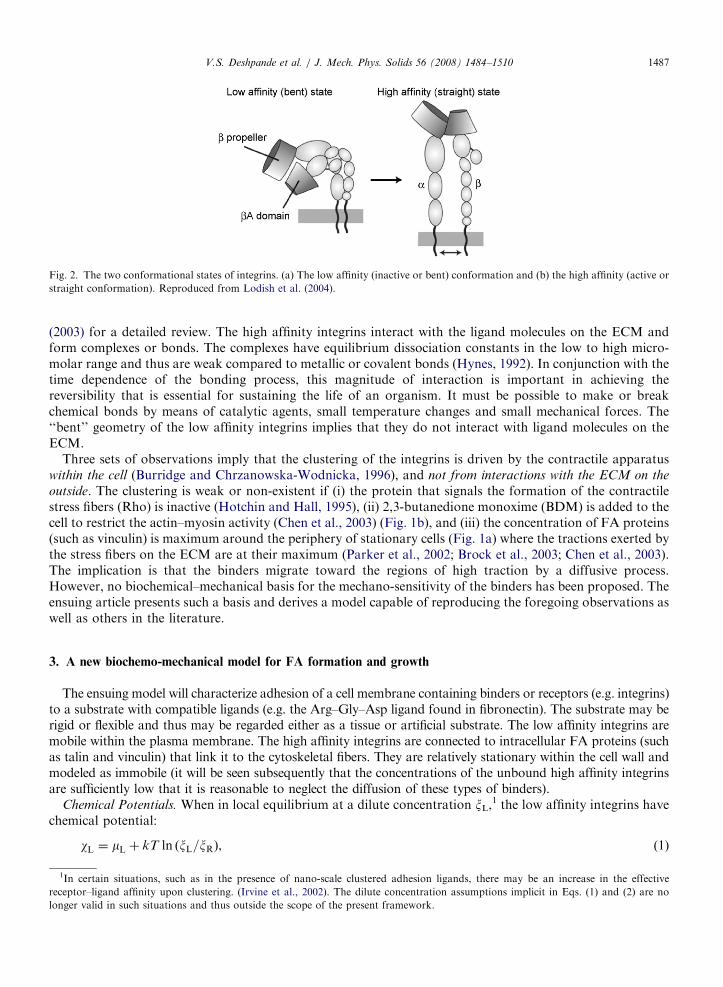
Integrin proteins enable a bidirectional control of cell adhesion, by dynamically coupling the immobilizedmatrix and its associated ligands outside the cell with its internal ‘‘skeleton’’. Recent studies (Xiao et al., 2004)have elucidated that integrins exist in two conformational states: (i) a low affinity (or bent) state and (ii) anactive or ‘‘straight’’ state with a high affinity to the appropriate ligand (see Fig. 2); see Carman and Springer
ARTICLE IN PRESS
Fig. 2. The two conformational states of integrins. (a) The low affinity (inactive or bent) conformation and (b) the high affinity (active or
straight conformation). Reproduced from Lodish et al. (2004).
V.S. Deshpande et al. / J. Mech. Phys. Solids 56 (2008) 1484–1510 1487
(2003) for a detailed review. The high affinity integrins interact with the ligand molecules on the ECM andform complexes or bonds. The complexes have equilibrium dissociation constants in the low to high micro-molar range and thus are weak compared to metallic or covalent bonds (Hynes, 1992). In conjunction with thetime dependence of the bonding process, this magnitude of interaction is important in achieving thereversibility that is essential for sustaining the life of an organism. It must be possible to make or breakchemical bonds by means of catalytic agents, small temperature changes and small mechanical forces. The‘‘bent’’ geometry of the low affinity integrins implies that they do not interact with ligand molecules on theECM.
Three sets of observations imply that the clustering of the integrins is driven by the contractile apparatuswithin the cell (Burridge and Chrzanowska-Wodnicka, 1996), and not from interactions with the ECM on the
outside. The clustering is weak or non-existent if (i) the protein that signals the formation of the contractilestress fibers (Rho) is inactive (Hotchin and Hall, 1995), (ii) 2,3-butanedione monoxime (BDM) is added to thecell to restrict the actin–myosin activity (Chen et al., 2003) (Fig. 1b), and (iii) the concentration of FA proteins(such as vinculin) is maximum around the periphery of stationary cells (Fig. 1a) where the tractions exerted bythe stress fibers on the ECM are at their maximum (Parker et al., 2002; Brock et al., 2003; Chen et al., 2003).The implication is that the binders migrate toward the regions of high traction by a diffusive process.However, no biochemical–mechanical basis for the mechano-sensitivity of the binders has been proposed. Theensuing article presents such a basis and derives a model capable of reproducing the foregoing observations aswell as others in the literature.
3. A new biochemo-mechanical model for FA formation and growth
The ensuing model will characterize adhesion of a cell membrane containing binders or receptors (e.g. integrins)to a substrate with compatible ligands (e.g. the Arg–Gly–Asp ligand found in fibronectin). The substrate may berigid or flexible and thus may be regarded either as a tissue or artificial substrate. The low affinity integrins aremobile within the plasma membrane. The high affinity integrins are connected to intracellular FA proteins (suchas talin and vinculin) that link it to the cytoskeletal fibers. They are relatively stationary within the cell wall andmodeled as immobile (it will be seen subsequently that the concentrations of the unbound high affinity integrinsare sufficiently low that it is reasonable to neglect the diffusion of these types of binders).
Chemical Potentials. When in local equilibrium at a dilute concentration xL,1 the low affinity integrins have
chemical potential:
wL ¼ mL þ kT ln ðxL=xRÞ, (1)
1In certain situations, such as in the presence of nano-scale clustered adhesion ligands, there may be an increase in the effective
receptor–ligand affinity upon clustering. (Irvine et al., 2002). The dilute concentration assumptions implicit in Eqs. (1) and (2) are no
longer valid in such situations and thus outside the scope of the present framework.
ARTICLE IN PRESSV.S. Deshpande et al. / J. Mech. Phys. Solids 56 (2008) 1484–15101488
where mL is their reference chemical potential at the reference binder concentration xR, k is the Boltzmannconstant, and T the absolute temperature. The first term in Eq. (1) represents the contribution from theinternal energy (enthalpy) and the second is the entropy of mixing (Gaskell, 1973). The ‘‘straight’’configuration of high affinity integrins causes them to be less stable than the ‘‘bent’’ or low affinity state(Cluzel et al., 2005), implying that they have a higher reference potential mH4mL. Moreover, for geometricalreasons, only this straight form interacts with the ligand molecules on the ECM. Consequently, the chemicalpotential wH includes additional contributions from the stretching of the bonds:
wH ¼ mH þ kT ln ðxH=xRÞ þ FðDiÞ � F iDi. (2)
Here F(Di) is the stretch energy stored in the integrin-ligand complex, while the work-conjugate force, Fi, isrelated to the stretch Di by
Fi ¼qFqDi
. (3)
The �FiDi term in Eq. (2) is the mechanical work term that represents the loss in free energy due to thestretch Di of the integrin–ligand by the force Fi. (It is analogous to the pressure–volume term in thethermodynamics of gases.) In molecular terms, the stretch of the ligand–integrin bond stabilizes the adhesioncomplex by lowering the free energy wH. The formulae (1) through (3) are used widely to characterize thethermodynamic states of solids (Gaskell, 1973). The work term in Eq. (3) had been identified previously(Shemesh et al., 2005) as an important constituent of the thermodynamic state of the FAs. However, the termsdue to the stored energy and the configurational entropy have been neglected in these prior assessments. Yet,they are critical constituents of a general thermodynamic framework that explicitly accounts for thecytoskeletal response, including remodeling as a result of contractility, spreading etc.
The kinetics governing the rate of conversion of the low affinity integrins to their high affinity state (and viceversa) are fast compared to all other time-scales involved, implying that the concentrations of the two forms ofthe integrins are governed by thermodynamic equilibrium. Namely, at each location xi on the plasmamembrane:
wH ¼ wL. (4)
Thus, in the absence of any interactions between the integrins and the ligand (an isolated cell withFi ¼ 0; Di !1), the ratio of the steady-state concentrations of the low and high affinity integrins on theplasma membrane is
xLxH¼ exp
mH � mLkT
þg
kT
h i. (5)
Here g � FðDi !1Þ is the surface energy of the high affinity integrins when sufficiently separated from theligand that the interaction force is negligible. Ions (such as Mn2+) reduce the surface energy g and/or thedifference in the reference chemical potential mH�mL between the two integrin states causing the fractionpresent in the high affinity form to increase (Cluzel et al., 2005).
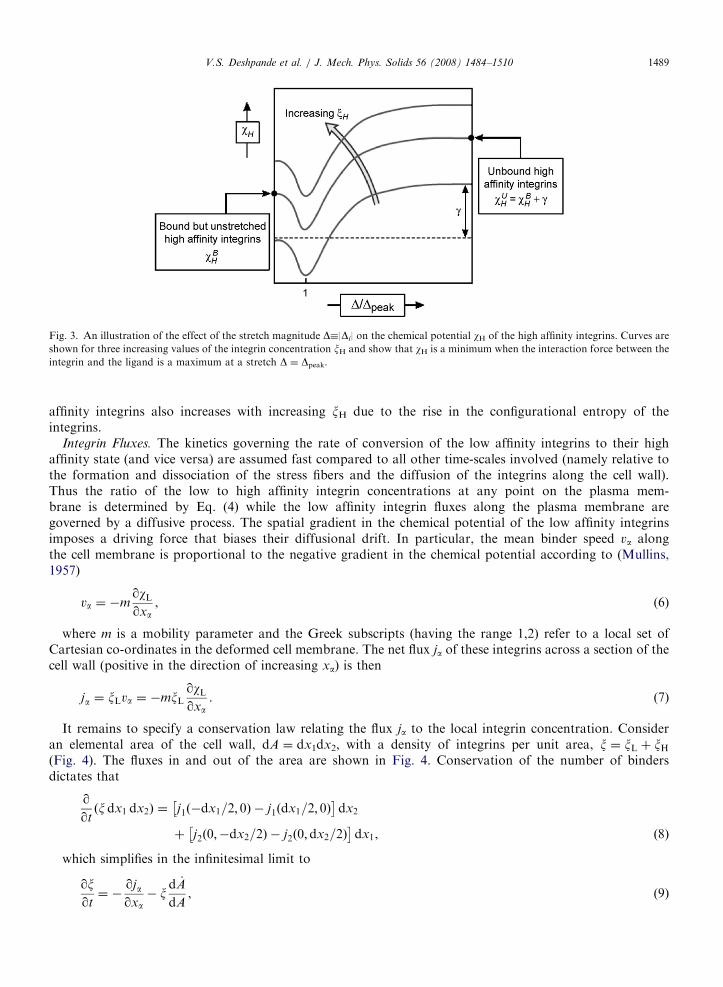
Most previous assessments (Bell, 1978; Bell et al., 1984; Dembo et al., 1988) considered only two statesof the integrin molecules: bound or unbound. The chemical potentials described above clarify that, while thelow affinity state is always unbound, with wL dependent only on the concentration, the state of the highaffinity integrins depends upon the stretch of the integrin-ligand complex. This is illustrated in Fig. 3 wherethe chemical potentialwH is plotted as a function of the magnitude of the stretch D�|Di| of the integrin–ligand complex. Consider the variation of wH with D for a given xH. At D ¼ 0, the integrin is bound to theligand but the complex is unstretched and thus has a chemical potential wB
H ¼ mH þ kT ln ðxH=xRÞ.With increasing stretch D, the force in the complex increases, thereby decreasing wH and stabilizing thecomplex. This continues until the force in the complex reaches a maximum value Fmax at the stretch D ¼ Dpeak.With continued stretching, the force decreases and wH begins to rise: wH asymptotes to the value wU
H ¼ wBH þ g
when the force in the complex is zero and the integrin and ligand are widely separated. This correspondsto the unbound state of the high affinity integrin. As illustrated in Fig. 3 the chemical potential of the high
ARTICLE IN PRESS
Fig. 3. An illustration of the effect of the stretch magnitude D�|Di| on the chemical potential wH of the high affinity integrins. Curves are
shown for three increasing values of the integrin concentration xH and show that wH is a minimum when the interaction force between the
integrin and the ligand is a maximum at a stretch D ¼ Dpeak.
V.S. Deshpande et al. / J. Mech. Phys. Solids 56 (2008) 1484–1510 1489
affinity integrins also increases with increasing xH due to the rise in the configurational entropy of theintegrins.
Integrin Fluxes. The kinetics governing the rate of conversion of the low affinity integrins to their highaffinity state (and vice versa) are assumed fast compared to all other time-scales involved (namely relative tothe formation and dissociation of the stress fibers and the diffusion of the integrins along the cell wall).Thus the ratio of the low to high affinity integrin concentrations at any point on the plasma mem-brane is determined by Eq. (4) while the low affinity integrin fluxes along the plasma membrane aregoverned by a diffusive process. The spatial gradient in the chemical potential of the low affinity integrinsimposes a driving force that biases their diffusional drift. In particular, the mean binder speed va alongthe cell membrane is proportional to the negative gradient in the chemical potential according to (Mullins,1957)
va ¼ �mqwLqxa
, (6)
where m is a mobility parameter and the Greek subscripts (having the range 1,2) refer to a local set ofCartesian co-ordinates in the deformed cell membrane. The net flux ja of these integrins across a section of thecell wall (positive in the direction of increasing xa) is then
ja ¼ xLva ¼ �mxLqwLqxa
. (7)
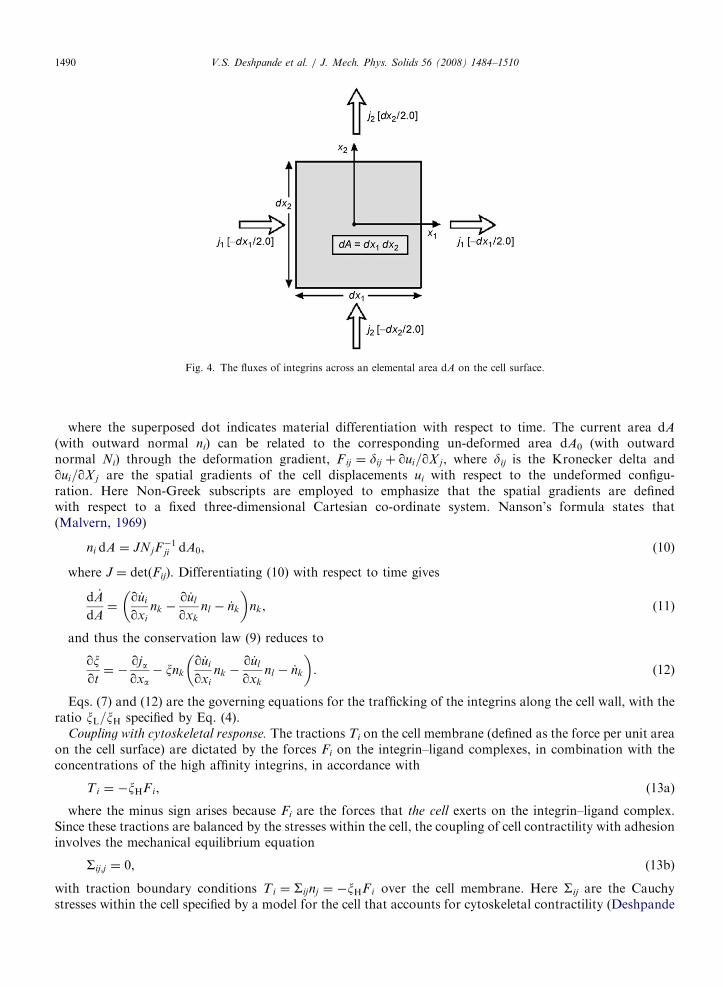
It remains to specify a conservation law relating the flux ja to the local integrin concentration. Consideran elemental area of the cell wall, dA ¼ dx1dx2, with a density of integrins per unit area, x ¼ xL þ xH(Fig. 4). The fluxes in and out of the area are shown in Fig. 4. Conservation of the number of bindersdictates that
qqtðx dx1 dx2Þ ¼ j1ð�dx1=2; 0Þ � j1ðdx1=2; 0Þ
� �dx2
þ j2ð0;�dx2=2Þ � j2ð0;dx2=2Þ� �
dx1, ð8Þ
which simplifies in the infinitesimal limit to
qxqt¼ �
qjaqxa� x
d _A
dA, (9)
ARTICLE IN PRESS
Fig. 4. The fluxes of integrins across an elemental area dA on the cell surface.
V.S. Deshpande et al. / J. Mech. Phys. Solids 56 (2008) 1484–15101490
where the superposed dot indicates material differentiation with respect to time. The current area dA
(with outward normal ni) can be related to the corresponding un-deformed area dA0 (with outwardnormal Ni) through the deformation gradient, Fij ¼ dij þ qui=qX j, where dij is the Kronecker delta andqui=qX j are the spatial gradients of the cell displacements ui with respect to the undeformed configu-ration. Here Non-Greek subscripts are employed to emphasize that the spatial gradients are definedwith respect to a fixed three-dimensional Cartesian co-ordinate system. Nanson’s formula states that(Malvern, 1969)
ni dA ¼ JNjF�1ji dA0, (10)
where J ¼ det(Fij). Differentiating (10) with respect to time gives
d _A
dA¼
q _ui
qxi
nk �q _ul
qxk
nl � _nk
� �nk, (11)
and thus the conservation law (9) reduces to
qxqt¼ �
qjaqxa� xnk
q _ui
qxi
nk �q _ul
qxk
nl � _nk
� �. (12)
Eqs. (7) and (12) are the governing equations for the trafficking of the integrins along the cell wall, with theratio xL=xH specified by Eq. (4).
Coupling with cytoskeletal response. The tractions Ti on the cell membrane (defined as the force per unit areaon the cell surface) are dictated by the forces Fi on the integrin–ligand complexes, in combination with theconcentrations of the high affinity integrins, in accordance with
Ti ¼ �xHFi, (13a)
where the minus sign arises because Fi are the forces that the cell exerts on the integrin–ligand complex.Since these tractions are balanced by the stresses within the cell, the coupling of cell contractility with adhesioninvolves the mechanical equilibrium equation
Sij;j ¼ 0, (13b)
with traction boundary conditions Ti ¼ Sijnj ¼ �xHFi over the cell membrane. Here Sij are the Cauchystresses within the cell specified by a model for the cell that accounts for cytoskeletal contractility (Deshpande
ARTICLE IN PRESS
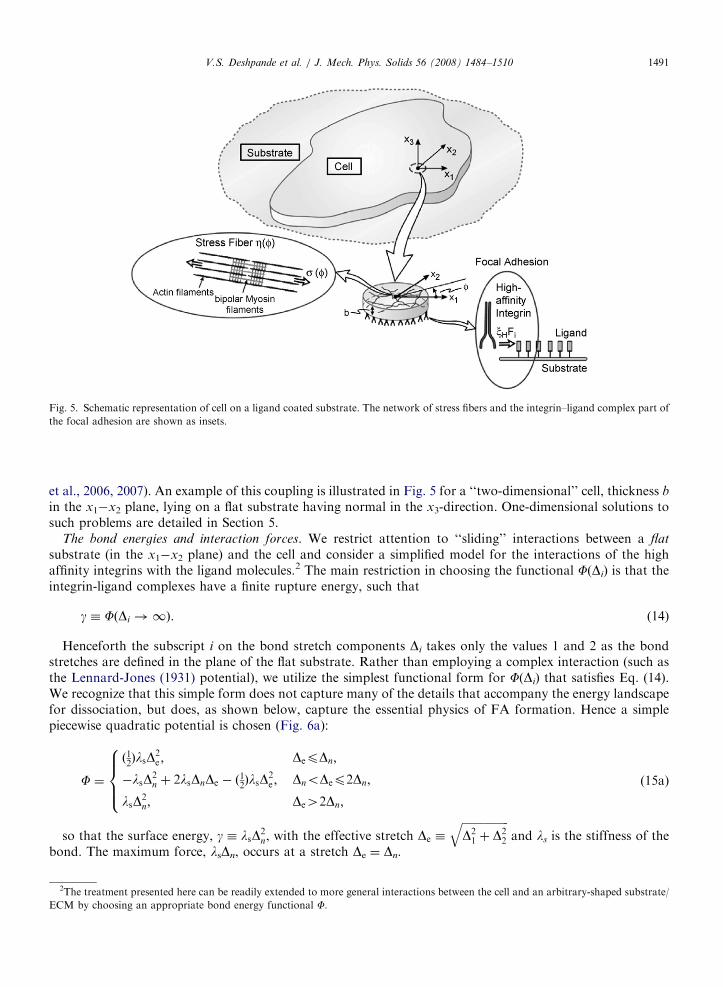
Fig. 5. Schematic representation of cell on a ligand coated substrate. The network of stress fibers and the integrin–ligand complex part of
the focal adhesion are shown as insets.
V.S. Deshpande et al. / J. Mech. Phys. Solids 56 (2008) 1484–1510 1491
et al., 2006, 2007). An example of this coupling is illustrated in Fig. 5 for a ‘‘two-dimensional’’ cell, thickness b
in the x1�x2 plane, lying on a flat substrate having normal in the x3-direction. One-dimensional solutions tosuch problems are detailed in Section 5.
The bond energies and interaction forces. We restrict attention to ‘‘sliding’’ interactions between a flat
substrate (in the x1�x2 plane) and the cell and consider a simplified model for the interactions of the highaffinity integrins with the ligand molecules.2 The main restriction in choosing the functional F(Di) is that theintegrin-ligand complexes have a finite rupture energy, such that
g � FðDi !1Þ. (14)
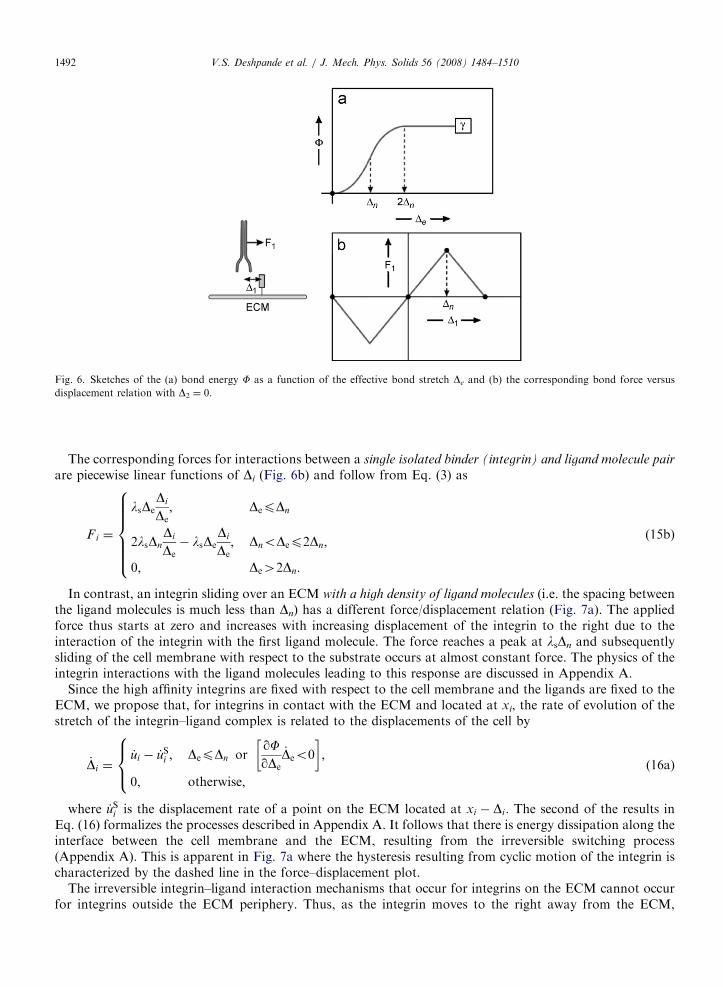
Henceforth the subscript i on the bond stretch components Di takes only the values 1 and 2 as the bondstretches are defined in the plane of the flat substrate. Rather than employing a complex interaction (such asthe Lennard-Jones (1931) potential), we utilize the simplest functional form for F(Di) that satisfies Eq. (14).We recognize that this simple form does not capture many of the details that accompany the energy landscapefor dissociation, but does, as shown below, capture the essential physics of FA formation. Hence a simplepiecewise quadratic potential is chosen (Fig. 6a):
F ¼
ð12ÞlsD
2e ; DepDn;
�lsD2n þ 2lsDnDe � ð
12ÞlsD
2e ; DnoDep2Dn;
lsD2n; De42Dn;
8>><>>: (15a)
so that the surface energy, g � lsD2n, with the effective stretch De �
ffiffiffiffiffiffiffiffiffiffiffiffiffiffiffiffiffiD21 þ D2
2
qand ls is the stiffness of the
bond. The maximum force, lsDn, occurs at a stretch De ¼ Dn.
2The treatment presented here can be readily extended to more general interactions between the cell and an arbitrary-shaped substrate/
ECM by choosing an appropriate bond energy functional F.
ARTICLE IN PRESS
Fig. 6. Sketches of the (a) bond energy F as a function of the effective bond stretch De and (b) the corresponding bond force versus
displacement relation with D2 ¼ 0.
V.S. Deshpande et al. / J. Mech. Phys. Solids 56 (2008) 1484–15101492
The corresponding forces for interactions between a single isolated binder (integrin) and ligand molecule pair
are piecewise linear functions of Di (Fig. 6b) and follow from Eq. (3) as
Fi ¼
lsDeDi
De; DepDn
2lsDnDi
De� lsDe
Di
De; DnoDep2Dn;
0; De42Dn:
8>>>>><>>>>>:
(15b)
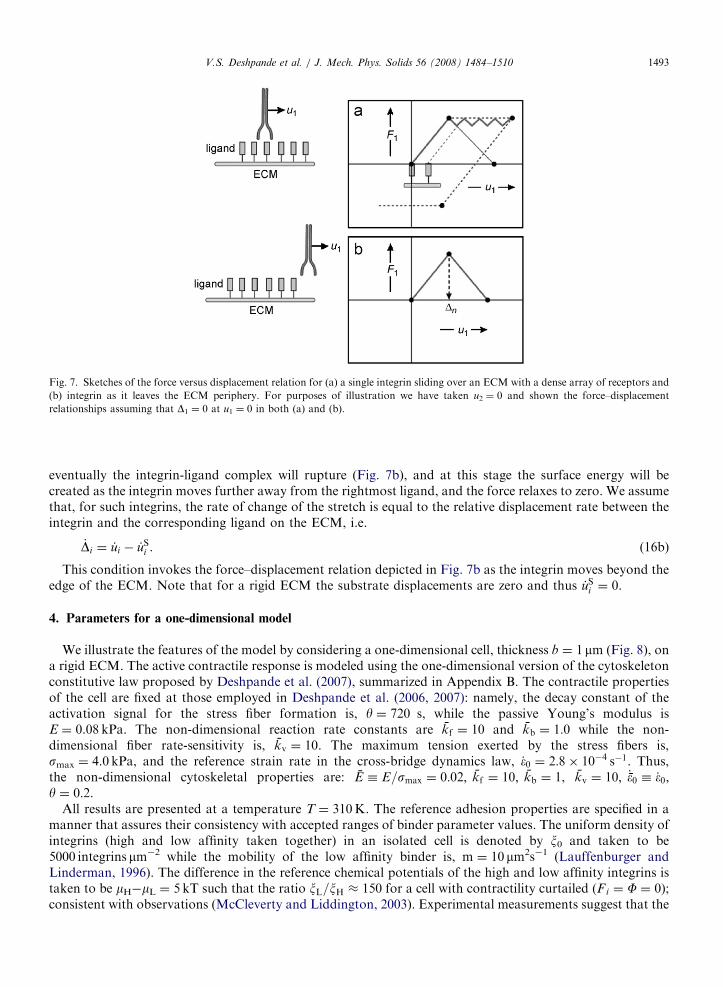
In contrast, an integrin sliding over an ECM with a high density of ligand molecules (i.e. the spacing betweenthe ligand molecules is much less than Dn) has a different force/displacement relation (Fig. 7a). The appliedforce thus starts at zero and increases with increasing displacement of the integrin to the right due to theinteraction of the integrin with the first ligand molecule. The force reaches a peak at lsDn and subsequentlysliding of the cell membrane with respect to the substrate occurs at almost constant force. The physics of theintegrin interactions with the ligand molecules leading to this response are discussed in Appendix A.
Since the high affinity integrins are fixed with respect to the cell membrane and the ligands are fixed to theECM, we propose that, for integrins in contact with the ECM and located at xi, the rate of evolution of thestretch of the integrin–ligand complex is related to the displacements of the cell by
_Di ¼_ui � _uS
i ; DepDn orqFqDe
_Deo0
� �;
0; otherwise;
8><>: (16a)
where _uSi is the displacement rate of a point on the ECM located at xi � Di. The second of the results in
Eq. (16) formalizes the processes described in Appendix A. It follows that there is energy dissipation along theinterface between the cell membrane and the ECM, resulting from the irreversible switching process(Appendix A). This is apparent in Fig. 7a where the hysteresis resulting from cyclic motion of the integrin ischaracterized by the dashed line in the force–displacement plot.
The irreversible integrin–ligand interaction mechanisms that occur for integrins on the ECM cannot occurfor integrins outside the ECM periphery. Thus, as the integrin moves to the right away from the ECM,
ARTICLE IN PRESS
Fig. 7. Sketches of the force versus displacement relation for (a) a single integrin sliding over an ECM with a dense array of receptors and
(b) integrin as it leaves the ECM periphery. For purposes of illustration we have taken u2 ¼ 0 and shown the force–displacement
relationships assuming that D1 ¼ 0 at u1 ¼ 0 in both (a) and (b).
V.S. Deshpande et al. / J. Mech. Phys. Solids 56 (2008) 1484–1510 1493
eventually the integrin-ligand complex will rupture (Fig. 7b), and at this stage the surface energy will becreated as the integrin moves further away from the rightmost ligand, and the force relaxes to zero. We assumethat, for such integrins, the rate of change of the stretch is equal to the relative displacement rate between theintegrin and the corresponding ligand on the ECM, i.e.
_Di ¼ _ui � _uSi . (16b)
This condition invokes the force–displacement relation depicted in Fig. 7b as the integrin moves beyond theedge of the ECM. Note that for a rigid ECM the substrate displacements are zero and thus _uS
i ¼ 0.
4. Parameters for a one-dimensional model
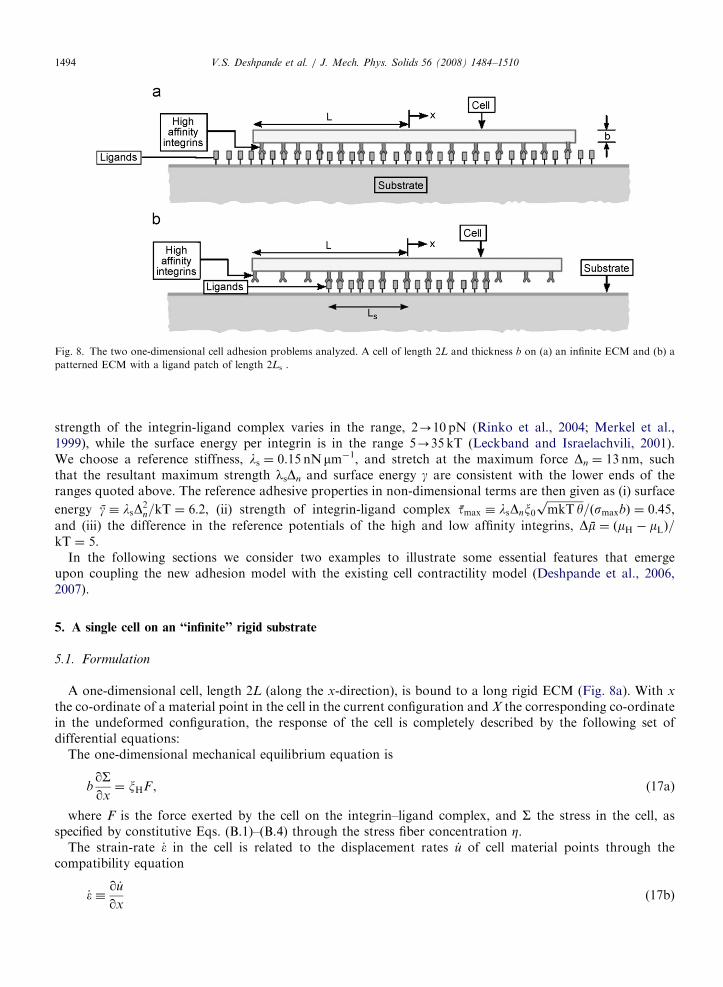
We illustrate the features of the model by considering a one-dimensional cell, thickness b ¼ 1 mm (Fig. 8), ona rigid ECM. The active contractile response is modeled using the one-dimensional version of the cytoskeletonconstitutive law proposed by Deshpande et al. (2007), summarized in Appendix B. The contractile propertiesof the cell are fixed at those employed in Deshpande et al. (2006, 2007): namely, the decay constant of theactivation signal for the stress fiber formation is, y ¼ 720 s, while the passive Young’s modulus isE ¼ 0.08 kPa. The non-dimensional reaction rate constants are kf ¼ 10 and kb ¼ 1:0 while the non-dimensional fiber rate-sensitivity is, kv ¼ 10. The maximum tension exerted by the stress fibers is,smax ¼ 4.0 kPa, and the reference strain rate in the cross-bridge dynamics law, _�0 ¼ 2:8� 10�4 s�1. Thus,the non-dimensional cytoskeletal properties are: E � E=smax ¼ 0:02; kf ¼ 10; kb ¼ 1, kv ¼ 10; _�0 � _�0;y ¼ 0:2.
All results are presented at a temperature T ¼ 310K. The reference adhesion properties are specified in amanner that assures their consistency with accepted ranges of binder parameter values. The uniform density ofintegrins (high and low affinity taken together) in an isolated cell is denoted by x0 and taken to be5000 integrins mm�2 while the mobility of the low affinity binder is, m ¼ 10 mm2s�1 (Lauffenburger andLinderman, 1996). The difference in the reference chemical potentials of the high and low affinity integrins istaken to be mH�mL ¼ 5 kT such that the ratio xL=xH � 150 for a cell with contractility curtailed (Fi ¼ F ¼ 0);consistent with observations (McCleverty and Liddington, 2003). Experimental measurements suggest that the
ARTICLE IN PRESS
Fig. 8. The two one-dimensional cell adhesion problems analyzed. A cell of length 2L and thickness b on (a) an infinite ECM and (b) a
patterned ECM with a ligand patch of length 2Ls .
V.S. Deshpande et al. / J. Mech. Phys. Solids 56 (2008) 1484–15101494
strength of the integrin-ligand complex varies in the range, 2-10 pN (Rinko et al., 2004; Merkel et al.,1999), while the surface energy per integrin is in the range 5-35 kT (Leckband and Israelachvili, 2001).We choose a reference stiffness, ls ¼ 0.15 nN mm�1, and stretch at the maximum force Dn ¼ 13 nm, suchthat the resultant maximum strength lsDn and surface energy g are consistent with the lower ends of theranges quoted above. The reference adhesive properties in non-dimensional terms are then given as (i) surface
energy g � lsD2n=kT ¼ 6:2, (ii) strength of integrin-ligand complex tmax � lsDnx0
ffiffiffiffiffiffiffiffiffiffiffiffiffimkT yp
=ðsmaxbÞ ¼ 0:45,and (iii) the difference in the reference potentials of the high and low affinity integrins, Dm ¼ ðmH � mLÞ=kT ¼ 5.
In the following sections we consider two examples to illustrate some essential features that emergeupon coupling the new adhesion model with the existing cell contractility model (Deshpande et al., 2006,2007).
5. A single cell on an ‘‘infinite’’ rigid substrate
5.1. Formulation
A one-dimensional cell, length 2L (along the x-direction), is bound to a long rigid ECM (Fig. 8a). With x
the co-ordinate of a material point in the cell in the current configuration and X the corresponding co-ordinatein the undeformed configuration, the response of the cell is completely described by the following set ofdifferential equations:
The one-dimensional mechanical equilibrium equation is
bqSqx¼ xHF , (17a)
where F is the force exerted by the cell on the integrin–ligand complex, and S the stress in the cell, asspecified by constitutive Eqs. (B.1)–(B.4) through the stress fiber concentration Z.
The strain-rate _� in the cell is related to the displacement rates _u of cell material points through thecompatibility equation
_� �q _uqx
(17b)

ARTICLE IN PRESSV.S. Deshpande et al. / J. Mech. Phys. Solids 56 (2008) 1484–1510 1495
As the integrins are always in contact with the rigid ECM, the stretch rate is given by the one-dimensionalversion of Eq. (16):
_D ¼_u; jDjpDn or
qFqjDj
_Do0
� �;
0; otherwise:
8><>: (18a)
Since the effective stretch is De � jDj, the integrin-ligand interaction force is given as
F ¼
lsD; jDjpDn;
2lsDnsignðDÞ � lsD DnojDjp2Dn;
0; jDj42Dn:
8><>: (18b)
The potential F is obtained by replacing De with |D| in Eq. (15a).The problem description is completed by specifying the one-dimensional trafficking equations for the
concentration xH of the high affinity integrins. From Eqs. (4), (7) and (12):
qxqt¼ m
qqx
xLqwLqx
� �� x_�, (19a)
where x ¼ xL þ xH, and
wL ¼ mL þ kT lnxLxR¼ mH þ kT ln
xHxRþ FðDÞ � FD. (19b)
For simplicity we assume that the cells are stress and stress fiber free at time t ¼ 0: thus, u ¼ Z ¼ � ¼ S ¼ 0with a single activation signal C imposed at t ¼ 0. Moreover, since the cells are initially stress free, the highaffinity integrin-ligand complexes are un-stretched such that D ¼ 0 everywhere on the cell surface. ThenEq. (19b) gives the uniform concentration of high and low affinity integrins over the cell surface at timet ¼ 0 as
xH ¼x0
1þ xL=xH, (20a)
and
xL ¼x0
1þ xH=xL, (20b)
respectively, where
xHxL¼ exp �
mH � mLkT
h i. (21)
The stress and flux boundary conditions for Eqs. (17) and (19), respectively are
S ¼ 0 and j ¼ �mxLqwLqx¼ 0 at X ¼ �L. (22)
Recall that the cell is symmetric about X ¼ 0, so we only analyze the response over the domain 0pXpL
with symmetry boundary conditions (u ¼ 0; j ¼ 0) imposed at X ¼ 0.The finite element solution technique for these one-dimensional partial differential equations is detailed in
Appendix C. All calculations use a mesh comprising 600 two-node elements with linear interpolationfunctions. The mesh is refined near the edge, X ¼ L, in order to accurately capture large parameter gradientsthere.
5.2. The formation and growth of FAs
The resulting distributions of the high and low affinity integrins as a function of the normalized positionx � x=L are plotted in Figs. 9a and b, respectively, for a cell of length L ¼ 5 mm (normalized length

ARTICLE IN PRESS
Fig. 9. Spatial distributions of the (a) high and (b) low affinity integrin concentrations and (c) normalized tractions exerted by the cell on
the ECM at selected times after the application of the activation signal at t ¼ 0 for the problem sketched in Fig. 8a. The cell length was
taken as L ¼ 5mm ðL ¼ 28Þ and reference properties were employed.
V.S. Deshpande et al. / J. Mech. Phys. Solids 56 (2008) 1484–15101496
L � L=ffiffiffiffiffiffiffiffiffiffiffiffiffimkT yp
¼ 28) at selected times, t � t=y. At time t ¼ 0, concentrations xL/x0 and xH/x0 are spatiallyuniform with xL/xHE150, as specified by Eq. (21). The activation signal applied at t ¼ 0 initiates contractilityin the cell resulting in the ensuing sequence of events.
Step I: Mechanical equilibrium dictates that high tractions T ¼ xHF are developed near the cell edge, atx � 1 (Fig. 9c shows the traction between the cell and the ECM as a function of position x � x=L at varioustimes t � t=y).
ARTICLE IN PRESS
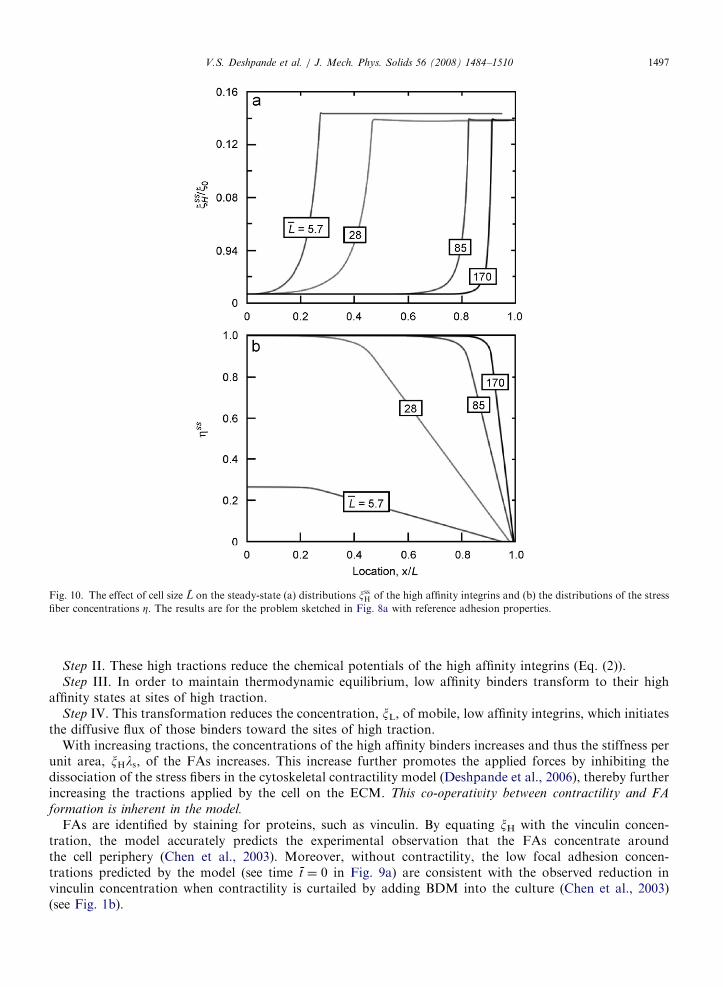
Fig. 10. The effect of cell size L on the steady-state (a) distributions xssH of the high affinity integrins and (b) the distributions of the stress
fiber concentrations Z. The results are for the problem sketched in Fig. 8a with reference adhesion properties.
V.S. Deshpande et al. / J. Mech. Phys. Solids 56 (2008) 1484–1510 1497
Step II. These high tractions reduce the chemical potentials of the high affinity integrins (Eq. (2)).Step III. In order to maintain thermodynamic equilibrium, low affinity binders transform to their high
affinity states at sites of high traction.Step IV. This transformation reduces the concentration, xL, of mobile, low affinity integrins, which initiates
the diffusive flux of those binders toward the sites of high traction.With increasing tractions, the concentrations of the high affinity binders increases and thus the stiffness per
unit area, xHls, of the FAs increases. This increase further promotes the applied forces by inhibiting thedissociation of the stress fibers in the cytoskeletal contractility model (Deshpande et al., 2006), thereby furtherincreasing the tractions applied by the cell on the ECM. This co-operativity between contractility and FA
formation is inherent in the model.
FAs are identified by staining for proteins, such as vinculin. By equating xH with the vinculin concen-tration, the model accurately predicts the experimental observation that the FAs concentrate aroundthe cell periphery (Chen et al., 2003). Moreover, without contractility, the low focal adhesion concen-trations predicted by the model (see time t ¼ 0 in Fig. 9a) are consistent with the observed reduction invinculin concentration when contractility is curtailed by adding BDM into the culture (Chen et al., 2003)(see Fig. 1b).
ARTICLE IN PRESS
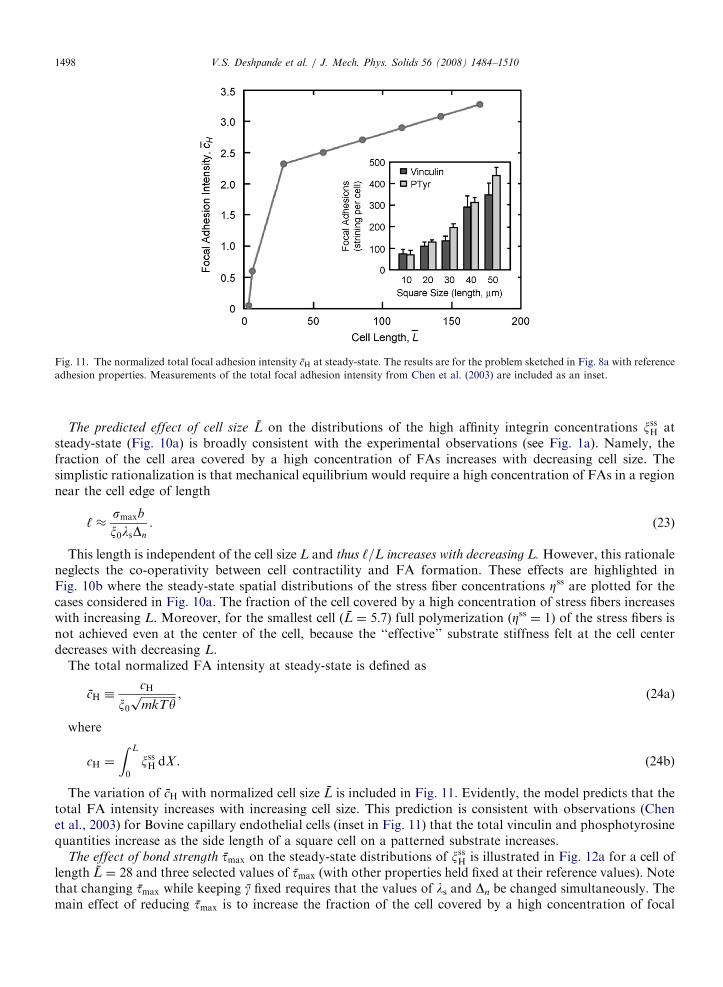
Fig. 11. The normalized total focal adhesion intensity cH at steady-state. The results are for the problem sketched in Fig. 8a with reference
adhesion properties. Measurements of the total focal adhesion intensity from Chen et al. (2003) are included as an inset.
V.S. Deshpande et al. / J. Mech. Phys. Solids 56 (2008) 1484–15101498
The predicted effect of cell size L on the distributions of the high affinity integrin concentrations xssH atsteady-state (Fig. 10a) is broadly consistent with the experimental observations (see Fig. 1a). Namely, thefraction of the cell area covered by a high concentration of FAs increases with decreasing cell size. Thesimplistic rationalization is that mechanical equilibrium would require a high concentration of FAs in a regionnear the cell edge of length
‘ �smaxb
x0lsDn
. (23)
This length is independent of the cell size L and thus ‘=L increases with decreasing L. However, this rationaleneglects the co-operativity between cell contractility and FA formation. These effects are highlighted inFig. 10b where the steady-state spatial distributions of the stress fiber concentrations Zss are plotted for thecases considered in Fig. 10a. The fraction of the cell covered by a high concentration of stress fibers increaseswith increasing L. Moreover, for the smallest cell (L ¼ 5:7) full polymerization (Zss ¼ 1) of the stress fibers isnot achieved even at the center of the cell, because the ‘‘effective’’ substrate stiffness felt at the cell centerdecreases with decreasing L.
The total normalized FA intensity at steady-state is defined as
cH �cH
x0ffiffiffiffiffiffiffiffiffiffiffiffiffimkTyp , (24a)
where
cH ¼
Z L
0
xssH dX . (24b)
The variation of cH with normalized cell size L is included in Fig. 11. Evidently, the model predicts that thetotal FA intensity increases with increasing cell size. This prediction is consistent with observations (Chenet al., 2003) for Bovine capillary endothelial cells (inset in Fig. 11) that the total vinculin and phosphotyrosinequantities increase as the side length of a square cell on a patterned substrate increases.
The effect of bond strength tmax on the steady-state distributions of xssH is illustrated in Fig. 12a for a cell oflength L ¼ 28 and three selected values of tmax (with other properties held fixed at their reference values). Notethat changing tmax while keeping g fixed requires that the values of ls and Dn be changed simultaneously. Themain effect of reducing tmax is to increase the fraction of the cell covered by a high concentration of focal

ARTICLE IN PRESS
Fig. 12. The effect of (a) normalized bond strength tmax and (b) surface energy g on the steady-state distributions of xssH of the high affinity
integrins for the problem sketched in Fig. 8a with L ¼ 28: Unless otherwise specified, the normalized properties are kept fixed at their
reference values.
V.S. Deshpande et al. / J. Mech. Phys. Solids 56 (2008) 1484–1510 1499
adhesions [as predicted by the scaling argument in Eq. (23)]. But tmax has negligible effect on the maximumvalue of xssH because the thermodynamic equilibrium between the low and high affinity binders is primarilygoverned by the rupture energy g of the integrin complex (kept constant in Fig. 12a). The effect of surface
energy g on the steady-state distributions of xssH is shown in Fig. 12b for three selected values of g. Decreasing gnot only increases the fraction of the cell covered by a high concentration of focal adhesions, but also reducesthe maximum values of xssH for the reasons discussed above.
Cell adhesion is typically thought to be either governed by the diffusion of the integrins or by thereceptor–ligand kinetics (Boulbitch et al., 2001). In order to illustrate the effect of low affinity integrin mobility
we re-arrange the non-dimensional groups so that the binder mobility only appears in the non-dimensional celllength, L � L=
ffiffiffiffiffiffiffiffiffiffiffiffiffimkTyp
, and thus re-define the non-dimensional integrin-ligand complex strength as,x0lsDnL=ðsmaxbÞ. The steady-state distributions of xssH are included in Fig. 13 for two values of L and twoof x0lsDnL=ðsmaxbÞ with all other non-dimensional groups held fixed at their reference values. Increasing thebinder mobility by about a factor of 15 (by decreasing L from 28 to 2) only slightly increases the FAconcentrations, as parameterized by xssH for a fixed strength x0lsDnL=ðsmaxbÞ. This insensitivity arises becausethe kinetics of the stress fiber formation and dissociation are much faster than the diffusive processes. Namely,
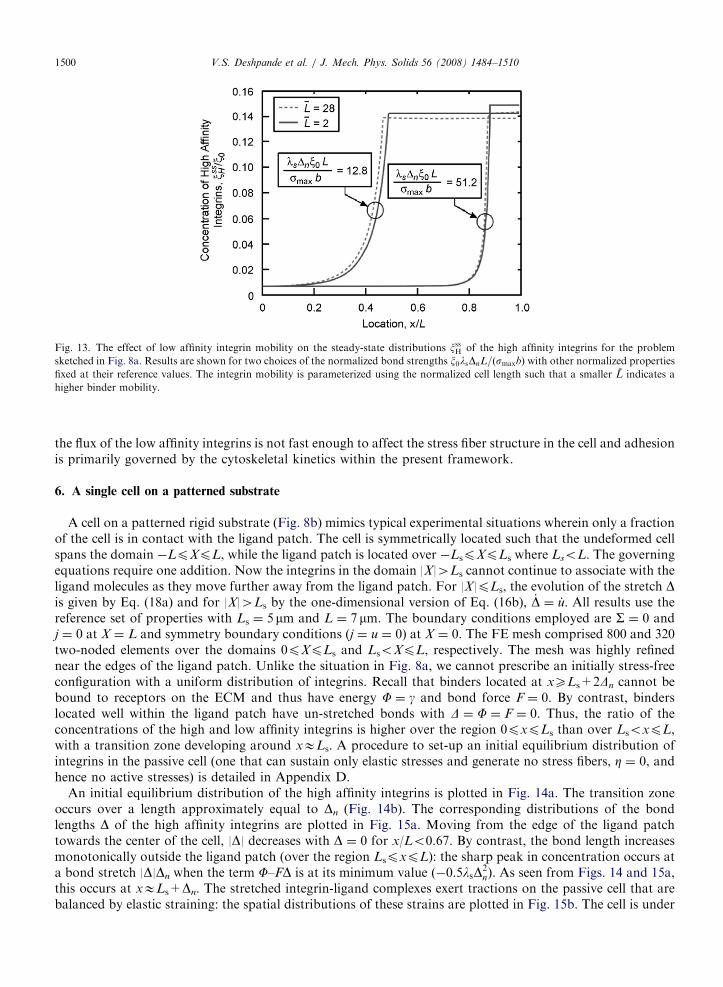
ARTICLE IN PRESS
Fig. 13. The effect of low affinity integrin mobility on the steady-state distributions xssH of the high affinity integrins for the problem
sketched in Fig. 8a. Results are shown for two choices of the normalized bond strengths x0lsDnL=ðsmaxbÞ with other normalized properties
fixed at their reference values. The integrin mobility is parameterized using the normalized cell length such that a smaller L indicates a
higher binder mobility.
V.S. Deshpande et al. / J. Mech. Phys. Solids 56 (2008) 1484–15101500
the flux of the low affinity integrins is not fast enough to affect the stress fiber structure in the cell and adhesionis primarily governed by the cytoskeletal kinetics within the present framework.
6. A single cell on a patterned substrate
A cell on a patterned rigid substrate (Fig. 8b) mimics typical experimental situations wherein only a fractionof the cell is in contact with the ligand patch. The cell is symmetrically located such that the undeformed cellspans the domain �LpXpL, while the ligand patch is located over �LspXpLs where LsoL. The governingequations require one addition. Now the integrins in the domain |X|4Ls cannot continue to associate with theligand molecules as they move further away from the ligand patch. For |X|pLs, the evolution of the stretch Dis given by Eq. (18a) and for |X|4Ls by the one-dimensional version of Eq. (16b), _D ¼ _u. All results use thereference set of properties with Ls ¼ 5 mm and L ¼ 7 mm. The boundary conditions employed are S ¼ 0 andj ¼ 0 at X ¼ L and symmetry boundary conditions (j ¼ u ¼ 0) at X ¼ 0. The FE mesh comprised 800 and 320two-noded elements over the domains 0pXpLs and LsoXpL, respectively. The mesh was highly refinednear the edges of the ligand patch. Unlike the situation in Fig. 8a, we cannot prescribe an initially stress-freeconfiguration with a uniform distribution of integrins. Recall that binders located at xXLs+2Dn cannot bebound to receptors on the ECM and thus have energy F ¼ g and bond force F ¼ 0. By contrast, binderslocated well within the ligand patch have un-stretched bonds with D ¼ F ¼ F ¼ 0. Thus, the ratio of theconcentrations of the high and low affinity integrins is higher over the region 0pxpLs than over LsoxpL,with a transition zone developing around xELs. A procedure to set-up an initial equilibrium distribution ofintegrins in the passive cell (one that can sustain only elastic stresses and generate no stress fibers, Z ¼ 0, andhence no active stresses) is detailed in Appendix D.
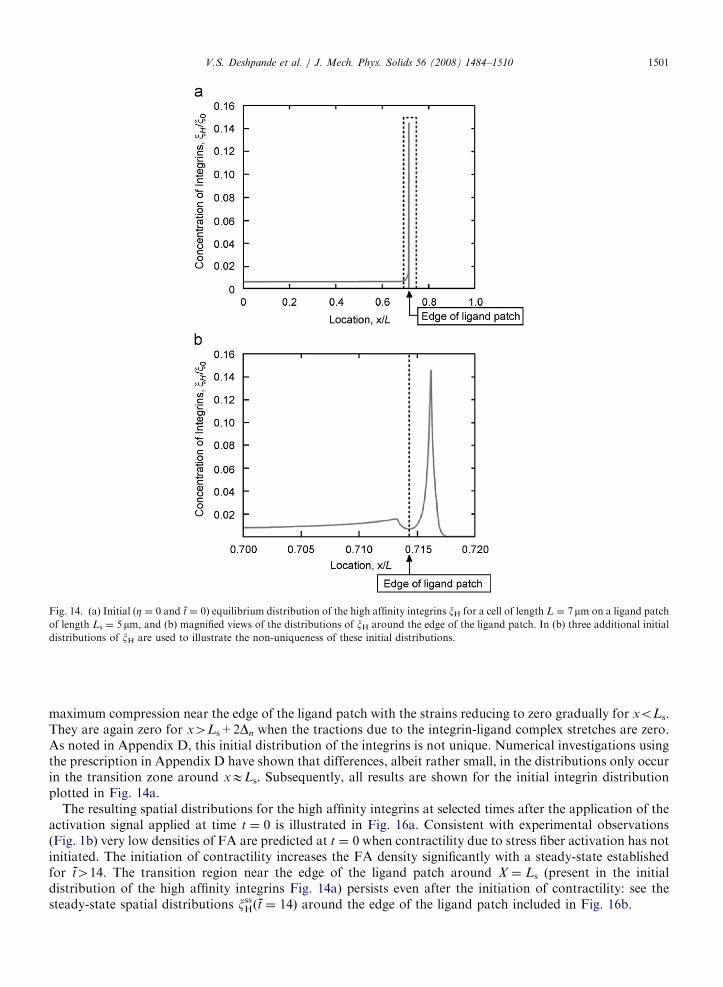
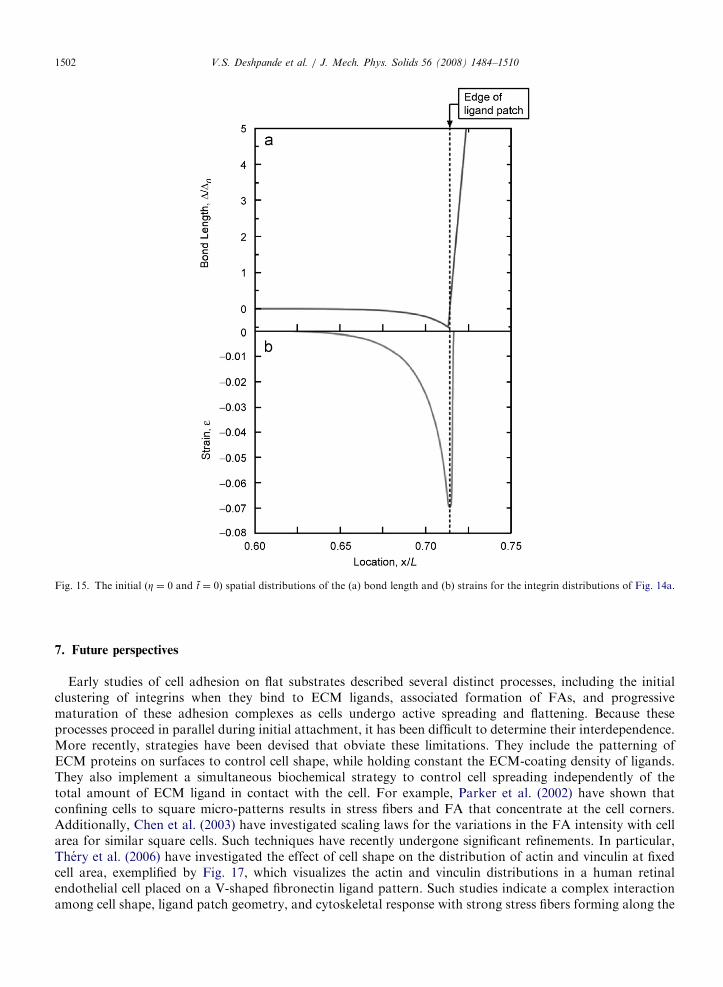
An initial equilibrium distribution of the high affinity integrins is plotted in Fig. 14a. The transition zoneoccurs over a length approximately equal to Dn (Fig. 14b). The corresponding distributions of the bondlengths D of the high affinity integrins are plotted in Fig. 15a. Moving from the edge of the ligand patchtowards the center of the cell, |D| decreases with D ¼ 0 for x/Lo0.67. By contrast, the bond length increasesmonotonically outside the ligand patch (over the region LspxpL): the sharp peak in concentration occurs ata bond stretch |D|Dn when the term F–FD is at its minimum value ð�0:5lsD
2nÞ. As seen from Figs. 14 and 15a,
this occurs at xELs+Dn. The stretched integrin-ligand complexes exert tractions on the passive cell that arebalanced by elastic straining: the spatial distributions of these strains are plotted in Fig. 15b. The cell is under
ARTICLE IN PRESS
Fig. 14. (a) Initial (Z ¼ 0 and t ¼ 0) equilibrium distribution of the high affinity integrins xH for a cell of length L ¼ 7mm on a ligand patch
of length Ls ¼ 5 mm, and (b) magnified views of the distributions of xH around the edge of the ligand patch. In (b) three additional initial
distributions of xH are used to illustrate the non-uniqueness of these initial distributions.
V.S. Deshpande et al. / J. Mech. Phys. Solids 56 (2008) 1484–1510 1501
maximum compression near the edge of the ligand patch with the strains reducing to zero gradually for xoLs.They are again zero for x4Ls+2Dn when the tractions due to the integrin-ligand complex stretches are zero.As noted in Appendix D, this initial distribution of the integrins is not unique. Numerical investigations usingthe prescription in Appendix D have shown that differences, albeit rather small, in the distributions only occurin the transition zone around xELs. Subsequently, all results are shown for the initial integrin distributionplotted in Fig. 14a.
The resulting spatial distributions for the high affinity integrins at selected times after the application of theactivation signal applied at time t ¼ 0 is illustrated in Fig. 16a. Consistent with experimental observations(Fig. 1b) very low densities of FA are predicted at t ¼ 0 when contractility due to stress fiber activation has notinitiated. The initiation of contractility increases the FA density significantly with a steady-state establishedfor t414. The transition region near the edge of the ligand patch around X ¼ Ls (present in the initialdistribution of the high affinity integrins Fig. 14a) persists even after the initiation of contractility: see thesteady-state spatial distributions xssHðt ¼ 14Þ around the edge of the ligand patch included in Fig. 16b.
ARTICLE IN PRESS
Fig. 15. The initial (Z ¼ 0 and t ¼ 0) spatial distributions of the (a) bond length and (b) strains for the integrin distributions of Fig. 14a.
V.S. Deshpande et al. / J. Mech. Phys. Solids 56 (2008) 1484–15101502
7. Future perspectives
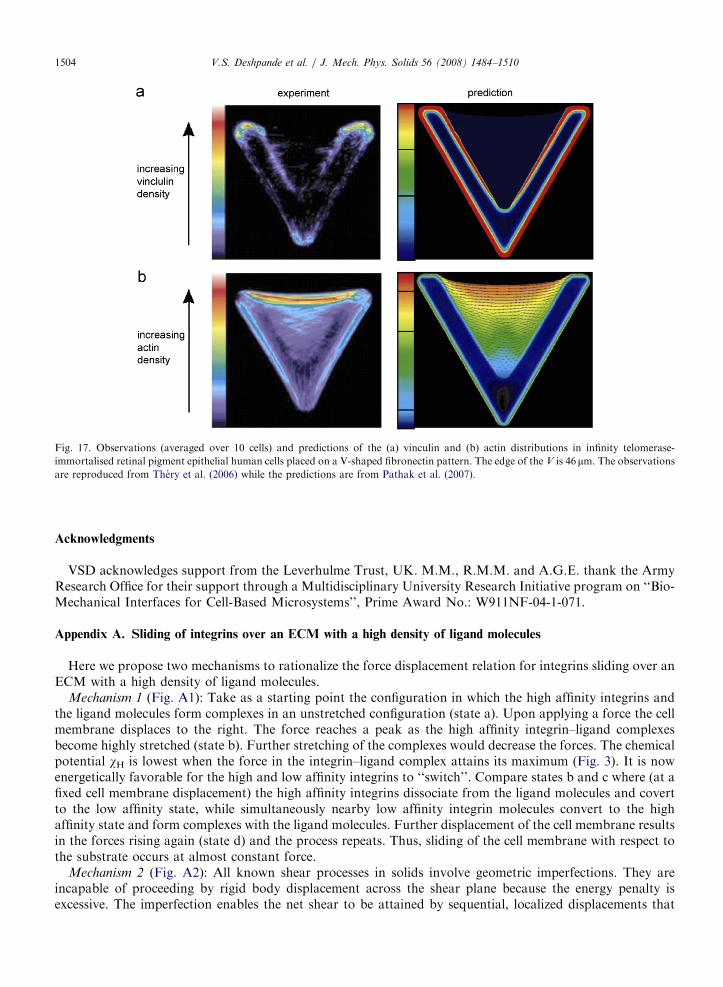
Early studies of cell adhesion on flat substrates described several distinct processes, including the initialclustering of integrins when they bind to ECM ligands, associated formation of FAs, and progressivematuration of these adhesion complexes as cells undergo active spreading and flattening. Because theseprocesses proceed in parallel during initial attachment, it has been difficult to determine their interdependence.More recently, strategies have been devised that obviate these limitations. They include the patterning ofECM proteins on surfaces to control cell shape, while holding constant the ECM-coating density of ligands.They also implement a simultaneous biochemical strategy to control cell spreading independently of thetotal amount of ECM ligand in contact with the cell. For example, Parker et al. (2002) have shown thatconfining cells to square micro-patterns results in stress fibers and FA that concentrate at the cell corners.Additionally, Chen et al. (2003) have investigated scaling laws for the variations in the FA intensity with cellarea for similar square cells. Such techniques have recently undergone significant refinements. In particular,Thery et al. (2006) have investigated the effect of cell shape on the distribution of actin and vinculin at fixedcell area, exemplified by Fig. 17, which visualizes the actin and vinculin distributions in a human retinalendothelial cell placed on a V-shaped fibronectin ligand pattern. Such studies indicate a complex interactionamong cell shape, ligand patch geometry, and cytoskeletal response with strong stress fibers forming along the

ARTICLE IN PRESS
Fig. 16. (a) Spatial distributions of the high affinity integrins at selected times after the application of the activation signal at time t ¼ 0.
(b) Magnified view of the steady-state distributions xssH around the edge of the ligand patch. Results are shown for the initial distribution
xH plotted in Fig. 14.
V.S. Deshpande et al. / J. Mech. Phys. Solids 56 (2008) 1484–1510 1503
non-adhesive edges and high FA densities along the edges of the ligand patch. The coupled cytoskeletalcontractility and FA model developed here is sufficiently general to enable us to make quantitative predictionsof such experiments.
An initial two-dimensional prediction based on the current model from Pathak et al. (2007) is included inFig. 17 which plots distributions of the high affinity integrin concentrations and distributions of the stress fiberdensity or equivalently actin density. Also included with the predicted stress fiber distributions are linesegments showing the ‘‘effective’’ direction of the stress fiber. The predictions are remarkably consistent withobservations: (i) since the cell exerts maximum tractions on the ECM near the edges of the ligand patch, highFA densities are predicted in this region and (ii) aligned stress fibers form along the non-adhesive edge; seePathak et al. (2007) for details and interpretation of the analysis. Finally we note that the framework presentedhere is generic and can be extended to the full three-dimensional case by combining the present model with athree–dimensional traction–separation law for receptor-ligand binding as proposed recently by Liu et al.(2007).
ARTICLE IN PRESS
Fig. 17. Observations (averaged over 10 cells) and predictions of the (a) vinculin and (b) actin distributions in infinity telomerase-
immortalised retinal pigment epithelial human cells placed on a V-shaped fibronectin pattern. The edge of the V is 46 mm. The observations
are reproduced from Thery et al. (2006) while the predictions are from Pathak et al. (2007).
V.S. Deshpande et al. / J. Mech. Phys. Solids 56 (2008) 1484–15101504
Acknowledgments
VSD acknowledges support from the Leverhulme Trust, UK. M.M., R.M.M. and A.G.E. thank the ArmyResearch Office for their support through a Multidisciplinary University Research Initiative program on ‘‘Bio-Mechanical Interfaces for Cell-Based Microsystems’’, Prime Award No.: W911NF-04-1-071.
Appendix A. Sliding of integrins over an ECM with a high density of ligand molecules
Here we propose two mechanisms to rationalize the force displacement relation for integrins sliding over anECM with a high density of ligand molecules.
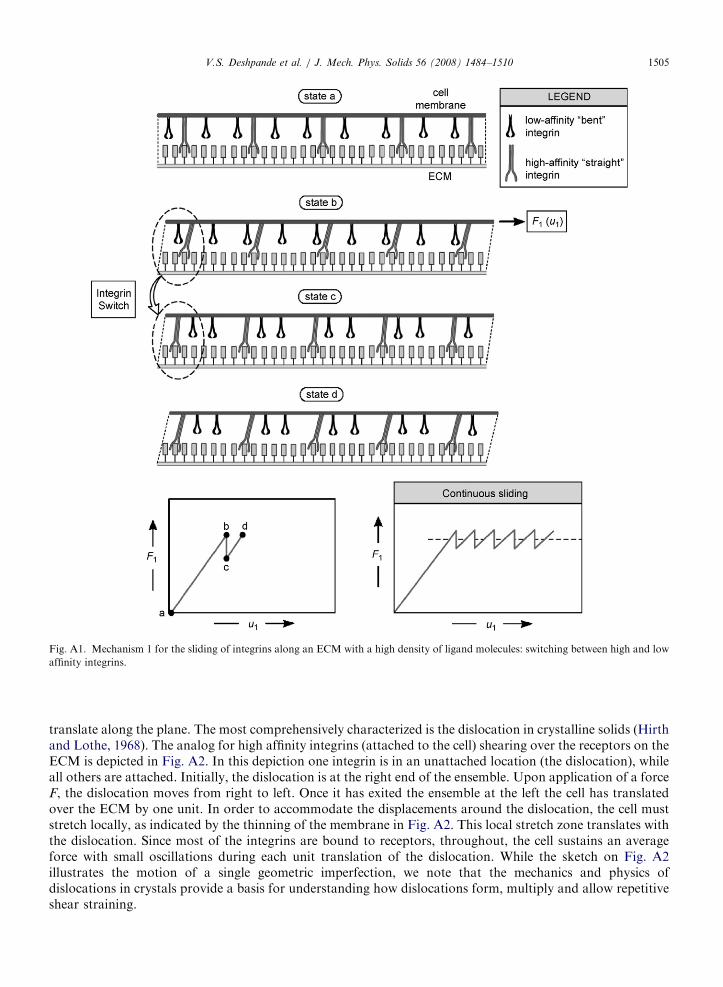
Mechanism 1 (Fig. A1): Take as a starting point the configuration in which the high affinity integrins andthe ligand molecules form complexes in an unstretched configuration (state a). Upon applying a force the cellmembrane displaces to the right. The force reaches a peak as the high affinity integrin–ligand complexesbecome highly stretched (state b). Further stretching of the complexes would decrease the forces. The chemicalpotential wH is lowest when the force in the integrin–ligand complex attains its maximum (Fig. 3). It is nowenergetically favorable for the high and low affinity integrins to ‘‘switch’’. Compare states b and c where (at afixed cell membrane displacement) the high affinity integrins dissociate from the ligand molecules and covertto the low affinity state, while simultaneously nearby low affinity integrin molecules convert to the highaffinity state and form complexes with the ligand molecules. Further displacement of the cell membrane resultsin the forces rising again (state d) and the process repeats. Thus, sliding of the cell membrane with respect tothe substrate occurs at almost constant force.
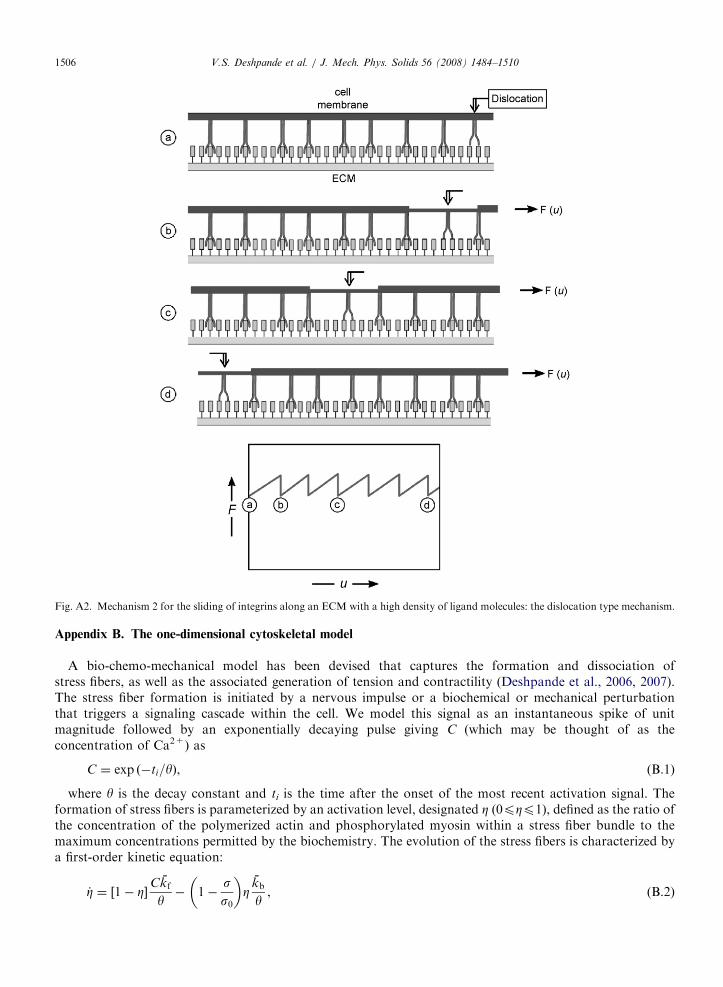
Mechanism 2 (Fig. A2): All known shear processes in solids involve geometric imperfections. They areincapable of proceeding by rigid body displacement across the shear plane because the energy penalty isexcessive. The imperfection enables the net shear to be attained by sequential, localized displacements that
ARTICLE IN PRESS
Fig. A1. Mechanism 1 for the sliding of integrins along an ECM with a high density of ligand molecules: switching between high and low
affinity integrins.
V.S. Deshpande et al. / J. Mech. Phys. Solids 56 (2008) 1484–1510 1505
translate along the plane. The most comprehensively characterized is the dislocation in crystalline solids (Hirthand Lothe, 1968). The analog for high affinity integrins (attached to the cell) shearing over the receptors on theECM is depicted in Fig. A2. In this depiction one integrin is in an unattached location (the dislocation), whileall others are attached. Initially, the dislocation is at the right end of the ensemble. Upon application of a forceF, the dislocation moves from right to left. Once it has exited the ensemble at the left the cell has translatedover the ECM by one unit. In order to accommodate the displacements around the dislocation, the cell muststretch locally, as indicated by the thinning of the membrane in Fig. A2. This local stretch zone translates withthe dislocation. Since most of the integrins are bound to receptors, throughout, the cell sustains an averageforce with small oscillations during each unit translation of the dislocation. While the sketch on Fig. A2illustrates the motion of a single geometric imperfection, we note that the mechanics and physics ofdislocations in crystals provide a basis for understanding how dislocations form, multiply and allow repetitiveshear straining.
ARTICLE IN PRESS
Fig. A2. Mechanism 2 for the sliding of integrins along an ECM with a high density of ligand molecules: the dislocation type mechanism.
V.S. Deshpande et al. / J. Mech. Phys. Solids 56 (2008) 1484–15101506
Appendix B. The one-dimensional cytoskeletal model
A bio-chemo-mechanical model has been devised that captures the formation and dissociation ofstress fibers, as well as the associated generation of tension and contractility (Deshpande et al., 2006, 2007).The stress fiber formation is initiated by a nervous impulse or a biochemical or mechanical perturbationthat triggers a signaling cascade within the cell. We model this signal as an instantaneous spike of unitmagnitude followed by an exponentially decaying pulse giving C (which may be thought of as theconcentration of Ca2+) as
C ¼ exp ð�ti=yÞ, (B.1)
where y is the decay constant and ti is the time after the onset of the most recent activation signal. Theformation of stress fibers is parameterized by an activation level, designated Z (0pZp1), defined as the ratio ofthe concentration of the polymerized actin and phosphorylated myosin within a stress fiber bundle to themaximum concentrations permitted by the biochemistry. The evolution of the stress fibers is characterized bya first-order kinetic equation:
_Z ¼ 1� Z½ �Ckf
y� 1�
ss0
� �Z
kb
y, (B.2)
ARTICLE IN PRESSV.S. Deshpande et al. / J. Mech. Phys. Solids 56 (2008) 1484–1510 1507
where the overdot denotes time-differentiation. In this formula, s is the tension in the stress fiber bundle ,while s0�Zsmax is the corresponding isometric stress at activation level Z, with smax being the tensile stress atfull activation (Z ¼ 1). The dimensionless constants kf and kb govern the rates of stress fiber formation anddissociation, respectively. In turn, the stress s is related to the fiber contraction/extension strain rate _� by thecross-bridge cycling between the actin and myosin filaments. The simplified (but adequate) version of the Hill-like (Hill, 1938) equation employed to model these dynamics is specified as
ss0¼
0;_�
_�0o�
Zkv
;
1þkv
Z_�
_�0
� �; �
Zkv
p_�
_�0p0
1;_�
_�040;
;
8>>>>>>><>>>>>>>:
(B.3)
where the rate sensitivity coefficient, kv, is the fractional reduction in fiber stress upon increasing theshortening rate by _�0.
The constitutive description for the cell is completed by including contributions from passive elasticity,attributed to intermediate filaments of the cytoskeleton attached to the nuclear and plasma membranes. Theseact in parallel with the active elements, whereupon additive decomposition gives the total stress:
S ¼ sþ E�, (B.4)
where (for a linear passive response) E is Young’s modulus and � �R t
0_�dt. In Section 5, we use only this
one-dimensional version of the constitutive model that has been generalized to two and three dimensions byDeshpande et al. (2007).
Appendix C. Details of the finite element implementation
The numerical solution of the one-dimensional adhesion problem requires the coupled solution of themechanical equilibrium Eq. (17) and the diffusion Eq. (19). We solve the weak forms of the partial differentialEqs. (17) and (19) using a finite element method in an updated-Lagrangian setting and couple them using astaggered approach as described below.
With boundary conditions u ¼ 0 and S ¼ 0 at x ¼ 0 and x ¼ Lt, respectively, the weak form of Eq. (17) attime t is given as
b
Z Lt
0
Sqdu
qxdx ¼ �
Z Lt
0
xHFdu dx, (C.1)
where Lt is the half-length of the cell at time t and du are arbitrary variations of the displacements u.Similarly, using the boundary conditions �mqxL=qx ¼ 0 at x ¼ 0 and x ¼ Lt (i.e. zero flux boundaryconditions), the weak form of the diffusion Eq. (19) is written asZ Lt
0
ð1þ aÞqxLqt
dxL dx ¼ �mkT
Z Lt
0
qxLqx
qdxLqx
dx�
Z Lt
0
ð1þ aÞxL_�dxL dx�
Z Lt
0
_axLdxL dx, (C.2)
where dxL are arbitrary variations of the concentrations of the low affinity integrins and
a � expmL � mH � Fþ FD
kT
� �. (C.3)
We solve Eqs. (C.1) and (C.2) using a finite element method comprising 2-node elements with linearinterpolation functions. Time integration of Eqs. (C.1) and (C.2) is performed using a fixed time step Dt asfollows:
(i)
Over the time step Dt, the concentrations xH are assumed to remain fixed and the stresses, displacementsand stretches D at time t+Dt obtained by solving Eq. (C.1) using a Newton–Raphson scheme. Here, the
ARTICLE IN PRESS
3N
V.S. Deshpande et al. / J. Mech. Phys. Solids 56 (2008) 1484–15101508
constitutive equations for S (as specified in Appendix B) are integrated from t to t+Dt using a adaptivetime-stepping 5th order Runge–Kutta scheme3 with an integration tolerance of ek ¼ 0.001.
(ii)
The concentrations xH and xL are then updated over the time interval Dt by integrating the spatiallydiscretized version of Eq. (C.2) with an adaptive 5th order Runge–Kutta scheme again with ek ¼ 0.001. Inperforming this integration we assume that the strain rate _� remains constant over the time interval Dt,while the stretch D varies linearly from its value at t to t+Dt.A displacement based convergence criterion given by
jcmaxjp�rjDumaxj, (C.4)
was adopted for the Newton–Raphson scheme in the solution of Eq. (C.1). Here cmax is the largest change inthe displacement degree of freedom of any node in the current Newton iteration and Dumax is the maximumincremental change in the displacement degree of freedom of any node over the current time increment. Thetolerance er was set to 0.005 in all calculations.
Note that here we have used a staggered solution approach, where the concentrations xH are assumed toremain fixed while integrating Eq. (C.1) over a time interval Dt. Numerical experimentation revealed that suchan approach suffices for the parameter range used in this study with time steps Dto5.0 s. Recall that the time-scales associated with the diffusion process are much larger than those associated with the stress fiber kineticsfor the parameters employed here and thus, such a decoupling of the mechanical equilibrium equation fromthe diffusion equation gives sufficiently accurate results. In all calculations presented here we employ a timestep Dto1.0 s.
Appendix D. Specification of initial conditions for a cell on a patterned substrate
The integrins distributed over the cell membrane interact with the ECM and their initial distributiondepends on the mechanical and chemical loading history that the cell has been subjected to. Here we do notconsider the details of this history but instead, given a set of cell properties, choose a set of initial conditionsthat satisfy the following basic criteria:
(i)
the low and high affinity integrins are in thermodynamic equilibrium wL�wH ¼ 0 at every point on the cellmembrane,(ii)
the low affinity integrins are in thermodynamic equilibrium spatially, i.e. the flux j ¼ 0 at all points on thecell surface, and(iii)
the cell is in mechanical equilibrium.In addition, we require that there are no spatial discontinuities in the concentration of the high affinityintegrins (or equivalently in the stretches D) and thus specify that the gradients qxH=qx (and qD=qx) are welldefined over the cell surface. This constraint is rationalized by noting that an ‘‘ordered’’ (or equivalently lowentropy) distribution corresponding to step changes in xH or D is unlikely to result from an arbitrarymechanical and chemical loading of the cell for time to0 as the system is expected to maximize its entropy.Note that these constraints do not specify a unique initial state, given a cell and substrate geometry andmaterial properties. Rather the mechanical and chemical loading history will determine the precise initialconditions.
The initial conditions used in the results in Section 4.2 and plotted in Fig. 14 were obtained using thefollowing relaxation scheme. The cell is modeled as an elastic solid and the stretches specified as
D ¼0; if jX jpð1� BÞLs
X � signðX Þð1� BÞLs otherwise;
((D.1)
where the non-dimensional parameter B varies between 0pBpDn=Ls. The corresponding densities of thehigh and low affinity integrins are then given in Eqs. (20a) and (20b), respectively. Thermodynamic
umerical Recipes in FORTRAN 77, The Art of Scientific Computing, 1993, Cambridge University Press.
ARTICLE IN PRESSV.S. Deshpande et al. / J. Mech. Phys. Solids 56 (2008) 1484–1510 1509
equilibrium between the high and low affinity integrins requires that xH=xL ¼ a, as specified by Eq. (C.3).A configuration in mechanical equilibrium (boundary conditions u ¼ 0 at X ¼ 0 and S ¼ 0 at X ¼ L) is thenobtained by solving Eq. (C.1) without permitting the diffusive flux of the low affinity integrins. Thus, Eq. (C.1)reduces to
b
Z Lt
0
X qdu
qxdx ¼ �
Z Lt
0
x01þ a
Fdu dx, (D.2)
with a given in Eq. (C.3) and for the elastic cell S ¼ Ee. The outcome is a system in mechanical equilibriumbut with a spatially non-uniform distribution of low affinity integrins. This system is allowed to relax bysolving the coupled mechanical equilibrium and diffusion equations as detailed in Appendix C, but with thecell modeled as a linear elastic solid. The final initial conditions to the simulations of Section 5.2 are obtainedwhen a spatially uniform distribution of low affinity integrins emerges. The initial distribution of the highaffinity binders plotted in Fig. 14 is obtained using B ¼ Dn=Ls.
References
Balaban, N.Q., Schwarz, U.S., Riveline, D., Goichberg, P., Tzur, G., Sabanay, I., Mahalu, D., Safran, S., Bershadskay, A., Addadi, L.,
Geiger, B., 2001. Force and focal adhesion assembly: a close relationship studied using elastic micropatterned substrates. Nat. Cell
Biol. 3, 466–472.
Bell, G.I., 1978. Models for the specific adhesions of cells to cells. Science 200, 618–627.
Bell, G.I., Dembo, M., Bongrand, P., 1984. Cell adhesion. Biophys. J. 45, 1051–1064.
Bershadsky, A.D., Balaban, N.Q., Geiger, B., 2003. Adhesion dependent cell mechanosensitivity. Annu. Rev. Cell Dev. Biol 19, 677–695.
Boulbitch, A., Guttenberg, Z., Sackmann, E., 2001. Kinetics of membrane adhesion mediated by ligand-receptor interaction studied with a
biomimetic system. Biophys. J 81, 2743–2751.
Brock, A., Chang, E., Ho, C.-C., Leduc, P., Jiang, X., Whitesides, G.M., Ingber, D.E., 2003. Geometric determinants of directional cell
motility revealed using microcontact printing. Langmuir 19, 1611–1617.
Burridge, K., Chrzanowska-Wodnicka, M., 1996. Focal adhesions, contractility and signaling. Annu. Rev. Cell Dev. Biol. 12, 463–469.
Carman, C.V., Springer, T.A., 2003. Integrin avidity regulation: are changes in affinity and conformation underemphasized? Curr.
Opinion Cell Biol. 15, 547–556.
Chen, C.S., Alonso, J.L., Ostuni, E., Whitesides, G.M., Ingber, D.E., 2003. Cell shape provides global control of focal adhesion assembly.
Biochem. Biophys. Res. Commun. 307, 355–361.
Cluzel, C., Saltel, F., Lussi, J., Paulhe, F., Imhof, B.A., Wehrle-Haller, B., 2005. The mechanisms and dynamics of avb3 integrin clustering
in living cells. J. Cell Biol. 171, 383–392.
Dembo, M., Torney, D.C., Saxman, K., Hammer, D., 1988. The reaction-limited kinetics of membrane-to-surface adhesion and
detachment. Proc. R. Soc., B 234, 55–83.
Deshpande, V.S., McMeeking, R.M., Evans, A.G., 2006. A bio-chemo-mechanical model for cell contractility. Proc. Nat. Acad. Sci. USA
103, 14015–14020.
Deshpande, V.S., McMeeking, R.M., Evans, A.G., 2007. A model for the contractility of the cytoskeleton including the effects of stress
fiber formation and dissociation. Proc. R. Soc., London, A 463, 787–815.
Evans, E.A., 1985. Detailed mechanics of membrane-membrane adhesion and separation. I. Continuum of molecular cross-bridges.
Biophys. J. 48, 175–183.
Freund, L.B., Lin, Y., 2004. The role of binder mobility in spontaneous adhesive contact and implications for cell adhesion. J. Mech. Phys.
Solids 52, 2455–2472.
Gaskell, D.R., 1973. Introduction to Metallurgical Thermodynamics. McGraw-Hill.
Hill, A.V., 1938. The heat of shortening and the dynamic constants of muscle. Proc. R. Soc., London. B 126, 136–195.
Hirth, J.P., Lothe, J., 1968. Theory of Dislocations. McGraw-Hill, New York.
Hotchin, N.A., Hall, A., 1995. The assembly of integrin adhesion complexes requires both extracellular matrix and intracellular Rho/Rac
GTPases. J. Cell Biol. 131, 1857–1865.
Hynes, R.O., 1992. Integrins: versatility, modulation and signalling in cell adhesion. Cell 69, 11–25.
Irvine, D.J., Hue, K.-A., Mayes, A.M., Griffith, L.G., 2002. Simulations of cell-surface integrin binding to nanoscale clustered adhesion
ligands. Biophys. J. 82, 120–132.
Lauffenburger, D.A., Linderman, J., 1996. Receptors. Models for Binding, Trafficking, and Signaling. Oxford University Press, UK.
Leckband, D., Israelachvili, J., 2001. Intermolecular forces in biology. Q. Rev. Biophys. 34, 105–267.
Lennard-Jones, J.E., 1931. Cohesion. Proc. Phys. Soc. 43, 461–482.
Liu, P., Zhang, Y.W., Cheng, Q.H., Lu, C., 2007. Simulations of the spreading of a vesicle on a substrate surface mediated by
receptor–ligand binding. J. Mech. Phys. Solids. 55, 1166–1181.
Lodish, H., Berk, A., Matsudaira, P., Kaiser, C.A., Krieger, M., Scott, M.P., Zipursky, S.L., Darnell, J., 2004. Molecular Cell Biology.
W.H. Freeman & Co., USA.

ARTICLE IN PRESSV.S. Deshpande et al. / J. Mech. Phys. Solids 56 (2008) 1484–15101510
Malvern, L.E., 1969. Introduction to the mechanics of a continuum medium. Prentice-Hall, Englewood Cliffs, NJ, USA.
McCleverty, C.J., Liddington, R.C., 2003. Engineered allosteric mutants of the integrin aMb2 I domain: structural and functional studies.
Biochem. J. 372, 121–127.
Merkel, R., Nassoy, P., Leung, A., Ritchie, K., Evans, E., 1999. Energy landscapes of receptor–ligand bonds explored with dynamic force
spectroscopy. Nature 397, 50–53.
Mullins, W.W., 1957. Theory of thermal grooving. J. Appl. Phy. 28, 333–339.
Nicolas, A., Safran, S.A., 2006. Limitation of cell adhesion by the elasticity of the extracellular matrix. Biophys. J. 91, 61–73.
Nicolas, A., Geiger, B., Safran, S.A., 2004. Cell mechanosensitivity controls the anisotropy of focal adhesions. Proc. Nat. Acad. Sci. USA
101, 12520–12525.
Novak, I.L., Slepchenko, B.M., Mogilner, A., Loew, L.M., 2004. Cooperativity between cell contractility and adhesion. Phys. Rev. Lett.
93, 268109-1–268109-4.
Parker, K.K., Brock, A.L., Brangwynne, C., Mannix, R.J., Wang, N., Ostuni, E., Geisse, N.A., Adams, J.C., Whitesides, G.M., Ingber,
D.E., 2002. Directional control of lamellipodia extension by constraining cell shape and orienting cell tractional forces. FASEB J 16,
1195–1204.
Pathak, A., Deshpande, V.S., McMeeking, R.M., Evans, A.G., 2007. Analysis of stress fiber and focal adhesion distributions of cells on
micro-patterned substrates. J. R. Soc Interface, to appear.
Petroll, W.M., Ma, L., Jester, J.V., 2003. Direct correlation of collagen matrix deformation with focal adhesion dynamics in living corneal
fibroblasts. J. Cell Sci. 116, 1481–1491.
Rinko, L.J., Lawrence, M.B., Guilford, W.H., 2004. The molecular mechanics of P- and L-selectin lectin domains binding to PSGL-1.
Biophy. J. 86, 544–554.
Shemesh, T., Geiger, B., Bershadsky, A.D., Kozlov, M.M., 2005. Focal adhesions as mechanosensors: a physical mechanism. Proc. Nat.
Acad. Sci. USA 102, 12383–12388.
Tan, J.L., Tien, J., Pirone, D.M., Gray, D.S., Bhadriraju, K., Chen, C.S., 2003. Cells lying on a bed of microneedles: an approach to
isolate mechanical force. Proc. Nat. Acad. Sci. USA 100, 1484–1489.
Thery, M., Pepin, A., Dressaire, E., Chen, Y., Bornens, M., 2006. Cell distribution of stress fibres in response to the geometry of the
adhesive environment. Cell Motil. Cytoskeleton 63, 341–355.
Wei, Z., Deshpande, V.S., McMeeking, R.M., Evans, A.G., 2007. Analysis and interpretation of stress fiber organization in cells subject to
cyclic stretch. J. Biomech. Eng. ASME, to appear.
Xiao, T.J., Takagi, B.S., Coller, J.-H., Wang, Springer, T.A., 2004. Structural basis for allostery in integrins and binding to fibrinogen-
mimetic therapeutics. Nature 432, 59–67.
Zhu, C., Bao, G., Wang, N., 2000. Cell mechanics: mechanical response, cell adhesion, and molecular deformation. Ann. Rev. Cell and
Dev. Biol. 02, 189–226.