a breakfast presentation
TRANSCRIPT
8/6/2019 A Breakfast Presentation
http://slidepdf.com/reader/full/a-breakfast-presentation 1/51
India RisingIndia to 2020 – Tiger, Tiger Burning Bright
Dr Neil J. Bristow
Presentation at Salva’s Sydney BreakfastSydney, 7th June 2011
H & W Worldwide
+61240286268

8/6/2019 A Breakfast Presentation
http://slidepdf.com/reader/full/a-breakfast-presentation 2/51
Some Interesting Facts on India
Until 1896, India was the only source for diamonds to the world.
India was one of the richest countries till the time of British in the early 17thCentury.
India is among the top 5 producers in the world for food grains, pulses, poultryand first for milk.
Over the last 15 years, India has been the second fastest growing country in
the world after China, averaging above 6% growth per year.
The number system was invented by India. Aryabhatta was the scientist whoinvented the digit zero.
Indian railways is the largest employer in the world, employing over 1 million
people.
Had just 3 shopping malls in 2001, India had 100 in 2005, 345 by 2007 and~420 today.
Christopher Columbus was attracted by India's wealth and was looking for
route to India when he discovered America by mistake.

8/6/2019 A Breakfast Presentation
http://slidepdf.com/reader/full/a-breakfast-presentation 3/51
Plan of Presentation
1. Australia and India the Past Relationship
2. India - Drivers for Accelerated Growth
3. The Future from a Coal Perspective
4. Summary and Implications
H & W Worldwide Consulting
8/6/2019 A Breakfast Presentation
http://slidepdf.com/reader/full/a-breakfast-presentation 4/51
Key Takeaways
Australia and India have a strong long term relationship in coal
Australia is well endowed with a suite of met coals ideal for India current
and future needs
Australia is a proven reliable, long term supplier......unlike potential “new”
suppliers
If India’s steel and power growth takes off, Australia must be prepared to
meet strong demand growth for all coals
Emerging India investment in Australia is a sign of things to come and of abeneficial future relationship

8/6/2019 A Breakfast Presentation
http://slidepdf.com/reader/full/a-breakfast-presentation 5/51
Plan of Presentation
1. Australia and India the Past Relationship
2. India - Drivers for Accelerated Growth
3. The Future from a Coal Perspective
4. Summary and Implications
H & W Worldwide Consulting

8/6/2019 A Breakfast Presentation
http://slidepdf.com/reader/full/a-breakfast-presentation 6/51
Background to the Relationship
Why does India need Australian coal?
India has large reserves of its own coking coal₋ Some coking properties OK, but high ash content
Large iron ore reserves why not DR?
₋ Limited natural gas, DR small scale relatively inefficient
Other importers – why Australia?₋ Australia largest exporter and relatively close
But why does India need HCC rather than WCC?
₋ To carry domestic and other cheaper coals
₋ To increase coke quality as industry develops larger scale BF, steel plants
But why does India not buy large volumes of thermal coal?
₋ Major use of Indonesian thermal coal, particularly sub bituminous
₋ Going forward will need significantly more coal - Australian

8/6/2019 A Breakfast Presentation
http://slidepdf.com/reader/full/a-breakfast-presentation 7/51
Australia and India
Import History
Source: Australian Customs
India has become an increasingly important part of Australia’s export market; share
rising from below 6% to 10% in 2010.
0%
2%
4%
6%
8%
10%
12%
14%
16%
0
50
100
150
200
250
300
M i l l i o n t o n n e s
India's share of Australian exports
India
Australia total
%

8/6/2019 A Breakfast Presentation
http://slidepdf.com/reader/full/a-breakfast-presentation 8/51
Australia and India
Import History - Hard Coking Coal
Source: Australian Customs
India’s importance in HCC is more pronounced having doubled from a 1999 low to
around 25%, and still increasing YTD 2011 - over 28% at a growth rate of ~10.5%pa
0%
5%
10%
15%
20%
25%
30%
0
20
40
60
80
100
120
1999 2000 2001 2002 2003 2004 2005 2006 2007 2008 2009 2010 2011an
m i l l i o n t o n n e s
India's share of HCC exports
India
Australia HCC
%
8/6/2019 A Breakfast Presentation
http://slidepdf.com/reader/full/a-breakfast-presentation 9/51
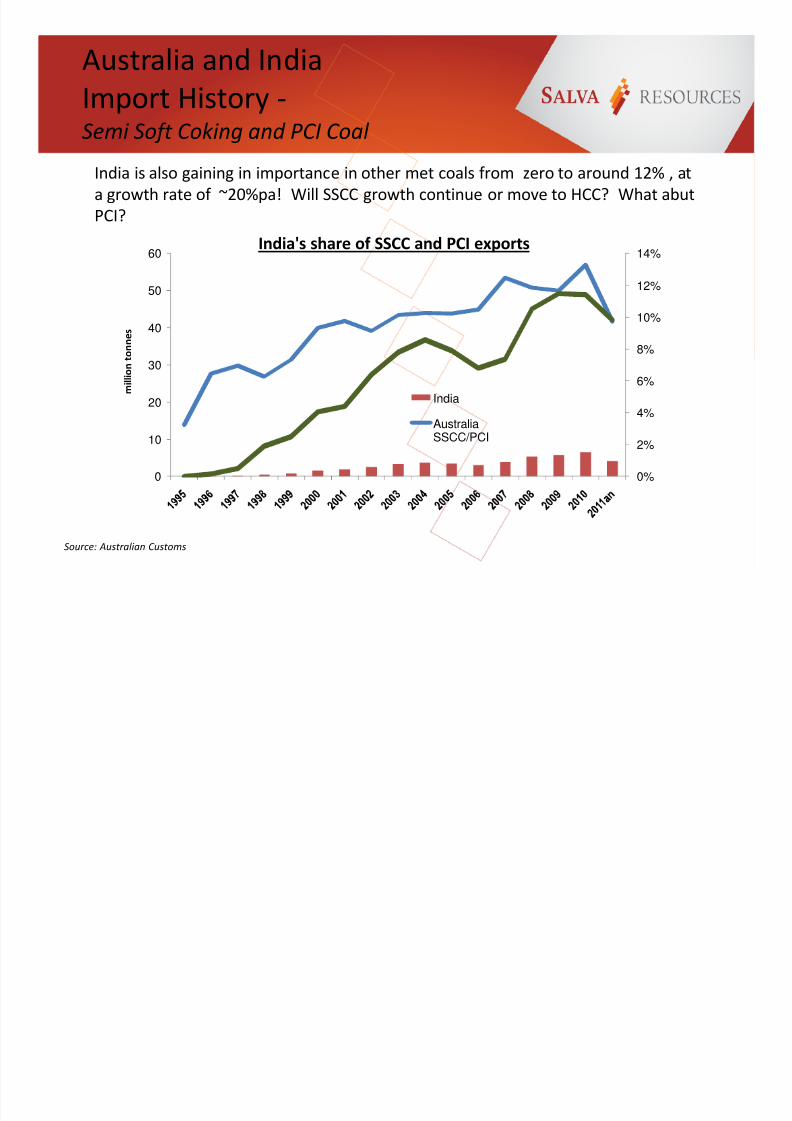
Australia and India
Import History -Semi Soft Coking and PCI Coal
Source: Australian Customs
India is also gaining in importance in other met coals from zero to around 12% , at
a growth rate of ~20%pa! Will SSCC growth continue or move to HCC? What abut
PCI?
0%
2%
4%
6%
8%
10%
12%
14%
0
10
20
30
40
50
60
m i l l i o n t o n n e s
India's share of SSCC and PCI exports
India
AustraliaSSCC/PCI

8/6/2019 A Breakfast Presentation
http://slidepdf.com/reader/full/a-breakfast-presentation 10/51
Australia and India Import
History –Total Metallurgical Coal
Source: Australian Customs
India’s importance in Australian met coal exports has grown significantly and accounts
for >20% of the total, and no 2 position. Potentially surpassing Japan in HCC imports in
2011.
0%
5%
10%
15%
20%
25%
0
20
40
60
80
100
120
140
160
180
m i l l i o n t o n n e s
India's Share of Total Met Coal Exports
India
Australia Met
%
8/6/2019 A Breakfast Presentation
http://slidepdf.com/reader/full/a-breakfast-presentation 11/51
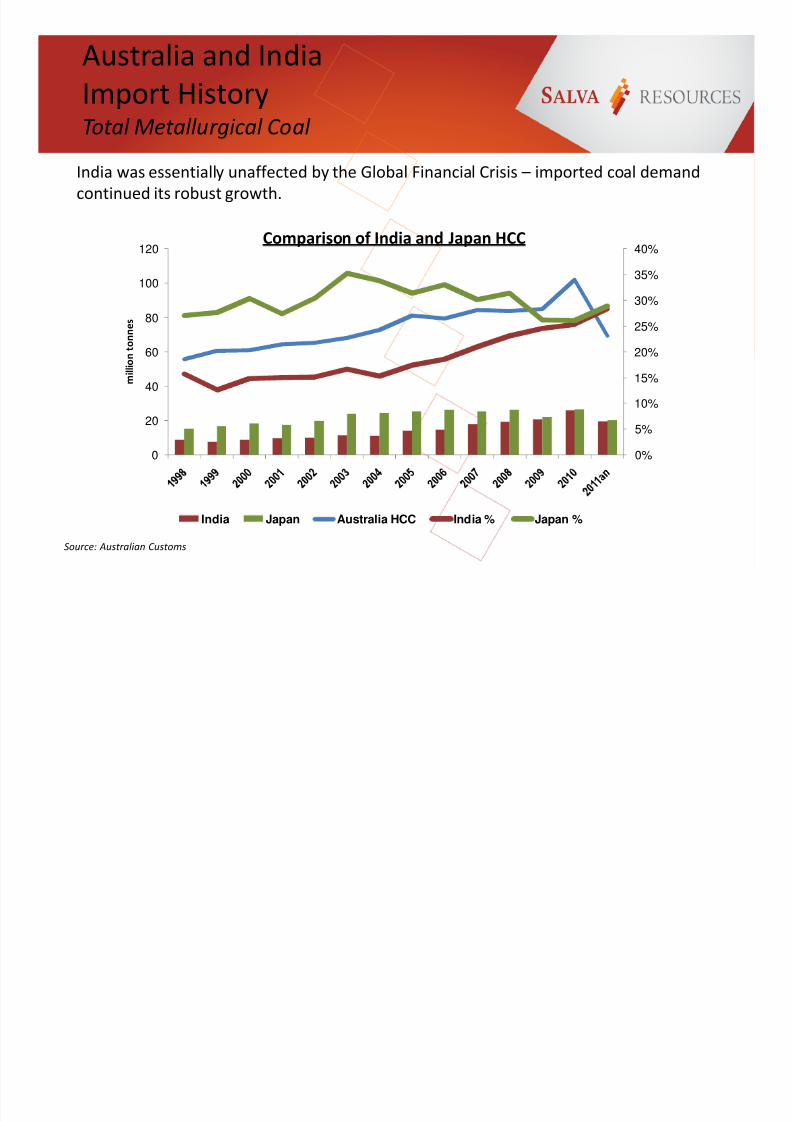
Australia and India
Import HistoryTotal Metallurgical Coal
Source: Australian Customs
India was essentially unaffected by the Global Financial Crisis – imported coal demand
continued its robust growth.
0%
5%
10%
15%
20%
25%
30%
35%
40%
0
20
40
60
80
100
120
m i l l i o n t o n n e s
Comparison of India and Japan HCC
India Japan Australia HCC India % Japan %

8/6/2019 A Breakfast Presentation
http://slidepdf.com/reader/full/a-breakfast-presentation 12/51
Australia and India
Import History – A Perspective
Source: Interocean, Salva
Australia is the dominant supplier of coking coal to India, with over 83% of the market;
will it be in the future?
-
500
1,000
1,500
2,000
2,500
3,000
3,500
4,000
4,500
T h o u s a n d s
T o n n e s
Indian Coking Coal Imports by Month
Australia China Indonesia New Zealand Russia South Africa
NA USA Vietnam Singapore Canada

8/6/2019 A Breakfast Presentation
http://slidepdf.com/reader/full/a-breakfast-presentation 13/51
Summary – The Past
India has gained in importance to Australia
Major HCC importer – strong rise to no 2
Growth rates suggest India soon to overtake Japan in HCC imports
No effect of the GFC - Growth continued throughout the economic
downturn
Thermal coal buying = Indonesian
8/6/2019 A Breakfast Presentation
http://slidepdf.com/reader/full/a-breakfast-presentation 14/51
Plan of Presentation
1. Australia and India the Past Relationship
2. India - Drivers for Accelerated Growth
3. The Future from a Coal Perspective
4. Summary and Implications
H & W Worldwide Consulting

8/6/2019 A Breakfast Presentation
http://slidepdf.com/reader/full/a-breakfast-presentation 15/51
Global Population Changes
Population is a major driver for increased power demand; India will surpass China by 2030 to be
the most populous country, sustaining strong growth over the next 3 decades.
IndiaIndia
Source : UN Population Prospects, 2008 revisionH & W Worldwide Consulting
0
200
400
600
800
1000
1200
1400
1600
1800
1950 1955 1960 1965 1970 1975 1980 1985 1990 1995 2000 2005 2010 2015 2020 2025 2030 2035 2040 2045 2050
P o p u l a t i o n ( M i l l i o n )
Total Population Trend to 2050
ChinaChina
8/6/2019 A Breakfast Presentation
http://slidepdf.com/reader/full/a-breakfast-presentation 16/51
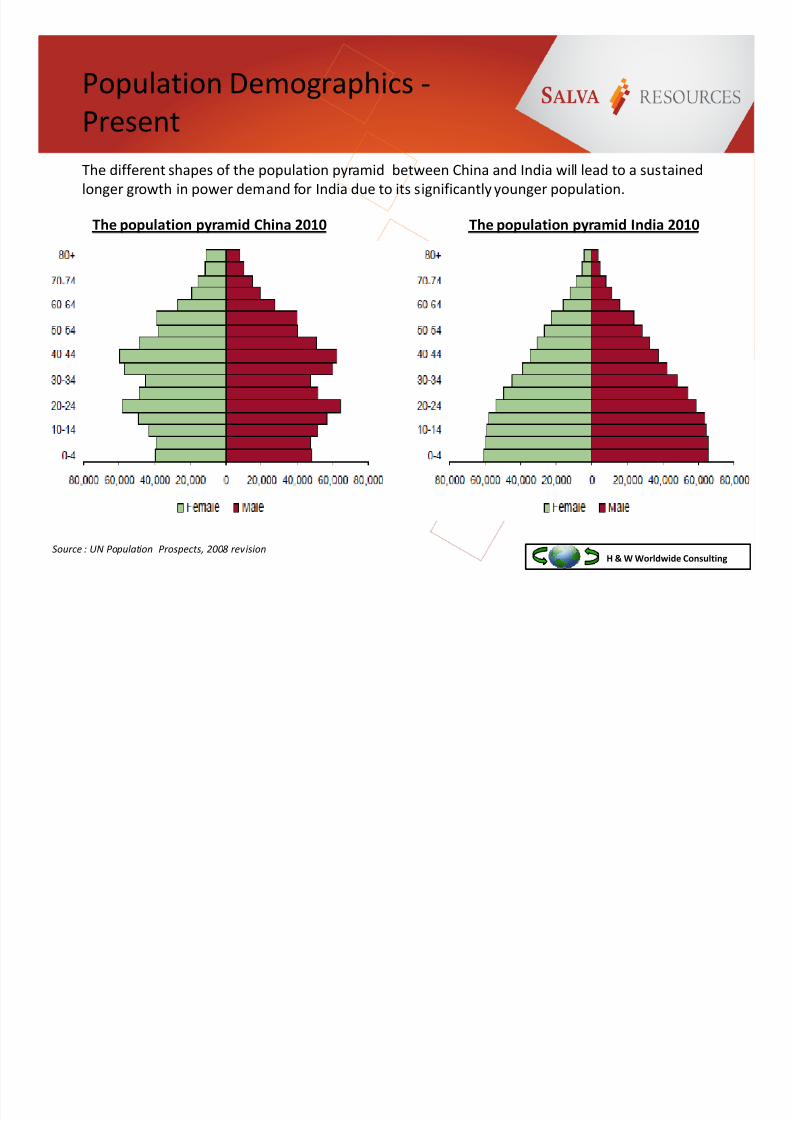
Population Demographics -
Present
The different shapes of the population pyramid between China and India will lead to a sustained
longer growth in power demand for India due to its significantly younger population.
Source : UN Population Prospects, 2008 revision
The population pyramid China 2010 The population pyramid India 2010
H & W Worldwide Consulting

8/6/2019 A Breakfast Presentation
http://slidepdf.com/reader/full/a-breakfast-presentation 17/51
Population demographics -
Future
The shapes of the population pyramid will remain very different as China becomes an old country
and India remains “young” with ~60% below 30 years of age.
Source : UN Population Prospects, 2008 revision
The population pyramid China 2030 The population pyramid India 2030
H & W Worldwide Consulting
8/6/2019 A Breakfast Presentation
http://slidepdf.com/reader/full/a-breakfast-presentation 18/51
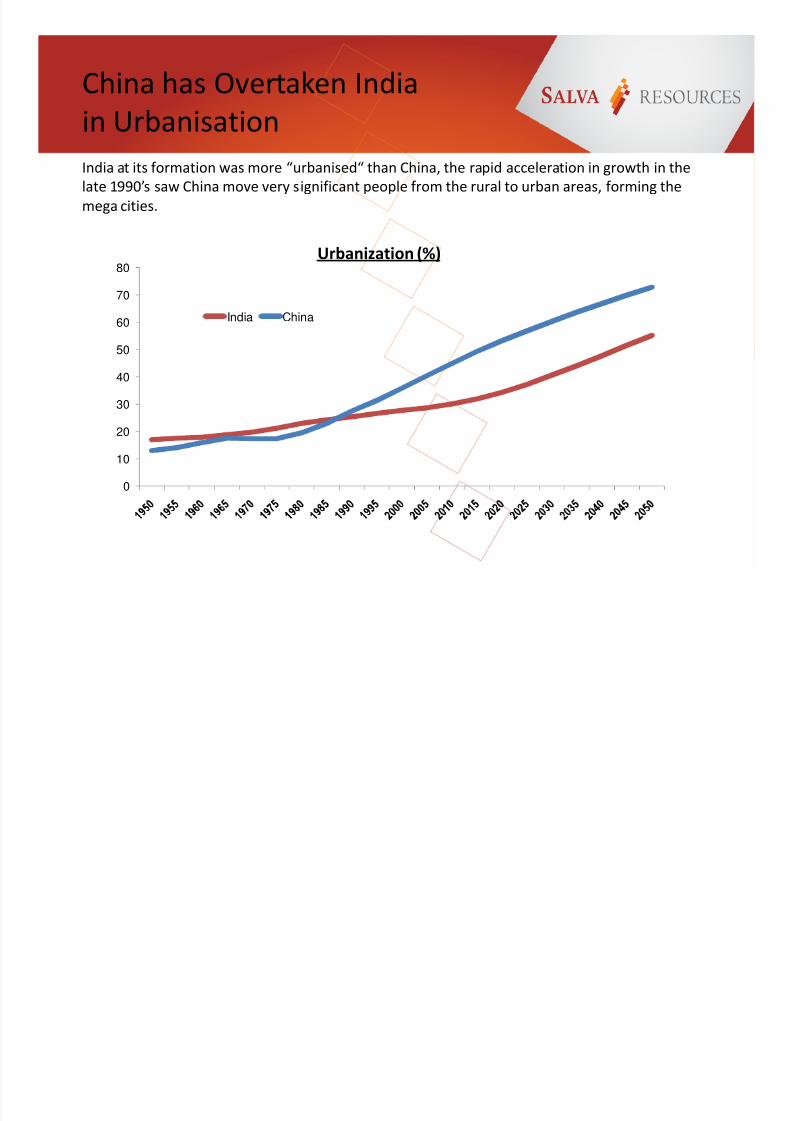
China has Overtaken India
in Urbanisation
0
10
20
30
40
50
60
70
80Urbanization (%)
India China
India at its formation was more “urbanised“ than China, the rapid acceleration in growth in the
late 1990’s saw China move very significant people from the rural to urban areas, forming the
mega cities.

8/6/2019 A Breakfast Presentation
http://slidepdf.com/reader/full/a-breakfast-presentation 19/51
India will Continue Strong
Urbanisation
India will urbanise a further 215 million people by 2025. Although China will exceed this total the
effect will see India adopting some of the key Chinese concepts i.e. Constructing taller buildings
which will boost steel demand.
Source : McKinsey, BHPBilliton presentation

8/6/2019 A Breakfast Presentation
http://slidepdf.com/reader/full/a-breakfast-presentation 20/51
India will grow at a faster
rate than China
0
2
4
6
8
10
12
14
0
2,000
4,000
6,000
8,000
10,000
12,000
14,000
2005 2008 2011 2014 2017 2020
G D P g r o w t h r a t e %
G D P U S $ t r i l l i o
n s
China GDP % India GDP % China GDP (US$b) India GDP (US$b)
Forecasts
In the next 10 years Chinese economic growth will moderate and slow, as India is forecast to pick
up growth and over take China in the next couple of years.

8/6/2019 A Breakfast Presentation
http://slidepdf.com/reader/full/a-breakfast-presentation 21/51
GDP - Comparisons
and Differences
The GDP structures of India and China are very different: India is far more focused on services while
China is focused on manufacturing. Agriculture trends are similar although the importance to India
of the agriculture sector is far higher
Source : World Bank

8/6/2019 A Breakfast Presentation
http://slidepdf.com/reader/full/a-breakfast-presentation 22/51
GDP - The Importance
of Services
India has a vibrant active service sector highly competitive in the global market place, it is yet to
develop a strong manufacturing sector – recent signs show that this is underway.
Source : World Bank
0%
10%
20%
30%
40%
50%
60%
70%
80%
90%
100%
1 9 6 1
1 9 6 4
1 9 6 7
1 9 7 0
1 9 7 3
1 9 7 6
1 9 7 9
1 9 8 2
1 9 8 5
1 9 8 8
1 9 9 1
1 9 9 4
1 9 9 7
2 0 0 0
2 0 0 3
2 0 0 6
2 0 0 9
Composition of GDP in India (%)
Agriculture Industry Services
0%
10%
20%
30%
40%
50%
60%
70%
80%
90%
100%
1 9 6 1
1 9 6 3
1 9 6 5
1 9 6 7
1 9 6 9
1 9 7 1
1 9 7 3
1 9 7 5
1 9 7 7
1 9 7 9
1 9 8 1
1 9 8 3
1 9 8 5
1 9 8 7
1 9 8 9
1 9 9 1
1 9 9 3
1 9 9 5
1 9 9 7
1 9 9 9
2 0 0 1
2 0 0 3
2 0 0 5
2 0 0 7
2 0 0 9
Composition of GDP in China (%)
Agriculture Industry Services

8/6/2019 A Breakfast Presentation
http://slidepdf.com/reader/full/a-breakfast-presentation 23/51
Drivers of India’s Economy
High savings rates
Availability of low cost, skilled and semi skilled labour Technology – supporting the Service sector
Favourable demographics
Trade opening Manufacturing
– Growth in parts manufacture
– Emerging centre for small car development and manufacture
– Plans for intelligent engineering products
– Major opportunities for food processing and manufacturing

8/6/2019 A Breakfast Presentation
http://slidepdf.com/reader/full/a-breakfast-presentation 24/51
Is India Following China
with a lag of ~15 years?
-
20,000
40,000
60,000
80,000
100,000
120,000 FDI Flows (US$M)
China India
India has seen a pick up in FDI. Could India become the major centre replacing China by 2020?
Major boost to steel and power demand and presenting major growth in coal requirements.

8/6/2019 A Breakfast Presentation
http://slidepdf.com/reader/full/a-breakfast-presentation 25/51
India is showing strong signs of following the conventional development route
Exports trends to GDP continue to climb
Exports from special economic zones are following China model
Signs India is set for manufacturing and industrial take off in next 10 years
Is India that different?
No, not really.
8/6/2019 A Breakfast Presentation
http://slidepdf.com/reader/full/a-breakfast-presentation 26/51
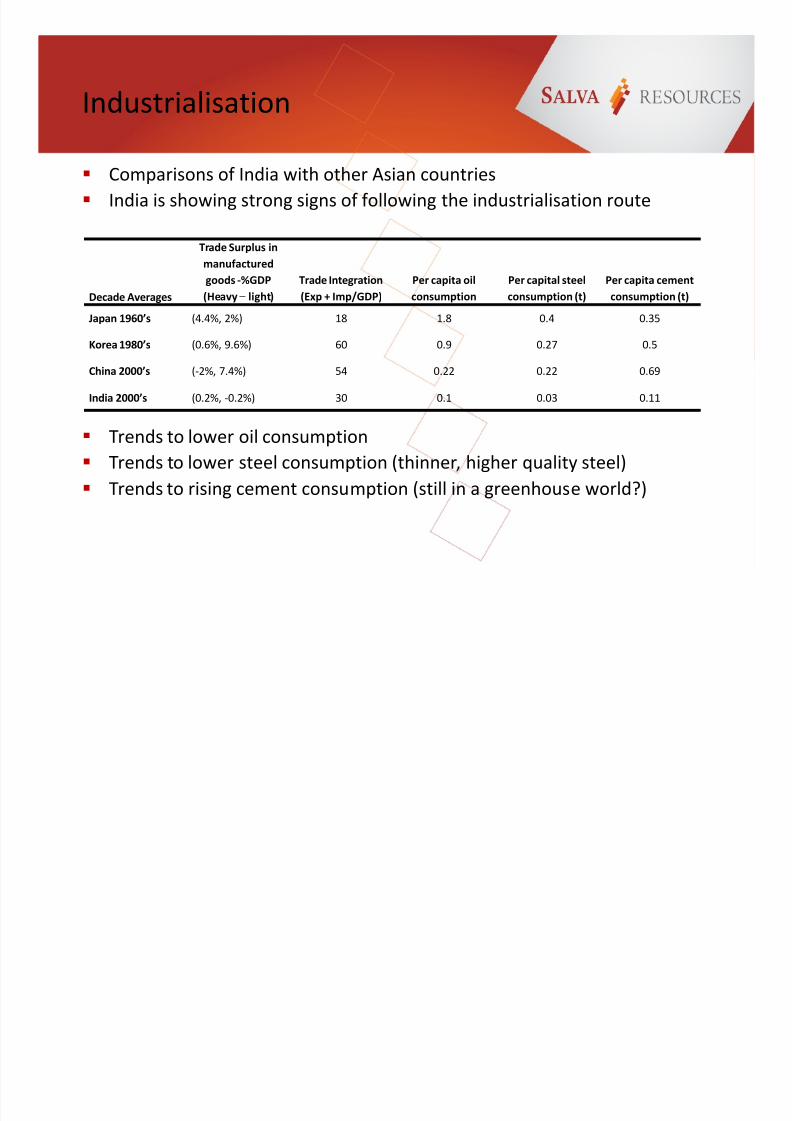
Industrialisation
Comparisons of India with other Asian countries
India is showing strong signs of following the industrialisation route
Trends to lower oil consumption Trends to lower steel consumption (thinner, higher quality steel)
Trends to rising cement consumption (still in a greenhouse world?)
Decade Averages
Trade Surplus in
manufactured
goods -%GDP
(Heavy – light)
Trade Integration
(Exp + Imp/GDP)
Per capita oil
consumption
Per capital steel
consumption (t)
Per capita cement
consumption (t)
Japan 1960’s (4.4%, 2%) 18 1.8 0.4 0.35
Korea 1980’s (0.6%, 9.6%) 60 0.9 0.27 0.5
China 2000’s (-2%, 7.4%) 54 0.22 0.22 0.69
India 2000’s (0.2%, -0.2%) 30 0.1 0.03 0.11
8/6/2019 A Breakfast Presentation
http://slidepdf.com/reader/full/a-breakfast-presentation 27/51
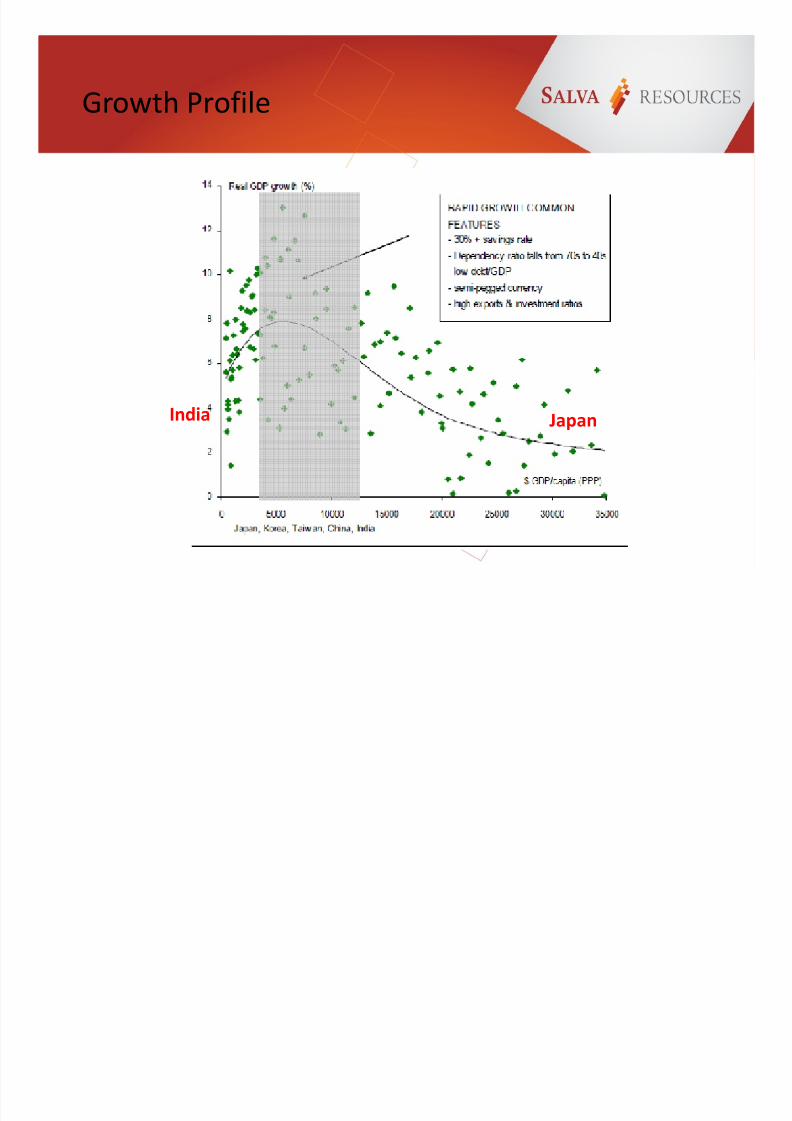
Growth Profile
JapanIndia
8/6/2019 A Breakfast Presentation
http://slidepdf.com/reader/full/a-breakfast-presentation 28/51
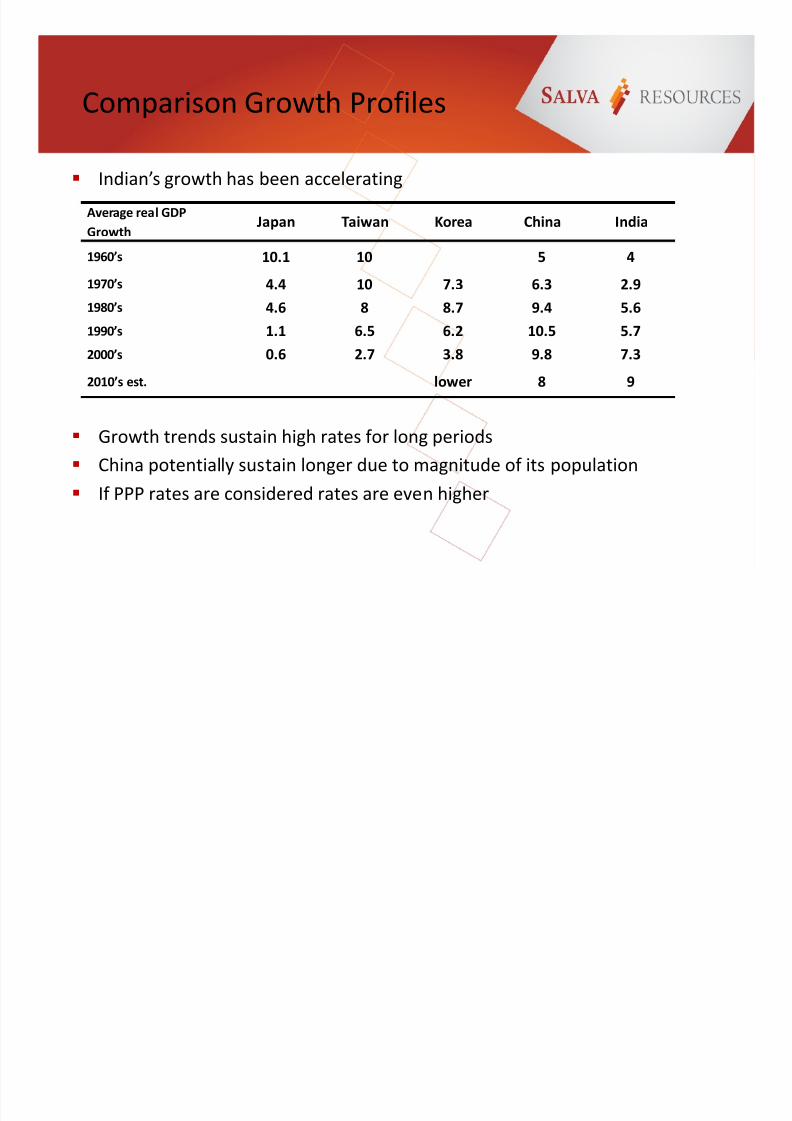
Comparison Growth Profiles
Average real GDP
Growth Japan Taiwan Korea China India
1960’s 10.1 10 5 4
1970’s 4.4 10 7.3 6.3 2.9
1980’s 4.6 8 8.7 9.4 5.6
1990’s 1.1 6.5 6.2 10.5 5.7
2000’s 0.6 2.7 3.8 9.8 7.3
2010’s est. lower 8 9
Indian’s growth has been accelerating
Growth trends sustain high rates for long periods China potentially sustain longer due to magnitude of its population
If PPP rates are considered rates are even higher

8/6/2019 A Breakfast Presentation
http://slidepdf.com/reader/full/a-breakfast-presentation 29/51
Consider Automotive Sector
India is already moving in 4 wheels Leading development of small “people’s car” e.g. Nano
Led acquisition to build competitive position ahead of China

8/6/2019 A Breakfast Presentation
http://slidepdf.com/reader/full/a-breakfast-presentation 30/51
Per capita consumption of steel in selected countries
0
100
200
300
400
500
600
700
800
900
1 9 0 0
1 9 0 5
1 9 1 0
1 9 1 5
1 9 2 0
1 9 2 5
1 9 3 0
1 9 3 5
1 9 4 0
1 9 4 5
1 9 5 0
1 9 5 5
1 9 6 0
1 9 6 5
1 9 7 0
1 9 7 5
1 9 8 0
1 9 8 5
1 9 9 0
1 9 9 5
2 0 0 0
2 0 0 5
2 0 1 0
k g / p e r s o n
USA Japan France Germany China India Brazil
Per Capita Consumption-
Where is the Potential?
Source: MySteel, Arcelor Mittal, Macquarie Research
History suggests >700kg per capita consumption for many years. This would equate to
production of >1bt from ~70Mt currently.
India
8/6/2019 A Breakfast Presentation
http://slidepdf.com/reader/full/a-breakfast-presentation 31/51
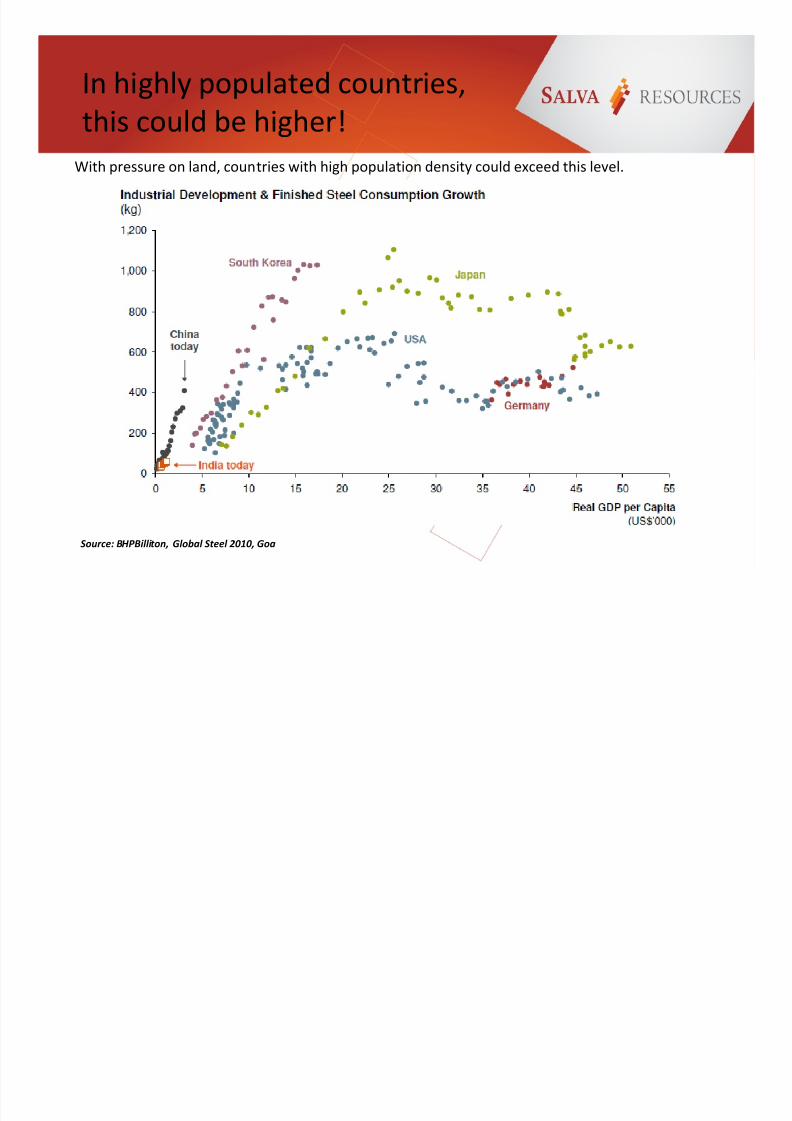
In highly populated countries,
this could be higher!
Source: BHPBilliton, Global Steel 2010, Goa
With pressure on land, countries with high population density could exceed this level.
8/6/2019 A Breakfast Presentation
http://slidepdf.com/reader/full/a-breakfast-presentation 32/51
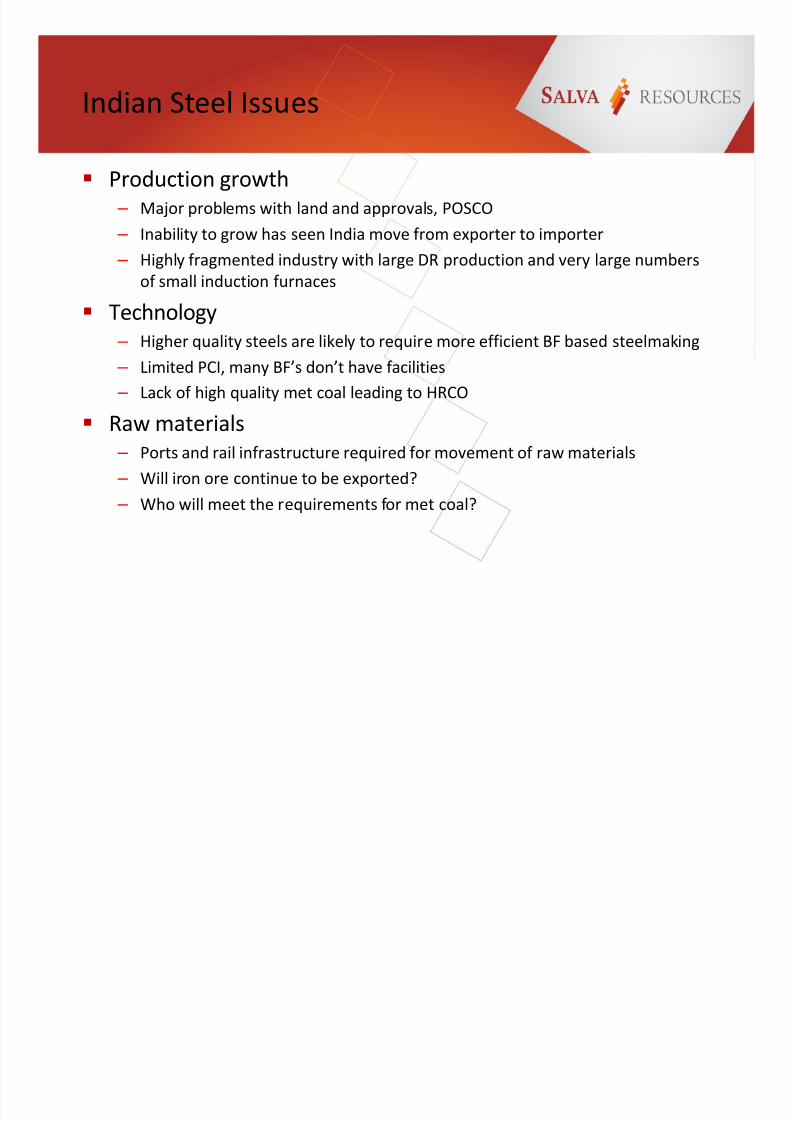
Indian Steel Issues
Production growth – Major problems with land and approvals, POSCO
– Inability to grow has seen India move from exporter to importer
– Highly fragmented industry with large DR production and very large numbers
of small induction furnaces
Technology – Higher quality steels are likely to require more efficient BF based steelmaking
– Limited PCI, many BF’s don’t have facilities
– Lack of high quality met coal leading to HRCO
Raw materials – Ports and rail infrastructure required for movement of raw materials
– Will iron ore continue to be exported?
– Who will meet the requirements for met coal?
8/6/2019 A Breakfast Presentation
http://slidepdf.com/reader/full/a-breakfast-presentation 33/51
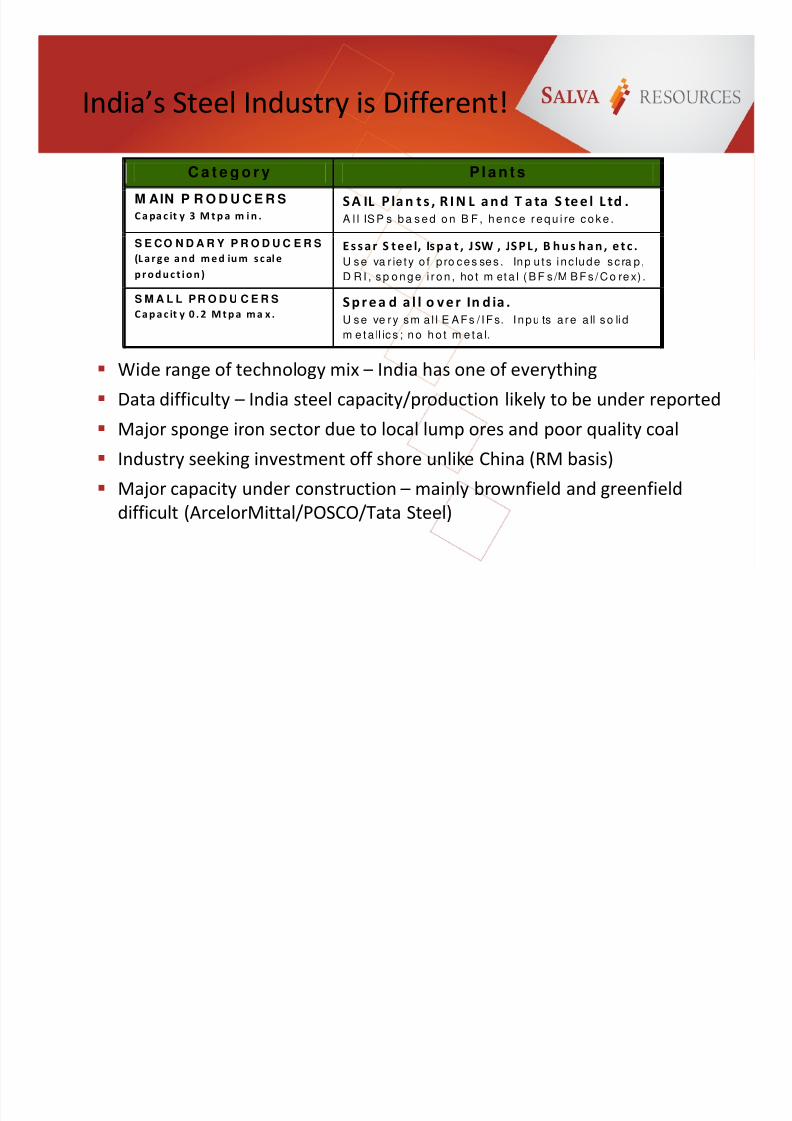
India’s Steel Industry is Different!
Wide range of technology mix – India has one of everything
Data difficulty – India steel capacity/production likely to be under reported
Major sponge iron sector due to local lump ores and poor quality coal Industry seeking investment off shore unlike China (RM basis)
Major capacity under construction – mainly brownfield and greenfield
difficult (ArcelorMittal/POSCO/Tata Steel)
C a t e g o r y P l a n t s
M AIN P R O D U C E R S
C a pa c it y 3 M t p a m i n .
S A IL P la n t s , R I N L a n d T a ta S te e l L td . A l l IS P s b a s e d o n B F , h e n c e r e q u i re c o k e .
S E CO N D A R Y P R O D U C E R S
(L a r g e a n d m e d iu m s c al e
p r o d u c t i o n ) E s s a r S t e e l, Is p a t , J SW , JS P L , B h u s h a n , e t c . U se va r ie t y o f p ro ces ses . Inp u ts inc lude sc ra p ,
D R I , s p o n g e i r o n , ho t m et a l ( B F s /M B F s / C o re x) .
S M A L L PR O D U C E R S
C a p a c it y 0 . 2 M t p a m a x . S p r e a d a l l o v e r In d ia . U se ve ry sm a l l E AFs / IFs. I npu ts a re a ll so li d
m e t a ll ic s ; n o h o t m e t a l.

8/6/2019 A Breakfast Presentation
http://slidepdf.com/reader/full/a-breakfast-presentation 34/51
Indian Steel Outlook to 2025
0
50
100
150
200
250
300
M i l l i o n t o n n e s
Steel and Pig Iron forecasts
Crude Steel
Pig iron
Crude steel 10%Pig Iron 10%
Source: World Steel Association, H&W Worldwide Consulting
Steel production will grow rapidly to 2025 and beyond. Demand growth will most likely see
increased BF/BOF steelmaking to feed emerging manufacturing sector.

8/6/2019 A Breakfast Presentation
http://slidepdf.com/reader/full/a-breakfast-presentation 35/51
Plan of Presentation
1. Australia and India the Past Relationship
2. India - Drivers for Accelerated Growth
3. The Future from a Coal Perspective
4. Summary and Implications
H & W Worldwide Consulting

8/6/2019 A Breakfast Presentation
http://slidepdf.com/reader/full/a-breakfast-presentation 36/51
Total Met Coal Consumption
0
20
40
60
80
100
120
140
160
m i l l i o n t o n n e
s
Met coal consumption
Other
PCI coal
Coking coal
Domestic
Source: Interocean, Salva, H&W Worldwide Consulting
Imports
Based on pig iron forecasts India will overtake Japan as the largest met coal importer around
2015-6, assuming new BF and coke plants come on as forecast.

8/6/2019 A Breakfast Presentation
http://slidepdf.com/reader/full/a-breakfast-presentation 37/51
Power Consumption ForecastsChanging the parameters leads to major growth in industrial use and residential demand, with the
largest percentage change in commercial consumption.
Source : IEA, Macquarie, H&W Worldwide Consulting
0
500000
1000000
1500000
2000000
2500000
3000000
3500000
4000000
4500000
2005 2010 2015 2020 2025
P o w e r D e m a n d ( G W
)
Base case
Captive Demand lossesOther RailCommercial AgriculturalIndustrial Residential
0
500000
1000000
1500000
2000000
2500000
3000000
3500000
4000000
4500000
2005 2010 2015 2020 2025
P o w e r d e m a n d ( G W
)
High case
Captive Demand lossesOther RailCommercial AgriculturalIndustrial Residential
8/6/2019 A Breakfast Presentation
http://slidepdf.com/reader/full/a-breakfast-presentation 38/51
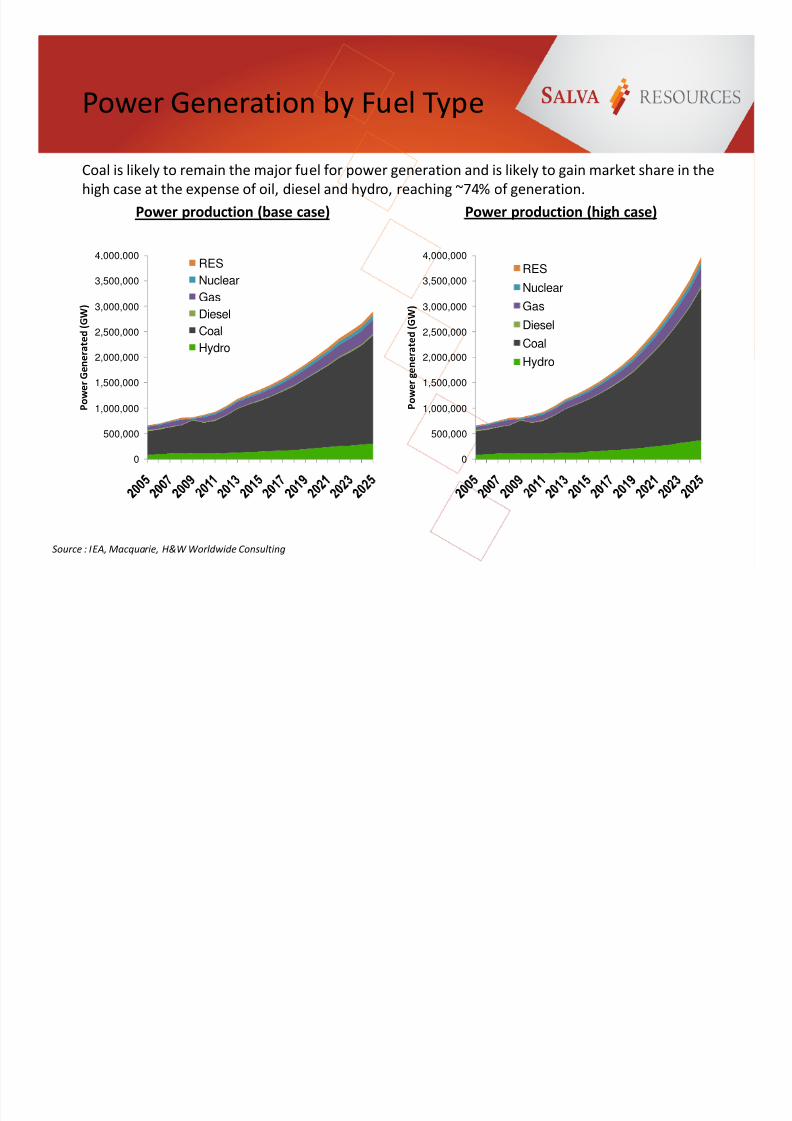
Power Generation by Fuel TypeCoal is likely to remain the major fuel for power generation and is likely to gain market share in the
high case at the expense of oil, diesel and hydro, reaching ~74% of generation.
Source : IEA, Macquarie, H&W Worldwide Consulting
0
500,000
1,000,000
1,500,000
2,000,000
2,500,000
3,000,000
3,500,000
4,000,000
P o w e r g e n e r a t e d ( G W )
Power production (high case)
RES
Nuclear
Gas
DieselCoal
Hydro
0
500,000
1,000,000
1,500,000
2,000,000
2,500,000
3,000,000
3,500,000
4,000,000
P o w e r G e n e r a t e d ( G W )
Power production (base case)
RES
Nuclear
Gas
Diesel
CoalHydro

8/6/2019 A Breakfast Presentation
http://slidepdf.com/reader/full/a-breakfast-presentation 39/51
India: Big Plans for Coal-fired
Power Generation
Source: NEC, Macquarie Research, July 2011
-
5,000
10,000
15,000
20,000
25,000
2007-08 2008-09 2009-10 2010-11 2011-12 2012-13 2013-14 2014-15 2015-16
Hydro Coastal thermal Nuclear Other thermal
MW 11th and 12th plan power projects
Coal is likely to remain the major fuel for power generation, thermal remains the major source of
power generation in future plans.

8/6/2019 A Breakfast Presentation
http://slidepdf.com/reader/full/a-breakfast-presentation 40/51
History of overpromising, but even
conservative estimates are huge
Source: GTIS, Macquarie Research, April 2011
0
5,000
10,000
15,000
20,000
25,000
30,000
35,000
40,000
45,000
51-
56
56-
61
61-
66
69-
74
74-
79
80-
85
85-
90
92-
97
97-
02
`02-
07
Proposed Achieved
MW capacity addition
India 5 year plan - e lectricity expansion
-
20
40
60
80
100
120
140
160
2008 2009 2010F 2011F 2012F 2013F 2014F 2015F
Major Coastal IPPUMPPNon-specific imports
MtIndian Import Demand
However, the track record is not good, unlikely to meet targets as a widening gap between
planned and actually built. This situation is unlikely to improve greatly in the current and next
plans. India will remain very power short!
8/6/2019 A Breakfast Presentation
http://slidepdf.com/reader/full/a-breakfast-presentation 41/51
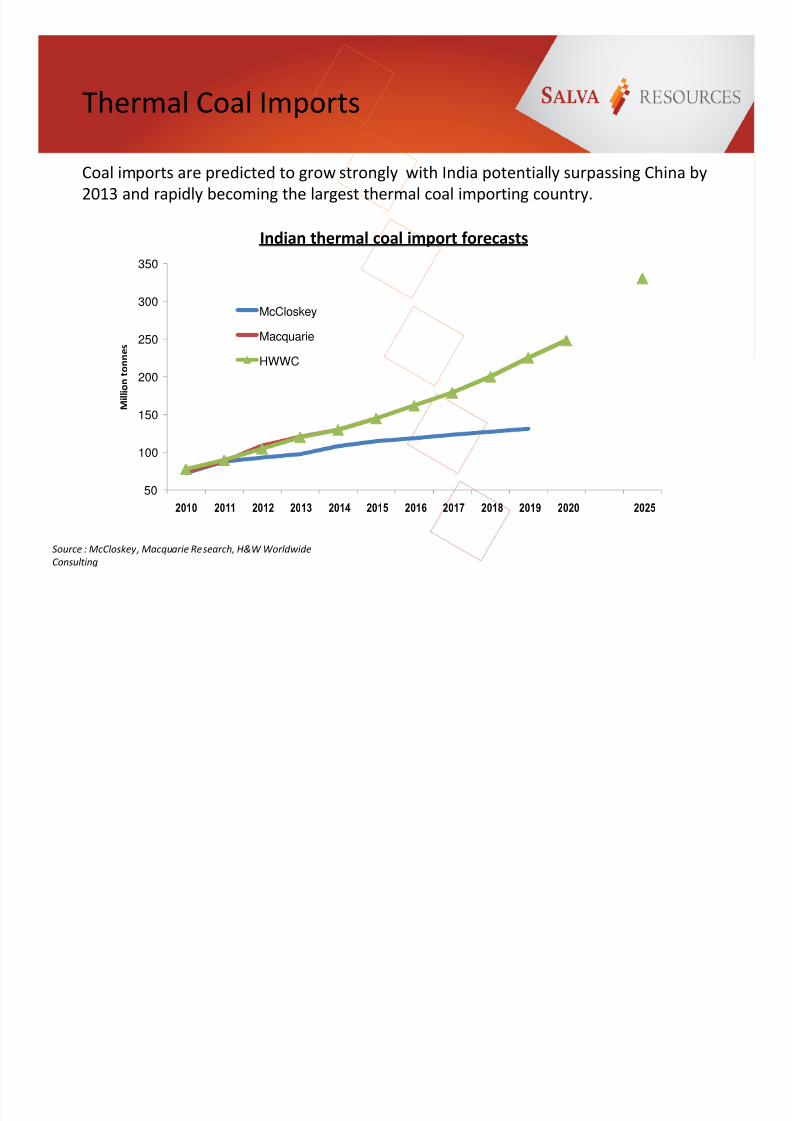
Thermal Coal Imports
50
100
150
200
250
300
350
2010 2011 2012 2013 2014 2015 2016 2017 2018 2019 2020 2025
M i l l i o n t o n n e s
Indian thermal coal import forecasts
McCloskey
Macquarie
HWWC
Source : McCloskey, Macquarie Research, H&W Worldwide
Consulting
Coal imports are predicted to grow strongly with India potentially surpassing China by
2013 and rapidly becoming the largest thermal coal importing country.

8/6/2019 A Breakfast Presentation
http://slidepdf.com/reader/full/a-breakfast-presentation 42/51
Steel Forecasts - Higher Cases
0
50
100
150
200
250
300
350
400
450
2006 2008 2010 2012 2014 2016 2018 2020
M i l l i o n t o n n e s
Indian steel Growth Forecasts
10%pa 12%pa
15%pa 20%pa
Consider some sample growth rates
Is 20% a fantasy – China exceeded this for a period?
Is 10% or 12% too conservative if India’s growth accelerates?

8/6/2019 A Breakfast Presentation
http://slidepdf.com/reader/full/a-breakfast-presentation 43/51

8/6/2019 A Breakfast Presentation
http://slidepdf.com/reader/full/a-breakfast-presentation 44/51
Plan of Presentation
1. Australia and India the Past Relationship
2. India - Drivers for Accelerated Growth
3. The Future from a Coal Perspective
4. Summary and Implications
H & W Worldwide Consulting

8/6/2019 A Breakfast Presentation
http://slidepdf.com/reader/full/a-breakfast-presentation 45/51
Implications of Major Steel
Production Growth
What would India’s raw materials outlook be at 2020 on previous scenarios?
Assumptions:
Pig IronAs growth rates increase BF/BOF increasingly preferred at source of production due to economies of scale, larger BF size
and limitations on DR route due to NG and energy costs.
Met Coal
Increase in PCI rates, with faster acceleration in high steel growth case, rates to reach country averages of 100kg/thm
@10%pa to 120kg/thm @20%pa rate. Increased use of SSCC likely at higher demand due to magnitude of volumes and
growth in HRCO.
Iron OreIron ores rats linked to hot metal growth with declining grades likely as growth rates rise due to higher more rapid
demand boosting speed to market and likely increased use of lower grade materials.
2020 Steel increase2020 Pig Iron
Production Increase
Increase in Iron Ore
Demand
Increase in Met Coal
Demand8%pa 77 76 156 50
10%pa 106 99 191 66
12%pa 141 131 239 87
15%pa 203 191 328 12620%pa 347 315 515 208

8/6/2019 A Breakfast Presentation
http://slidepdf.com/reader/full/a-breakfast-presentation 46/51
Implications for Met Coal
8%pa will see ~1.25 times increase in imports
10%pa will see import demand growth similar to total Japanese imports
20%pa increase is equal to current seaborne market for all coking coal
Major increase in all forms of met coal,
₋ PCI = 2.1x today market
₋ HCC = more in demand at higher rates due to rising productivity ~doubling market
Major issue of infrastructure ports and rail at these volumes
Metallurgical coal 8%pa 10%pa 12%pa 15%pa 20%pa
Demand increase (Mtpa) 50 66 87 126 208
8/6/2019 A Breakfast Presentation
http://slidepdf.com/reader/full/a-breakfast-presentation 47/51
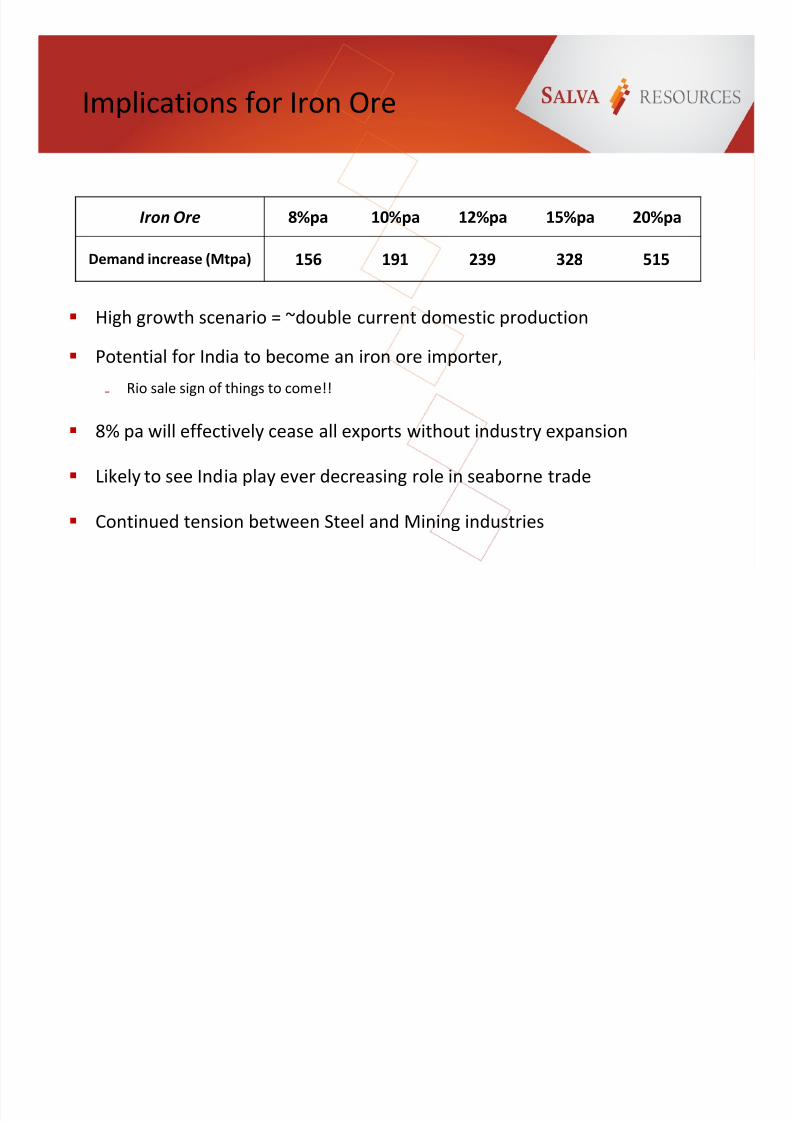
Implications for Iron Ore
High growth scenario = ~double current domestic production
Potential for India to become an iron ore importer,
₋ Rio sale sign of things to come!!
8% pa will effectively cease all exports without industry expansion
Likely to see India play ever decreasing role in seaborne trade
Continued tension between Steel and Mining industries
Iron Ore 8%pa 10%pa 12%pa 15%pa 20%pa
Demand increase (Mtpa) 156 191 239 328 515

8/6/2019 A Breakfast Presentation
http://slidepdf.com/reader/full/a-breakfast-presentation 48/51
Summarising Factors
All assume very significant movement of raw materials
₋ can the infrastructure be built ?
₋ Major rail, port and road building challenge ahead
High growth scenarios look impossible – but we always miss theupside
₋ China boom, pricing, freight etc
Yes, but it’s India.....
₋ India is moving, changing......but is NOT China!!
Major issue, where are raw materials going to come from?
₋ And of course China is still here!! Wanting the same coal and iron ore?

8/6/2019 A Breakfast Presentation
http://slidepdf.com/reader/full/a-breakfast-presentation 49/51
India in 2020
Could be passing Germany for no 4 spot in the world economy
Could have a vibrant manufacturing sector focusing on light cars, motorcycles, smartmanufacturing and light engineering
Could be the no 1 global software and programme developer
Could be the no 1 met coal importer ahead of China
Could be the no 1 thermal coal importer ahead of China
Could be the 2nd most important iron ore importer after China
Could surpass Hollywood in film exports
IPL could become more successful as the English Premier League
Could have turned Cricket into a truly world sport

8/6/2019 A Breakfast Presentation
http://slidepdf.com/reader/full/a-breakfast-presentation 50/51
Salva Report Products
The Salva Report - The world’s leading publication on the Indian steel, power, coal and
infrastructure sectors
India Unlocked - Providing all critical data on Indian coal demand and supply drivers inone location
Outlook Series - Forecasting the Future for India’s Power, Steel and Ports Sectors
Salva Report Products
The Salva ReportOngoing news and analysis
Outlook Series Annual forecast / report
India UnlockedCritical sector data series
Custom
ConsultingBespoke reports / forecasts

8/6/2019 A Breakfast Presentation
http://slidepdf.com/reader/full/a-breakfast-presentation 51/51
Summary and Conclusions
This will be India’s decade
India is following the conventional Asian development growth path
Economic acceleration and “take-off” expected well before end of
decade
Growth rates will surpass China by mid decade
Major growth in steel and power production with corresponding impact
on raw materials
India likely to be no 1 global coal importer
Could be importing iron ore before 2020