a brief description of early warning products for extreme...
TRANSCRIPT

A brief description of early warning products for extreme weather events
Mio MATSUEDA (U. Tsukuba & U. Oxford)
Tetsuo NAKAZAWA (NIMR)with thanks to Richard Swinbank (UKMO) and Ken Mylne (UKMO)
Version 1.9 (last modified on 19th March, 2015)
This is a short guide on how to use the ensemble-based early warnings
products for extreme weather events displayed on the two website:
http://gpvjma.ccs.hpcc.jp/TIGGE/tigge_extreme_prob.html
http://gpvjma.ccs.hpcc.jp/TIGGE/tigge_warning.html
These early warning products are based on operational ensemble forecasts from four of the
leading global NWP centres: ECMWF, JMA, UK Met Office and NCEP. The forecast data have
been extracted from the TIGGE database (see http://tigge.ecmwf.int); these TIGGE data are
available with a 2-day delay as part of the THORPEX research programme.
Whether you are an operational forecaster or anyone else interested in predicting extreme
weather, we would appreciate your comments on these prototype products. Depending on
feedback received, they could form the basis for future real-time products for use in forecast
demonstration projects and operational forecasting.
Introduction
This guide assumes that you are familiar with ensemble prediction systems
(EPS) and the use of probabilistic forecasting products. For more information
about ensemble forecasting, we recommend the following:
● “Guidelines on Ensemble Prediction Systems and Forecasting”http://www.wmo.int/pages/prog/www/Documents/1091_en.pdf
is published by the WMO expert team on EPS;
● The ECMWF User Guide http://www.ecmwf.int/products/forecasts/guide/
provides comprehensive guidance on the use of ECMWF systems including detailed advice on the use of EPS;
● The COMET training materials https://www.meted.ucar.edu/training_detail.phpprovide training on the use of EPS.
Introduction

Ensemble-based early warning products The first type of product highlights the probability of occurrence of extreme
weather. Four versions of this product are available, to highlight the risks of
In each case, the extreme weather is identified by comparing the actual
model forecast values with the model forecast climatology.
● heavy rain
● strong winds
● high temperatures
● low temperatures.

The second type of product summarises the same four types of extreme weather, by plotting colours and symbols on a single map. The probabilities are calculated both from both each individual ensemble and the Multi-Centre Grand Ensemble – a large ensemble including all the members from each of the four NWP centres.
The following sections of the guide given more details on how these products are calculated, and how they should be interpreted: 1. How the probability of occurrence of extreme events is calculated from TIGGE data 2. How climatological probability density function s (PDFs) are estimated from TIGGE forecasts 3. How to use the early warning products 4. An example of early warning products for an extreme weather event
Ensemble-based early warning products
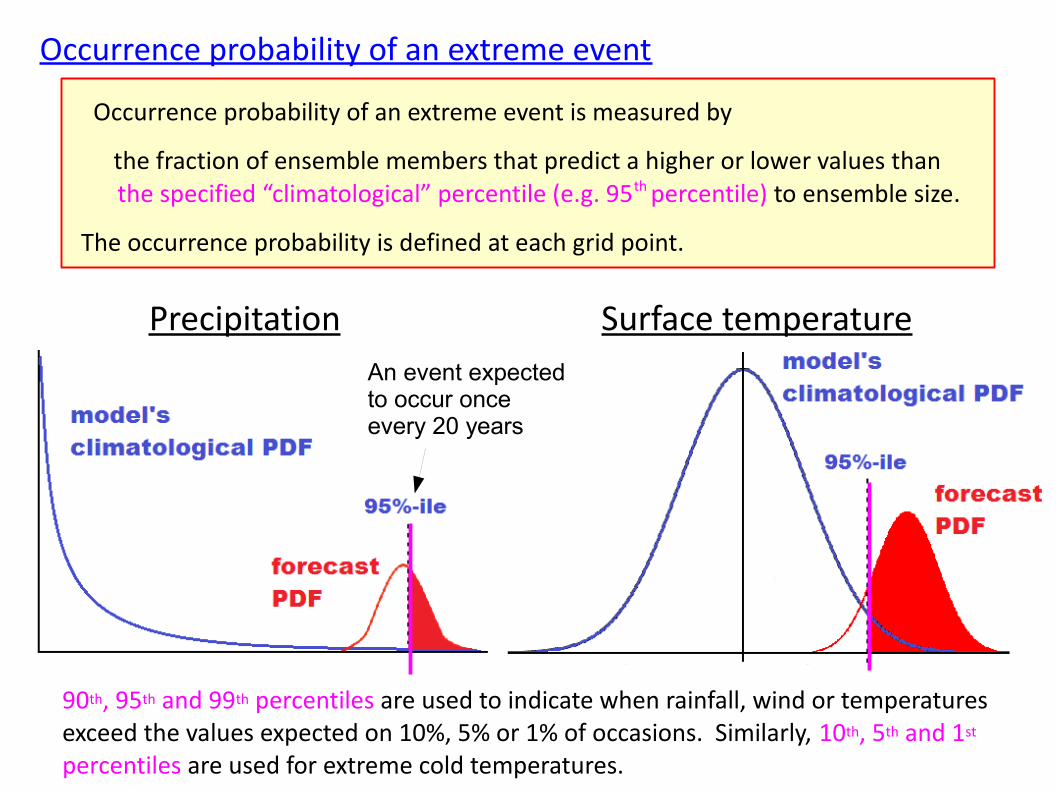
Occurrence probability of an extreme event is measured by
the fraction of ensemble members that predict a higher or lower values than the specified “climatological” percentile (e.g. 95th percentile) to ensemble size.
The occurrence probability is defined at each grid point.
Surface temperaturePrecipitation
90th, 95th and 99th percentiles are used to indicate when rainfall, wind or temperatures exceed the values expected on 10%, 5% or 1% of occasions. Similarly, 10th, 5th and 1st percentiles are used for extreme cold temperatures.
An event expected to occur once every 20 years
Occurrence probability of an extreme event

10 ensemblemembers
T2m
model's climatological95th percentile
Example: 10-member ensemble forecast of surface temperature at Oxford
Here, extreme high temperature is defined as temperature exceeding the model's climatological 95th percentile.
305K 310K 315K
6 members predict a higher value than the climatological 95th percentile (310K): extreme high temperature. Then, occurrence probability of extreme high temperature is defined as 60%.
extreme hightemperature
Occurrence probability of an extreme event is measured by
the fraction of ensemble members that predict a higher or lower values than the specified “climatological” percentile (e.g. 95th percentile) to ensemble size.
The occurrence probability is defined at each grid point.
6
Occurrence probability of an extreme event (single-centre ensemble)
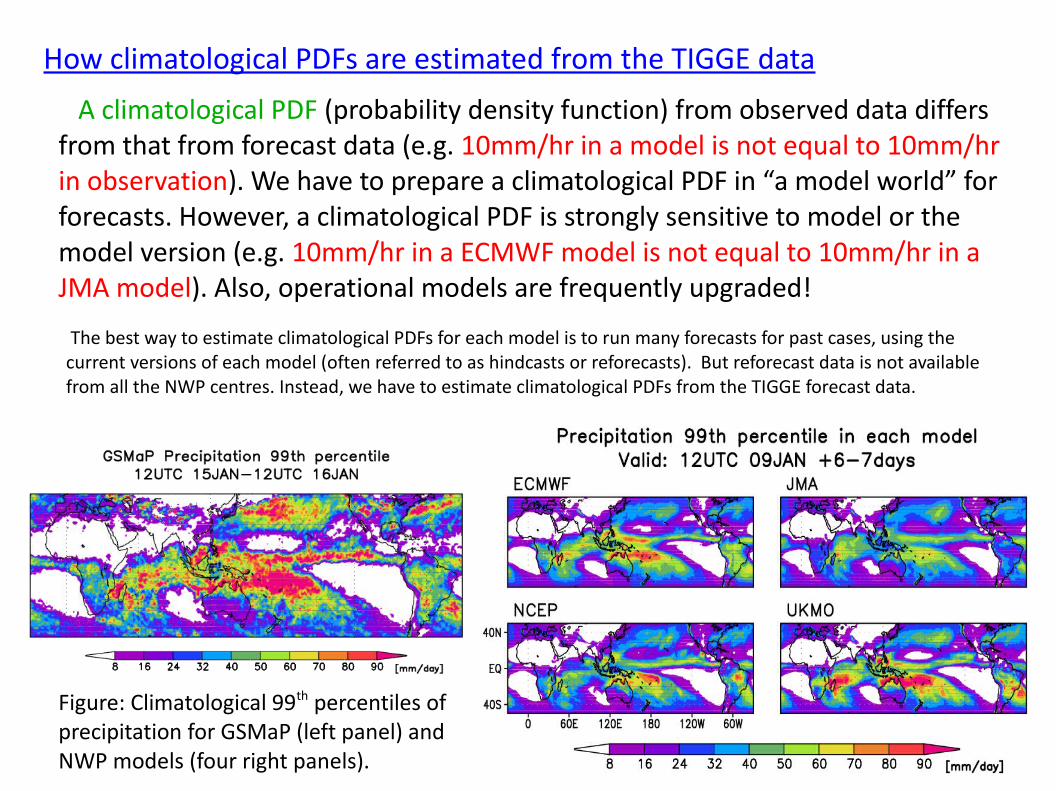
A climatological PDF (probability density function) from observed data differs from that from forecast data (e.g. 10mm/hr in a model is not equal to 10mm/hr in observation). We have to prepare a climatological PDF in “a model world” for forecasts. However, a climatological PDF is strongly sensitive to model or the model version (e.g. 10mm/hr in a ECMWF model is not equal to 10mm/hr in a JMA model). Also, operational models are frequently upgraded!
The best way to estimate climatological PDFs for each model is to run many forecasts for past cases, using the current versions of each model (often referred to as hindcasts or reforecasts). But reforecast data is not available from all the NWP centres. Instead, we have to estimate climatological PDFs from the TIGGE forecast data.
Figure: Climatological 99th percentiles of precipitation for GSMaP (left panel) and NWP models (four right panels).
How climatological PDFs are estimated from the TIGGE data
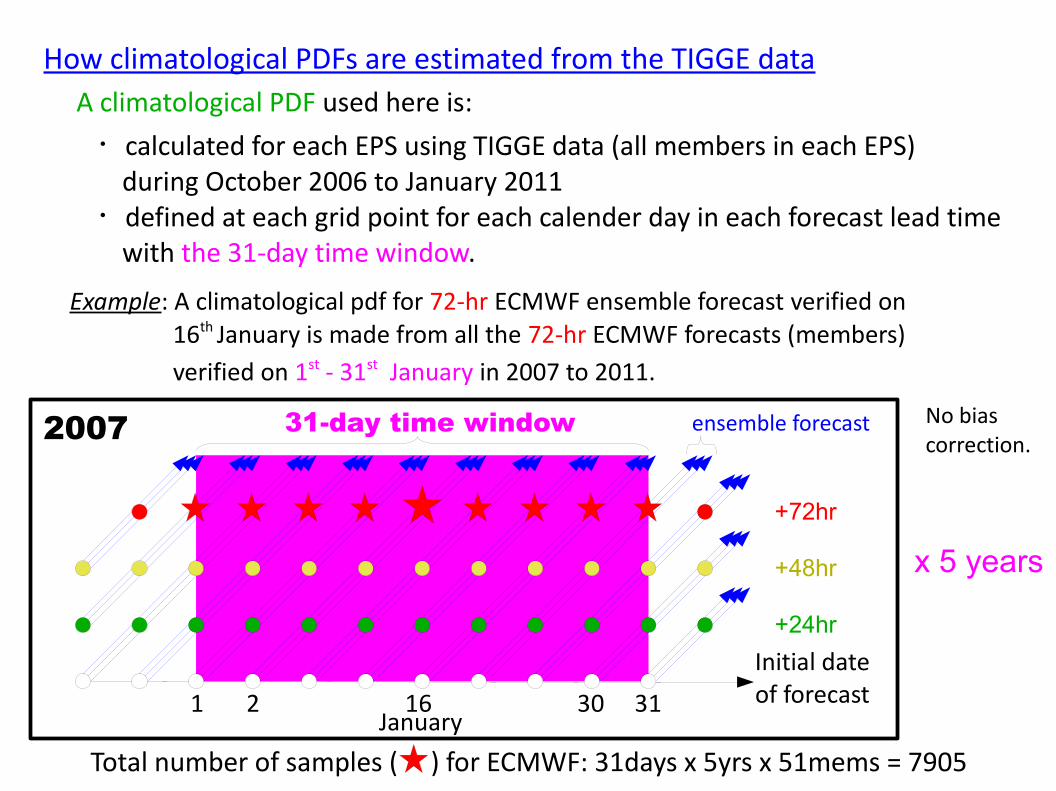
A climatological PDF used here is:
・calculated for each EPS using TIGGE data (all members in each EPS) during October 2006 to January 2011 ・defined at each grid point for each calender day in each forecast lead time with the 31-day time window.
Example: A climatological pdf for 72-hr ECMWF ensemble forecast verified on 16th January is made from all the 72-hr ECMWF forecasts (members) verified on 1st - 31st January in 2007 to 2011.
+72hr
Initial dateof forecast
+48hr
+24hr
1 2 16 30 31January
Total number of samples ( ) for ECMWF: 31days x 5yrs x 51mems = 7905
x 5 years
2007 31-day time window ensemble forecast No bias correction.
How climatological PDFs are estimated from the TIGGE data
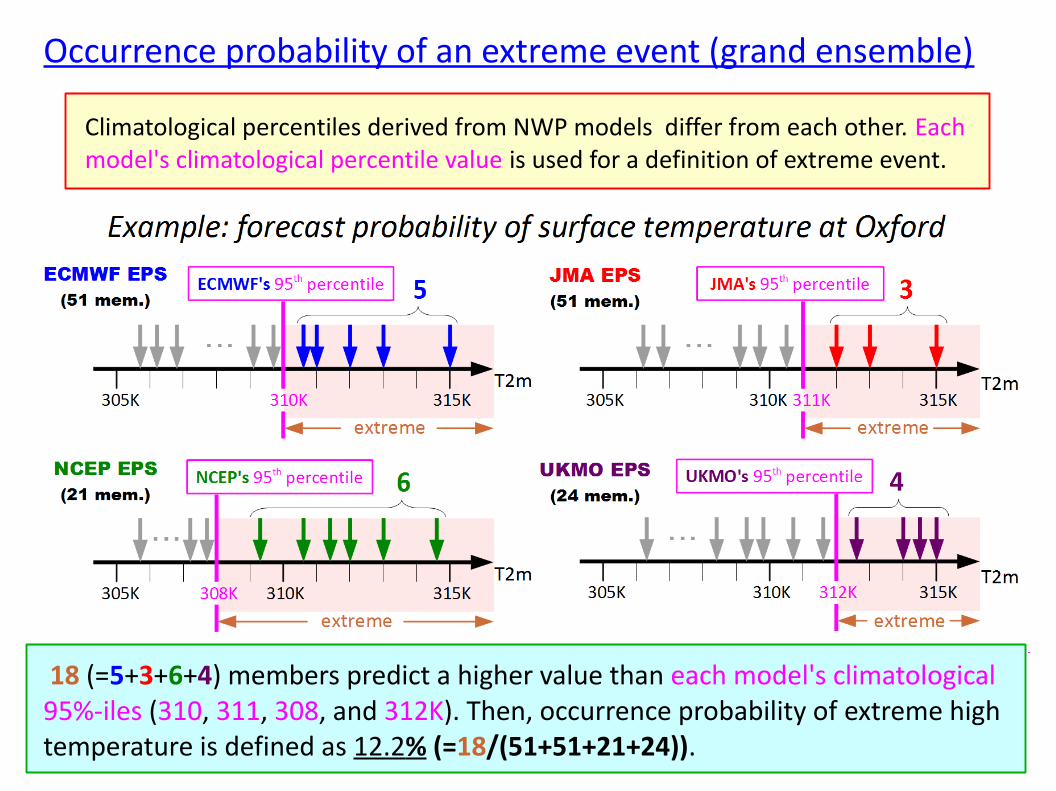
Occurrence probability of an extreme event (grand ensemble)
Climatological percentiles derived from NWP models differ from each other. Each model's climatological percentile value is used for a definition of extreme event.
18 (=5+3+6+4) members predict a higher value than each model's climatological95%-iles (310, 311, 308, and 312K). Then, occurrence probability of extreme hightemperature is defined as 12.2% (=18/(51+51+21+24)).

How to use the early warning products (precipitation)
This is occurrence probabilitiesof extreme precipitation estimated by ensemble forecasts. Here, the 95th percentile of each model's climatological PDF is used as a threshold for a detection of extreme weather events.
Four right panels show predicted occurrence probabilities by ECMWF, JMA, NCEP, and UKMO (shading) and observed extreme precipitation (“+”, also shown as shadings in the lower left panel). The upper left panel shows predicted an occurrence probability by Multi-Centre Grand Ensemble(MCGE) consisting of ECMWF, JMA, NCEP, and UKMO, based on each model's climatological PDF.
All these products are available for the 90th and 99th percentile, as well as the 95th percentile. The products are available for past forecast cases, during the period covered by TIGGE (from October 2006).
URL: http://gpvjma.ccs.hpcc.jp/TIGGE/tigge_extreme_prob.html

How to use the early warning products (continued)
As well as highlighting the risks of extreme rainfall, products are also available for
・Strong wind (as illustrated), ・Surface temperature (both extreme cold and hot),
all in a similar format to the precipitation product.
The observation (analysis) for each NWP centre is defined as the control run at the initial time of the forecast.Observed extremes are detected based on the 95th percentile of each analysis's climatological PDF.
All these products are available for the 90th and 99th percentile, as well as the 95th percentile. The products are available for past forecast cases, during the period covered by TIGGE (from October 2006).
URL: http://gpvjma.ccs.hpcc.jp/TIGGE/tigge_extreme_prob.html
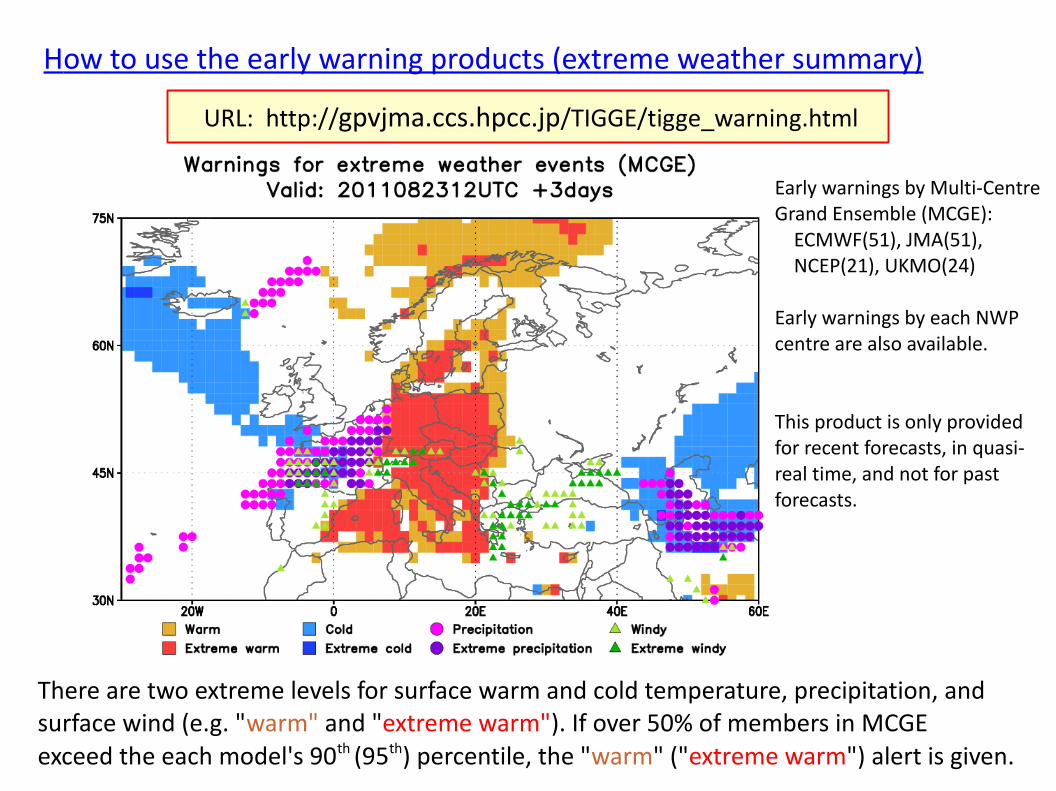
Early warnings by Multi-Centre Grand Ensemble (MCGE): ECMWF(51), JMA(51), NCEP(21), UKMO(24)
Early warnings by each NWP centre are also available.
This product is only provided for recent forecasts, in quasi-real time, and not for past forecasts.
There are two extreme levels for surface warm and cold temperature, precipitation, andsurface wind (e.g. "warm" and "extreme warm"). If over 50% of members in MCGEexceed the each model's 90th (95th) percentile, the "warm" ("extreme warm") alert is given.
URL: http://gpvjma.ccs.hpcc.jp/TIGGE/tigge_warning.html
How to use the early warning products (extreme weather summary)

Examples of early warning for extreme weather events
● heavy rainfall from tropical cyclone Yasi (February 2011)
● flash floods/snow in South Africa (June 2011)
● Russian heatwave (JJA 2010)
● Pakistan floods (July 2010)
● Hurricane Irene (August 2011)
● Hurricane Sandy (October 2012)

3rd February, 2011
Cairns
Yasi struck Cairns with a wind speed of 79m/s Innisfail, Queensland, Australia
Tully, Queensland, Australia
Tropical cyclone Yasi (February 2011)

+ 7-dayforecast
Tropical cyclone Yasi (February 2011)

+ 6-dayforecast
Tropical cyclone Yasi (February 2011)
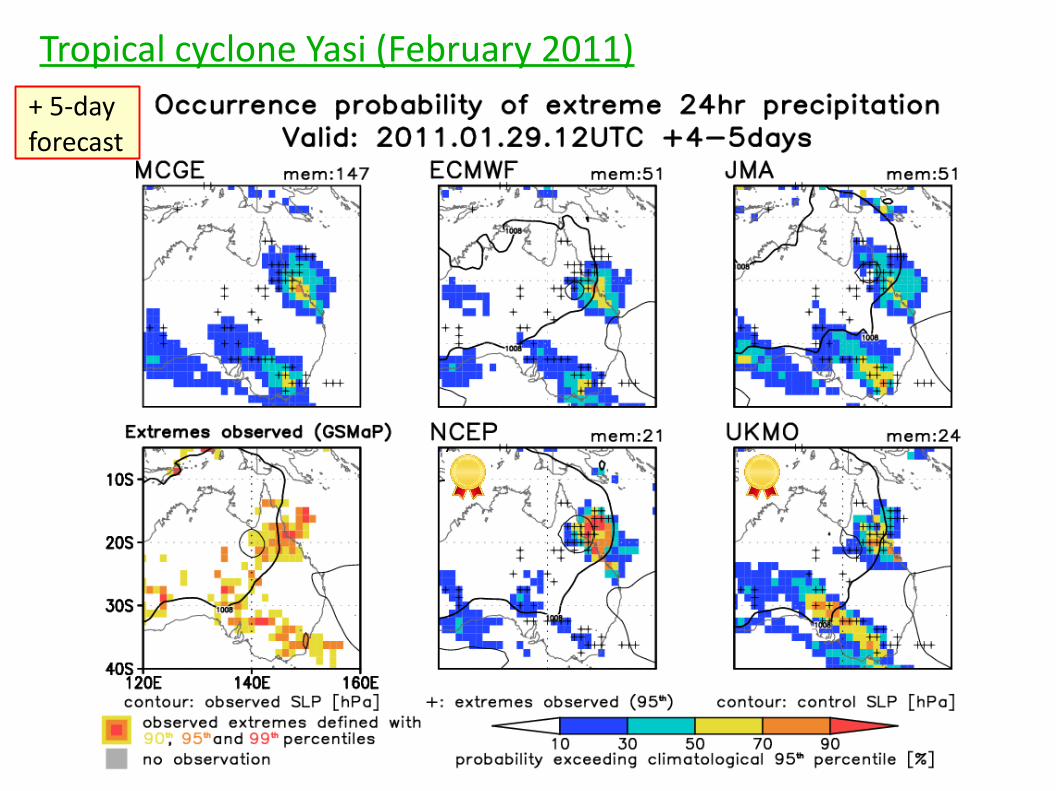
+ 5-dayforecast
Tropical cyclone Yasi (February 2011)

+ 4-dayforecast
Tropical cyclone Yasi (February 2011)
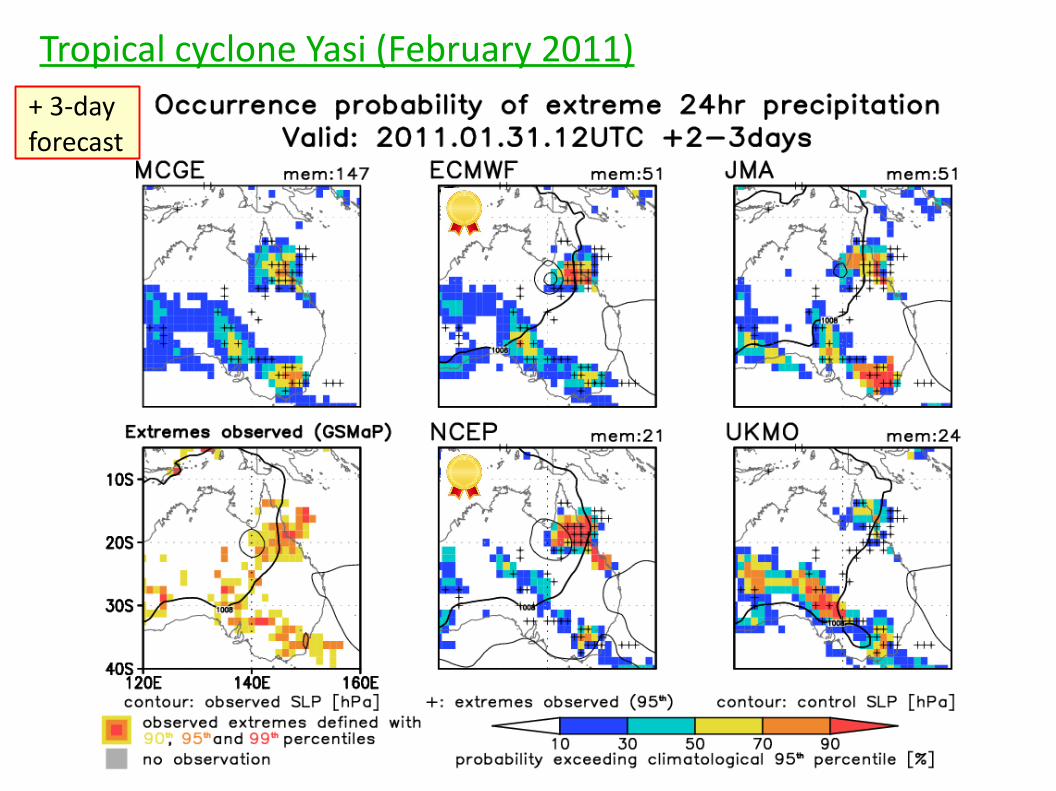
+ 3-dayforecast
Tropical cyclone Yasi (February 2011)

+ 2-dayforecast
Tropical cyclone Yasi (February 2011)

+ 1-dayforecast
Tropical cyclone Yasi (February 2011)

East London, South Africa
00UTC 08 June, 2011
Flash floods/snow in South Africa (June 2011)

Flash floods/snow in South Africa (June 2011)+ 7-dayforecast

4th August
Moscow
Wildfires brought heavy smog
1,600 drowning deaths!
Moscow
China!? Not flu!New maximum record of 39 !℃
The heatwave killed at least 15,000 people, and brought wildfires, smog-induced health injury, and huge economic loss.
Russian heatwave (JJA 2010)

Russian heatwave (JJA 2010)
+ 5-dayforecast

ECMWF Newsletter (No. 125, 2010)
Pakistan floods (July 2010)

Pakistan floods (July 2010)+ 7-dayforecast

Hurricane Irene (August 2011)
Kill Devil Hills, North Carolina, USA(25 August, 2011)
Central Grand Station, NY, USA(27 August, 2011)Irene (27 August, 2011)
From NASA's web
Landed!(12Z 27 Aug.)
12Z 28 Aug.
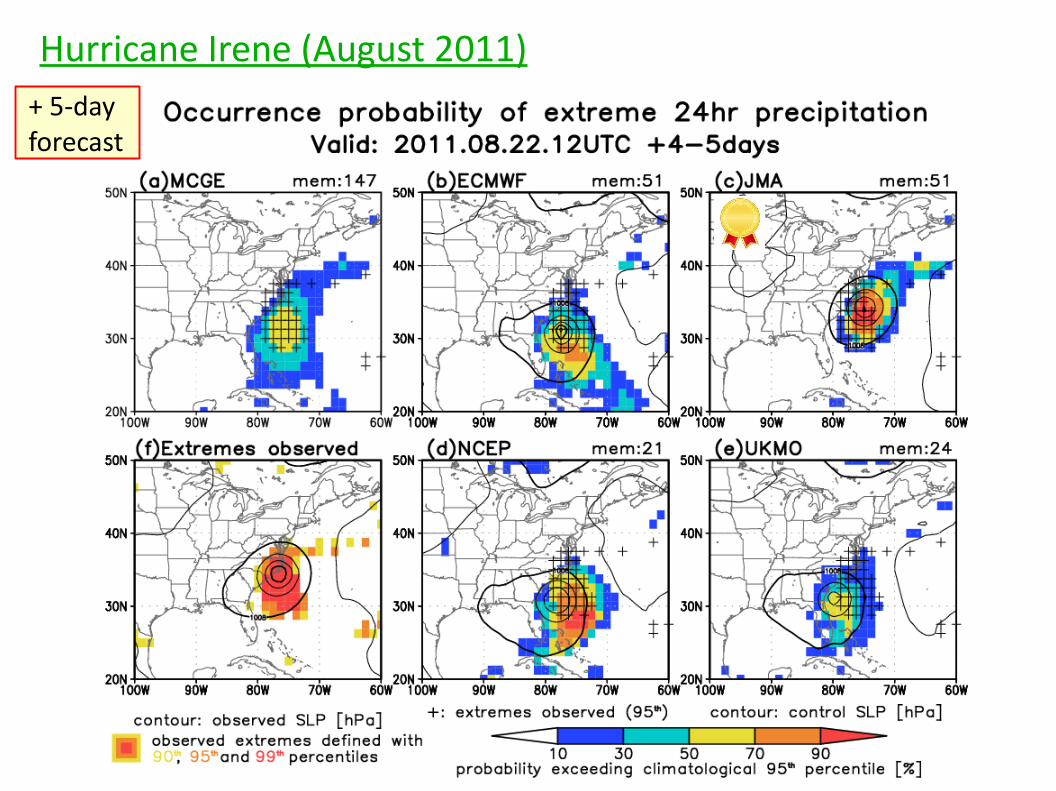
Hurricane Irene (August 2011)+ 5-dayforecast

Hurricane Sandy (October 2012)
Queens, New York City, USA(30 October, 2012)
Hurricane Sandy (28 October, 2012)
Staten Island, New York City, USA(1 November, 2012)
New England, USA(30 October, 2012)
Early warning (28 October, 2012)

+ 6-dayforecast
Hurricane Sandy (October 2012)

In a reliability diagram, the forecast probability is plotted against the frequency of occurrence.
Verification of probabilistic forecast
0% 20% 40% 60% 80% 100%
100%
80%
60%
40%
20%
0%
Forecast probability
fcst. prob. 10% 30% 50% 70% 90%
# of fcst. 30 20 10 20 30 6 8 5 12 21# of obs.
10% was issued 30 times.Event occurred 6 times.(observed frequency = 6/30 = 0.2)
perfect reliability poor reliability
The distribution should lie alongthe 45° diagonal for a reliable probabilistic forecast.
(overconfident)
Reliability diagram
Obs
erve
d pr
obab
ility
Forecast probability
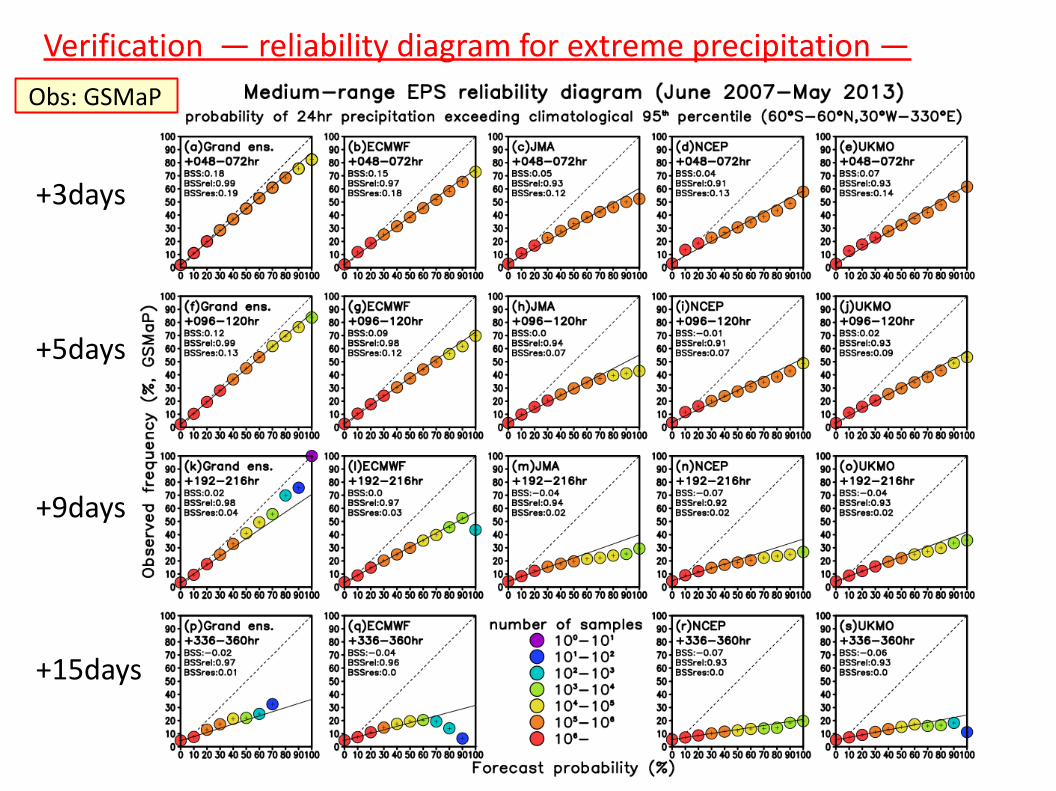
Verification ― reliability diagram for extreme precipitation ―
+3days
+5days
+9days
+15days
Obs: GSMaP
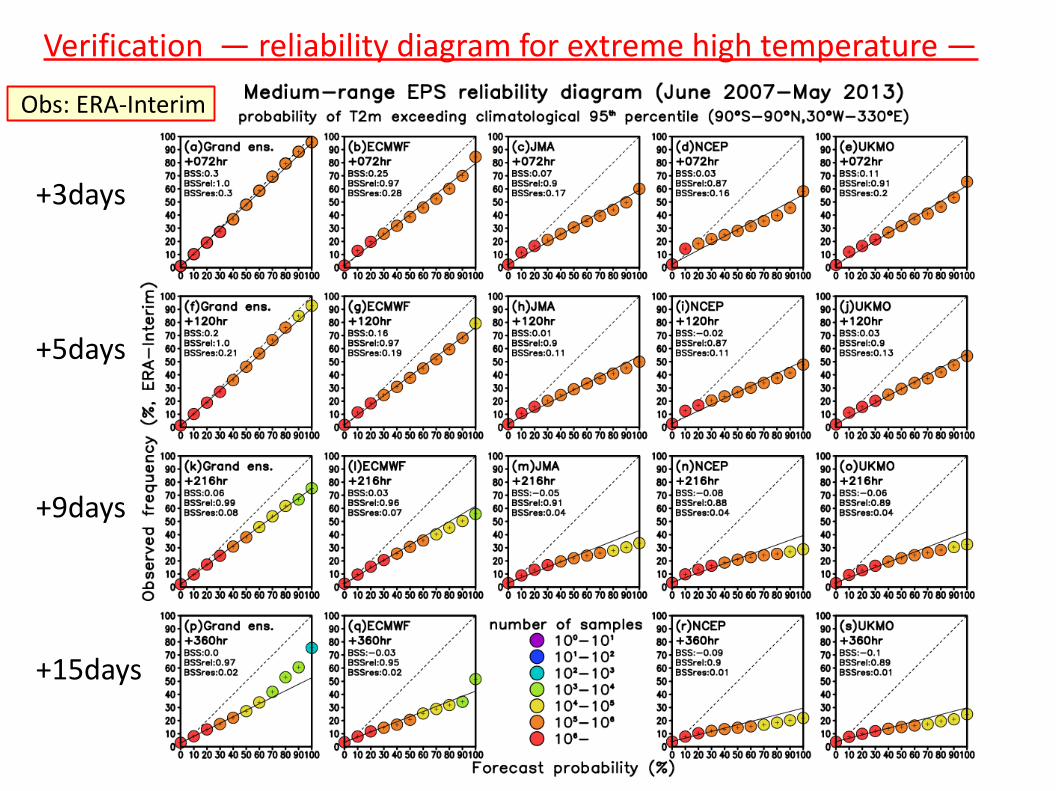
Verification ― reliability diagram for extreme high temperature ―
+3days
+5days
+9days
+15days
Obs: ERA-Interim

Verification ― reliability diagram for extreme low temperature ―
+3days
+5days
+9days
+15days
Obs: ERA-Interim

Verification ― reliability diagram for high wind speeds ―
+3days
+5days
+9days
+15days
Obs: ERA-Interim
BS= 1N ∑
i
N
pi−oi2
:forecast prob. of an event (0 - 1)
:observed prob. of an event (0 or 1) :Number of forecasts
oip i
N
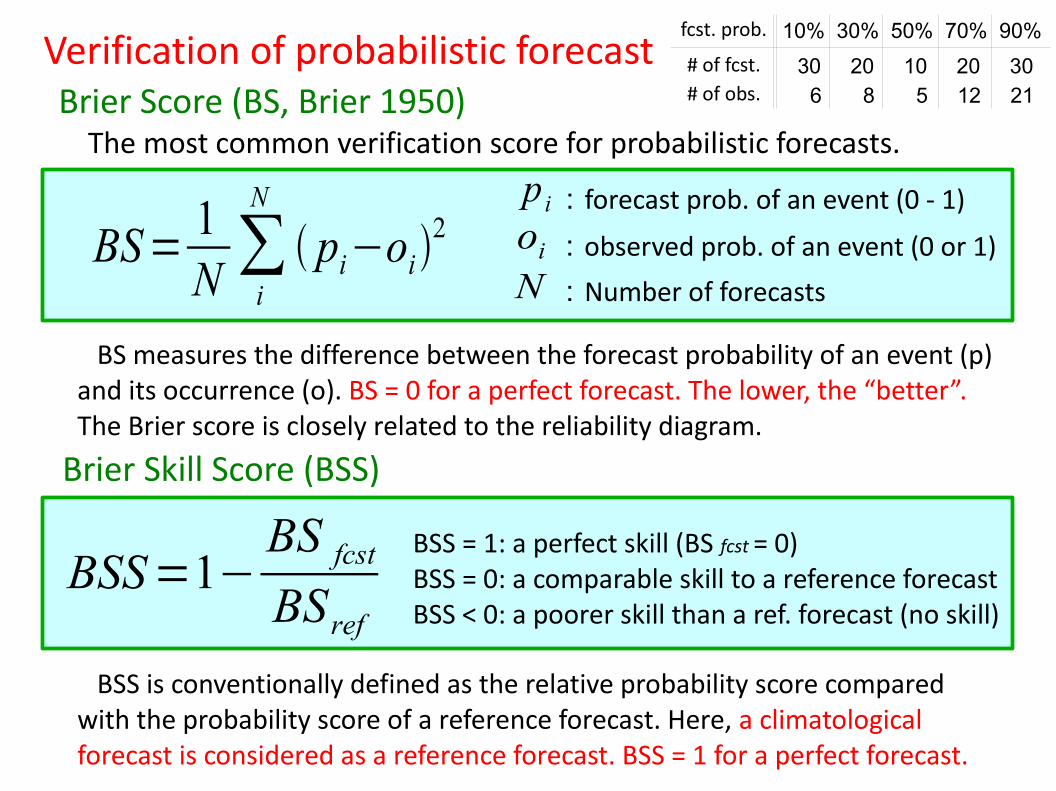
The most common verification score for probabilistic forecasts.
BSS=1−BS fcstBS ref
BS measures the difference between the forecast probability of an event (p) and its occurrence (o). BS = 0 for a perfect forecast. The lower, the “better”.The Brier score is closely related to the reliability diagram.
BSS is conventionally defined as the relative probability score compared with the probability score of a reference forecast. Here, a climatological forecast is considered as a reference forecast. BSS = 1 for a perfect forecast.
BSS = 1: a perfect skill (BS fcst = 0)BSS = 0: a comparable skill to a reference forecastBSS < 0: a poorer skill than a ref. forecast (no skill)
Verification of probabilistic forecastfcst. prob. 10% 30% 50% 70% 90% # of fcst. 30 20 10 20 30
6 8 5 12 21# of obs.Brier Score (BS, Brier 1950)
Brier Skill Score (BSS)

Brier Score and its decomposition
(from “User guide to ECMWF forecast products”)
Verification of probabilistic forecast
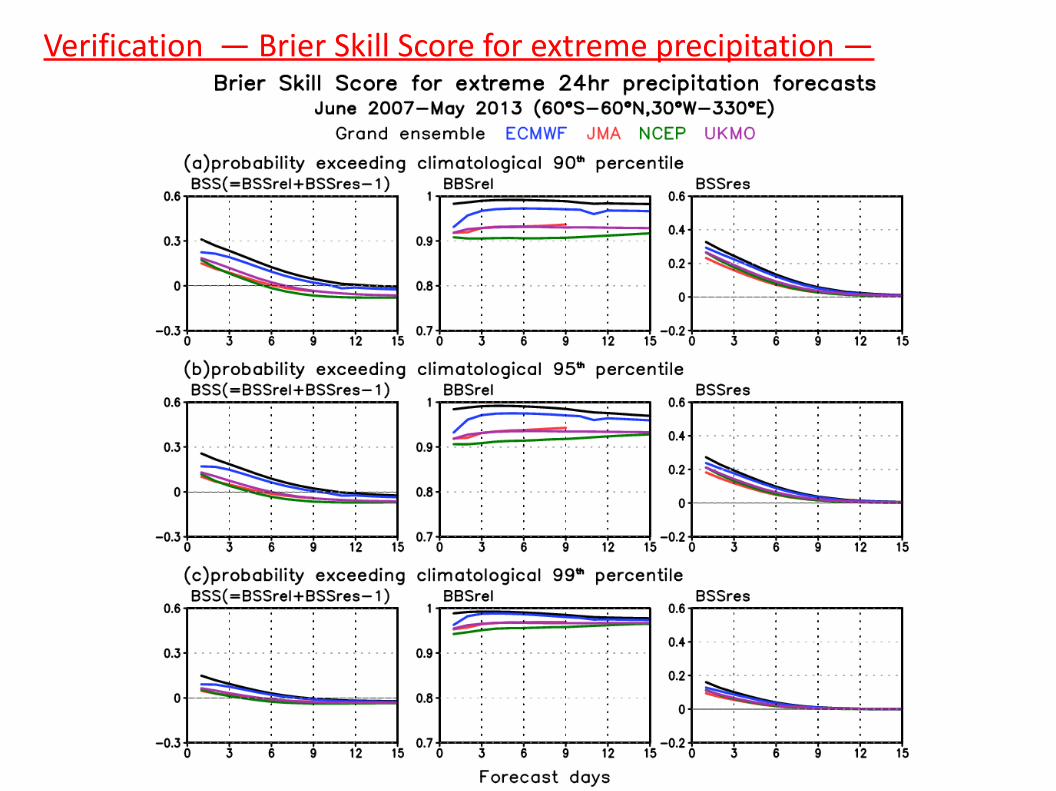
Verification ― Brier Skill Score for extreme precipitation ―

Verification ― Brier Skill Score for extreme high temperature ―

Verification ― Brier Skill Score for extreme low temperature ―

Verification ― Brier Skill Score for high wind speeds ―

Summary We have introduced the ensemble-based early-warning products for extreme weather events, including heavy rainfall, strong surface winds and extreme high/low surface temperatures. The early warning products are based on operational medium-range ensemble forecasts from four of the leading global NWP centres: ECMWF, JMA, NCEP, and UKMO.
The construction of a grand ensemble by combining four single-centre ensembles can improve the forecast reliability regarding probabilistic forecasts of extreme events, up to a lead time of + 360 hr. The grand ensemble can provide more reliable forecasts than single-centre ensembles. This results from a fact that the best performing ensemble is case dependant. Thus, the products may aid the reliable detection of extreme weather events far enough in advance to help mitigate the associated catastrophic damage, especially in developing countries.
The other products using TIGGE data (e.g. daily weather chart, MJO and blocking forecasts, verifications of forecast skills) are also available at
The TIGGE Museum:http://gpvjma.ccs.hpcc.jp/TIGGE/index.html. (Google: “TIGGE museum”)