a building information management application for ict...
TRANSCRIPT

User Manual
A Building Information Management Application
for ICT Devices
Department of Building
School of Design and Environment
National University of Singapore
Author: Andreas Kamilaris
Principal Investigator: A/P Sekhar Kondepudi
26 June 2014

Building Information Management Application for ICT Devices: User Manual
2
Contents
1. Motivation .................................................................................................................................... 3
2. Objectives .................................................................................................................................... 4
3. Implementation Details ................................................................................................................ 5
4. Installation ................................................................................................................................... 6
5. User Guidelines ............................................................................................................................ 7
5.1 Welcome Screen.................................................................................................................... 7
5.2 Manage Devices .................................................................................................................... 8
5.3 Manage Users ....................................................................................................................... 9
5.4 Search for Devices ............................................................................................................... 10
5.5 View the Consumption of Devices ....................................................................................... 12
5.6 View the Consumption of Rooms ........................................................................................ 15
6. References .................................................................................................................................. 17

Building Information Management Application for ICT Devices: User Manual
3
1. Motivation
Large commercial buildings and offices are equipped with thousands or even millions of electrical
devices, which are utilized for accomplishing the goals of each company. The large majority of these
devices relate to Information and Communication Technologies (ICT), such as laptops, desktops,
monitors, printers, scanners, copiers, projectors etc. Some devices are placed in specific offices and
assigned to employees of the company (e.g. desktops, monitors), some are provided to employees
who may use them also away from the office space (e.g. laptops) and some are considered common
and are placed in specific, convenient locations inside the building (e.g. printers, scanners, copiers,
projectors).
An important problem relating to office equipment, especially ICT devices, is their effective
management and administration. In most companies, it is observed that employees come and go with
turnover rates around 2-5% (U.S Department of Labor, Bureau of Labor Statistics, 2013), while moving
between offices, floors, even buildings happens with much higher rates. Hence, it is difficult to keep
track of the ICT equipment, especially in cases when it moves together with the employee to his new
location or when a new employee is assigned equipment previously used by others.
Another important problem relates to the high costs of electrical energy consumed by these ICT
devices, accounting for more than 20% of the total consumption in commercial buildings, with
projections of increasing this percentage by 40% in the next 20 years (Office of Energy Efficiency and
Renewable Energy, U.S. Department of Energy, 2011), (Ghatikar, Cheung, & Lanzisera, 2013). Hence,
the overall management of office equipment needs to take into account the energy expenditure
figures of these ICT devices.

Building Information Management Application for ICT Devices: User Manual
4
2. Objectives
Our literature review has revealed that Building Information Management (BIM) software dealing with
inventorying, managing and analyzing ICT devices in commercial offices and buildings are currently
inexistent. Considering the increasing costs of the energy consumed by these devices, there is a need
for a BIM software that records, analyzes, and compares the consumption of each device, offering
opportunities for energy savings to the building administrators.
Therefore, our main objective was to develop a BIM application that performs the following tasks:
1. Hosts an online inventory containing details and characteristics about available ICT devices in a
commercial building and their corresponding users (building employees).
2. Adds, edits and deletes ICT devices from its online inventory.
3. Adds, edits and deletes users.
4. Relating ICT devices with their users as well as with the actual location where they have been
placed.
5. Allowing searching for specific ICT devices based on their location (building, floor, office, device
type, model etc.).
6. Offering the possibilities to observe, analyze and compare the energy consumption of ICT
devices, identifying gaps for energy savings (e.g. identifying a faulty appliance, considering
replacing some equipment with more energy-efficient one).
7. Giving the option to observe the behavior of users in terms of how energy-efficient they are
(e.g. whether they switch-off their desktop/laptop PCs before leaving the office).
These tasks are important for many large organizations, because they are interested to be able to
know accurately where their office equipment is located inside their office space, see the available
devices located inside some particular office, select some devices and observe/compare their real-
time consumption, being able to calculate the aggregated consumption inside/between offices.

Building Information Management Application for ICT Devices: User Manual
5
3. Implementation Details
This software has been developed using open-source Web technologies. More precisely, the following
programming languages and libraries have been employed:
Back-End: PHP programming language (PHP).
Front-End: JavaScript programming language.
Graphics: Kendo Framework (Telerik).
Libraries for Front-End: jQuery JavaScript library (jQuery)
Communication between back-end and front-end: AJAX.
Database: MySQL (MySQL).
The front-end contains the user interface which is visible and accessible to the user. The back-end is
responsible for the application’s logic and performs the interaction with the MySQL database, to
get/store/manage/process data and send to the front-end for presentation.
The source code of the application contains the following files/folders:
Index.php: Contains the JavaScript code of the application.
Kami.css: CSS styling used in the application.
Backend/ folder: Contains the PHP scripts used for getting/storing/editing/processing data.
Images/ folder: Contains the images used by the front-end.
Js/ folder: Contains the JavaScript libraries used for graphics, mainly jQuery and the Kendo
framework.
Styles/ folder: Contains various styles used for improving the user interface.
We note that the application has been developed in general using Web technologies such as HTML5.
Hence, it might not work properly on some older versions of Mozilla Firefox and Google Chrome, as
well as on more recent versions of Internet Explorer, as it does not yet fully support HTML5. No
problems have been identified by using recent versions of Mozilla Firefox (e.g. version 24) and Google
Chrome (e.g. version 35).

Building Information Management Application for ICT Devices: User Manual
6
4. Installation
To install the software, one needs to download the source code from the following link:
https://www.dropbox.com/s/9aab9jnk3mnubm5/BMS_NUS_software.zip, and then extract the
contents of the zip file into the web directory of a working server (e.g. Apache). Since the software
operates in collaboration with a MySQL database, for managing information of users/devices and also
energy consumption data, one needs to create a MySQL database and import into this database the
tables needed by the application to work properly. To do this, the SQL file located at the following
link: https://www.dropbox.com/s/fzsv0v6dvptbybo/EnergySDE.sql needs to be downloaded and
imported into the database. Importing an SQL file to an existing database is very easy. For example, by
using PhpMyAdmin (PhpMyAdmin) software (a graphical software environment for managing MySQL
databases), a user can move to the Import tab and select the SQL file from the File to Import option.
By clicking on Go (bottom of page), the tables and data are imported into the database automatically.
Figure 1: Import interface at PhpMyAdmin
Finally, the dbauth.php file, located in backend/ folder needs to be adjusted to include the current
database connection information:
$conn = mysql_connect("server URL","username","password");
mysql_select_db("databasename",$conn);

Building Information Management Application for ICT Devices: User Manual
7
5. User Guidelines
In this section we describe how a user can interact with the application. We split the features of the
application into different sub-sections, aiming to make the procedure of using the application as easy
as possible.
5.1 Welcome Screen
To launch the application, a user needs to open his favorite Web browser and type:
http://www.{serverurl}/visibleEnergySDE, where serverurl is the URL of the server on which the
application has been hosted. In case everything is OK, then the user should be able to see the
following screen:
Figure 2: Welcome Screen
This screen has three different interfaces: one for staff users who have only access to their personal
electrical appliances (located inside their office); one for students who have access only to general
statistics and information; and one for administrators, who have full access over the application. We
note that the students interface has not been developed.

Building Information Management Application for ICT Devices: User Manual
8
From now on, we consider and describe only the features being accessible by administrators. Staff
users may have access only to a subset of these features, i.e. those relating to viewing the
consumption of their personal electrical appliances.
For administrators to enter the application, they can use the default administration credentials:
Username: admin
Password: nus1234sde
Then, they can create various user accounts, including some of those having administration rights, if
they wish. We will see later how new user accounts can be created.
5.2 Manage Devices
It is important for administrators to be able to manage their ICT devices. This interface allows to view
all available ICT devices in a list, selecting from particular buildings, floors, offices and/or device types.
For each device, the user can edit its specifications (location, model, brand, type), export its electric
consumption as a CSV file, and also delete it. The figure below shows a snapshot of this interface,
listing all the available devices. At the right side (Options), the user may perform the aforementioned
operations on the devices.
Figure 3: Managing Devices Interface
An important operation involves the assignment of an ACme device to some ICT appliance. ACme
devices (Jiang, Dawson-Haggerty, Dutta, & Culler, 2009) are smart plugs installed between the
appliance and the wall socket, measuring the consumption of the appliance, transmitting the
measurements to a central base station, which forwards them to our database. This assignment can
be performed through the Edit command from Options, or when a new device is added to the
application.

Building Information Management Application for ICT Devices: User Manual
9
Adding a new device is easy, and can be performed by clicking on the button located at the top-right
corner of the above screenshot. When the user clicks this button, the window shown in the figure
below appears:
Figure 4: Adding a new Device Window
The administrator can insert the required information, assign an ACme to this device (if he wants,
otherwise he may leave that box empty) and click on the Add Device button, located at the bottom of
this window. The list will be updated automatically to include the newly-added device.
5.3 Manage Users
Through this interface, administrators can manage the users of the application, whether these are
other administrators, students or staff. The figure below shows a listing of some users of the building,
their name/surname, role and location of their office inside the building.
Figure 5: Managing Users Interface

Building Information Management Application for ICT Devices: User Manual
10
By clicking on the Edit button, located at the right side of each user listed, the administrator can edit
his personal details, username, password, location etc. Also, the user can add a new user by clicking
on the Add New User button, located at the top-right corner of this interface. In this case, the window
shown in the following figure appears, and the administrator can easily add a user to the application.
Figure 6: Adding a new User Window
5.4 Search for Devices
As soon as an administrator logins successfully, he is redirected to a menu for searching for available devices. There are four different ways to search for devices:
Search Buildings of SDE
Search Floors inside the selected buildings of SDE
Select rooms/labs inside the selected buildings/floors of SDE
Select device types (e.g. desktop, laptop, printer, monitor etc.).

Building Information Management Application for ICT Devices: User Manual
11
Figure 7: Searching for Devices Interfaces
As the figures above show, a user can click on the aerial view of the School of Design and Environment
(SDE) and select some particular building to search for ICT devices inside it. Three buildings can be
selected: SDE1, SDE2 and SDE3. On the other hand, the user can select a device type from the
available device types listed at the database. In this example, monitors, laptops, desktops and printers
can be selected. As soon as a user selects for first time some location or device type, the Search
Criteria window appears on the middle-left side of the screen, as shown in the following figure:
Figure 8: Search Criteria Window

Building Information Management Application for ICT Devices: User Manual
12
Every selection of the user in terms of searching for devices appears in this list of criteria. In case the
user wants to remove some of these criteria, he only needs to click on the button showing the
particular option. For example, considering the figure above, if the user wants to remove desktops
from his search, he can click on the Desktop button and the searching is automatically updated for all
devices that fulfill the other criteria, except desktops.
5.5 View the Consumption of Devices
After selecting some criteria for searching for devices, the user may select some of the particular
devices that meet these criteria and view their consumption at the See/Compare Devices interface. In
the example shown at the following figure, the user selects some laptop and can observe its current
consumption in the last 300 seconds and 5 minutes. He can select from various measures including
active power, apparent power, voltage and current. The number of seconds and minutes can be edited
by the user to the desired values he prefers. Moreover, the user can select some particular date/time
to observe the specific current consumption of the selected device.
Figure 9: Viewing the Consumption of Devices - Instant View

Building Information Management Application for ICT Devices: User Manual
13
Instead of seconds/minutes, the user can select cumulative figures, such as the consumption over
some hours or days for some device. He can perform this by changing the View option from instant to
cumulative. The figure below shows how the different graphs and their values change in this case.
Figure 10: Viewing the Consumption of Devices - Cumulative View
The reader may have observed the two pie charts appearing at the right of the snapshots. These
charts show the weekly and monthly consumption of the selected ICT devices, and they are more
meaningful when multiple devices are selected for view/comparisons, as we will see below.
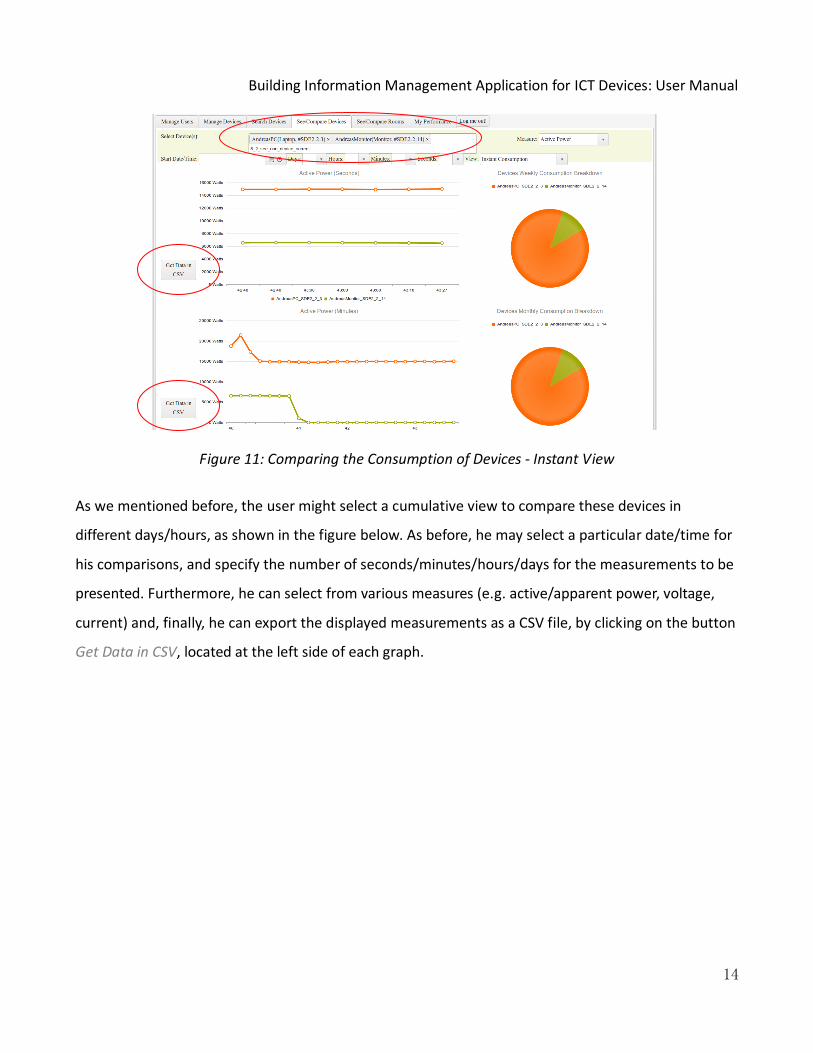
The next figure shows the scenario when a user compares his laptop’s consumption with his monitor’s
one. As we can observe, with orange color is the laptop’s consumption and with green color the
monitor’s one. In this case, the pie charts appearing on the right side of the screen are more
interesting, as they depict the breakdown of consumption at this office desk for the specified
week/month.
Building Information Management Application for ICT Devices: User Manual
14
Figure 11: Comparing the Consumption of Devices - Instant View
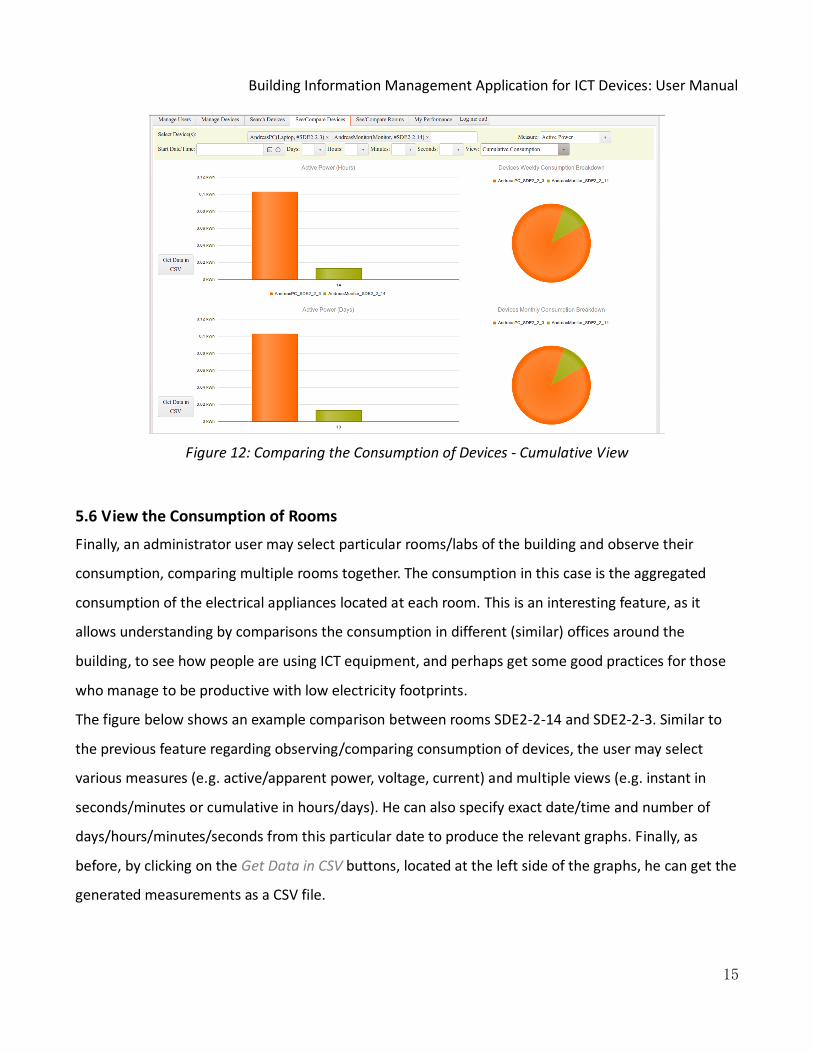
As we mentioned before, the user might select a cumulative view to compare these devices in
different days/hours, as shown in the figure below. As before, he may select a particular date/time for
his comparisons, and specify the number of seconds/minutes/hours/days for the measurements to be
presented. Furthermore, he can select from various measures (e.g. active/apparent power, voltage,
current) and, finally, he can export the displayed measurements as a CSV file, by clicking on the button
Get Data in CSV, located at the left side of each graph.
Building Information Management Application for ICT Devices: User Manual
15
Figure 12: Comparing the Consumption of Devices - Cumulative View
5.6 View the Consumption of Rooms
Finally, an administrator user may select particular rooms/labs of the building and observe their
consumption, comparing multiple rooms together. The consumption in this case is the aggregated
consumption of the electrical appliances located at each room. This is an interesting feature, as it
allows understanding by comparisons the consumption in different (similar) offices around the
building, to see how people are using ICT equipment, and perhaps get some good practices for those
who manage to be productive with low electricity footprints.
The figure below shows an example comparison between rooms SDE2-2-14 and SDE2-2-3. Similar to
the previous feature regarding observing/comparing consumption of devices, the user may select
various measures (e.g. active/apparent power, voltage, current) and multiple views (e.g. instant in
seconds/minutes or cumulative in hours/days). He can also specify exact date/time and number of
days/hours/minutes/seconds from this particular date to produce the relevant graphs. Finally, as
before, by clicking on the Get Data in CSV buttons, located at the left side of the graphs, he can get the
generated measurements as a CSV file.

Building Information Management Application for ICT Devices: User Manual
16
Figure 13: Comparing the Consumption of Rooms - Cumulative View

Building Information Management Application for ICT Devices: User Manual
17
6. References
Ghatikar, G., Cheung, H. I., & Lanzisera, S. (2013). Miscellaneous and Electronic Loads Energy Efficiency
Opportunities for Commercial Buildings: A Collaborative Study by the United States and India.
Retrieved from http://eetd.lbl.gov/sites/all/files/mels-evaluation-infosys.pdf
Jiang, X., Dawson-Haggerty, S., Dutta, P., & Culler, D. E. (2009). Design and implementation of a high-
fidelity ac metering network. 8th ACM/IEEE International Conference on Information
Processing in Sensor Networks (IPSN) (pp. 253-264). San Francisco, CA, USA: ACM.
jQuery. (n.d.). JavaScript Library. Retrieved from http://jquery.com/
MySQL. (n.d.). Open-Source Database. Retrieved from http://www.mysql.com/
Office of Energy Efficiency and Renewable Energy, U.S. Department of Energy. (2011). Buildings Energy
Data Book. Retrieved from http://buildingsdatabook.eren.doe.gov/
PHP. (n.d.). General Purpose Scripting Language. Retrieved from http://php.net/
PhpMyAdmin. (n.d.). Management of MySQL over the Web. Retrieved from
http://www.phpmyadmin.net/home_page/index.php
Telerik. (n.d.). Kendo UI HTML5/JavaScript framework. Retrieved from http://www.kendoui.com/
U.S Department of Labor, Bureau of Labor Statistics. (2013). Job Openings and Labor Turnover.
Retrieved from http://www.bls.gov/news.release/pdf/jolts.pdf