a case for optimism, the economic outlook
DESCRIPTION
A Case for Optimism, The Economic Outlook. Wednesday, March 7, 2007 Richard Yamarone, SVP & Director of Economic Research Argus Research Corp. “60” and Counting – That’s Resilience. Source: Bureau of Economic Analysis. Consumers Are Quite Confident. Source: The Conference Board. - PowerPoint PPT PresentationTRANSCRIPT

1
A Case for Optimism,The Economic Outlook
Wednesday, March 7, 2007
Richard Yamarone,SVP & Director of Economic Research
Argus Research Corp.
2
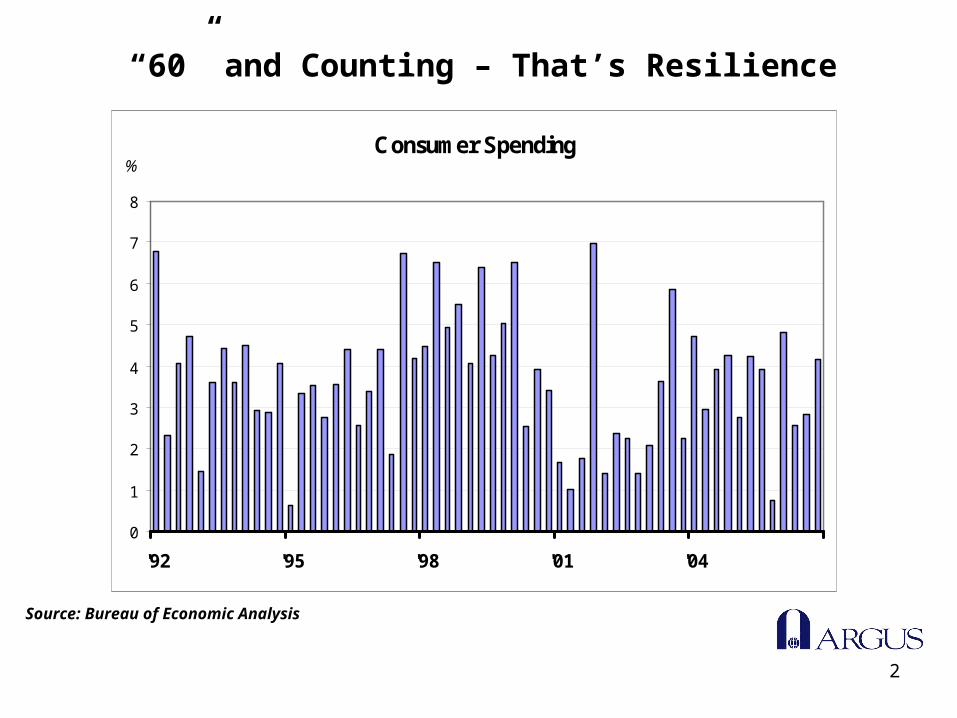
“60” and Counting – That’s Resilience
Source: Bureau of Economic Analysis
Consumer Spending
0
1
2
3
4
5
6
7
8
'92 '95 '98 '01 '04
%
Source: Bureau of Economic Analysis
3
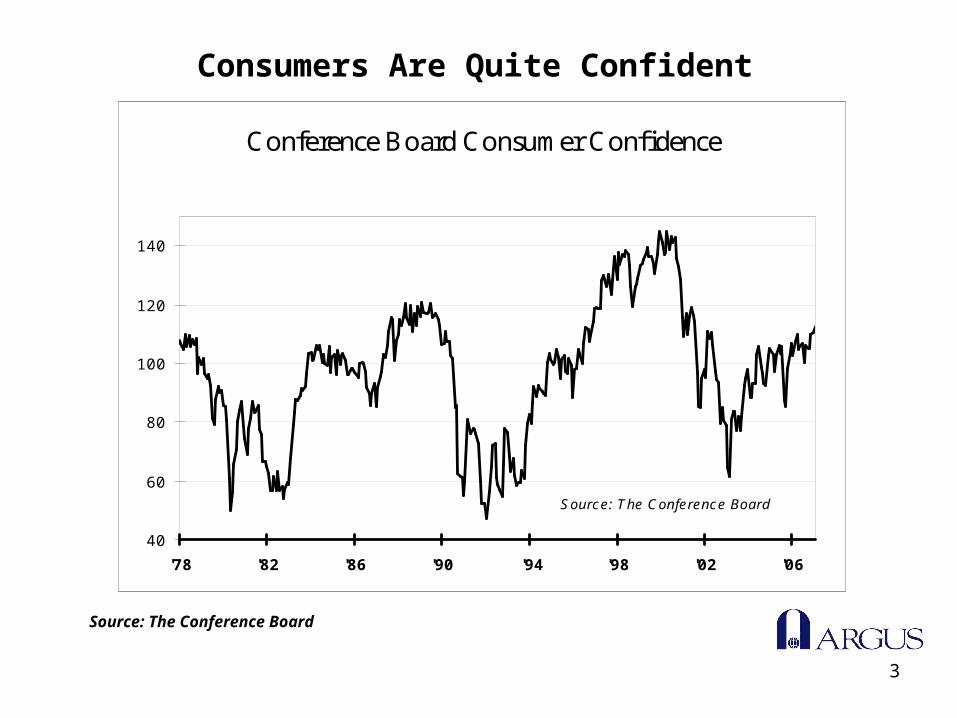
Consumers Are Quite Confident
Source: The Conference Board
Conference Board Consumer Confidence
40
60
80
100
120
140
'78 '82 '86 '90 '94 '98 '02 '06
Source: The Conference Board

4
Jobless Claims Still Quite Low
Source: U.S. Department of Labor; U.S. Bureau of Economic Analysis, Argus Research
Real GDP vs. Initial Jobless Claims
-2
-1
0
1
2
3
4
5
6
'87 '89 '91 '93 '95 '97 '99 '01 '03 '05
250,000
300,000
350,000
400,000
450,000
500,000
550,000
GDP
Claims
GDP% Claims
Source: Bureau of Economic Analysis, Dept. of Labor, Argus Research

5
Jobs Still Easy to Get
Source: The Conference Board; Bureau of Labor Statistics
Job Openings Rate
1.8
2.0
2.2
2.4
2.6
2.8
3.0
3.2
3.4
3.6
'01 '02 '03 '04 '05 '06
%
Source: Bureau of Labor Statistics
'Jobs Hard-to-Get' &Unemployment Rate
3
4
5
6
7
8
9
'90 '92 '94 '96 '98 00 '02 '04 '06
0
10
20
30
40
50
U Rate Jobs Index
Jobs Index
Unemployment Rate

6
Discretionary Spending Still Strong
Source: Bureau of Economic Analysis, Argus Research Corp.
Spending: Cosmetics & Perfumes
-12
-8
-4
0
4
8
'91 '94 '97 '00 '03 '06
Y/Y%
Spending: Jewelry & Watches
-12
-8
-4
0
4
8
12
'91 '94 '97 '00 '03 '06
Y/Y%

7
Low Interest Rate Environment
Source: Board of Governors of the Federal Reserve
10-Year Treasury Note
2
3
4
5
6
7
8
9
10
'90 '92 '94 '96 '98 '00 '02 '04 '06
%
Benchmark30-YR Mortgage Rate
4
6
8
10
12
14
16
18
20
'72 '76 '80 '84 '88 '92 '96 '00 '04
%

8
Incomes, Wages & Salaries are on the Rise
Source: Bureau of Economic Analysis, Argus Research Corp.
Real Disposable Personal Income
-2
0
2
4
6
8
'92 '94 '96 '98 '00 '02 '04 '06
%

9
Inflation Well-Behaved
Source: Bureau of Labor Statistics, Argus Research Corp.
Consumer Prices
0
1
2
3
4
5
6
7
'90 '95 '00 '05
YOY%

10
This Isn’t the 1950s
Source: Lewis Wickes Hine, “Power House Mechanic”
11
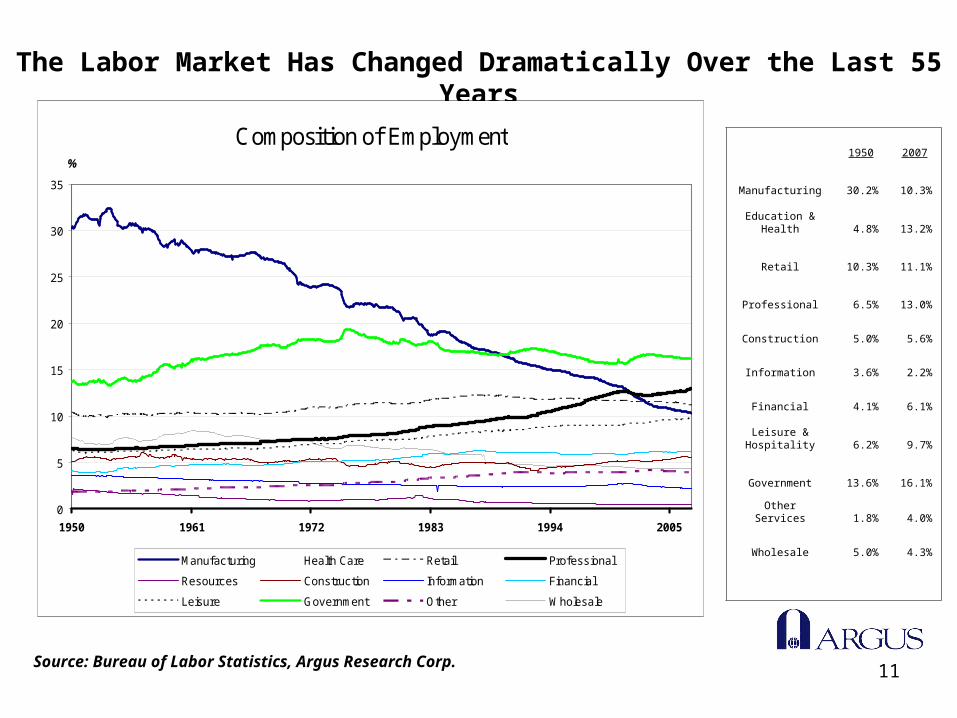
1950 2007
Manufacturing 30.2% 10.3%
Education & Health 4.8% 13.2%
Retail 10.3% 11.1%
Professional 6.5% 13.0%
Construction 5.0% 5.6%
Information 3.6% 2.2%
Financial 4.1% 6.1%
Leisure & Hospitality 6.2% 9.7%
Government 13.6% 16.1%
Other Services 1.8% 4.0%
Wholesale 5.0% 4.3%
The Labor Market Has Changed Dramatically Over the Last 55 Years
Source: Bureau of Labor Statistics, Argus Research Corp.
Composition of Employment
0
5
10
15
20
25
30
35
1950 1961 1972 1983 1994 2005
Manufacturing Health Care Retail Professional
Resources Construction Information Financial
Leisure Government Other Wholesale
%
Source: U.S. Department of Labor, Bureau of Labor Statistics

12
We Don’t Do Unions
Union Enrollment
10
12
14
16
18
20
22
'83 '86 '89 '92 '95 '98 '01 '04
15.0
15.5
16.0
16.5
17.0
17.5
18.0Member, Mlns
% of Employed
% Members, Mlns
Source: Bureau of Labor Statistics
13
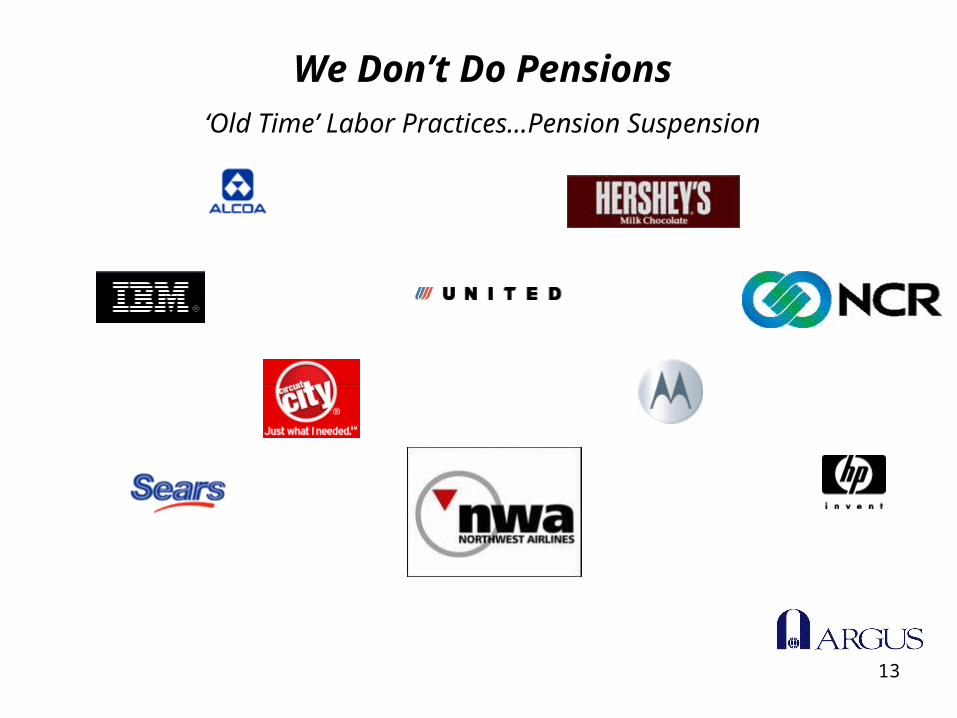
We Don’t Do Pensions‘Old Time’ Labor Practices…Pension Suspension

14
Employers Don’t Even Pay Benefits
Source: Bureau of Labor Statistics
Employment Costs: Private Industry
0
1
2
3
4
5
6
7
8
2002 2003 2004 2005 2006
Compensation
Wages & Salaries
Benef its
YOY%

15
Different Type of Job Creation After 9/11
Source: Bureau of Labor Statistics, Argus Research Corp.
Post Recession, 9/11 Job Creation
95
100
105
110
115
120
125
Dec-01 Dec-02 Dec-03 Dec-04 Dec-05 Dec-06
Nonfarm
Household
"Tem p"
Self-Em ployed
December 2001=100
4.9%
7.3%
23.6%
10.5%
Source: Bureau of Labor Statistics, Argus Research Corp.

16
Source: Bureau of Labor Statistics, Board of Governors Federal Reserve,
Argus Research Corp.
Employment: Motor Vehicles, Parts
200
220
240
260
280
300
320
'99 '00 '01 '02 '03 '04 '05 '06
Vehicles, '000
400
500
600
700
800
900Parts, '000
Vehicles
Parts
Employment: Apparel, Footwear
0
10
20
30
40
50
60
70
80
90
'90 '92 '94 '96 '98 '00 '02 '04 '06
Footwear, '000
0
200
400
600
800
1000
1200Apparel, '000
Footwear
Apparel
Employment: Iron & Steel Mill
80
110
140
170
200
'90 '93 '96 '99 '02 '05
,000
Iron & Steel MillEmployment
Employment: Nail Salons
15
18
21
24
27
30
33
1990 Jan-94 Jan-98 Jan-02 Jan-06
'000
Employment: Community Care Service s for the Elderly
300
380
460
540
620
700
'90 '92 '94 '96 '98 '00 '02 '04 '06
'000
“You Can Observe A Lot by Watching”…
Employment: Custom Computer Programming Services
100
200
300
400
500
600
700
'90 '92 '94 '96 '98 '00 '02 '04 '06
'000

17
‘Household-type’ Jobs
Source: Bureau of Labor Statistics, Bureau of Economic Analysis, Argus Research Corp.
Real GDP vs 'Household Job' Growth
-2
-1
0
1
2
3
4
5
'85 '87 '89 '91 '93 '95 '97 '99 '01 '03 '05 '07
Real GDP
Household Employment
%

18
Ethanol Boom is Much Bigger than Corn
Source: U.S. Department of Agriculture, Argus Research Corp.
High Fructose Corn Syrup
-30
-20
-10
0
10
20
30
40
1995 1997 1999 2001 2003 2005 2007
YOY%
Source: USDA

19
Ag Prices on the Rise
Source: U.S. Department of Agriculture, Argus Research Corp.
Prices Received by Farmers
80
90
100
110
120
130
140
150
'95 '96 '97 '98 '99 '00 '01 '02 '03 '04 '05 '06 '07
All
Crop
Livestock
20
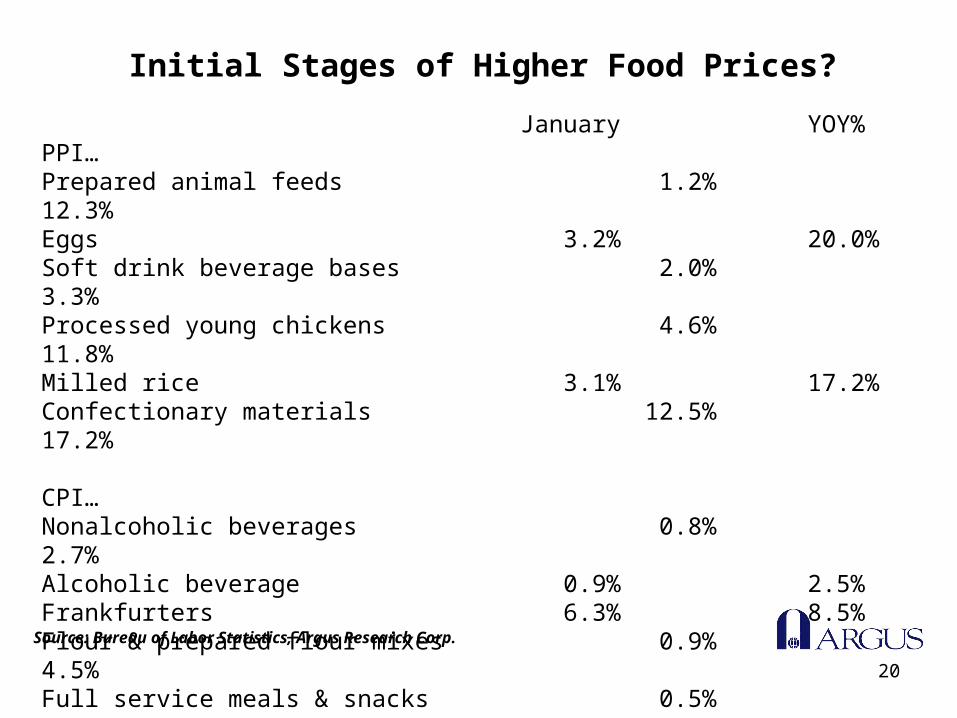
Initial Stages of Higher Food Prices?
Source: Bureau of Labor Statistics, Argus Research Corp.
January YOY%PPI…Prepared animal feeds 1.2% 12.3%Eggs 3.2% 20.0%Soft drink beverage bases 2.0% 3.3%Processed young chickens 4.6% 11.8%Milled rice 3.1% 17.2%Confectionary materials 12.5% 17.2%
CPI…Nonalcoholic beverages 0.8% 2.7%Alcoholic beverage 0.9% 2.5%Frankfurters 6.3% 8.5%Flour & prepared flour mixes 0.9% 4.5%Full service meals & snacks 0.5% 3.7%Other food away from home 1.3% 5.1%Crackers, bread, and cracker products 3.2% 3.6%

21
Reasons for the Federal Reserve to Pause
Argus Research Corp.
Cumulative Effect of Previous Actions
(17, 25 basis point rate hikes)
Unknown Magnitude of Housing Downturn
(macroeconomic consequences)

22
Reasons for the Federal Reserve to Hike
Argus Research Corp.
Commodity (Food) Inflation
(price pass alongs announced during the quarterly earning season)
Unemployment Rate at Cyclical Low
Import Inflation from Weaker U.S. Dollar
All Inflation Measures Exceeding Purported ‘Comfort Zone’
Wages, Incomes, & Salaries Rising

23
Reasons for the Federal Reserve to Cut
Argus Research Corp.
Lower Mortgage Rates from 5.8%?
Send Unemployment Rate Lower?
Boost Consumer Spending from 4.2%?
Stimulate Economy?
No Legitimate Reason to Reduce Overnight Target Rate…

24
Core Inflation Above ‘Comfort Zone’
Source: Bureau of Economic Analysis, Argus Research Corp.
Core Personal Consumption Expenditure Deflator
0.0
0.5
1.0
1.5
2.0
2.5
3.0
3.5
4.0
4.5
'90 '92 '94 '96 '98 '00 '02 '04 '06
%
Federal Reserve's 'Comfort Zone'

25
Respected Inflation Barometer Still Elevated
Source: Federal Reserve Bank of Dallas, Argus Research Corp.
Dallas Fed Trimmed-Mean PCE Inflation Rate
1.5
1.7
1.9
2.1
2.3
2.5
2.7
2.9
'95 '97 '99 '01 '03 '05 '07
Source: Federal Reserve Bank of Dallas
%

26
Pricing Power Index
Source: Federal Reserve Bank of Philadelphia, Institute for Supply Management,
Argus Research Corp.
Philadelphia Fed Current Prices Paid lessDifference Current & Future Prices Received
vs. ISM Prices
-50
-30
-10
10
30
50
70
'87 '90 '93 '96 '99 '02 '05
30
40
50
60
70
80
90
100
CPP-(FPR-CPR)
ISM Prices
ISM PricesCPP-(FPR-PR)