a case study: energy use and process design …
TRANSCRIPT

Wor World Congress/Perth Convention and Exhibition Centre (PCEC), Perth, Western Australia September 4-9, 2011 REF: IDAWC/PER11-322
A CASE STUDY: ENERGY USE AND PROCESS DESIGN CONSIDERATIONS FOR FOUR DESALINATION PROJECTS IN CALIFORNIA Authors: Erik Desormeaux and Juan Miguel Pinto Presenters: Erik Desormeaux Project Manager, CDM – USA Abstract California is the 7th largest economy in the world with a significant need for drinking water and irrigation water for agriculture to keep up with the state’s current needs and future demands. As part of this need, California has funded projects related to more than 10 proposed desalination plants across the state through Proposition 50, a grant program administered by the State Department of Water Resources. While the majority of these projects have been pilot and demonstration scale research studies, many of the full-scale projects have been delayed due to permitting challenges, public opposition, and political challenges. This paper presents information about the Sand City, Cambria, Santa Cruz, and Dana Point projects with each facility at different stages of project development and requiring different solutions to move the project forward. The Sand City Desalination Facility, located in Monterey County, California, is the first full-scale, municipal desalination plant in California permitted under the new surface water treatment regulations. The facility has a capacity of 2.3 million liters per day (MLD) and produces approximately 1.1 MLD on average. Additionally, design features led to nearly $100,000 in rebates for energy efficiency measures expected to save more than 1.2 million kilowatt-hours of electricity and 667 tons of greenhouse gas emissions per year. The Cambria Desalination Facility was on track to be the second full-scale, municipal desalination plant in California. However, permitting issues related to intake location and selection has delayed the project. The proposed facility will produce up to 3.8 MLD. The proposed scwd2 Desalination Facility in Santa Cruz will produce up to 9.5 MLD and is currently in the preliminary design and permitting phase. Several in-depth studies have been completed to identify and demonstrate solutions to address concerns from the public and regulators. Lastly this paper will present an update on the Dana Point Desalination Facility which will produce up to 56 MLD and is currently in the pilot-testing and planning phase. This project will be the first to implement slant wells for a subsurface intake. This paper presents information on process selection, energy consumption, and related topics for these four existing and planned projects in California.

IDA World Congress – Perth Convention and Exhibition Centre (PCEC), Perth, Western Australia September 4-9, 2011
REF: IDAWC/PER11-322 -2-
I. INTRODUCTION
1.1 What are the big picture “water issues” in California?
Water is important in California because of limited supply and high demand in the agricultural and population centers within the state. Warmer temperatures over the past few years and irregular precipitation have left the state with a less dependable Sierra snowpack and low levels in Lake Mead, which especially impact water suppliers in southern California which are dependent on both of these sources of water.
Lake Mead - Colorado River level (Source: Bureau of Reclamation Records) The level as of May/2011 was 1095.76 feet.
Due to the increased awareness and concern for environmental protection, court decisions to protect fish (e.g., the delta smelt), have meant that the water diverted from the San Joaquin Delta (as a part of the Federal and State Water Project) to farms and urban areas has been cut by as much as 30 percent.
Furthermore, some coastal areas, such as Santa Cruz and Cambria, have only a single primary source of water supply and are often more susceptible to droughts than cities which receive State Project Water.
1.2 Who are the stakeholders?
Key stakeholders include agricultural users including large corporations, drinking water suppliers, recreational facilities, environmental special interest groups, and neighboring states and countries.
If the state’s population continues to grow as expected, water will be a key resource to the further growth and development of the California economy and the development of cities, agriculture, industries and other areas.

IDA World Congress – Perth Convention and Exhibition Centre (PCEC), Perth, Western Australia September 4-9, 2011
REF: IDAWC/PER11-322 -3-
1.3 What are some key facts and considerations?
California is the 7th largest economy in the world with a high demand for water to supply its daily agricultural, economical and consumer needs.
California is one of the world’s most valuable and productive agricultural areas in the United States. Here are a few statistics:
California leads all states as the top farm producer measured by cash receipts of $36.6 billion in 2007, 13 percent of the U.S. total and nearly twice the output of Texas (No. 2) and Iowa (No. 3).
California supplies more than 50 percent of U.S. fruits, nuts and vegetables and over 90 percent of U.S. almonds, artichokes, avocados, broccoli and processing tomatoes. Grapes, lettuce and almonds are the biggest crops in cash value.
California produces 80 percent of the world’s almond crop and one-third of the world's canned tomatoes.
California’s farms account for 80 percent of the state's water usage, according to estimates from the Pacific Institute; however, the state and the farm industry publicize lower values of 40 percent to 60 percent.
As California enters its third straight year of drought, worst-case estimates have predicted economic losses up to $3 billion and 95,000 agricultural jobs lost if Federal and state water allocations are cut to 15 percent of the amount requested.
(Sources: Reuters, U.S. Department of Agriculture, California Department of Food and Agriculture, Public Policy Institute of California, Pacific Institute for Studies on Development, Environment and Security, Los Angeles Times and University of California, Davis)
California is looking towards the ocean as a viable source of drinking water. Today, only a few seawater reverse osmosis (SWRO) plants are operating in California with an estimated total production below 10 mega liters per day (MLD). However, local water authorities and engineering companies are working to move projects through environmental permitting and feasibility studies to the implement more than 12 new SWRO plants. This paper will talk about four of these projects, including the Sand City Coastal Desalination Facility (currently in operation), the Dana Point Desalination Project, the scwd2 Regional Seawater Desalination Facility, and the Cambria Seawater Desalination Project. These projects range in size from 1 to 56 MLD. This paper focuses on the energy consumption, footprint reduction, process and selection considerations for these four desalination project case studies in California.
II. ENVIRONMENTAL SUSTAINABILITY OR ENERGY OPTIMIZATION
SWRO is an energy intensive process; therefore, optimization and reduction of the energy demand is a key step in order to reduce operational costs and negotiate California Coastal Commission (CCC) permits. Furthermore, energy-efficient operation is important for minimizing greenhouse gas production.
Assembly Bill (AB) 32 or the Global Warming Solutions Act of 2006 is a California State Law aims to reduce the impacts of climate change by establishing a comprehensive program to reduce greenhouse

IDA World Congress – Perth Convention and Exhibition Centre (PCEC), Perth, Western Australia September 4-9, 2011
REF: IDAWC/PER11-322 -4-
gas emissions from all sources throughout the state. AB 32 requires the State to develop regulations and market mechanisms to reduce California's greenhouse gas emissions to 1990 levels by 2020, representing a 25% reduction statewide, with mandatory caps for significant emissions sources. It is still somewhat unknown how AB32 will be regulated in the case of new desalination plants in California. However, the California Coastal Commission has indirectly regulated desalination plants to comply with provisions within AB32 by including energy use as a component for issuing permits for new desalination plants along the California Pacific Coast. The CCC requires that data and calculations be provided to indicate what equipment selection and process design decisions will be implemented to reduce energy use compared to “standard equipment and design practices” and the CCC looks favorably on full or partial offsets of greenhouse gas emissions from a proposed plant. The basis for this requirement is to comply with provisions in AB 32.
In a standard SWRO plant, the treatment system can be divided into four (4) primary processes from an energy consumption point of view:
Intake and source water pumping Pretreatment RO system (primarily the high pressure pumps) Post-treatment and product water distribution pumping
The table below presents examples from the Perth and Barcelona SWRO facilities.
Percentage of energy consumption per
process Perth
SWRO* Barcelona SWRO**
Intake % 15 3.62
Pretreatment % 8 7.48
SWRO process % 68 76.88 Postreatment and distribution % 7 11.69
Others % 2 0.33 *Source: Affordable desalination collaboration 2008 **Source: AEDyR 2010 Paper. Un ano de agua desalinizada en el area de Barcelona.
As the above table illustrates, the RO process is the largest consumer of power in any SWRO facility. Therefore, the optimization of the energy consumption of the RO process will have the most impact on overall energy consumption. The following paragraphs summarize considerations to provide an energy efficient SWRO process.
In this schematic it is assumed that the seawater has been pre-treated and complies with the quality requirements for standard SWRO membranes. The main components of this process are high pressure pumps (HPP) and membranes.

IDA World Congress – Perth Convention and Exhibition Centre (PCEC), Perth, Western Australia September 4-9, 2011
REF: IDAWC/PER11-322 -5-
2.1 Energy Recovery Considerations
In order to reduce the energy consumption of this process, the key elements to achieve this goal are the 1) energy recovery devices (ERD) and 2) high pressure pumps.
RO process without ERD
The ERDs are machines designed to recover the hydraulic energy of the concentrate stream. The process to recover the energy will vary depending on the type of ERD technology utilized. This paper will explain the most widely used ERD technologies in the market today: centrifugal and isobaric devices.
o Centrifugal devices
Pelton Wheel Turbocharger device
o Isobaric device
PX™ device
100% of the flow rate 100 % of the feed pressure

IDA World Congress – Perth Convention and Exhibition Centre (PCEC), Perth, Western Australia September 4-9, 2011
REF: IDAWC/PER11-322 -6-
All ERDs operate under the same objective of reducing the HPP energy requirement. However, every technology has some advantages and disadvantages, which are summarized in the table below:
Description Isobaric Centrifugal Centrifugal
PX™ devices Turbocharger Pelton Wheel
Efficiency % 98% 81% 78%
Efficiency curve Flat Curved Curved
Mixing % 2-3% 0% 0%
HP pump size
Sized for partial membrane feed flow, full membrane feed pressure
Sized for partial membrane feed pressure, full membrane feed flow
Sized for partial membrane feed pressure, full membrane feed flow
Footprint requirement
Relatively small compared to overall SWRO equipment
Relatively small compared to overall SWRO equipment
Relatively small compared to overall SWRO equipment
Periodic Maintenance NO NO
YES
Modularity YES NO NO
In the specific case of California, two of the main concerns related to energy recovery are 1) the high cost of energy (estimate average value of $0.13 USD/kWh with single hour costs in excess of $0.20 USD/kWh during peak power periods) and 2) footprint due to the cost of land.
Although real estate prices have decreased from the peak in 2008, the cost of undeveloped coastal land has not experienced much of a decrease; this is primarily because there are few undeveloped areas in coastal cities. Furthermore, there are even fewer available plots large enough for a new desalination plant. This has made it both expensive and difficult to purchase land for future desalination plants in California.
2.2 High Pressure Pump Considerations
The HPP selection is important due to the direct impact in energy consumption. The HPP is often selected based on cost, energy efficiency, reliability, and maintenance requirements. There are two main types of pump designs used for SWRO HPP pumps: 1) centrifugal and 2) piston designs.
Centrifugal pump - this is a kinetic machine in which energy is continuously imparted to the pumped fluid by means of a rotating impeller. For this specific case the imparted energy is pressure.
Piston pump (reciprocating pump) - this is a positive displacement pump in which a fluid is moved by trapping a fixed amount of fluid and forcing the trapped volume into the pump's discharge.
The table below provides a comparison of the two different types of pumps.

IDA World Congress – Perth Convention and Exhibition Centre (PCEC), Perth, Western Australia September 4-9, 2011
REF: IDAWC/PER11-322 -7-
Parameter Centrifugal Pumps Reciprocating PumpsOptimum Flow and Pressure Applications
Medium/High Capacity,Low/Medium Pressure
Low Capacity,High Pressure
Low Flow Rate Capability
No Yes
Requires Relief Valve No YesSmooth or Pulsating Flow
Smooth Pulsating
Variable or Constant Flow
Variable Constant
Self-priming No YesSpace Considerations Requires Less Space Requires More SpaceEfficiency Higher flow rate, higher
efficiency High Efficiency
Costs Lower Initial Lower Maintenance
Higher InitialHigher Maintenance
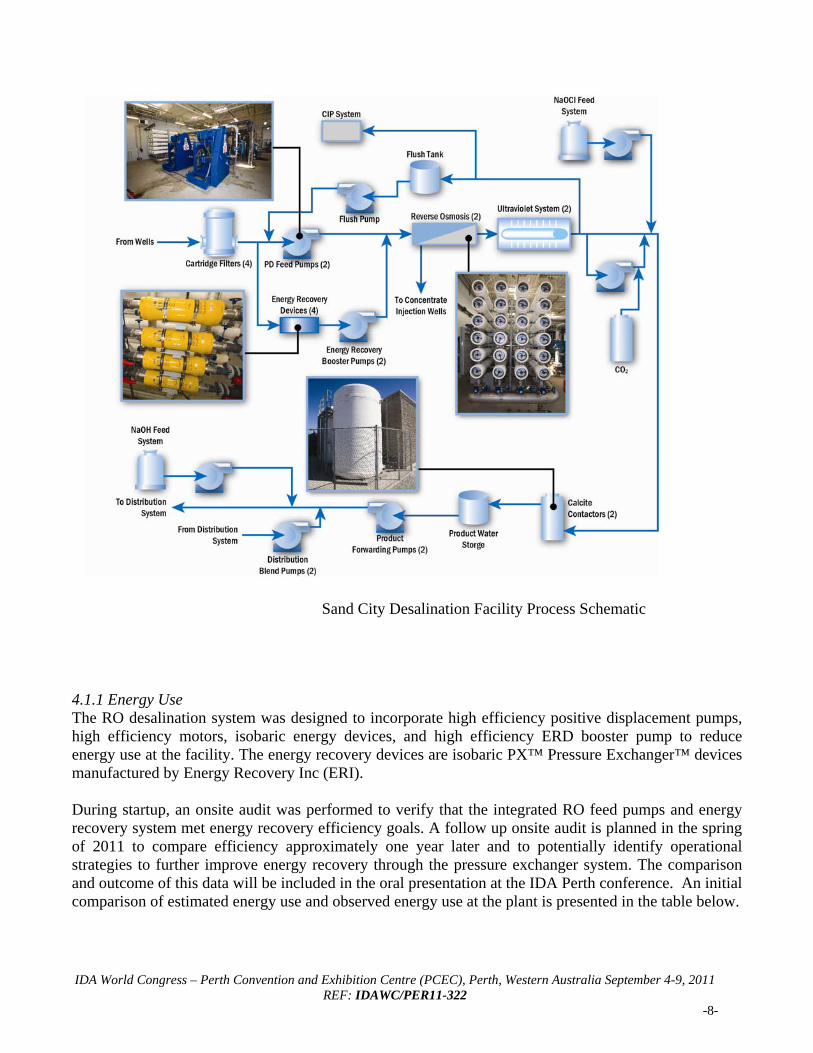
IV. CASE STUDIES The following section discusses four seawater desalination projects in California, presenting information and updates on energy use, cost, and process selection considerations for each. 4.1 Sand City Coastal Desalination Facility The City of Sand City is located in Monterey County, California, northeast of the City of Monterey on the central coast. The City embarked on a desalination program utilizing beach wells to supply a desalination facility with minimal pretreatment and minimal environmental impact. The source water has a varying salinity between 12 and 29 g/L, with extremely low levels of turbidity, iron, and manganese. The sole pretreatment is cartridge filters, while the RO process utilizes positive displacement pumps, energy recovery devices, a 15 LMH flux, and a 30 percent recovery to minimize energy use, operating costs, and to meet brine discharge limits. The facility began operation in March 2010, and is permitted for 1.1 MLD of potable water production to supplement the source currently provided by limited freshwater supplies. The figure on the next page illustrates the treatment process at the facility which consists of cartridge filter pretreatment; reverse osmosis (RO) desalination; ultraviolet (UV) and chlorine (NaOCl) disinfection; carbon dioxide, calcite contactor, and treated surface water blending post-treatment, and final pH adjustment with caustic soda (NaOH). Energy use, footprint, and cost were key components of process selection and design for this facility. Each of the issues is discussed briefly below.
IDA World Congress – Perth Convention and Exhibition Centre (PCEC), Perth, Western Australia September 4-9, 2011
REF: IDAWC/PER11-322 -8-
4.1.1 Energy Use The RO desalination system was designed to incorporate high efficiency positive displacement pumps, high efficiency motors, isobaric energy devices, and high efficiency ERD booster pump to reduce energy use at the facility. The energy recovery devices are isobaric PX™ Pressure Exchanger™ devices manufactured by Energy Recovery Inc (ERI). During startup, an onsite audit was performed to verify that the integrated RO feed pumps and energy recovery system met energy recovery efficiency goals. A follow up onsite audit is planned in the spring of 2011 to compare efficiency approximately one year later and to potentially identify operational strategies to further improve energy recovery through the pressure exchanger system. The comparison and outcome of this data will be included in the oral presentation at the IDA Perth conference. An initial comparison of estimated energy use and observed energy use at the plant is presented in the table below.
Sand City Desalination Facility Process Schematic

IDA World Congress – Perth Convention and Exhibition Centre (PCEC), Perth, Western Australia September 4-9, 2011
REF: IDAWC/PER11-322 -9-
Estimated and Observed Plant Energy Use (Data Observed from October 2010 through January 2011)
Plant energy use estimate based on RO membrane and energy recovery system manufacturer design software 5.5 kWh/1,000 gallons
Observed plant energy use based on monthly electric bill and plant production to the distribution system 4.9 kWh/1,000 gallons
4.1.2 Cost and Footprint Considerations
Costs for both construction and operation were major considerations in the design of the facility. Cost effective operation was a priority because the plant is to serve as an everyday supply for the city, and capital cost was limited by available budget and state funding. Significant savings were realized from the original basis of design in the city’s feasibility study, allowing for a $5.1 million design-build contract that fit within the city’s budget, while also expanding capacity from the planned 1.1 MLD to 2.3 MLD to allow off-peak operation, which is further discussed below.
Cost savings were primarily realized through design measures for four process components: 1) feed water pumping approach, 2) RO skid arrangement, 3) chemical system selection, and 4) provisions for off-peak operation.
Footprint reductions were realized by eliminating antiscalant and acid addition and by reducing the footprint of the post-treatment system by utilizing small footprint calcite contactors constructed within standard commercial pre-fabricated tanks.
4.1.2.1 Feed Water Pumping
To reduce operating costs of the desalination facility, the RO recovery rate was reduced from the preliminary design value of 40 percent to 33 percent. This resulted in lower feed pressure, improved product water quality, and avoided the need to dilute the RO concentrate to achieve the brine discharge limit of 35 g/L under most operating conditions (i.e., when feed water salinity is below 23.5 g/L).
Plunger style positive displacement pumps were selected in lieu of the proposed centrifugal RO feed pumps. For this plant, selecting piston style pumps allowed for a lower cost pump, which also operates at a higher efficiency (approx. 90%) and reduces energy use and cost. Furthermore, the positive displacement pumps are capable of operating at a relatively constant flow and energy efficiency as feed water pressures vary with source water salinity. Alternatively, the high variability in feed water salinity would have been an operational challenge for centrifugal pumps, which do not provide constant flow or energy efficiency as operating pressures vary. Additionally, the selection of positive displacement pumps allowed elimination of pumps of variable frequency drives (VFDs), which were planned to allow centrifugal pumps to better operate at varying operating pressures.
Isobaric energy recovery devices were selected in combination with small VFD driven booster pumps to recover over 95 percent of the energy input into the RO system from the residual pressure in the concentrate stream.

IDA World Congress – Perth Convention and Exhibition Centre (PCEC), Perth, Western Australia September 4-9, 2011
REF: IDAWC/PER11-322 -10-
Overall, the changes in the feed water pumping approach resulted in an estimated 53 percent reduction in total energy use, resulting in savings of approximately $150 USD per million liters in produced water cost.
4.1.2.2 RO Skid Arrangement
Savings were realized in the RO skid design by utilizing two (2) RO skids with four, isolatable columns of pressure vessels. This approach reduced the required footprint and interconnection piping compared with using the planned four (4) individual skids. The skids utilize Toray model TM820L-400 SWRO membrane elements and operate at an average RO system flux of 15 LMH, RO system recovery of 30 percent, and an average feed pressure of 440 psi.
By utilizing both a low recovery and low flux, the facility is expected to produce high quality water without utilizing a second pass, which also reduced capital and operating costs. Product water is anticipated to have boron concentrations around 0.3 mg/L and chloride concentrations of 53 mg/L, well below both the regulated limits and recommended concentrations for this project.
4.1.2.3 Chemical Systems
Chemical system costs were reduced by eliminating the planned addition of both acid and antiscalant. Low product water recoveries are expected to produce a concentrate with a negative Langelier Saturation index (LSI), without the need for either acid or antiscalant.
The selection of calcite contactors were selected for remineralization to both reduce cost and simplify operation, compared with lime. The calcite contactors provide buffering capacity and corrosion stability for the water, while doubling as chlorine contactors to achieve state pathogen inactivation credits. By utilizing a saturation based contactor, the risk of overfeeding, common with lime feed systems, is eliminated. The primary challenge with the calcite contactors has been the use of NSF approved calcite. Thus far, NSF approved calcite has been fined grained and resulted in turbidity spikes in the treated water when the contactors are brought online. Subsequent NSF approval of coarse calcite is anticipated to improve performance in terms of turbidity in the future.
Finally, post-treatment blending was selected, utilizing up to a 50 percent blend with existing system water. This blending helps assure that the product water matches existing system water, which may change throughout the day as various sources are taken off-line or added. The use of blending reduced the required caustic dose to stabilize the product water by 50 percent, while providing water with the target calcium carbonate precipitation potential between 4 and 10 mg/L.
4.1.2.4 Off-Peak Operation Energy Cost Savings
Additional savings in plant operating costs were expected to be achieved through operation of the plant only during off-peak electrical usage hours. The power provider has created a rate structure allowing for discounted rates when operating only during low power demand periods. By providing a treatment facility capable of producing 2.3 MLD, when a product water supply of half this capacity is required, the facility can be taken offline during peak hours, creating significant savings in operating costs.

IDA World Congress – Perth Convention and Exhibition Centre (PCEC), Perth, Western Australia September 4-9, 2011
REF: IDAWC/PER11-322 -11-
4.2 scwd2 (Santa Cruz) Seawater Desalination Program The City of Santa Cruz, California is located 100 km south of San Francisco at the north end of Monterey Bay. The city water department and the adjacent Soquel Creek Water District have partnered together to evaluate desalination as a supplemental supply source for the two service areas. As part of their overall Integrated Water Plans, the city and district have implemented water conservation measures, evaluated recycled water, and are jointly overseeing the scwd2 Seawater Desalination Program. The desalination program will provide 9.5 MLD of a local, reliable, drought-proof water to help the city meet its water needs during a drought and to help the district address over pumping of the underlying aquifers during non-drought years. As part of this program, a 13-month pilot study was conducting utilizing an open ocean intake, and evaluating various forms of pretreatment, including ultrafiltration, conventional filtration, and slow sand filtration. Full-scale intake alternatives are currently being evaluated. The California Coastal Commission recommends against the use of open ocean intakes unless a subsurface intake can be shown to be infeasible. As such, it is necessary to consider subsurface intake alternatives before finalizing the intake approach. Due to challenges in the local geology, the facility may ultimately make use of an open ocean intake, requiring a similar level of pretreatment as what was tested during the pilot study. The facility is currently in the preliminary design process. The following paragraphs summarize unique approaches to 1) select the pretreatment process for the proposed plant and 2) to select the number and size of the main process components. The approaches included considerations to reduce footprint, costs, and energy use while also achieving project and owner objectives. 4.2.1 Weighted Criteria and Sensitivity Analysis Approach to Pretreatment Selection The project design team and technical advisory committee initially evaluated 21 pretreatment alternatives. These alternatives were screened down to a short-list of six alternatives taking into account the results of the 13-month scwd2 pilot test program and 24-month source watershed sanitary survey, professional experience, and a survey of 21 existing SWRO plants that use open ocean intakes compiled by Tom Pankratz, a member of the project Technical Advisory Committee. The short-list of alternatives consisted of:
1. Slow sand filters (SSF) 2. Micro-filtration or ultra-filtration (MF/UF) with optional coagulant addition and no clarification;
MF/UF options include pressure and submerged membranes 3. Dissolved air floatation (DAF) + MF/UF (pressure/submerged) 4. Flocculation and sedimentation + MF/UF (pressure/submerged) 5. DAF + granular media filters (GMF) 6. Flocculation and sedimentation + GMF
Of the six short-listed alternatives, only DAF + MF/UF and DAF + GMF were not tested during the 13-month scwd2 pilot test program. A list of eight criteria was developed to evaluate these pretreatment alternatives:1) Production Reliability, 2) Proven Technology and Track Record, 3) Lifecycle Costs, 4) Operational Complexity, 5) Adaptability to Future Changes, 6) Energy Use, 7) Plant Footprint, and 8) Noise and Traffic. Weighting
IDA World Congress – Perth Convention and Exhibition Centre (PCEC), Perth, Western Australia September 4-9, 2011
REF: IDAWC/PER11-322 -12-
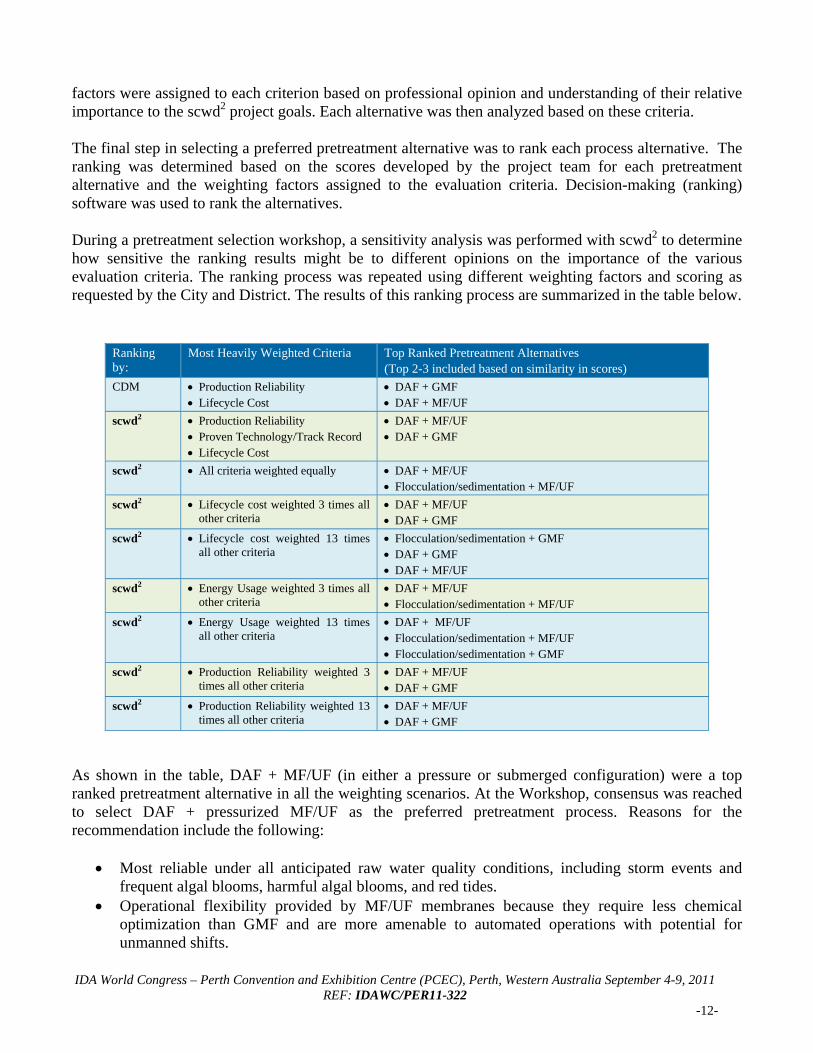
factors were assigned to each criterion based on professional opinion and understanding of their relative importance to the scwd2 project goals. Each alternative was then analyzed based on these criteria. The final step in selecting a preferred pretreatment alternative was to rank each process alternative. The ranking was determined based on the scores developed by the project team for each pretreatment alternative and the weighting factors assigned to the evaluation criteria. Decision-making (ranking) software was used to rank the alternatives. During a pretreatment selection workshop, a sensitivity analysis was performed with scwd2 to determine how sensitive the ranking results might be to different opinions on the importance of the various evaluation criteria. The ranking process was repeated using different weighting factors and scoring as requested by the City and District. The results of this ranking process are summarized in the table below.
Ranking by:
Most Heavily Weighted Criteria Top Ranked Pretreatment Alternatives (Top 2-3 included based on similarity in scores)
CDM Production Reliability Lifecycle Cost
DAF + GMF DAF + MF/UF
scwd2 Production Reliability Proven Technology/Track Record Lifecycle Cost
DAF + MF/UF DAF + GMF
scwd2 All criteria weighted equally DAF + MF/UF Flocculation/sedimentation + MF/UF
scwd2 Lifecycle cost weighted 3 times all other criteria
DAF + MF/UF DAF + GMF
scwd2 Lifecycle cost weighted 13 times all other criteria
Flocculation/sedimentation + GMF DAF + GMF DAF + MF/UF
scwd2 Energy Usage weighted 3 times all other criteria
DAF + MF/UF Flocculation/sedimentation + MF/UF
scwd2 Energy Usage weighted 13 times all other criteria
DAF + MF/UF Flocculation/sedimentation + MF/UF Flocculation/sedimentation + GMF
scwd2 Production Reliability weighted 3 times all other criteria
DAF + MF/UF DAF + GMF
scwd2 Production Reliability weighted 13 times all other criteria
DAF + MF/UF DAF + GMF
As shown in the table, DAF + MF/UF (in either a pressure or submerged configuration) were a top ranked pretreatment alternative in all the weighting scenarios. At the Workshop, consensus was reached to select DAF + pressurized MF/UF as the preferred pretreatment process. Reasons for the recommendation include the following:
Most reliable under all anticipated raw water quality conditions, including storm events and frequent algal blooms, harmful algal blooms, and red tides.
Operational flexibility provided by MF/UF membranes because they require less chemical optimization than GMF and are more amenable to automated operations with potential for unmanned shifts.

IDA World Congress – Perth Convention and Exhibition Centre (PCEC), Perth, Western Australia September 4-9, 2011
REF: IDAWC/PER11-322 -13-
DAF is the best available technology for removing algae without lysing cells and releasing naturally occurring foulants or toxins.
Pressurized membranes have lower construction costs than submerged membranes for the size of this facility.
4.2.2 Functional Analysis Approach to Determine Number and Size of Main Process Units A functional analysis approach was utilized to recommend numbers and sizes of the major treatment units for the proposed scwd2 Regional Desalination Plant, including dissolved air floatation (DAF), pressurized microfiltration/ ultrafiltration (MF/UF) membranes and reverse osmosis (RO) process equipment. For this project, the term “functional analysis” was defined as the quantitative method used to estimate the production capacity of the treatment facility based on assumptions for planned and unplanned outages (i.e., probabilities of failure) for individual treatment processes and the major pieces of equipment that comprise these units. The functional analysis was limited to the three major treatment processes- DAF, MF/UF and RO. The functional analysis for the scwd2 Regional Seawater Desalination Plant included nine activities, which were to: 1. Develop general production scenarios, raw water supply requirements, and water quality goals. 2. Develop alternatives and select multiple options for the number and size of treatment trains for DAF,
MF/UF and RO. 3. List major equipment items for each process. 4. Estimate the frequencies and durations for planned and unplanned outages for each major equipment
item for DAF, MF/UF and RO. 5. Convert outages into probabilities of failure. 6. Apply basic probability analysis methodology to determine the cumulative probability of failure for
one or more treatment units. 7. Calculate the number of days per year that each unit process would be in service for each production
scenario. 8. Compare the estimated production reliabilities for the alternatives. 9. Select the recommended alternatives (i.e., numbers and sizes for major equipment) for the DAF,
MF/UF and RO systems based on the collective experience of the project team with consideration given to impacts on production reliability, construction and operating costs, operational complexity, maintenance, land and building requirements and other factors.
Four treated water production scenarios were developed to represent the range of anticipated production rates that would meet the project objectives. Information from scwd2 and the CDM’s engineering team were used to develop the following scenarios:
• Drought (9.5 MLD) - The initial maximum production capacity for the Regional Desalination Plant of 9.5 MLD was established by scwd2 to supplement drinking water supplies for the City of Santa Cruz during severe drought conditions. Production of 9.5 MLD would typically occur during high demand months (May through October); however, during

IDA World Congress – Perth Convention and Exhibition Centre (PCEC), Perth, Western Australia September 4-9, 2011
REF: IDAWC/PER11-322 -14-
extended droughts, the Regional Desalination Plant may operate continuously at this rate for 12 months or longer.
• High (7.6 MLD) - This“high production rate” was assumed to address higher than average demands for desalinated water, but less than the plant’s maximum design rate of 9.5 MLD. 7.6 MLD corresponds to 80 percent of the rated plant capacity and could occur any month of the year.
• Average (6.0 MLD) - As reported by scwd2, the average daily treated water production during non-drought conditions will likely range from 4.8 to 6.0 MLD. During non-drought years, the Regional Desalination Plant will operate continuously to allow the Soquel Creek Water District to accept water transfers from the City of Santa Cruz; these transfers will equal the daily production from the Regional Desalination Plant. The more conservative rate of 6.0 MLD was assumed for average demand.
• Low (3.1 MLD) - The minimum treated water production rate communicated by scwd2 to the design team was approximately 3.8 MLD. 3.1 MLD was selected as the low production scenario, which corresponds to 33 percent of the rated plant capacity (or the production from one (1) RO skid if three (3) equally sized RO skids are provided). Low production could occur during any month in non-drought years, or during low demand months (November through April) during droughts.
The outcome of the functional analysis is presented in the table below, which summarizes the recommended numbers and nominal design treatment capacities for the pretreatment and RO equipment.
Recommended Number and Nominal Treatment Capacity of Major Process Units Treatment Process/ Equipment Description
Number of Units Nominal Capacity
Per Unit Total
Duty Standby Total (MLD) (MLD)
Dissolved Air Floatation
Basins 2 0 2 12 24
Air Saturators1 1 1 2 24 24
Air Compressors2 1 1 2 24 24
MF/UF System
MF/UF Racks 3 1 4 8 24
RO System
RO Skids 3 1 4 3.2 9.5 1 Each Saturator sized to operate 2 DAF basins; Total Nominal Capacity with 1 of 2 saturators in service. 2 Each compressor sized to operate 2 DAF basins; Total Nominal Capacity with 1 of 2 compressors in service.
In the functional analysis, a range of plant production flows from 3.1 to 9.5 MLD was assumed to represent potential operating scenarios for the plant as described by the City of Santa Cruz Water Department and Soquel Creek Water District. The results of the functional analysis for the recommended process trains are summarized in Table 4. For each production scenario, the following information is presented:
Units in Service - The number of DAF, MF/UF and RO units in service; collectively, the number of units in service must meet the specified production goal.

IDA World Congress – Perth Convention and Exhibition Centre (PCEC), Perth, Western Australia September 4-9, 2011
REF: IDAWC/PER11-322 -15-
Clarified Water, Filtered Water and Permeate Water - The total production capacity (in MLD) for the process waters for DAF, MF/UF and RO; the values correspond to the low produced by DAF, MF/UF and RO Units in Service.
Days Goals Met - The number of days per year the DAF, MF/UF and RO systems meet the specified production goal; determined by functional analysis.
Days Goals Met (Blue Numbers) - The number of days that each unit process (DAF, MF/UF and RO) meets the specified production goal with the fewest number of Units in Service; also the highest of the numbers for Days Goals Met for each unit process at the specified production goal. For example, 9.5 MLD of treated water can be produced with the following DAF Units in Service: No DAF Basin (No Clarified Water); one DAF Basin (24 MLD Clarified Water at SLR = 20 gpm/sf) or two DAF basins (24 MLD at SLR = 10 gpm/sf). The production goal can be met 365 days per year with any combination of 0, 1 or 2 DAF Basins in service.
Plant Production Goals Met - The number of days that the combination of unit process (DAF, MF/UF and RO) meets the specified production goal with the fewest number of Units in Service; also the lowest of the Days Goals Met for individual unit process. For example, 9.5 MLD of treated water can be produced with No DAF Basins (365 days/year), three MF/UF Racks (351 days/year) and 3 RO Skids (356 days/year) in service. The lowest number for Days Goals Met is for MF/UF; 351 days/year is the estimate for the plant to meet the 9.5 MLD production goal.
Due to the fact standby power generation facilities are not being considered for the plant, the functional analysis did not evaluate the impacts of power outages. scwd2 anticipates that periodic, short-term interruptions in plant operations caused by power outages will be mitigated by existing treated water storage in the distribution system and the ability to temporarily increase production from alternative water supplies such as the City’s Graham Hill Surface Water Treatment Plant, Beltz Groundwater Treatment Plant, or the District’s groundwater wells and treatment facilities.

IDA World Congress – Perth Convention and Exhibition Centre (PCEC), Perth, Western Australia September 4-9, 2011
REF: IDAWC/PER11-322 -16-
Summary of Functional Analysis Results for Recommended Process Units Production Scenarios
Units in Service
Recommended Process Alternatives
Plant Production Goals Met (days/yr)
DAF1, 2 (2 Basins, 12 MLD each; 2 Duty , 0 Standby)
MF/UF3 (4 Racks, 8 MLD each; 3 Duty and 1 Standby)
RO4 (4 Skids, 3.1 MLD each; 3 Duty and 1 Standby)
Description Treated Water Goal (MLD)
Clarified Water (MLD)
Days Goals Met (days/yr)
Filtered Water (MLD)
Days Goals Met (days/yr)
Permeate (MLD)
Days Goals Met (days/yr)
Drought 9.5
4 24 350 9.5 284
356
3 24 365 9.5 356
2 24 344
1 24 364
0 0 365
High 7.6
4 18.9 350 7.6 284
361
3 18.9 365 7.6 356
2 18.9 344 18.9 365 7.6 361
1 18.9 364
0 0 365
Average 6.0
4 15.1 350 6.0 284
361
3 15.1 365 6.0 356
2 15.1 344 15.1 365 6.0 361
1 15.1 364
0 0 365
Low 3.1
4 8 350 3.1 284
365
3 8 365 3.1 356
2 8 344 8 365 3.1 361
1 8 364 8 365 3.1 365
0 0 365 1 DAF design surface loading rate (SLR) with two DAF basins in service at 24 MLD clarified water (9.5 MLD treated water) is 10 gpm/sf; manufacturers’
report that DAF units can operate effectively at SLRs up to 20 gpm/sf. 2 Because DAF is only required to operate during adverse storm events, algae blooms or red tides and each event typically lasts from approximately 1 week
to 3 months, DAF performance is acceptable when followed by MF/UF. 3 MF/UF membranes design flux with three MF/UF racks in service at 24 MLD filtered water (9.5 MLD treated water) is 40 gfd; MF/UF membranes can
operate at flux up to 44 gfd based on results of scwd2 Desalination Pilot Test Program. 4 RO design flux with three RO skids in service at 9.5 MLD permeate/treated water is 8 gfd; RO membranes can operate at flux up to 10 gfd.
Bold blue numbers indicate the estimated days per year that each unit process will meet the specified production goals.
4.2.3 Energy Use For this SWRO project, an ERD analysis was completed in order to evaluate potential options to achieve the lowest life cycle costs for the project, which required a system with the following attributes: 1) a small footprint, 2) high efficiency to reduce energy costs, and 3) less maintenance. High efficiency: ERD energy use projections provided by ERI using 1) an isobaric PX device and 2) a turbocharger for this project are included on the following pages. Cost estimates indicate that energy costs using a PX will be $162,000 less per year at $0.16/kWh than with a turbocharger. This correlates

IDA World Congress – Perth Convention and Exhibition Centre (PCEC), Perth, Western Australia September 4-9, 2011
REF: IDAWC/PER11-322 -17-
with a payback period of less than two years at average flow and a significantly lower 30-year life cycle cost.
PX® Energy Recovery Device System Analysis
A B C D E F G HFLOW US gpm 1,563 925 637 925 1,563 625 938 938
m3/hr 355 210 145 210 355 142 213 213
m3/day 8,517 5,043 3,474 5,043 8,517 3,407 5,110 5,110PRESSURE psi 22 22 1015 965 1015 0 974 15
bar 1.5 1.5 70.0 66.6 70.0 0.0 67.2 1.0QUALITY ppm 37,000 37,000 37,000 38,375 37,814 200 62,891 61,533
PX DEVICE ARRAY INPUT DESCRIPTIONS INPUTSPX-300 Units Metric or English M or E E
Number of PX units quantity 4 Manual or auto efficiencies m or a mgpm 234.2 Permeate flow gpm 625
PX lubrication per array gpm 12.3 RO recovery rate % 40%PX lubrication flow % 1.3% RO feed pressure psi 1015.0Dfferential pressure HP side psi 8.9 Membrane differential pressure psi 41.0Differential pressure LP side psi 7.4 PX LP discharge pressure psi 14.5PX efficiency % 97.1% Feedwater salinity ppm 37,000PX mixing at membrane feed % 2.2% Motor power Hz 50 or 60 60Operating capacity % 78.1% Currency type $PX Power Savings hp 656.0 Cost of power $/kWh 0.16Estimated CO2 Savings tons/year 3,389 HP pump efficiency % 80%
HP pump motor efficiency % 96%HIGH PRESSURE PUMP Circulation pump efficiency % 75%Pump efficiency % 80% Circulation pump motor efficienc % 95%Motor efficiency % 96% Circulation pump VFD efficiency % 97%Power consumed hp 478.7 PX device design margin % 5%
CIRCULATION / BOOSTER PUMP PX SYSTEM POWER RESULTSERI PX booster pump model 60 Hz Total power consumption kW 386Number of PX booster pumps quantity Specific power consumption kWh/m3 2.72Pump efficiency % 75% Specific power consumption kWh/kgal 10.3Motor efficiency % 95% Power cost saved with PX $/year $ 686136VFD efficiency % 97%Power consumed hp 38.9 Warnings NONE
Suggestions NONE
SYSTEM FEED PUMP hp 0.0Notes:ERI PX device and circulation pump selection is based upon assumptions not stated here. Please refer ERI sales personnel for addition
PX model
PX unit flow

IDA World Congress – Perth Convention and Exhibition Centre (PCEC), Perth, Western Australia September 4-9, 2011
REF: IDAWC/PER11-322 -18-
Small footprint: Both the isobaric and turbocharger ERDs have a relatively small footprint and are not expected to significantly increase building size or cost. Low maintenance: The rotative isobaric technology requires minimal preventative maintenance and is designed for a 25-year useful service life. This requires less maintenance than expected for a turbocharger ERD.
PX® Device versus PEI Turbocharger Power Analysis
A C E F G HFLOW US gpm 1,563 1,563 1,563 625 938 938
m3/hr 354.9 354.9 354.9 141.9 212.9 212.9m3/day 8,517 8,517 8,517 3,407 5,110 5,110
PRESSURE psi 22 595 993 0 952 15bar 1.5 41.0 68.5 0.0 65.6 1.0
QUALITY ppm 37,000 37,000 37,000 200 61,667 61,667
DEVICE EFFICIENCIES MEMBRANE PARAMETERSTurbo Model HALO 900Net transfer efficiency % 71% Recovery % 40%HP Pump efficiency % 83% Membrane differential psi 41.0
HP Pump motor efficiency % 96%TURBOCHARGER SYSTEM POWER RESULTS
POWER CALCULATIONS Total power consumption kW 490Energy recovered hp 362.2 Specific power consumption kWh/m3 3.45Boost pressure psi 397.5 Specific power consumption kWh/kgal 13.1HP pump power consumed hp 656.7
PX VERSUS TURBOCHARGER SAVINGSSYSTEM FEED PUMP hp 0.0 Power saved with PX kWh/m3 0.73
Power saved with PX % 21%Cost saved with PX $/year $ 145521
Notes: Turbine, pump and motor efficiencies are based on best engineering estimates and manufacturers published data. If it is known, the operator can enter the specific equipment efficiency data manually.
A
C
E
F
G
H

IDA World Congress – Perth Convention and Exhibition Centre (PCEC), Perth, Western Australia September 4-9, 2011
REF: IDAWC/PER11-322 -19-
4.3 Dana Point Desalination Facility The Municipal Water District of Orange County (MWDOC) is investigating the feasibility of ocean desalination in the south Orange County area. They are currently evaluating a potential 56 MLD seawater desalination facility, utilizing slant well intakes, drilled below the ocean at 23 degree angles within an alluvial channel at Doheny State Beach in Dana Point, California. MWDOC pioneered development of high-capacity slant dual rotary well technology for ocean feed water supply with the successful construction and demonstration of a 500 m3/h test slant well in the spring of 2006. Unlike collector radial type wells, which have also been used for ocean water desalination plant intakes, slant wells offer reduced construction and O&M impacts in shoreline environments. Slant wells can be fully buried within a clustered wellhead, provide high capacities, and can extend significant horizontal distances out under the ocean floor. As part of the Ocean Desalination Project, MWDOC is conducting 18 months of pilot testing for the slant well and a desalination treatment facility. The purpose of utilizing a slant well is to minimize the risk of entrainment and impingement, while providing high quality source water to the desalination facility. High levels of iron and manganese seen in the groundwater, however, could complicate the treatment process, and will be a major focus of the pilot testing. While turbidity from the test well has generally remained below 0.2 NTU, iron and manganese concentrations have approached a combined 18 mg/L. One of the key components of the pilot study is to evaluate multiple iron and manganese pretreatment technologies. This project is currently within the pilot study phase. Footprint, cost, and energy use for the future facility will rely heavily on the results of the pretreatment selection. Pilot testing is focusing on evaluating iron and manganese removal from the slant well water; concentrations are 10 and 5 mg/L respectively. Full-scale groundwater model results project that the TDS will eventually increase to approximately 33,000 mg/L as more seawater is drawn into the slant well. Additional studies are evaluating whether iron and manganese will increase or decrease as TDS continues to increase.
012345678910111213141516
0
2,000
4,000
6,000
8,000
10,000
12,000
14,000
16,000
Tota
l Iro
n (
mg
/L)
TD
S (
mg
/L)
TDS* Total Iron

IDA World Congress – Perth Convention and Exhibition Centre (PCEC), Perth, Western Australia September 4-9, 2011
REF: IDAWC/PER11-322 -20-
Five alternative treatment alternatives are being evaluated to manage the iron and manganese in the source water. These include: 1) minimal pretreatment utilizing a nitrogen blanket and airtight source piping and pump design to maintain anoxic conditions in the RO feed water, 2) oxidation and greensand media for removal, 3) oxidation and proprietary manganese specific catalytic media for removal, 4) oxidation and conventional anthracite and sand media for removal, and 5) oxidation and UF membranes for removal. The pretreatment process selection is expected to occur in the fall of 2011 and additional information will be presented in the presentation in Perth. 4.4 Cambria Desalination Project The City of Cambria is located on the central coast of California, approximately mid-way between Los Angeles and San Francisco. Cambria relies on local groundwater for their drinking water supply, with the groundwater primarily from shallow aquifers replenished by seasonal rains. Careful management of the groundwater is required to prevent seawater intrusion, and the city currently has no emergency water supply which can be relied on during an extended drought. To address the critical water supply shortage, the local community services district has limited new water connections and has pursued an aggressive water conservation program since the 1980’s. The use of seawater desalination to supplement Cambria’s water supply was first proposed in a 1987 economic analysis report. By 1995 a design had been completed, which made use of an offshore infiltration gallery near San Simeon Creek to the north of the city. After experiencing difficulty in obtaining environmental permits to move forward with the project, a modified intake approach was developed and a preliminary design report was completed in 2000 utilizing a slant well intake at the San Simeon Creek site. While the modified intake approach had been intended to address environmental concerns, it became evident that the presence of federally protected species within San Simeon State Park would prevent even the ability to conduct the soil borings and hydraulic test wells necessary to confirm the feasibility of the proposed intake. As a result, the project site was ultimately moved away from San Simeon Creek, and a new preliminary design was begun in 2010. The current design approach will likely continue to make use of a subsurface intake, providing high quality source water without the need for chemical pretreatment and filtration ahead of the RO membranes. Initial permitting activities indicate that intake selection, energy use, and overall environmental impacts will dictate the permitting process for the plant. The project is currently in the conceptual design phase and multiple intake, pretreatment, desalination, and post-treatment alternatives are currently being evaluated. The design is currently focusing on approaches to reduce energy use and environmental impacts related to the intake, brine discharge, construction, and greenhouse gas emissions. The conceptual design information is currently confidential. Pending approval, additional information on the proposed 3.8 MLD facility will be presented in Perth.
Demonstration Scale Slant Well TDS and TDS Concentrations

IDA World Congress – Perth Convention and Exhibition Centre (PCEC), Perth, Western Australia September 4-9, 2011
REF: IDAWC/PER11-322 -21-
V. CONCLUSIONS This paper presents information on the importance of process selection for energy use, footprint, cost, and other considerations for desalination projects in California. Conclusions include the following:
California has a huge need for more sources of drinking water and desalination is being pursued by multiple water suppliers as a feasible and reliable solution to address the state’s needs.
Process selection is a key factor to reduce costs and energy use, but also to achieve project specific requirements.
In the specific case of California, energy prices and footprint considerations favor the use of isobaric energy recovery technology. However, each project must be considered on a case by case basis.
VI. REFERENCES
1. Miguel, Carlos. Sanz, Miguel Ángel. Mesa, Josep. Arbós, Ramón. Un Año de Agua Desalinizada en el Área de Barcelona. Resultados de Operación de la Desalinizadora del Llobregat. AEDyR 2010
CONTACT INFO: Erik Desormeaux, Project Manager, CDM Juan Miguel Pinto, Technical Sales Manager, Energy Recovery Inc