a case study - joint economic committee democrats congress/hard choices... · a case study prepared...
TRANSCRIPT

98th Congress } JOINT COM TTTEE PRINT { S. PBT. AiP. 72d Session 1 98-164
HARD CHOICES
A Report on the Increasing Gap Between America'sInfrastructure Needs and Our Ability To Payfor Them
Appendix 7. LOUISIANA
A CASE STUDYPREPARED FOR THE USE OF THE
SUBCOMMITTEE ON ECONOMIC GOALS ANDINTERGOVERNMENTAL POLICY
OF THE
JOINT ECONOMIC COMMITTEE
CONGRESS OF THE UNITED STATES
31-6800
FEBRUARY 25, 1984
Printed for the use of the Joint Economic Committee
U:S. GOVERNMENT PRINTING OFFICE
WASHINGTON: 1984

JOINT ECONOMIC COMMITTEE
(Created pursuant to sec. 5(a) of Public Law 304, 79th Congress)SENATE
ROGER W. JEPSEN, Iowa, ChairmanWILLIAM V. ROTH, JR., DelawareJAMES ABDNOR, South DakotaSTEVEN D. SYMMS, IdahoMACK MATTINGLY, GeorgiaALFONSE M. D'AMATO, New YorkLLOYD BENTSEN, TexasWILLIAM PROXMIRE, WisconsinEDWARD M. KENNEDY, MassachusettsPAUL S. SARBANES, Maryland
HOUSE OF REPRESENTATIVESLEE H. HAMILTON, Indiana, Vice ChairmanGILLIS W. LONG, LouisianaPARREN J. MITCHELL, MarylandAUGUSTUS F. HAWKINS, CaliforniaDAVID R. OBEY, WisconsinJAMES H. SCHEUER, New YorkCHALMERS P. WYLIE, OhioMARJORIE S. HOLT, MarylandDAN LUNGREN, CaliforniaOLYMPIA J. SNOWE, Maine
Baucz R. BARTLETT, Ex'ecutive DirectorJAMEs K. GALBRAITH, Deputy Director
SuBcOmmiTTEE ON ECoNomIC GOALS AND INTEBGOVERNMENTAL POLICY
HOUSE OF REPRESENTATIVESLEE H. HAMILTON, Indiana, ChairmanAUGUSTUS F. HAWKINS, CaliforniaOLYMPIA J. SNOWE, Maine
SENATELLOYD BENTSEN, Texas, Vice ChairmanROGER W. JEPSEN, IowaALFONSE M. D'AMATO, New York
(UI)

Preface
Infrastructure problems are widespread. They do not respect regional
or state boundaries. To secure a better data base concerning national and
state infrastructure conditions and to develop threshold estimates of
national and state infrastructure conditions, the Joint Econonic Cammittee
of the Congress requested that the University of Colorado's Graduate School
of Public Affairs direct a twenty-three state infrastructure study.
Simultaneously, the JEC appointed a National Infrastructure Advisory
Committee to monitor study progress, review study findings and help develop
policy recnmmendations to the Congress.
In almost all cases, the studies were prepared by principal analysts
free a university or college within the state, following a design developed
by the University of Colorado. Close collaboration was required and was
received from the Governor's staff and relevant state agencies.
Because of fiscal constraints each participating university or college
agreed to forego normal overhead and each researcher agreed to contribute
considerable time to the analysis. Both are to be camnended for their
commitment to a unique and important national effort for the Congress of
the United States.
(M)

National Infrastructure AdvisoryCoiiitteeJoint-Economic CaniWttee InfrastructurfeWt
Chairman
Honorable Henry S. Reussformer Chairman Joint Economic Committee
Chapman, Duff & PaulWashington, D.C. 20006
Vice Chairmen
Mr. Peter GoldmarkExecutive DirectorPort Authority of N.Y. & N.J.New York, N.Y.
Committee Members
Mr. Roy BahlDirector, Metropolitan Studies ProgramSyracuse UniversitySyracuse, N.Y.
Mr. C. Phillip BaumelProfessorAgricultural EconomicsIowa State UniversityAmes, Iowa
Mr. Michael BrewerDirector of Government Relations/Public Affairs
Cummins Engine Co.Columbus, Indiana
Mr. Pat ChoateSenior Policy Analyst, EconomicsTRW, Inc.Washington, D.C.
Mr. Peter M. DawkinsManaging DirectorLehman Brothers Kuhn Loeb, Inc.New York, N.Y.
Mr. Lee WhiteVice President & ManagerDenver OfficeSmith Barney, Harris Upham & Co.Denver, Colorado
Honorable Michael DukakisGovernor of MassachusettsBoston, Massachusetts
Mr. Robert GeorginePresidentBuilding & Construction TradesWashington, D.C.
Mr. Hyman GrossmanVice President, Municipal RatingStandard & Poor's Corp.New York, N.Y. I
Honorable William HobbyLt. Governor of TexasAustin, Texas
Honorable Thomas H. WeanGovernor of New JerseyTrenton, New Jersey
(V)

VI
Mr. Thomas KlutznickMiller, Klutznick, Davis & GreyChicago, Illinois
Ms. Juanita KrepsFormer U.S. Secretary of CommerceDuke UniversityDurham, N.C.
Honorable Richard D. LarsGovernor of ColoradoDenver, Colorado
Mr. Peter LewisPartnerLazard FreresNew York, N.Y.
Ms. Jane McGrewSteptoe & JohnsonWashington, D.C.
Honorable John MutzLt. Governor of IndianaIndianapolis, Indiana
Mr. Raymond NasherChairmanNasher Co.Dallas, Texas
Mr. George PetersonDirector, Public Finance CenterThe Urban InstituteWashington, D.C.
Mr. Lelanci S. PrussiaChairman of the BoardBank of AmericaSan Francisco, Ca.
Honorable Charles RoyerMayorCity of SeattleSeattle, Washington
Mr. George SchraderL.D. Brinkman & Co.Dallas, Texas
Honorable Ted SchwindenGovernor of MontanaHelena, Montana
Honorable John SpellmanGovernor of WashingtonOlympia, Washington
Honorable Mark WhiteGovernor of TexasAustin, Texas
Mr. John WiedemanPresidentAmerican Society of Civil EngineersAtlanta, Georgia
Honorable Coleman A. YoungMayorCity of DetroitDetroit, Michigan

PARTICIPATING STATES AND RESEARCHERS
State Researchers and Affiliation
Alabama Niles SchoeningUniversity of Alabama
California Fred CollignonUniversity of California at Berkeley
Colorado James OhiUniversity of Colorado at Denver
Florida Earl StarnesNeil SipeUniversity of Florida
Indiana Salmon ShahMorton MarcusIndiana University
Kentucky Phillip W. RoederDennis B. MurphyUniversity of Kentucky
Louisiana James D. SchillingLouisiana State University
Maine Carl VeazieUniversity of Southern Maine
Maryland David L. PuryearJohns Hopkins University
Massachusetts Karen Polenske.Gerald SussmanRichard TaborsLyn TodmanAdrian WalterJoint Center for Urban Policy Research
MIT and Harvard University
Missouri L. Kenneth HubbellUniversity of Missouri at Kansas City
Montana James OhiUniversity of Colorado at Denver
New Jersey Robert LakeRutgers University
New Mexico Lee zinkUniversity of New Mexico
(V=)

fM
Rae ZimmermanNew York University
Edward KaiserWilliam J. DrumsondKathleen M. HeadyUniversity of North Carolina at Chapel Hill
Michael PaganoMiami University
Jean McDonaldTim AdamsTom JonesUniversity of Oklahoma
Ken TollenoorUniversity of Oregon
James liteM.S. HenryB.L. DillmanClemson University
Niles SchoeningUniversity of Alabama
William E. ClaggertUniversity of Texas at Dallas
Phillip BourqueUniversity of Washington
New York
North Carolina
Ohio
Oklahoma
Oregon
South Carolina
Tennessee
Texas
Washington

LOUISIANA INFRASTRUCTURE(A Study of Louisianas Public Facilities)
Phase I
James D. ShillingAssistant Professor of Finance and Author
Department of FinanceCollege of Business Administration
Louisiana State University
Theodore N. McMullanPolicy Planner and Project Coordinator
Louisiana State Planning Office
LOUISIANA STATE PLANNING OFFICEOFFICE OF THE GOVERNOR
David C. Treen, GovernorWallace L. Walker, Executive Director
Baton Rouge, LouisianaJune 1983
(II)

PREFACE AND ACKNOWLEDGEMENTS
LOUISIANA: INFRASTRUCTURE (A Studv of Louisiana's Public Facilities)PHASE I was prepared as a result of Louisiana's participation in a nationwideassessment of public infrastructure needs conducted for an advisory committee to theUnited States Congressional Joint Economic Committee. The study project wascoordinated at the national level by Marshall Kaplan, Dean of the Graduate school ofPublic Affairs, University of Colorado at Denver and at the state level by Theodore N.
McMullan, Policy Planner at the Louisiana State Planning Office. The study wasconducted by James D. Shilling, Assistant Professor of Finance of the Department ofFinance, College of Business Administration, Louisiana State University at BatonRouge.
The following individuals participated in the development of information for the
study and will be involved with the continuing research of the state's public facilityneeds.
Sharon Balfour, Water Resources Manager, Office of Public Works,Louisiana Department of Transportation and Development
David Bowman, Economic Development Specialist, Office of Commerce andIndustry, Louisiana Department of Commerce
Glen Graham, Director of Planning Coordination, Office of Aviation andPublic Transportation, Louisiana Department of Transportation andDevelopment
Robert Hebert, Director of Waterways and Rail, Office of Aviation andPublic Transportation, Louisiana Department of Transportation andDevelopment
Dan Jourdon, Director of Research, Louisiana Municipal Association
Wayne McAlpine, Research Analyst, Office of Commerce and Industry,Department of Commerce
Carl Rascoe, Highway Needs Engineer, Office of Highways, LouisianaDepartment of Transportation and Development
Harry Reed, Director of Public Transit, Office of Aviation and PublicTransportation, Louisiana Department of Transportation andDevelopment
Vince Russo, Assistant Bridge Design Engineer, Office of Highways,Louisiana Department of Transportation and Development
Ted Stockwell, Highway Needs Priorities and Program Engineer, Officeof Highways, Louisiana Department of Transportation and Development
Art Theis, Chief Engineer, Office of Public Works, Louisiana Department ofTransportation and Development
Virginia Van Sickle, Coordinator, Louisiana Geological Survey
(XI)

XII
The Staff of the Louisiana State Planning Office was particularly helpful inmaking data available and providing assistance. Review and comments on the studywere provided by Carolyn S. Lane, Chief Planner, Louisiana State Planning Office, andMarshall Kaplan of the University of Colorado at Denver.
The text was prepared by Brenda Gatlin of Louisiana State University (drafttext) and Peggy S. Moak of the Louisiana State Planning Office (final text) and proof-read by Genelle C. Foster of the Louisiana State Planning Office. Graphics wereprepared by David C. Fruge' of the State Planning Office.
As the report title indicates, this study represents a threshold examination or"first look" at the public infrastructure situation in Louisiana. Further study andanalysis of this topic will be part of the State Planning Office's ongoing activities.

TABLE OF CONTENTS
Page
List of Tables xiv
List of Figures xvi
Chapter I - Principal Findings 11.1 Purpose and Scope of Study 11.2 Summary of the State and Local Investment Needs
by Function 11.3 Policy Options 10
Chapter U - Louisiana State and Local Finance 182.1 Economic and Demographic Trends 182.2 State Expenditures in General-A Retrospect View 252.3 Sources of Revenues 352.4 Bond Financing 392.5 Capital Budgeting Process 412.6 Investment Needs, Revenues and Priorities 41
Chapter Hi - Transportation 453.1 Highways 453.2 Bridges 573.3 Parish (County) and Local Roads 623.4 Railroads 693.5 Airports 723.6 Public Transportation 763.7 Ports and Waterways 83
Chapter IV - Water Supply, Treatment and Distribution 894.1 Water Supply 894.2 Wastewater Treatment - 944.3 Flood Control 97
Chapter V - Solid Waste Disposal 100
Appendix 103
Footnotes 106
(XfI)

LIST OF TABLES
Table Page
1 Summary of Investment Needs Versus Revenues,1983-2000 3
2 Total Personal Income in Louisiana by Industry Sector,Selected Years (Dollars) 20
3 Total Personal Income in Louisiana by Industry Sector,Selected Years (Percentage) 21
4 Growth of Total Personal Income in Louisiana and U.S.,Selected Periods 23
5 State Expenditures in Louisiana and All States,1975-1980 26
6 State Expenditures in Louisiana and All States inConstant Dollars 26
7 State Expenditures in Louisiana and All States as aProportion of Income 27
8 Local Expenditures in Louisiana and All Localities 279 Local Expenditures in Louisiana and All Localities
in Constant Dollars 2910 Trends in Sources of Louisiana State Government
Revenues, Selected Years 1956-1979/80 3611 Infrastructure Factors Affecting Operations Rated
by Industry Group 4412 Louisiana Total Road and Street Mileage 4713 Vehicle-Miles Per Day on Louisiana Highways 4814 Expenditures for Construction and Maintenance for
Louisiana State Maintained Highways 4815 State Highway Investment Needs, 1983-2000 5216 Sources of Funding for State Highways: Revenue
Projections with Low Inflation 5617 Capital Investment Needs and Revenues for State
Highway System, 1983-2000 5818 Bridge Replacement Investment Needs 6119 Capital Investment Needs and Revenues for Bridge
Replacement, 1983-1993 6320 Trends in Expenditures of Louisiana Local Governments 6421 Expenditures for Capital Outlays and Maintenance on
Local Roads by Louisiana Local Governments 6522 State Aid Distribution to Parishes (Counties) and
Municipalities for Highways 6523 Sources of Funding for Local Roads 6824 Investment Needs and Revenues for Local Streets and
Roads, 1983-2000 6825 Railroad Lines Operated in Louisiana 7026 Cost of Airport Facility Needs by Period 7527 Capital.Investment Needs and Revenues for Airports,
1983-2000 75
(XXV)

xv
LIST OF TABLES (continued)
Table Page
28 Public Transit System in Louisiana 7729 Total Annual Patronage for Louisiana Urban Transit
Systems 7830 Income and Operating Expenses for Louisiana Urban
Transit Systems 7931 Mass Transit Investment Needs for Louisiana,
1983-1990 8132 Revenues for Mass Transit System in Louisiana,
1983-1990 8233 Mass Transit Investment Needs Versus Revenues,
1983-1990 8234 Authorized Expenditures on Ports in Louisiana 8535 Water Requirements for Louisiana, 1970-2000 9136 Relative Distribution of Investment Per Capita for
Water Utilities 9337 EPA Assessments for Construction of Publicly-Owned
Wastewater Treatment Facilities 9638 Estimated Expenditures for Wastewater Treatment
Facilities 9639 Investment Needs versus Revenues for Wastewater
Treatment Facilities 98

LISr OF FIGURES
Figure Page
1 Population Growth, U.S. and Louisiana 1960-2000 232 Capital Expenditures as a Percent of Total
Expenditures in Louisiana 313 Trend in Capital Expenditures in Louisiana 324 Trend in State Spending (Excluding Federal Aid)
on Capital Improvements in Real Dollars inLouisiana 34
5 Sources of Revenues Versus Expenditures onHighways in Louisiana 54
(XVI)

L PRINCIPAL FINDINGS
1.1 Purpose and Scope of Study
Growing concern in recent years over the state of our public facilities has led
to much attention to the issue of revitalizing our nation's highways, railroad lines,
water and sewer supply systems, airports, mass transit systems, and ports - that
is, to the revitalization of our public infrastructure. Since the 1960s public works
spending in constant dollars has been declining approximately 5 percent per year
nationwide. The durability of capital assets and the build up -in capital throughout
the 1960s and the concomitant neglect since then is partially responsible for this
decline. This phenomenon is considered to adversely affect the public's health,
safety and welfare and net private investment which ultimately leads to declining
productivity.
The purpose of this study is to address these capital adequacy issues. The
research was conducted as part of the Congressional Joint Economic Committee
advisory committee's probe to assess the condition of America's infrastructure.
The scope of the study is to examine the infrastructure needs in Louisiana and
evaluate the financial capabilities of the state to meet these needs over the next
two decades.
1.2 Summary of State and Local Investment Needs by Function
State and local expenditures for capital improvements by function are
classified as follows: highways, bridges, local roads, railroads, airports, public
service transportation, water supply and wastewater treatment, and solid waste
disposal. Two other classifications-ports and waterways, and flood control
programs-are included as major categories but represent areas where increased
data and planning are needed. Expenditures for these activities are likely to
constitute an ever increasing percentage of total spending.
(1)
31-880 0 - 84 - 2

2
In this summary, state and local expenditures of Louisiana are compared to
estimates of available revenues (Table 1). Revenue projections are based on
current funding levels and estimates of anticipated federal grants-in-aid. Invest-
ment needs are unconstrained estimates of recurring expenditures by category.
Highways
Louisiana's projected expenditures of $11.639 billion for the construction and
maintenance of the state-maintained highway system for the period 1983 to 2000
equals approximately 50 percent of total state and local capital expenditures.
Included in these expenditures are $1.540 billion for interstate construction, $1.630
billion for overlay, construction and rehabilitation of roads currently deemed
deficient, $600 million for improvements to structures, and $7.869 billion for
projected deficiencies and normal maintenance over the next two decades. The
total cost of essential improvements for highways (to meet standards established
by the Louisiana Department of Transportation and Development) is estimated to
exceed highway revenues by $450 million. On an annual basis, this means a
shortfall of $27 million per year or that expenditures for overlay improvements
should equal $80 to $100 million annually. Cutbacks in this funding could
eventually have significant implications on the cost of maintaining adequate road
pavement conditions, grading, sight distances and other functional categories.
Bridges
Projected bridge construction and rehabilitation costs are approximately
$943.5 million over the period 1983 to 2000. This projection includes the cost of
replacement and rehabilitation of bridges categorized as structurally deficient or
functionally obsolete. Five thousand bridges or 32 percent of the total bridges in
Louisiana are targeted for replacement and rehabilitation. Revenues available

3
TABLE 1
Summary of Investment Needs versus Revenues, 1983-2000(Amount in millions of 1983 dollars)
Needs Revenues Shortfall
Highways $ 11,639.0 $ 11,187.7 $ 451.3Bridges 943.5 899.3 44.2Local Roads 6,780.0 5,740.0 1,040.0Railroads 23.3 -- 23.3Airports 68.0 24.8 43.2Public Service
Transportation 1,268.2 564.4 703.8Water Supply 308.8 308.8 .0Wastewater Treatment 2,411.0 1,583.0 828.0Solid Waste Disposal 2,367.0 2,367.0 .0
Total 25,808.8 $ 22,675.0 $ 3,133.8
Annual $ 1,518.2 $ 1,333.8 $ 184.4

4
depend heavily on the Federal Bridge Replacement Fund. Estimates indicate that
the current funding level is nearly consistent with investment needs. Total bridge
replacement costs equal approximately $55.5 million per year. Revenues fall short
of total expenditures for bridge replacement by approximately 5 percent or $2.6
million per year. There appears, though, to be a substantial discrepancy between
the quality of bridges on and off the state system. Fifty-four percent of the off-
system bridges are classified as structurally deficient while 13 percent of the on-
system bridges are classified as structurally deficient.
Local Roads
Expenditures to upgrade local roads over the period 1983 to 2000 are
estimated to equal $6.78 billion. This condition is primarily the result of high
motorist fatalities, rising traffic volumes, and terrain and soil conditions . As a
result, resurfacing and reconstruction costs are estimated to equal $399 million per
year. This exceeds available local revenues from local sources and
intergovernmental grants-in-aid by approximately $61 million per year. Compared
with the cost of recommended improvements in the state-maintained highway
system, local road needs suffer from a limited tax base. While aid to localities for
roads has more than kept pace with inflation over the last several years, demand
for capital improvement and maintenance projects exceeds the total supply of
funds by 15 percent.
Railroads
Projected expenditures for the rehabilitation of railroad branchline segments
generally deemed to be of comparatively major significance to local markets may
equal $23 million for the period 1983 to 2000. These rail lines for the most part

5
have relatively low density and are typically classified as class A and B branch-
lines. Since federal budget cutbacks have virtually eliminated federal grants for
the rehabilitation of rail facilities, there would be a shortfall of the entire $23
million which would have to be made up from another source. An advantage of
providing state funds for this purpose is the impact on local economies and
industrial park development.
Airports
Infrastructure investment needs for upgrading and maintaining public airports
in Louisiana equal $68 million for the period 1983 to 2000 or on the average, $4
million per year. Cost of improvements include the construction and upgrading of
the airport system and new navigational equipment. This outlay exceeds estimated
revenues based on current funding patterns by $2.5 million per year. Sources of
funding for this shortfall could be made up by an increased reliance on user fees
charged at each airport or through additional appropriations at the federal, state or
local level.
Public Service Transportation
Infrastructure investment needs for public transit programs and required
operation expenses anticipated for the period 1983 to 2000 equal $1.268 billion.
These projections are based on assumptions regarding vehicle replacement
schedules, fleet sizes, trends in operating expenses for each system in Louisiana
and user revenues. Capital investment requirements include new storage, mainte-
nance and service facilities, terminal and administrative buildings, and new buses.
If it is assumed that state assistance remains constant, then total investment needs
exceed revenues by $703.8 million. This shortfall constitutes the total local
requirements that must be financed by local or private sources.
6
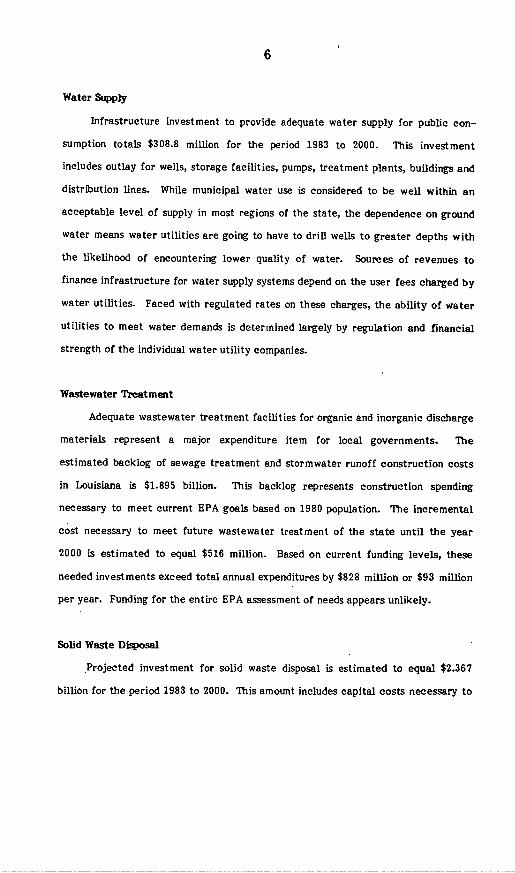
Water Supply
Infrastructure investment to provide adequate water supply for public con-
sumption totals $308.8 million for the period 1983 to 2000. This investment
includes outlay for wells, storage facilities, pumps, treatment plants, buildings and
distribution lines. While municipal water use is considered to be well within an
acceptable level of supply in most regions of the state, the dependence on ground
water means water utilities are going to have to drill wells to greater depths with
the likelihood of encountering lower quality of water. Sources of revenues to
finance infrastructure for water supply systems depend on the user fees charged by
water utilities. Faced with regulated rates on these charges, the ability of water
utilities to meet water demands is determined largely by regulation and financial
strength of the individual water utility companies.
Wastewater Treatment
Adequate wastewater treatment facilities for organic and inorganic discharge
materials represent a major expenditure item for local governments. The
estimated backlog of sewage treatment and stormwater runoff construction costs
in Louisiana is $1.895 billion. This backlog represents construction spending
necessary to meet current EPA goals based on 1980 population. The incremental
cost necessary to meet future wastewater treatment of the state until the year
2000 is estimated to equal $516 million. Based on current funding levels, these
needed investments exceed total annual expenditures by $828 million or $93 million
per year. Funding for the entire EPA assessment of needs appears unlikely.
Solid Waste Disposal
Projected investment for solid waste disposal is estimated to equal $2.367
billion for the period 1983 to 2000. This amount includes capital costs necessary to

7
satisfy the State of Louisiana solid waste management regulations as well as
maintenance costs of $134 million per year. While it is unclear as to whether or
not local governments can effectively cope with this problem, the burden of
providing for basic solid waste disposal can be passed directly onto the user. This
can be accomplished through an increased reliance on debt financing backed by
greater property taxes and/or user fees. The main problem concerning solid waste
disposal facing local governments in the state is compliance with regulations
severely restricting the location of sanitary landfills in wetland or floodplain areas.
Ports and Waterways
While port facilities are quasi-public enterprises, due to their impact on the
economy the state has a vested interest in their operations. In 1977, total capital
expenditures for ports equalled $16.8 million. By 1982, capital expenditures for
ports increased to $50.5 million, an average annual increase of 49.8 percent. In
addition, there are currently outstanding $789.2 million of general obligation and
self-supporting debt issued to finance capital improvements for ports. Approxi-
mately 85 percent of this debt outstanding is for the development of the Superport.
There is also $55.8 million of authorized but unissued general obligation debt for
ports still waiting to be issued.
Future investment needs can be classified into two categories: need for new
or modified navigation channels to handle an increased volume of traffic with
different characteristics, and need for replacement of structurally obsolete facili-
ties.
Data on the need for the replacement of structurally obsolete port facilities
within the state are unavailable. No cost estimates have been compiled to
determine the investment need in this area. Based on tonnages handled, queuing

8
theory (lining of ships awaiting a turn), average tow sizes and tonnage capacity,
only a few navigation structures have been assessed in terms of time until
replacement.
More research is needed to assess the investment needs of ports and
waterways in Louisiana. An increased government involvement in ports and
waterways can be explained on the basis of protectionist motives. (Governments
may be obligated to protect certain industries against income losses or to
encourage greater investment because of the impact exogenous changes may have
on the cost competitiveness of resources which do not have the opportunities
available to mobile factors.) Therefore greater capital investment in ports and
waterways may be justified; however, no estimates regarding this support are
available. If the state continues its support of port facilities at its current funding
level, then required annual investment may equal $33.7 million per year.
Flood Control
The federal government exercises control over the development of most of
the major river basins in Louisiana. In this context, the federal government is the
prime supplier of irrigation water, navigation improvements, flood control storage
or levee and channel improvements, and other water related projects. The
distribution of water and the use of water, however, is governed by state laws.
Traditionally, the primary method for reducing flood damage has been
through structural measures such as dams, dikes, levees, channel improvements and
seawalls. These have been constructed by the U.S. Army Corps of Engineers, at
least for the major rivers. During the past quarter century federal expenditures
for flood protection have nearly doubled. These increases are attributable to
expanding urban development and increased land utilization of floodplain areas.
Part of the protection against flood losses also comes from the National Flood

9
Insurance Program. This insurance program provides subsidized flood insurance
policies to property owners in designated flood hazard areas and requires communi-
ties to adopt and enforce floodplain management regulations. Since approximately
one-fourth of the flood damage in the United States occurs in Louisiana, flood
control represents an important concern.
Flood control programs in Louisiana provide for the construction of struc-
tures which protect against headwater and backwater flooding. Under the
direction of the Secretary of the Corps of Engineers and the supervision of the
Chief of Engineers, the Mississippi River Commission, created in 1879, is
responsible for this protection within the Mississippi alluvial valley. Total
authorized cost to accomplish this work is $7 billion, of which about $4 billion has
been spent. Maintenance costs alone equal $46 million per year. Smaller projects
(less of a national priority) are the responsibility of the state.
There is no comprehensive study that reflects total investmen needs for the
state in terms of flood control. However, a statewide flood control program has
recently been enacted (Louisiana Statewide Flood Control Program). The purpose
of this program is to design "long-term solutions to specific flood problems by
protecting existing towns, facilities and fields in high hazard areas while not
encouraging expansion into flood prone areas."1 The program was initiated because
of reduced availability of federal funds for flood control and delays in
implementing federal projects, and will fund smaller projects not handled by
federal programs. While the funding system requires a 70:30 state-to-local match,
maintenance of the structure will be the responsibility of the local government.
No estimates have been made for the total investment needs of the state for flood
control projects.

10
1.3 Policy Options
It is difficult to generalize about the options available to finance infrastruc-
ture expenditures because much depends on current financial conditions in the tax-
exempt bond market and the income flexibility of state and local revenues. The
significance of the infrastructure financing problem stems from an increased
demand for public goods and services resulting from a desire to remedy long
standing deficiencies. At the same time there is a decline in the financial capacity
of many governments to finance these expenditures from traditional generated
revenue sources or to incur and service debt. As the demands for basic public
infrastructure needs increase, emphasis must be placed on alternative financing
techniques and capital budgeting.
Traditional financial markets do not represent a cure for all the ills and
.difficulties besetting state and local governments. A prolonged period of losses on
tax-exempt securities through unanticipated increases in the rate of inflation has
reduced the ease of converting assets into cash without loss and has also reduced
the marketability of long-term tax-exempts. Federal budget cutbacks have added
to state and local government's financial vulnerability. Dealers and institutional
investors are far less willing to expose themselves to this risk and have therefore
set higher interest rates due to such uncertainty. Cutbacks in new services and
postponement of capital investment due to higher interest rates have been forced
on many states and municipalities as a result. Postponing capital improvement
projects ultimately leads to greater costs for the capital facility and may
contribute to outmigration of industry and jobs.
The options available to state and local governments thus include increasing
-taxes, improving state and local government capital financing prospects, and/or
relying more heavily on capital budgeting. Perhaps the most significant options

11
under capital financing prospects are some major innovations in the tax-exempt
financial markets.
Tax Policy
Philosophical changes in tax policy are certain to emerge as a necessity to
finance greater expenditures on projects. During the past two decades, Louisiana
state and local governments have relied heavily on federal funds and petroleum-
related windfalls. Federal grants-in-aid tend to distort the costs of providing
public services and may lead to overinvestment in some areas. In the absence of
user charges, these investments have conferred distributional benefits to selected
groups of individuals. Relying more heavily on user charges or special fees
whenever possible would reverse this situation.
Stabilizing the revenue base should lead to a greater ability to finance capital
improvement projects and to incur and service more debt. For every percent
increase in the overall income elasticity of the tax system, capital investment
should increase by 2.89 percent. This assumes no change in other expenditures nor
any change in current funding. However, if federal grants-in-aid, for example, are
further reduced, then part of this increase will be necessary just to offset the
substitution effect federal grants-in-aid have on capital expenditures.
Any tax reform should promote efficient distribution of capital. Since taxes
create a differential wedge between pretax and posttax returns across broad
classes of capital, the wedges cause a misallocation of capital. These distortions
are minimized by the reliance on user charges. In addition, user charges remove
the subsidy elements involved in the provision of goods and services thereby further
promoting economic efficiency. User fees also relate the effective demand for
public goods and services in the private market sector to the supply of services in
the public sector. If the government must raise additional tax revenues, then user

12
fees minimize these distortions for any given amount of revenue to be collected.
Alternatively, if government must use one or two specific types of taxes to raise
revenues, then the guiding principle should be to improve tax revenue collections
while attempting to improve the overall allocation of resources.
Infrastructure Bank
Credit market constraints on public sector borrowing may be alleviated by
the formation of regional and/or state infrastructure banks. The concept behind
these banks would be to provide a reliable source of funding for infrastructure at
below market rates of interest to state and local governments. Sources of funding
could be provided from direct state appropriations, deposits of federal grants-in-
aid to local governments, private capital investment, proceeds from interest on
investment funds, and interest on the loans held in the bank's portfolio.
An infrastructure bank, already proposed in New Jersey is anticipated to
provide loans to local governments for capital improvements. While the proposal
requires Congressional approval for the deposit of federal grants-in-aid, it has
significant ramifications on local government finance and could serve as a
prototype for other states. Making additional funds available to local governments
at subsidized interest rates should relieve their over reliance on traditional debt
financing and serve to improve or preserve the credit rating on state and local
bonds. This, in turn, means lower net interest cost to these governments and thus a
greater capacity to finance capital improvement projects.
Subsidized Taxable Bond Option
State and local expenditures on capital outlays depend heavily on debt
financing and the favorable status given tax-exempt interest rates versus interest
rates on taxable securities. While historically the rate ratio between long-term

13
taxables and tax-exempt bonds of comparable credit quality has been
approximately 70 to 75 percent, there is no institutional limit constraining this
yield differential. Changes in the amount of the relative supply of tax-exempts
issued as well as other factors produce changes in this yield spread. Any increase
in the tax-exempt rate relative to the taxable rate erodes the subsidy to state and
local borrowing. In general, for every one percent increase in the interest rate
state and local governments pay, capital expenditures in Louisiana decrease by 0.80
percent.
- The option to issue a subsidized taxable bond under which the federal
government would pay 40 percent of the interest could have substantial credit
market impacts. The likely effect on state and local government budgets would be
to reduce interest payments and allow for greater public infrastructure investment.
An advantage of subsidized taxable bond options would be to favor state and local
capital construction vis-a-vis other forms of capital information.
Bond Bank
Another approach to lowering the interest cost to state and local
governments would be to create a state and local bond bank which would purchase
bonds from state and local governments and either "pass through" these securities
by pooling issues together and selling them to ultimate investors or issue tax-
exempt backed bonds. Such secondary market policies could alter the
characteristics of state and local bonds to make them more attractive to investors
and hence less costly to the issuer. Any reduction in the cost of debt means
substantial savings in net interest costs to state and local governments.

14
Three basic features of a state and local bond bank which would increase the
ability to finance capital improvement projects are: packaging, marketability, and
risk. Packaging a pool of state and local bonds eliminates the need for investor
expertise in underwriting and servicing individual bonds. Marketability is improved
since, in general, the greater the volume of trading in securities of a homogeneous
risk class, the smaller the spread between bid and asked prices. Risk to the
investor is reduced through diversification. That is, the state and local bond
financing vehicles are analogous to a mutual fund in that they reduce default risk
to the investor through diversification. In sum, overall credit market efficiency
could be enhanced.
Short-Term Debt Financing
The use of short-term debt or other forms of creative bond financing are
additional tools that could be used to lower interest costs or better match interest
payments to tax receipts in order to finance greater amounts of capital invest-
ment. The use of short-term debt as an alternative to long-term debt, though, may
be dangerous. While short-term debt gives the borrower the ability to better gauge
entry into the long-term bond market, it places serious disadvantages on the issuer
if everyone follows this practice. The shortened lives of bond issues may also add
to the stress on already tight operating budgets if interest rates do not move as
anticipated.
Capital Budgeting
State and local governments need to place an even greater emphasis on long-
range capital budgeting. An initiation of better long-range planning and budgeting
is important if the capital budget is to prioritize real needs. Better information on
the consequences of unfunded routine maintenance expenses and repairs is needed

15
as a planning data base to set forth the specific impacts of declining public
infrastructure investment.
Areas where increased data and planning are needed include: local roads,
ports and waterways (especially the need to replace structurally obsolete
facilities), water supply and water quality, wastewater treatment, solid waste
disposal, and flood control programs. Some of these areas recently have received
attention regarding long-range planning but much more is needed.
Local roads derive much of their support from intergovernmental aid from
the state. Distributional factors attempt to allocate these revenues to local
governments either on an origin basis or on an allocation aid program but many
inequities exist. In an attempt to equalize local government costs and
opportunities, intergovernmental aid from the state, for the most part, bears only a
distant relationship to the theory of optimal federalism. If one believes the
conventional theory of grants-in-aid, then intergovernmental aid to local govern-
ments should be totally unrelated to distributional equity. Instead, intergovern-
mental aid to local governments from roads should be based on a "Pavement
Management System" where needs and priorities are determined on the basis of
functional classification of the road system. Periodic assessment of local roads
should provide the means for establishing priorities and acceptable levels of travel
service.
On the other hand, if one believes that grants-in-aid are central to the
redistribution of income among individuals, then state aid to localities and
municipalities for roads should be based solely on an allocation aid program. The
grants-in-aid in this case would be used to promote greater redistribution of
income. By design, allocational efficiency would be impaired and resources would
be misallocated, but income would be better distributed.

16
Since Louisiana's ports and river resources are vital to the state's economy,
more interface between private market enterprises and public sector interests is
needed, especially in the area of decaying port facilities. Various alternative
recommendations exist for the need for new or modified navigation channels to
handle an increased volume of traffic with different characteristics but no program
has been developed to prioritize these needs on a statewide basis.
Water supply needs and water quality issues have traditionally been taken for
granted since Louisiana has an abundant supply of water and an average rainfall of
50 to 60 inches a year. While surface water covers most of the state and fresh
groundwater is found in six major aquifer systems, some areas of the state contain
no productive freshwater aquifers. Water quality becomes of extreme importance
in these areas. Further long-range planning is needed to develop and prioritize
these investment needs.
Wastewater treatment facilities in Louisiana currently range from collection
with no treatment to collection with advanced treatment. The estimated backlog
of needed construction and the additional cost necessary to meet future needs
seriously places doubts on the ability of local governments to cope with the
problem. It also raises the issue of whether more federal or state support is
needed. Reassessment of standards regarding wastewater treatment (and solid
waste disposal) and the opportunity costs of unfunded capital improvement projects
need to be examined for possible inconsistencies with current limitations on
sources of local tax revenues.
Flood control programs in Louisiana provide for the construction of struc-
tures which protect against headwater and backwater flooding. For the major river
basins, flood control has traditionally been the responsibility of the federal
government. Smaller projects (less of a national priority) are the responsibility of

17
the state. While there is no comprehensive study that reflects total investment
need for the state in terms of flood control, there has been a flood control program
recently enacted (Louisiana Statewide Flood Control Program) which addresses
long-term solutions to specific flood problems. Arising from the reduced
availability of federal funds for flood control and delays in implementing federal
projects, the Louisiana Statewide Flood Control Program can serve as a prototype
for prioritizing needs in other areas. Developing new and revitalizing old
infrastructure facilities is difficult unless further capital budgeting and long-term
planning is utilized.
31-880 0 - 84 - 3-

18
IL LOUISIANA STATE AND LOCAL FINANCE
During the past 30 years, state and local governments have experienced
difficulties in meeting the demands for public goods and services. Various partial
explanations for this phenomenon exist. The main problem is that the demand for
services provided by state and local governments is very resilient, while revenues
are not especially suited to keep pace with rapidly increasing expenditures.2
Although most state and local governments have a varied revenue base, their taxes
are not extremely income elastic. That is, state and local revenue sources tend to
provide more stable yields and for the most part are not extremely sensitive to
changes in income. Thus as income increases and the demand for state and local
services increase this insensitivity to changes in income poses serious problems for
fiscal stability. As a consequence, public expenditures have changed markedly
during recent years.
2.1 Economic and Demographic Trends
Louisiana possesses a great potential for economic development owing to its
abundant supply of natural resources, land availability, warm climate and estab-
lished support facilities. Much of this great production power has manifested itself
in a comparative advantage for capital-intensive manufacturing industries. While
the wealth of specialization depends upon people's demand for those particular
products, specialization seems to increase risks. If individual demands or willing-
ness to work in certain tasks should change, then specialization may result in loss
of value. The risk for Louisiana is apparent in the heavy investment in the goods
producing industrial sector.

19
Economic growth in Louisiana has primarily been concentrated in mining,
construction and manufacturing industries (see Table 2). Over the past 25 years,
total production in this sector has increased by over 743 percent. Mining
production of oil and gas extraction has experienced the greatest increase. This
industry typically pays high wages and provides an important source of income for
the state and local governments. By 1981, mining accounted for 9.4 percent of
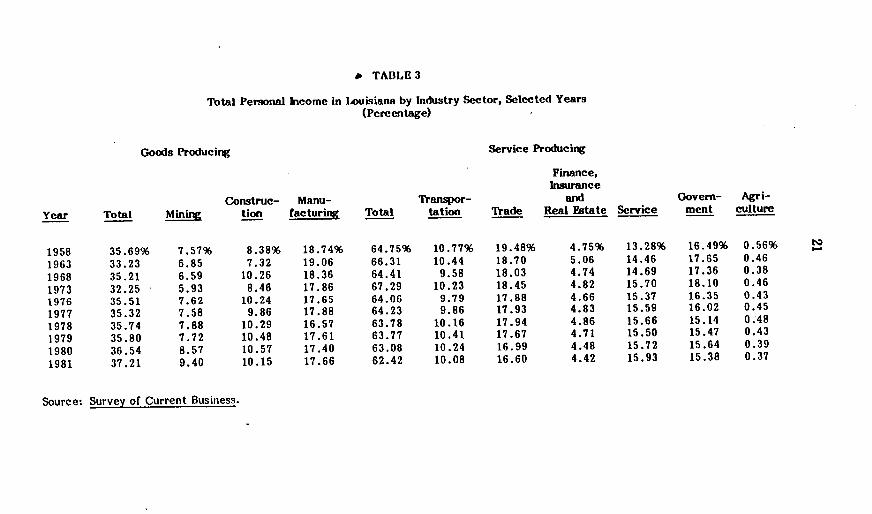
total personal income in Louisiana (see Table 3).
Growth in the construction industry has been due almost exclusively to the
relatively high-level of capital-intensive manufacturing concerns. General and
specific trade contractors have been engaged in refinery construction, dredging and
dock construction, and specialized activities such as electrical work, carpentry and
plumbing. Construction accounted for 10.15 percent of total personal income in
Louisiana by 1981.
Expansion of manufacturing in Louisiana depends to a large extent on the
growth of consumer markets in the South. In 1958, manufacturing accounted for
$738 million or approximately 18.74 percent of total personal income. By 1981, the
manufacturing's share of total personal income equalled 17.66 percent, a decrease
of approximately one percent.
While the share of total personal income attributable to service producing
industries has increased from 60.80 percent in 1958 to 65.59 percent in 1981 for the
U.S., service industries in Louisiana have experienced an opposite trend. In 1958,
service producing industries accounted for $2,550 million in Louisiana or about
64.75 percent of total personal income. By 1981, service producing income
equalled $19,326 million or 62.42 percent of total personal income. An important
component of this sector is the transportation, communication and public utilities
industry. Louisiana's geographic location has made the state an important focal

TABLE 2
Total Personal Income in Louisiana by Industry Sector, Selected Years(Amount in millions)
Goods Producin
Year Tbtal Mining
Service Producing
Finance,Insurance
Construe- Manu- Transpor- and Govern- Agri-tion facturing Total tation Trade Real Estate Service ment culture
1958 $ 1,366 $ 298 $ 330 $ 738 $ 2,550 $ 424 $ 767 $ 187 $ 523 $ 649 $221963 1,576 325 347 904 3,145 495 887 240 686 837 221968 2,673 500 779 1,394 4,889 727 1,369 360 1,115 1,318 291973 3,526 648 925 1,953 7,357 1,118 2,017 527 1,716 1,979 501976 5,664 1,216 1,633 2,815 10,219 1,562 2,853 744 2,452 2,608 691977 6,320 1,357 1,764 3,199 11,493 1,765 3,208 865 2,789 2,866 801978 7,384 1,628 2,126 3,630 13,176 2,100 3,707 1,005 3,236 3,128 1001979 8,431 1,818 2,467 4,146 15,017 2,452 4,162 1,109 3,651 3,643 1011980 9,882 2,317 2,858 4,707 17,061 2,770 4,595 1,213 4,253 4,230 1041981 11,521 2,910 3,144 5,467 19,326 3,122 5,140 1,369 4,933 4,762 115
Source: Survey of Current Business.
ng
* TABLE 3
Total Personal Income in Louisiana by Industry Sector, Selected Years(Percentage)
Goods Producing
Year Total MiningConstrue- Manu-
tion facturingTrsanspor-
Total tation
Service Producing
Finance,Insurance
andTrade Real Estate Service
Govern- Agri-ment culture
19.48%18.7018.0318.4517.8817.9317.9417.6716.9916.60
4.75% 13.28%5.06 14.464.74 14.694.82 15.704.66 15.374.83 15.594.86 15.664.71 15.504.48 15.724.42 15.93
Source: Survey of Current Business.
1958196319681973197619771978197919801981
35.69%33.2335.2132.2535.5135.3235.7435.8036.5437.21
7.57%6.856.595.937.627.587.887.728.579.40
8.38%7.32
10.268.46
10.249.86
10.2910.4810.5710.15
18.74%19.0618.3617.8617.6517.8816.5717.6117.4017.66
64.75%66.3164.4167.2964.0664.2363.7863.7763.0862.42
10.77%10.44
9.5810.23
9.799.86
10.1610.4110.2410.08
-.216.49%17.6517.3618.1016.3516.0215.1415.4715.6415.38
0.56%0.460.380.460.430.450.480.430.390.37

22
point for water transportation. Growth in this industry is normally a function of
economic conditions and population levels.
Agriculture constitutes a relatively modest share of total personal income in
Louisiana. Employment in this sector is expected to decrease due to the increased
use of capital equipment. Like the other goods producing industries, a shift is
expected to occur away from agriculture to service related industries. Assuming
past trends continue, total personal income should increase faster in Louisiana
than for all states on average. Overall, total personal income in Louisiana
outpaced the national average from 1958 to 1981 (see Table 4). Some of this
increase is due primarily to migration patterns which, in turn, affect infrastructure
needs. The high mobility and rate of change in population contribute to an even
greater stress on state and local finance by adding to required capital expendi-
tures.
Population growth in Louisiana is anticipated to be 1.36 percent during the
next two decades. By the year 2000, total population is projected to reach 5.510
million, an annual growth rate of 100 percent higher than that of the entire nation.
This can be compared to an average rate of growth of 1.54 percent during the
period 1960 to 1980 (see Figure 1).
These population patterns on an area-wide basis contribute largely eto the
problems of financing local governmental units. The decentralization of the
metropolitan areas in Louisiana entails expanding urban services and greater
strains on local budgets. Most of the greatest projected population growth rates
are to occur near the SMSAs in the state. The average growth rate for the New
Orleans area is projected to be 2.4 percent; 2.5 percent for the Baton Rouge area;
1.71 percent for the Lafayette area; 1.50 percent for the Shreveport area; 1.15
percent for the Lake Charles area; 1.01 percent for the Alexandria area; and .84
percent for the Monroe area.

23
TABLE 4
Growth of Total Personal Iecome in Louisiana and U.S., Selected Periods
Period Louisiana U.S.
1958-1963 20.44% 28.56%
1963-1968 60.06 48.88
1968-1973 44.03 49.33
1973-1976 45.91 28.30
1976-1979 47.62 40.47
1979-1981 31.48 19.03
Source: Survey of Current Business.

24
0
1960
1970
1980
1990
2000
FIGURE 1
Population Growth, U.S. and Louisiana
1960-2000
1.0 2.0
1111111111a1a1111111i ilag
�����2
{F] United States
M Louisiana
Source: Population Projection Series 11 Report, The University of New Orleans,Division of Business and Economic Research, and The Louisiana StatePlanning Office, September 1982.
MMMMM M !p! lp 1pipplipplipplil ii M iHMM M i111 !!ill 1
11M M !" M M M M M .... 11111111111,1111,1111iiiiiiiii4:�M ,,iii''iii''ii''iii.l.�ll.....�ll..IlllilI 1.
...... I........I.... -11i i i i iiiiii t it t t t iti-H
HiM MiNHHHHH11 ! I'MHHHHHHHHH!
iiiiiii i ii ii NiiHHHHHHHHHHHH! HH-H i H H H!

25
2.2 State Expenditures in General-A Retrospect View
Expenditures by all states increased from $95,831.6 million in 1975 to
$198,347.7 million in 1980, an average annual increase of 15.96 percent in 6 years
(see Table 5). During the same period state expenditures by Louisiana increased
from $2,089.5 million to $4,281.4 million, an average annual increase of 15.65
percent. Louisiana's sharpest increase occurred in 1977, when expenditures
increased by 22.10 percent. A large part of the increase in expenditures in
Louisiana resulted from windfall revenues and an increase in prices. Louisiana-as
well as other states-has had to make larger expenditures owing to higher prices in
general. Corrected for price changes, expenditures in Louisiana increased from
$2,089.5 million in 1975 to $2,796.5 million in 1980, an average annual increase of
6.16 percent (see Table 6). This corresponds to an increase of $95,831.6 million to
$129,554.3 million in all states, which represents an average annual increase of
6.55 percent. Except for the period 1977 to 1978, expenditures in Louisiana
increased faster than expenditures in all states.
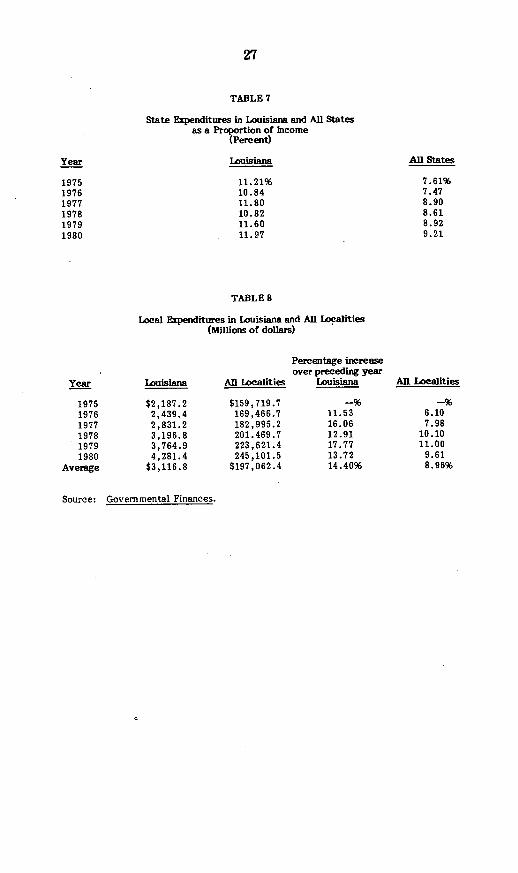
Expenditures as a percentage of income were greater in Louisiana than they
were for all states (see Table 7). In 1975, state expenditures in Louisiana equalled
11.21 percent of income compared to 7.61 percent for all states. Expenditures as
a percentage of income increased in Louisiana and for all states largely because
income increased. In Louisiana, the increase was from 11.21 percent to 11.97
percent in 1981 relative to an increase from 7.61 percent to 9.21 percent in 1981 in
all states. Thus despite the relatively small increase in expenditures as a
percentage of income in Louisiana, expenditures still constitute a much larger
share of total personal income in Louisiana than in all states.
Expenditures by local governments in Louisiana are given in Table 8. The
percentage increase in spending by local governments in Louisiana is consistently
greater than the percentage increase in spending for all governments. From 1975

26
TABLE 5
State Expenditures in Louisiana and All States, 1975-1980(Millions of dollars)
Louisiana
$2,089.52,294.12,801.22,934.63,571.54,281 4
Governmental Finances.
All States
$ 95,831.6103,535.1136,544.9148,690.1173,307.5198 347.7
$142,709.5
Percentage increase-over preceding year
Louisiana
9.7922.104.76
21.7019.8815.65%
TABLE 6
State Expenditures in Louisiana and All Statesin Constant Dollars (1975)
(Millions of dollars)
Percentage increaseover preceding year
Louisiana All States Louisiana
$2,089.5 $ 95,831.6 -9%2,169.0 97,887.0 3.802,488.0 121,276.2 14.702,420.9 122,661.4 -2.702,648.3 128,509.2 9.392,796.5 129 554.3 5.60
$2,435.4 $115953.3 6.16%
Governmental Finances.Department of Labor, Bureau of Labor Statistics-ConsumerPrice Index, all items.
Year
197519761977197819791980
Average
Source:
All States
-%68.04
31.888.89
16.5614.4515.96%
Year
197519761977197819791980
Average
Source:
All States
-962.14
23.891.144.770.816.55%
27
TABLE 7
State Expenditures in Louisiana and All Statesas a Proportion of Income
(Percent)
Louisiana
11.21%10.8411.8010.8211.6011.97
TABLE 8
Local Expenditures in Louisiana and All Localities(Millions of dollars)
Percentage increaseover preceding year
Louisiana AD Localities Louisiana
$2,187.22,439.42,831.23,196.83,764.94,281.4
$3,116.8
$159,719.7169,466.7182,995.2201.469.7223,621.4245,101.5
$197,062.4
11.5316.0612.9117.7713.7214.40%
Source: Governmental Finances.
Year
197519761977197819791980
Year
197519761977197819791980
Average
All States
7.61%7.478.908.618.929.21
All Localities
6.107.98
10.1011.00
9.618.96%
28
to 1980, expenditures by local governments in Louisiana increased from $2,187.2
million to $4,281.4 million, an average annual increase of 14.40 percent. This can
be compared to the change in total expenditures of all localities from $159,719.7
million to $245,101.5 million, an average annual increase of 8.96 percent. In real
terms, the average annual increase in expenditures in Louisiana is 5.08 percent and
0.07 percent for all localities (see Table 9). Thus local governments in Louisiana
have been spending more each year than the national average. This pattern is due
mainly to the urbanization of the population and the expansion of the economy.
Sources of expenditure funds for all levels of government were derived
either from federal grants-in-aid or other intergovernmental aid, from own
revenue sources, and/or from debt financing (for capital expenditures). However,
as capital demands for basic public needs increase, the financing capacity
necessary to meet these needs has been constrained by institutional limits on
federal grants-in-aid and by a beleaguered credit market. Since late 1979, interest
rates on state and local debt have increased by over 4 percentage points. Relative
to taxable securities, the interest rates on tax-exempts have risen from 70 percent
in early 1979 to over 90 percent in 1982. This has made financing public
infrastructure investment very costly. If state and local services experience only
minor productivity growth over time, then additional financing is necessary just to
cover an increasing cost of providing a constant level of public services.
Actual expenditures on capital investment have traditionally been regarded
as being susceptible to serious neglect owing to tight budgets, rising costs, and
alleged "pork barrel" political practices. Ultimately, the consequence of foregoing
capital improvement projects is to incur greater construction costs in the future.
While the alternative is to issue debt to finance current capital projects, this may
adversely affect the ability to borrow in the future. The problem is that repairing
and preventing further deterioration in the state's infrastructure requires large

29
TABLE9Local Expenditures in Louisiana and All Localities
in Constant Dollars (1975)(Millions of dollars)
Percentage increaseover preceding year
Year Louisiana All localities Louisiana All Localities
1975 $2,187.2 $159,719.7 -% -%
1976 2,306.3 160,221.9 5.45 0.31
1977 2,514.6 162,532.3 9.03 1.44
1978 2,637.2 166,201.7 4.88 2.26
1979 2,791.7 165,817.4 5.86 -0.23
1980 2,796.5 160,092.4 0.17 -3.45
Average $2,538.9 $162,431.4 5.08% 0.07%
Source: Governmental Finances.Department of Labor, Bureau of Labor Statistics-ConsumerPrice Index, all items.

30
amounts of capital. This makes capital expenditures sensitive to cyclical economic
fluctuations.
Capital expenditures in Louisiana as a percent of total expenditures during
the period 1973 to 1982 are depicted in Figure 2. In 1973 capital expenditures as a
percent of total expenditures equalled 11.57 percent. By the period 1975 to 1977,
this percentage increased to 14.79 percent. Favorable bond market conditions and
an improved economy account for much of this increase. Since 1978, capital
expenditures as a percent of total expenditures declined to 10.68 percent. Further
exaggerating this decline is the amount of capital projects authorized but not
funded.
Partially responsible for this trend in capital expenditures has been the heavy
reliance on revenues from oil and gas. In the past, windfall revenues have allowed
the state to undertake many public works programs not normally considered a
function of the state. Many public works projects of local interest, that to the
most highly centralized state would be left to some local authority, have been
performed at an increasing rate at the state level as a result of oil and gas windfall
revenues. However, this situation has been altered significantly since 1980
primarily due to the world surplus of oil which caused oil prices to plummet and
forced severe budget cuts.
Repair and construction of highways and bridges account for most of the
state's capital expenditures (see Figure 3). In 1973, the percent of highway
expenditures to total capital expenditures equalled 89 percent. While the state's
total capital expenditures increased by 180 percent during the period 1973 to 1982,
outlays on highways increased by only 120 percent. In 1982 expenditures on
highways constituted just 65 percent of total expenditures. Given the recent five-
cent federal gasoline tax hike, however, total expenditures on highways should
continue to increase as a proportion of total capital outlays in the future.

31
FIGURE 2
Capital Expenditures as a Percent of Total Expenditures in Louisiana
_____ l H l ii 1 H i HHHF: HHHHiil I Hii1973 1974 1975 1976 1977 1978
Year
CapitalExpenditures
1979 1980 1981
PercentYear Total Expenditures
1973 11.571974 10.881975 14.801976 15.621977 13.961978 12.001979 9.351980 10.921981 11.76
Source: Louisiana's Capital Budgetin: Progress or Paper Reforms, Public Affairs
Research Council of Louisiana, 1983.
esB
0r
2-
0.
ca
a)0.
16.0-
15.0-
14.0-
13.0-
12.0-
11.0-
10.0 -
9.0-
[itT.-
I

32
FIGURE 3
Trend in Capital Expenditures in Louisiana
100--
90-
193194 175 17 197 197 197 1d80lllllllII 191198211
Yea H40hwa Expendture Non-Highwayghway Exendtures
197 73.51 26.4911tllllitl'lil19317 919767 177.0 22. 99 98 981 92
1977 71.20 28.80
1978 62.66 37.341979 65.09 34.911980 57.20 42.801981 59.47 40.531982 64.26 35.74
Source: Louisiana's Capital Budgeting: Progress or Paper Reforms, Public AffairsResearch Council of Louisiana, 1983.

33
Other capital expenditures have increased by 204.5 percent from 1977 to
1981. Because of the nationwide recession, falling revenues, and high interest
rates, other capital expenditures decreased sharply between 1981 and 1982.
Anticipating this trend to continue in the short-run would suggest that
improvement in most public facilities in Louisiana will lag behind economic
recovery.
Figure 4 shows recent trends in state capital expenditures excluding federal
aid and debt financing. This trend indicates that state capital outlays have fallen
in real absolute terms. On a per capita basis, state expenditures decreased from
$24.80 per person in 1974 to $18.13 per person in 1980. This relative decline in real
outlays reflects the increasing inability of all governments to hold down the rate of
tax growth, while financing an increasing level of public services. Such budgetary
practices may keep sources and uses of funds in balance in the short-run, but may
impose serious consequences for long-term growth. It also suggests that federal
grants-in-aid are primarily responsible for the sustained growth in total capital
outlays.
Capital expenditures at the local level correspond to the same trend
displayed by state spending. Total spending for highways and public improvements
by municipalities on a per capita basis increased by 4.3 percent in current dollars
for the period 1974 to 1980. By 1979-1980, capital expenditures accounted for the
largest source of total spending for all municipalities. While the strain on
municipal budgets was temporarily alleviated by the establishment by the state of
a municipal capital outlay revenue sharing fund distributed on a one-time basis in
1980, local governmental finance of capital expenditures has been difficult for
those communities which do not have an adequate economic base to support public
works improvement projects. Further aggravating the problem is the fact that
state aid to local governments contains many distributional inequities.4 These
inherent inequities mask many serious budgetary problems.
31-880 0 - 84 - 4

34
FIGURE 4
Trend in State Spending (Excluding Federal Aid)
on Capital Improvements in Real Dollars in Louisiana
(in millions)
Source: Louisiana State-Local Fiscal Study Report, data converted to constantdollars using Consumer Price index, all items.

35
2.3 Sources of Revenue
Sources of revenue in Louisiana include intergovernmental grants-in-aid,
property taxes, general sales taxes, selective sales taxes, income tax, severance
tax, other taxes, and charges and miscellaneous services. In 1956, Louisiana had
$195 million available for expenditures (see Table 10). The largest amount of
revenue was derived from taxes on sales, motor vehicle fuels, alcoholic beverages,
motor vehicles and tobacco. Total sales tax revenue represented 35.5 percent of
total receipts. By 1979-80, revenue generated from the general sales tax and
selective sales taxes equalled 24.8 percent of total receipts. Thus sales taxes have
become less important as the state has broadened its revenue base over time.
Intergovernmental payments, or grants from the federal government and
local governments, are the second most important source of state funds. Federal
grants consist of funds which may be expended directly by the state or distributed
to local governments. Revenues received by the state from local governments
constitute payment for their financial share of programs administered by the state
or for services performed on their behalf.
Intergovernmental payments amounted to 18.5 percent of all revenues
received in 1956. By 1979-80, intergovernmental payments increased to over $310
million, which is equivalent to 27.2 percent of all receipts. Relative to inter-
governmental payments to all state governments, aid to Louisiana is approximately
28 percent higher than national averages. 5 This heavy reliance on federal aid is
not without some serious consequences. The major consequence, of course, is that
Louisiana will be severely affected by any reduction in federal funds for state and
local governments in the future.

TABLE 10
Trends in Sources or Louisiana State Government RevenuesSelected Years, 1956 - 1979/1980
(Per Capita and Percentage Distribution)
Total IntergovernmentalRevenue Revenue
$ 195244338532688805818921
1,0111,140
$ 36.160.889.6
140.4177. 5212.5246.2263.4273.0310.1
PropertyTaxes
$3.94.95.47.4000000
General Sales Selective Sales IncomeTaxes Taxes Tax
$ 25.926.839.974.596.3
109.5122.7141.8168.8175.6
$ 43.342.049.775.082.689.494.1
100.4107.2107.2
$ 9.412.418.949.549.553.158.194.9
113.2118.6
Percentage Distribution
18.524.926.526.425.826.430.128.627.327.2
2.02.01.61.40.00.00.00.00.00.0
13.311.011.814.014.013.615.015.416.715.4
Source: Louisiana State - Local Fiscal Study Report
Year
1956196119661971197419751976197719781979
SeveranceTaxes
$ 26.744.958.866.0
144.5145.7126.0119.7127.4125.4
1956196119661971197419751976197719781979
OtherTaxes
$10.713.215.925.028.933.036.039.640.444.5
100.0100.0100.0100.0100.0100.0100.0
100.0100.0100.0
Chargesand Misc.
$ 37.837.357.190.4
103.2153.8131.7159.3175.9259.9
22.217.214.714.112.011.111.510.910.69.4
4.85.15.69.37.26.67.1
10.311.210.4
13.718.417.412.421.018.115.413.012.611.0
5.55.44.74.74.24.14.44.34.03.9
19.415.316.917.015.019.116.117.317.422.8

37
Institutional arrangements relating to federal grants-in-aid may have also
caused further problems by leading to overexpansion of services in some areas.
Federal grants-in-aid may distort factor prices of providing public services and
promote certain types of expenditures.6 Coupled with the political pressure in the
past to avoid user charges even when feasible, federal grants-in-aid may have
induced state and local governments to undertake negative net present value
projects. In the absence of user charges, these investments have conferred
distributional benefits to selected classes of individuals.
The demand for new and better services at the state and local level has
resulted in state and localities seeking more federal assistance in a variety of
areas. This demand for increased federal assistance at the state and local levels
also stems from the desire to avoid an indefinitely long commitment of self-
generated funds on capital construction projects. Growth in federal grants-in-aid
has allowed capital outlay expenditures to increase rapidly during the past quarter
century, especially for highways. Highway construction in Louisiana depends
heavily on federal grants-in-aid and since the federal government has vastly
increased the number and magnitude of grants-in-aid to states, highway
construction has greatly benefited. During the period 1957 to 1980, the state's
spending on highways outpaced the national average by 4 percent per year. By
1980, expenditures on highways in Louisiana equalled 12.7 percent of total
expenditures compared to 9.1 percent for the nation. The overall trend in state
and local spending, though, has more of a substitution effect. For every percent
increase in federal grants-in-aid, state and local spending increases by .22 percent
(see Appendix).
Intergovernmental payments from the state to local governments constitute
an important part of local revenues. These payments to local governments are

38
typically for fiscal aid purposes and either originate from shared taxes or grants-
in-aid for specific use. The distribution of revenues is allocated to local
governments either on an origin basis or on an allocation aid program. The
distribution of revenues according to the actual amount collected in each area is,
by design, inequitable. When grants-in-aid are distributed on the basis of need,
some consideration is given to an area's ability to support a particular function.
These payments represent an attempt to equalize government cost and
opportunities. Because the distribution of these funds measures only relative needs
and not absolute needs there are many inequities in the allocation formula.
Variations in revenue sharing to individual local governments in Louisiana
have contributed to many inequities in financing capital improvement projects.
The overall inequitability of distributions per capita has tended to favor wealthier
parishes (counties) owing to the royalty fund distributions. Despite this fact, state
aid to local governments alone constitutes nearly 36 percent of their revenue. In
most cases, municipalities have only limited taxing authority. State law has
severely curtailed the extent to which revenues are derived from the use of
property taxes. Combined, this has made municipal and local financing very
precarious. Because of federal budget cutbacks, municipalities and localities are
anticipated to receive less federal aid in the future. Yet service charges and other
taxes, such as licenses and fees, are potential sources of raising additional revenues
to cope with this problem. Both of these sources possess fewer constitutional and
statutory restrictions. Another possibility would be the greater utilization of the
ad valorem tax as a source of revenues to fund greater capital expenditures.
Louisiana local governments received only 17.4 percent of total revenues from
property taxes in 1980 compared to 26.4 percent for all local governments.
Severance taxes in their peak period averaged 18.2 percent of all revenue for
Louisiana. By 1979-80, this percentage declined to 11 percent. The problem is

39
that while Louisiana possesses a great potential for economic development owing
to its abundant supply of natural resources, land availability, warm climate, and
established support facilities, economic growth has been concentrated in primarily
two industries-chemicals and petroleum refining. As a consequence tax revenues
have been heavily dependent on these resources. It is estimated that a $1 change
in the world price of oil produces a $30 million change in revenues received from
severance taxes and royalty collections.
2.4 Bond Financing
State and local capital expenditures have depended heavily on the degree to
which these improvements are financed from current revenues as distinguished
from the anticipation of future revenues from incurring debt. Recent budgets
indicate that bond-funded projects have been growing in importance. As such,
many capital appropriations have not been funded due to unfavorable interest
rates. Moreover, increased reliance on debt financing is not without certain costs.
That is, more state and local construction can be obtained only at the expense of
less other capital goods or a temporary decline in consumption. Depending on one's
view of the current subsidy tax-exemption gives to state and local borrowing,
erosion of the subsidy when tax-exempt interest rates rise relative to taxable
securities may not be appropriate.
Historically, the ratio of the rates between long-term taxables and tax-
exempt bonds of comparable credit quality has been approximately 70 to 75
percent. Recently, this spread has increased to greater than 80 percent in late
1981 to 1982 period. This has a significant impact on unfunded capital expendi-
tures. Recent studies have shown that a large build-up of unfunded capital projects
exists among all states and local governments.7 The upshot is a large pent-up
demand for funds which should keep tax-exempt interest rates high relative to

40
rates on taxable securities. A similar problem arises from the use of short-term
tax anticipation notes which have flooded the market in the last couple of years.
Converting these notes into long-term debt may further place upward pressures on
long-term costs of debt capital. Thus faced with financing greater levels of capital
expenditures, states are severely constrained by the existing tax-exempt market.
For Louisiana, total authorized but unissued general obligation debt currently
equals $1.5 billion. Approximately 60 percent of these unfunded capital require-
ments represent projects slated for highway and bridge construction, 13 percent
are for education, and the remainder are for health and hospitals and other
purposc'. %ending needs for unfunded capital requirements alone would equal
$150 million during the next ten years if no new funding were authorized. This
raises serious questions as to the state's capacity to pay for these improvements.
Federal budget deficits are likely to have a substantial impact on the future
of bond financing. During the next five years, federal outlays are projected to
increase from $740 billion in 1982 to $1.1 trillion in 1987.8 On the other hand,
revenues are projected to grow less than outlays, increasing from $631 billion in
1982 to $882 billion in 1987. Thus federal budget deficits are anticipated to
increase from $109 billion in 1982, to $188 billion in 1984 and $248 billion in 1987.
Budget strategies to reduce the size of these deficits include further reductions in
the growth of federal spending, significant tax increases, or further reductions in
grants to state and local governments or realignment of federal, state, and local
responsibilities. In the absence of these alternatives, net interest costs to the
federal government are projected approximately to double. These funding require-
ments will more than likely keep interest rates high and continue to cause the
interest costs to state and local governments to be high. -Further reducing grants
to state and local governments should aggravate matters by increasing the
perceived riskiness of state and local bonds and driving up tax-exempt interest
rates relative to taxable securities.

41
2.5 Capital Budgeting Process
One of the major unresolved issues with respect to state and local govern-
ment budgeting in Louisiana has been to determine the merits of a long-term
capital operating program. According to a recent study, while the criteria used for
capital budgeting work extremely well for determining necessary needs for
Louisiana's highways, nonhighway capital expenditures have been subject to less
successful budgeting techniques.9 The criteria for determining highway projects
requires an objective evaluation of the condition of highways and bridges. Deter-
mination of highway needs is made annually for the state maintained system and as
required for all other roads. This periodic assessment of highway needs determines
the priority of highway projects. The requests, after public hearings have been
conducted, are included in the capital budget bill as a lump-sum appropriation. The
Legislature is prohibited by law from adding or substituting projects in the highway
program and may only delete projects from the amount requested.
Nonhighway capital outlays are adopted by the Legislature in a comprehen-
sive state capital budget plan. The capital budget plan includes projects requested
for the current fiscal year plus projects phased-in over a five-year planning
horizon. These projects originate from the various state and local agencies.
Amounts requested for the projects and recommendations for the first year and
years 2-5 are detailed. A lack of emphasis on the scheduling of long-term projects
to be considered subsequently in future years causes most of the budget request to
be planned for the first year.
2.6 Investment Needs, Revenues and Priorities
Estimating capital investment needs for public infrastructure presupposes
certain assumptions. The problem of such a normative analysis of the public sector

42
necessarily begins with a statement of an appropriate role of public investment. If
it is assumed that there are no constraints on state and local government
responses, then investment decisions are closely related to competitive market
principles and the government should provide those types and quantities of goods
and services that a competitive market would have done if the market would have
acted.10 However, if constraints on government policy responses are recognized,
then investment decisions tend not to conform with competitive market conditions
and are subject to political debate. 1 Under these conditions, government
responses to investment needs depend on the perceived adequacy of existing
facilities, anticipated changes in demand for goods and services, warranted
improvements in the quality of services, and revenue constraints. The importance
of setting priorities for public infrastructure investment is that it is frequently
complementary tozprivate investment and thus stimulates capital formation.
In older areas of the nation, the absence of maintenance of highways, bridges,
and water distribution systems has been credited as creating a significant barrier
to urban economic development. The decline of the central cities and the loss of
industry and commerce have been accelerated by the decline in the quality of
transportation, inter-regional migration, availability of raw materials, availability
and cost of energy, urban environmental and sociological problems, and water and
waste treatment facilities. 12 Of major importance have been the quality and the
cost of maintaining the highway system in terms of attracting new industry.
Nearly half of all industrial firms are market-oriented, and approximately 15
percent serve local markets.1 3 The increasing importance of light industry, and
the growing orientation toward local markets makes the access to highways and
contract trucking essential in industrial site location.1 4
For Louisiana, the major infrastructure factors affecting operation as rated
by industry groups and ranked according to significant advantages and

43
disadvantages are listed in Table 11. According to the survey, the road system
ranked as the significant disadvantage to locating in Louisiana by most
industries. 15 Important in this consideration is the distinction among the.various
different types of gaps in the highway system and the effect on particular
industries. All other factors seem to be less of a negative determinant in the site
location selection and more of a positive factor promoting economic development.
Water for industrial use and water for transportation ranked the highest among all
factors affecting industry operations.
While highways have been given top priority in the governor's budget message
in recent years, the direct economic effects of a commitment to upgrade and
expand all public infrastructure investments should have substantial multiplier
effects on income and employment in Louisiana. But since public capital
investment competes with private investment, there may be adverse allocational
effects in the long-run. Some economists have argued that public investment is
inherently less efficient than private investment.1 6 That is, public investment may
have been overexpanded at the expense of private investment. If this is the case,
then instead of correcting private market failures, expanding public investment
further causes a misallocation of resources. Because capital is not malleable,
mistakes are not easily corrected and costs are not easily recovered. Public
disinvestment in recent years may then be a natural consequence of excess
capacity built up over the years because of overexpansion.
On the other hand, greater public capital investment should be encouraged if
public investment leads to an equal increase in private investment.17
Alternatively, if public needs are defined consistent with private sector demands,
then economic efficiency is enhanced and further public investment is warranted.
Thus public infrastructure investment may or may not have been overexpanded.
Abandonment of old public infrastructure may be a less than optimal policy
response depending on which view is correct.

TABLE 11
Infrastructure Factors Affecting OperationsRated by Industry Group
StoneClay
Rank Factor Average Rating Lumber and Fabricated IransportationRank- Factor all Respondents Food Apparel andWood Paper Chemicals Glass Metals Machinery Equipment
Significant Disadvantages:
7 Road System .71 .92 .79 .41 .80 .72 .67 .79 .56 .50
No Significant Difference:
14 Airport Facilities .91 .91 1.13 .91 .93 .81 1.00 .94 .83 1.1315 Trucking .94 1.15 .77 .87 1.22 .93 1.00 .90 .78 1.0016 Railroad Transportation .97 1.16 .80 1.13 1.00 1.01 .88 .88 .83 1.0023 Transportation Costs 1.06 1.08 .73 .94 1.17 1.35 1.13 1.05 1.00 1.25
Significant Advantages:
42 Water for Industrial Use 1.47 1.28 2.00 1.40 1.29 1.60 1.25 1.37 1.25 1.5043 Water Transportation 1.62 1.74 1.50 1.08 1.27 1.88 1.38 1.56 1.44 1.78
aRanked in order of overall importance:LEGEND: .00- .85 Significant disadvantage
.86-1.14 No significant difference1.15-2.00 Significant advantage
Source: Public Affairs Research Council of Louisiana, Survey of Manufacturers, 1975.

45
III. TRANSPORTATION
Louisiana transportation needs are predicated on geographic location and
topographic features. Rapid growth of traffic movement resulting from population
change, increased urbanization and suburbanization, and the growth of rail trans-
portation and port facility development presents a major challenge for the state.
Each of these transportation modes is inextricably linked to attracting industry and
benefiting individual people. The extent of the involvement of the state in
maintaining these critical transportation linkages includes the funding of several
major interstate highway projects, the construction of the Greater New Orleans
Bridge, and a commitment to support rail rehabilitation, an extensive mass transit
system and small public airports located throughout the state. Thus while other
areas of the nation have been able to devote a larger percentage of their capital
outlays to other infrastructure facilities in recent years, Louisiana represents an
example where most of capital outlay expenditures are spent on the development
and maintenance of highways and bridges.
3.1 Highways
During much of the 40-year period when the nation's present highway
facilities were being built,-construction of a statewide highway system in Louisiana
was delayed. The problem of highway adequacy and massive changes in highway
use patterns occurred somewhat later in Louisiana than many of the more
industrialized areas of the country. Traffic bottlenecks and stress caused by
population changes did not burgeon until the 1950s. Most of the construction that
did take place prior to 1950 involved the improvement of roads of lesser use and
importance.18 As a result, the state maintained highway system is relatively
newer than most highway systems and contains many more gaps. A total of 227
miles of interstate are yet to be completed.

46
In 1981, there were 56,676 miles of public roads, streets, and highways in
Louisiana. Of this total, the state maintained highway system consisted of 16,389
miles of roadway (30 percent of total miles of public roadway). Control of the
remaining 40,287 miles (70 percent of the entire system) is the responsibility of
local governments. All highways, streets, and public roads are grouped into classes
according to the character of service they are intended to provide (see Table 12).
Rural highways are principal arterials, minor arterials, collector and local roads
located outside of small urban (urban places having a population to 5,000 to 49,999
and not within any urbanized area) and urbanized area boundaries. These roads
provide direct service for longer trips among larger cities and towns, and serve
small towns plus individual farms and other rural areas. Urban highways are
principal arterials, minor arterials, collector and local streets located inside of
urban boundaries. This system serves the major cities, carries a high volume of
travel on a minimum amount of miles, and is integrated with the rural system.
Collectively, the highway system supports 18.9 billion vehicle miles of traffic
per year. Total registered vehicles have been growing at over 4 percent per year
during the past decade. There are a total of 49 vehicles registered for every mile
of roadway, up from 30 vehicles registered per mile in 1970. This can be compared
to the U.S. average of 74 vehicles registered per mile. Most of the traffic flow on
the state maintained highway system is on rural roads (see Table 13).
Within the state highway system, there are 11,748 miles of public roads which
are eligible for the federal participation program in construction or reconstruction
(Federal-Aid Highway System). The remaining 4,645 miles of state highway are not
included in the Federal-Aid Highway System and are ineligible for federal
assistance. Maintenance of the entire system is the responsibility of the state.
Trends in the amounts spent on construction and maintenance of the state highway
system are given in Table 14.

47
TABLE 12Louisiana Total Road and Street Mileage
Rural: Miles
Under State Control 15,192Under Local Control
Parish (County) Roads 28,722Other Local 2,256 31,978
Under Federal Control 537Total 46,7 07
Urban:
Under State Control 1,197Under Local Control
Parish (County) Roads 1,996Other Local 6,776 8,772
Under Federal Control _
Total 9,969
Total Rural and Urban Roads 56,676
Source: Highway Statistics, 1981.
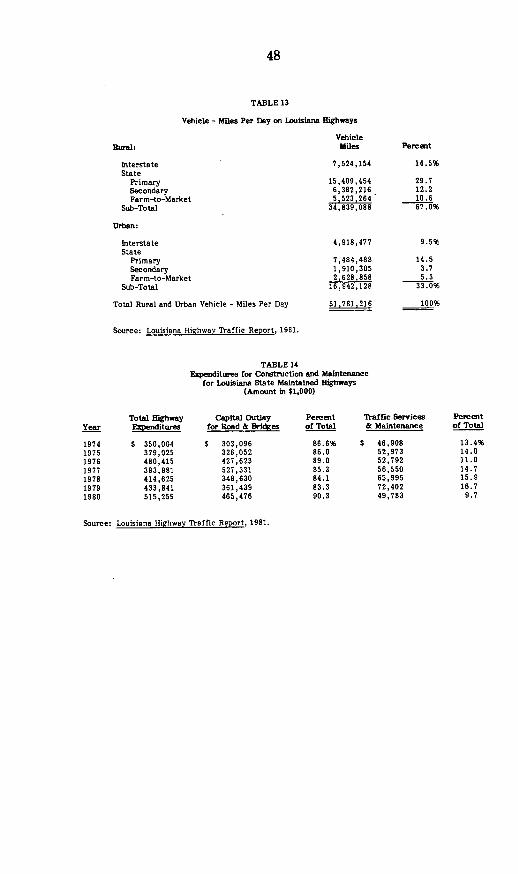
48
TABLE 13
Vehicle - Miles Per Day on Louisiana Highways
VehicleRural: Miles
Interstate 7,524,154State
Primary 15,409,454Secondary 6,382,216Farm-to-Market 5,523,264
Sub-Total 34,839,088
Urban:
InterstateState
PrimarySecondaryFarm-to-Market
Sub-Total
Total Rural and Urban Vehicle - Miles Per Day
4,918,477
7,484,4881 910,3052,628,858
16,942,128
51 ,781 ,216
Source: Louisiana Highwav Traffic Report, 1981.
TABLE 14Expenditures for Construction and Maintenance
for Louisiana State Maintained Highways(Amount in $1,000)
Total HighwayExpenditures
$ 350,004379,025480,415383,881414,625433, 841515,259
Capital Outlayfor Road & Bridges
$ 303,096326,052427,6 23527, 331348, 630361,439465,476
Percentof Total
86.6%86.089.085.384.183.390.3
Traffic Services& Maintenance
$ 46,90852,97352,79256,55065,99572,40249,783
Source: Louisiana Highway Traffic Report, 1981.
Percent
14.5%
29.712.210.667.0%
9.5%
14.53.75.3
33.0%
100%
Year
1974197519761977197819791980
Percentof Total
13.4%14.011.014.715.916.7
9.7

49
The capital and operating costs figures in Table 14 reflect the emphasis on
construction in recent years. During this period, total capital outlays for roads and
bridges averaged 86.4 percent of total highway expenditures. The relatively small
fraction devoted to maintenance (13.6 percent) contrasts markedly with other
areas of the nation. A large proportion of this bias can be attributed to long-range
projects currently in the highway construction program which are necessary to
complete the state highway system, and to the fact that the interstate highways
were built more recently and to higher standards and require less maintenance.
Investment Needs
Highway needs in Louisiana are based on a functional classification of the
highway system consistent with the standard way highways are evaluated in all
states.1 9 The assessment consists of applying a needs appraisal approach to
determine broad categories of deficiencies. These categories include quantifying
traffic capacity, alignment, width, and structural and drainage conditions. The
basic approach defines minimum tolerable conditions that are somewhat below the
standards for new construction. The design standards are established for each
functional class of highway and by traffic volume. Study sections are identified
and the character and degree of deficiencies are determined. The study section is
then appraised to see if it meets the criteria of tolerability. If it does not, then it
is classified as a deficiency and estimates of improvements needed to overcome
the deficiencies are made. If it does meet certain standards, then it is also
appraised for its ability to meet tolerability conditions under future use. Failing to
meet these projected tolerability conditions, the study section is categorized as a
future deficiency.
31-880 0 - 84 - 5

50
According to the definition of highway needs, "example of conditions which
place a highway in the critical deficiency class include:
1. Peak hour traffic volumes resulting in operating speeds lower orvolume/capacity ratios higher than the minimum tolerable conditions.
2. Lane widths narrower than the minimum tolerable width specified.
3. Curves, grades, and sight distance restrictions not meeting the minimumtolerable conditions which result in unsafe conditions.
4. Pavement conditions below the minimum tolerable specified.
5. Pavement type below the minimum tolerable specified."2 0
The results of the 1983 highway needs assessment indicate that 2,792 miles of
the state maintained highway system (17 percent of the total miles of roadway
under the state system) are deficient and in need of improvement today.2 1 Of this
total, there are 1,906 miles of highway in need of resurfacing. The remaining 886
miles identified in the now need category require some type of construction,
reconstruction, or related improvement. That is, 68 percent of the miles which are
deficient need to be resurfaced while 32 percent of the deficient miles need some
type of construction.
In addition to these improvements, there are currently three major large
scale projects which have been initiated and require substantial funding. These
projects include the completion of the north-south expressway (Interstate 49), the
Westbank Expressway (US 90 Business - Jefferson Parish), and the relocation of US
90 (Terrebonne, Assumption and St. Mary Parishes). Also yet to be completed are
interstate sections of I-220 in Shreveport, 1-310 in St. Charles Parish and I-510 east
of New Orleans. Besides these projects, there are five projects which are currently
in design or included in a feasibility study to construct central business district by-
passes. Furthermore, there are 22 safety projects either under consideration or in

51
the initial construction process. These projects include the construction of turn
lanes, intersection reconstruction and curve realignment.
The estimated cost in current 1983 dollars to implement the needed roadway
improvements on the 2,792 miles of highway deficient is given in Table 15. This
figure does not include the cost to complete the interstate system nor improve-
ments to deficient structures. It is estimated that in order to complete the gaps in
the interstate highway system it will cost $1.54 billion. Improvements to 2,260
structures on the state highway system that are in need of replacement and
rehabilitation are expected to cost $600 million.
Future deficiencies have been estimated for the period 1983 to 2000. Based
on the recommended year of improvement, the remaining miles of roadway not
classified in the now need category are slated for repair, reconstruction or
resurfacing by 2000. That is, the remaining 83 percent of the state maintained
highway system will be in need of improvement by 2000. Approximately 21 percent
of total miles of roadway will become deficient by 1986, 18 percent by 1991, 12
percent by 1996, and 32 percent by 2001. This is consistent with an average design
life of 20 years. Total cost in 1983 dollars necessary to correct these deficiencies
is estimated to equal $3.35 billion assuming no change in current highway
construction. Included in this estimate is the cost of improving pavement condition
plus all other deficiencies.
Changes in interim financing of highway construction could significantly alter
these circumstances. Cutbacks in annual maintenance and operating expenses
eventually could lead to greater deterioration of road surfaces and to an increase
in future rehabilitation and reconstruction needs. On average, normal maintenance
and operating expenses should equal
(1/8) x 16,389 mi x $130,000 = $266 million
where the average surface life is assumed to be approximately 8 years; 16,389
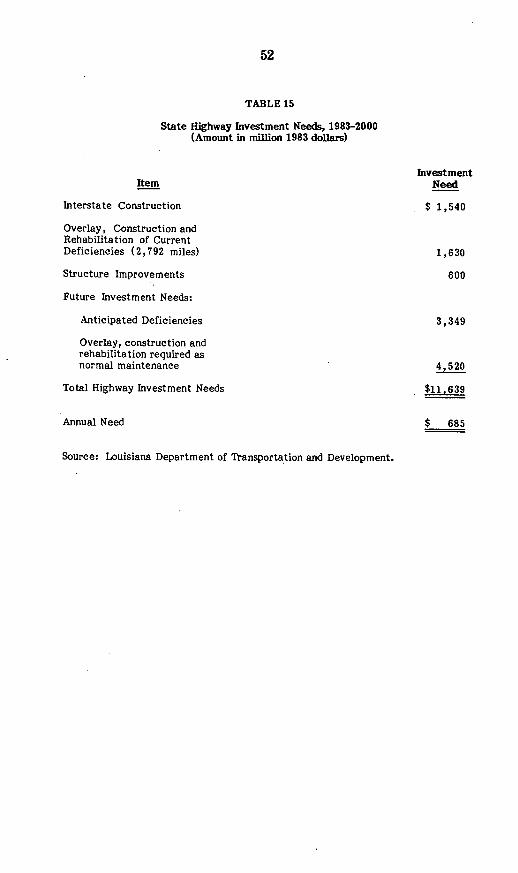
52
TABLE 15
State Highway Investment Needs, 1983-2000(Amount in million 1983 dollars)
InvestmentItem Need
Interstate Construction $ 1,540
Overlay, Construction andRehabilitation of CurrentDeficiencies (2,792 miles) 1,630
Structure Improvements 600
Future Investment Needs:
Anticipated Deficiencies 3,349
Overlay, construction andrehabilitation required asnormal maintenance 4,520
Total Highway Investment Needs $11i639
Annual Need $ 685
Source: Louisiana Department of Transportation and Development.

53
represents the total mileage on the state-maintained highway system; and $130,000
is the average cost in 1983 dollars of overlay per mile. 2 2
Maintaining this level of spending means that normal maintenance and
operating repairs should equal $4.52 billion over the next two decades. Thus total
highway investment needs equal $11.64 billion for the period 1983 to 2000. This is
equivalent to an annual investment need of $685 million. Uncertainties regarding
the dynamics of highway obsolescence and changing traffic patterns may severely
underestimate this figure.
Revenues
Revenues for the reconstruction, resurfacing, restoration and rehabilitation,
and the completion and preservation of the interstate system come from a variety
of sources. The major sources of funds include federal aid, State General Fund
reserves, and capital outlay bonds. No dedication or earmarking of revenues exists.
The General Fund is the source of funding for all management, maintenance and
highway construction. While critics claim that earmarking of tax revenues
severely imposes constraints on the budgetary process, it does link the tax (cost)
and the expenditure (benefit) sides of the budget.23 Dedication or earmarking-
however imperfect-relates the budget determination in the public sector to price
formation in the market place for private goods and services.
Examination of revenues collected from the gasoline tax which are deposited
into the General Fund and then appropriated to meet the demand for all public
goods and services expected by the citizenry reveals that funds have probably been
allocated efficiently between the development of highways and other needs despite
the fact that taxes are not earmarked. Figure 5 plots gasoline tax collections
during the period 1974 to 1980 versus state expenditures on highways excluding
federal aid and bond financing. Although a cursory analysis of the gap in Figure 5

54
FIGURE 5
Sources of Revenues Versus Expenditures on Highways in Louisiana
120 -0
o 100-
0
a 80-E
Years
Source: Louisiana State-Local Fiscal Study Report, and Capital Budgets.

55
indicates the possibility that funds may have been diverted to other needs at the
expense of the development of the highway system, adjusting this difference for
state aid to localities for the improvement of roads (Parish Road Fund) and the
payment of principal and interest on highway debt outstanding yields a negligible
distortion. Thus if deficiencies exist in the method highways are financed, then it
is because highway expenditures and revenues have different income elasticities.
Estimates of anticipated revenues in 1983 dollars available to meet the
demands for highway construction are given in Table 16. The revenue projections
are taken from forecasts developed from an extension of the forecasting model
used by the Louisiana Fiscal Office and extrapolated for 1987-88.24 Sources of
federal funding are based on anticipated funding levels projected by the Louisiana
Department of Transportation and Development. According to these estimates,
Louisiana is anticipated to receive approximately $308 million in federal grants-in-
aid for proposed interstate construction (including 4R) and other federal programs
(Federal Apportionment Primary, Federal Apportionment Secondary, etc.). Owing
to recent federal policy/program changes, this represents an increase of approxi-
mately 25 percent in federal funds. Furthermore, federal grants-in-aid are
expected to increase by 3.69 percent during the next 3 years and are assumed to
continue to increase at this same rate till 1987-88.
State matching money was determined according to the category of Federal
Highway Program applicable (Interstate-Federal 90%:State 10%; Primary and
Secondary-Federal 75%:State 25%; etc.). Cash apportioned to highways from the
General Fund is assumed to remain constant in proportion to total tax revenues.
Capital outlay bond funding includes only those priority bonds anticipated to be
issued in the current fiscal year. Future capital outlay bond funding is assumed to
increase with the increase in estimated tax revenues.
Table 16 indicates that during the period 1983 to 1988 revenues available for
highway improvements should average $658.1 million per year assuming current

56
TABLE 16
Sources of Funding for State HighwaysRevenue Projections with Low Inflation
(Amount in millions of 1983 dollars)
1983-84 1984-85 1985-86 1986-87 1987-88 Average
Total Revenue $ 4,244.5 $ 4,515.2 $ 4,774.2 $ 5,062.4 $ 5,366.1 $ 4,792.5
Growth Hate - 6.4 5.7 6.0 6.0 6.0
Sources of Funds:Federal Aid $ 307.9 $ 319.3 $ 330.5 $ 342.7 $ 355.3 $ 331.1
State Funds 46.7 49.7 52.5 55.7 59.0 52.7
State Match 65.0 67.4 69.8 72.3 75.0 69.9
Capital Bonds 181.0 192.5 203.6 215.9 228.8 204.4
Total $ 600.6 $ 628.9 $ 656.4 $ 686.6 $ 718.1 $ 658.1
Source: William G. Black, "Louisiana Revenues and Expenditures: The NextFive Years,' Louisiana Business Review, Winter 1982, andLouisiana Department of Transportation and Development.

57
funding patterns. If additional funds should become available, then this figure
could conceivably be even higher. On the other hand, in the absence of windfall
profits from severance tax collections these resources are more likely to be further
cut.
Needs versus Revenues
State highway needs and revenues are summarized in Table 17. Revenues fall
short of highway spending by $26.5 million per year. Thus to bring the Louisiana
highway system up to standards determined by the Louisiana Department of
Transportation and Development it would require an additional $451.3 million
dollars over the next two decades. This means that in order to keep up with the
deterioration of the highway system, spending from the General Fund (non-match
state funds) should average approximately $80 to $100 million per year.
Contrasted to the current funding level of $46.7 million proposed for fiscal year
1983-84, this means that either additional revenue or greater financing capacity is
needed.
3.2 Bridges
Bridge maintenance and rehabilitation constitute an integral part of the state
highway system. This need has expanded immensely in recent years. Changing
traffic patterns over the last quarter century have contributed greatly to the
deterioration of bridges in Louisiana. The continual stress from increased truck
traffic, increases in maximum legal weights and greater speeds have caused many
bridges to become functionally obsolete. Permitting even heavier loads in the
future poses even more serious safety problems.
A survey by the Department of Transportation and Development estimates
the total number of bridges in Louisiana to be 15,339.25 Of this total, there are

58
TABLE 17
Capital Investment Needs and Revenuesfor State Bigbway System, 1983-2000(Amount in millions of 1983 dollars)
AnnualNeeds Revenues Shortfal' Additional Investment
Highways $11,639.0 $11,187.7 $451.3 $26.5

59
approximately 8,039 bridges on the state maintained highway system for which the
state has responsibility. Approximately 30 percent of these bridges do not qualify
for federal aid participation in rehabilitation and replacement. The remaining
7,300 bridges are classified as off system bridges and are the responsibility of local
governments.
Investment Needs
Since 1970, bridge replacement has been more pronounced and has signifi-
cantly improved the condition of bridges on the state maintained system. Replace-
ment and rehabilitation of these bridges are based on a sufficiency rating. Bridges
are categorized as either structurally deficient or functionally obsolete depending
on their sufficiency rating. Evaluation procedures are established by the Federal
Highway Administration.
Bridges that are classified as structurally deficient and have a sufficiency
rating less than 50 qualify for Federal Bridge Replacement Funds. Structurally
deficient bridges with a sufficiency rating between 50 and 80 may qualify for
rehabilitation funds. Functionally obsolete- bridges with a sufficiency rating less
than 50 can also qualify for Federal Bridge Replacement Funds.
Based on these proceedings, it is estimated that there are approximately
5,000 deficient bridges in Louisiana. That is, approximately 32 percent of all
bridges are deficient. Of the total number of deficient bridges, 1,060 are on-
system bridges. This is equivalent to 13 percent of the total number of bridges on
the state system. The remaining 3,940 bridges which are deficient are off-system
bridges. This is approximately 54 percent of the total number of off-system
bridges. Thus there appears to be a substantial discrepancy between the quality of
bridges on and off the state system. Part of the reason for this deals with the
recentness with which off-system bridges have been evaluated and were able to
qualify for federal funds.

60
The estimated cost in 1983 dollars to replace deficient bridges in Louisiana is
given in Table 18. On-system deficient bridges are estimated to require $340
million, while replacement of off-system deficient bridges will require $215
million. Combined, the total cost to replace all bridges in Louisiana with a
sufficiency rating of less than 50 with structures which meet current standards is
estimated to be $555 million. Assuming a ten year programming phase, annual
investment needs are $55 million.
Revenues
Revenues for the rehabilitation and replacement of bridges in Louisiana
depend heavily on the Federal Bridge Replacement Fund. Under the federal-aid
system, 65 percent of the total funds received are eligible for maintenance and
replacement of on-system bridges, 15 percent must be allocated to off-system
bridges and the remaining 20 percent is discretionary. These funds are prorated to
states, based on the number and location of all deficient bridges in the United
States. Thus as more bridges are repaired in Louisiana, the share of federal funds
should decrease in relative terms.
The Louisiana Department of Transportation and Development has estimated
that about $40.7 million in 1983 dollars will be available annually from the Federal
Bridge Replacement Fund over the next couple of years. State and local match
required is $10.2 million per year. While estimates of revenues at the local
government level to replace bridges not on the federal-aid system are not
available, the state appropriated $20 million in 1981-82 for this purpose to be used
by local governments. Given the delay in planning and engineering, these funds
have not yet been spent. Thus total revenues available for bridge replacement
equal $529 million for the next ten years.

61
TABLE 18
Bridge Replacement investment Needs(Amounts in millions of 1983 dollars)
AnnualonSystem OffSystem Total Need
Bridge Investment Needs $340 $215 $555 $ 55
Source: Louisiana Department of Transportation and Development.

62
Needs versus Revenues
A summary of investment needs and revenues for bridge replacement is given
in Table 19. Over the next ten years, annual investment needs exceed anticipated
revenues by $2.6 million per year. That is, the total shortfall is $26 million.
Extending this to the period 1993 to 2000, the total shortfall in revenues is $44
million. The nature of this should be viewed with uncertainty since estimates of
local revenues available for bridge replacement are unavailable.2 6
3.3 Parish (County) and local Roads
Maintenance-and rehabilitation of parish and local roads in Louisiana is solely
the responsibility of local government. Recent trends in the expenditures of these
governmental units can be seen in Table 20. Changes in the relative degree of
funding for each expenditure item is reflected in the percentage data. For parish
and local roads, expenditures in 1975 accounted for 13.6 percent of total
expenditures. By 1980, highway expenditures fell to 12.2 percent of total
expenditures.
The composition of local highway expenditures is given in Table 21. In
contrast to state expenditures, local capital construction constitutes a much
smaller portion of total highway expenditures. Essentially, local governments have
resorted primarily to rehabilitation programs rather than taking on costly new
construction projects in order to check highway obsolescence. These programs
have been necessitated by increasing population mobility in recent years.
State aid to localities for highways is depicted in Table 22. The data suggest
that aid to parishes and municipalities for highways has more than kept pace with
inflation over the last several years. These figures when deflated by the Bureau of
Economic Affairs price index for state and local structures show a real growth in
state aid for highways of 7.2 percent. The formula for distributing these

63
Table 19
Capital Investment Needs and Revenuesfor Bridge Replacement, 1983-1993(Amount in millions of 1983 dollars)
AnnualNeeds Revenues Shortfall Additional Investment
Bridges $555 $529 $26 $2.6

TABLE 20
Trends in Expenditures of Louisiana Local Governments(Amounts in MilUons and Percentage Distribution)
Total General and Health andYear Expenditures Administrative Police Fire Sanitation Highways Recreation Other
1975 $1167.9 $200.3 $120.6 $53.0 $ 39.5 $158.8 $53.9 $341.81976 1372.2 217.6 146.2 53.3 370.2 172.0 65.3 347.71977 1391.4 252.6 154.0 58.2 330.9 175.4 116.9 313.51978 1600.2 313.6 163.8 60.7 398.9 189.5 122.6 351.11979 1876.3 360.0 188.6 70.5 492.4 228.4 128.1 408.31980 2175.1 407.8 227.9 81.9 596.1 265.6 143.0 452.8
Percentage Distribution
1975 100.0% 17.15% 10.33% 4.54% 21.51% 13.59% 4.62% 29.25%1976 100.0 15.86 10.65 3.88 26.98 12.53 4.76 25.371977 100.0 18.15 11.07 4.18 23.78 12.61 8.40 21.811978 100.0 19.6 10.24 3.79 24.93 11.84 7.66 21.941979 100.0 19.19 10.05 3.76 26.24 12.17 6.83 21.761980 100.0 18.75 10.48 3.77 27.41 12.21 6.57 21.81
Source: Governmental Finances

65
TABLE 21
Expenditures for Capital Outlays and Maintenance on Local Roadsbv Louisiana Local Governments(Amount in Millions of Dollars)
Total HighwayYear Evpenditures capital
197519761977197819791980
$158.8172.0175.4189.5228.4265.6
S65.764.865.664.494.0
110.0
Percent Operating andof Total Maintenance
41.4% $ 93.137.7 107.237.4 109.834.0 125.141.2 134.441.4 155.6
Source: Governmental Finances.
TABLE 22
State Aid Distribution to Parishes (Counties)and Murncipalities for Highways(Amount in Millions of Dollars)
Total State Aid State Aid Percent of State AidYear for Local fihways to Parishes TOt to Municipalities
1974197519761977197819791980
$ 58.570.155.458.685.591.885.9
$39.847.632.4131.356.254.553.4
68.0%67.958.553.465.759.462.2
$ 18.722.523.027.329.337.332.5
Source: Louisiana State-Local Fiscal Study Report.
31-880 0 - 84 - 6
Percentof Total
58.6%62.362.666.058.858.6
Percent ofTotal
3 2.0%32.141.546.634.340.637.8
I

66
funds, though, is biased in favor of smaller parishes. 27 Smaller parishes are given
more on a per capita basis than larger parishes owing to a certain percent
distributed independent of population considerations.
Investment Needs
No data exist on the construction and maintenance of the portion of the
highway system under the responsibility of local political jurisdictions. However, it
is felt that maintenance and rehabilitation of parish and local roads is a major
recurring problem.28 High motorist fatalities, rising traffic volumes, and terrain
and soil conditions have placed increasing demands upon the road system.
As an approximation, resurfacing and reconstruction costs can be estimated
by making some heroic assumptions. If it is assumed how often highways must be
resurfaced or reconstructed and the cost per mile, then depending on the standards
used, investment needs can be determined. While these standards and costs may
vary by type of road and by region, the approximation is intended to serve as an
unconstrained (by political or fiscal considerations) quantitative assessment of
local needs.
Minimum tolerable conditions for urban and rural roads imply an average
design life of 8 to 10 years for most bituminous surface treated roads in
Louisiana.?9 This figure may vary depending on operating speed, vehicle capacity,
lane width, number of lanes, and combined surface and base thickness. The useful
life may also vary by terrain and different soil types in various regions of the state.
Cost of the needed resurfacing depends on the functional class of road to be
improved, type of improvement, design standard, and location of project by cost
area. It is estimated that the cost of asphalt hot-mix 11 to 2 inches thick used to
overlay streets is $79,200 per mile. Thus total investment need in 1983
67
dollars for resurfacing and reconstruction of local streets per year is
(1/8) x 40,287 mi x $79,200 = $399 million.
If this uniform annual investment of $399 million is assumed constant, then total
investment needs for resurfacing local streets will be $6.78 billion for the period
1983 to 2000.
Revenues
Estimates of total revenues in 1983 dollars available for local governments
during the next five years are given in Table 23. These projections are based on
the assumption that local govenment revenues are expected to experience similar
increases as state revenues. This is likely to overstate available revenues as local
governments are constrained primarily to ad valorem taxes. Requirements for
local match, the potential for increasing revenues and the offset needed to
compensate for anticipated cutbacks in intergovernmental grants-in-aid add
further uncertainties to these estimates.
Assuming funds available for local streets and roads remain constant relative
to total revenues, then revenues available for local streets and roads should
average $337.6 million annually for the period 1983 to 1988. This is equivalent to
$5.74 billion over the period 1983 to 2000.
Needs versus Revenues
Table 24 summarizes local street and road needs and revenues. Total
revenues fall short of total investment needs by $1,040 million for the period 1983
to 2000 or by $61.4 million per year. Limits on taxing authority and differences in
income elasticities of road expenditures and revenues is the perennial problem
which explains this shortfall. Service charges and other taxes such as licenses and
fees are potential remedies. An increased reliance on property taxes could also be
a source of funding.

68
TABLE 23
Sources of Funding for Local Roads(Amounts in millions of 1983 dollars)
5-Year1983-84 1984-85 1985-86 1986-87 1987-88 Avenge
Total Revenues $2,392.6 $2,545.7 $2,690.8 $2,852.3 $3,023.4 $2,701.0
Growth Rate(%) - 6.4 5.7 6.0 6.0 6.0
Local Street andRoad Funding $299.1 $318.2 $336.4 $356.5 $377.9 $337.6
Source: William G. Black, "Louisiana Revenues and Expenditures: The Next FiveYears, " Louisiana Business Review, Winter 1982.
TABLE 24
Investment Needs and Revenues forLocal Streets and Roads, 1983-2000(Amount in million of 1983 dollars)
Needs
Local Streetsand Roads
AnnualRevenues Shortfall Additional Investment
$5,740 $1,040$6,780 $61.4

69
3.4 Railroads
Louisiana's rail network is uniquely associated with waterborne commerce in
the state. Table 25 identifies the eight Class I railroads and the six Class III
railroads operating in Louisiana and the type of commodity handled. The rail
system consists of 3435 miles of rail line, 92.9 percent of which is comprised of
Class I railroads which carry approximately 95 percent of an rail traffic. Rail in
Louisiana serves as a major terminus and transshipment point for waterborne
traffic.
The principle bulk commodities handled include paper, wood, chemicals and
petroleum products. Other bulk commodities which are likely to have a major
impact on the state's rail system in the future are grain and coal exports.
According to United States Department of Agriculture figures, 50 percent of all
grain is transported nationwide by rail from the farm to an export facility with the
remainder primarily transported by barge and some shipped by truck.3 0 Barge
traffic is the cheapest form of transportation for long hauls and has been
increasing its share of total grain shipped. Because of the Mississippi River barge
traffic accounts for over 75 percent of grain moving to Louisiana, and rail for less
than 25 percent. However, use of unit trains with 100 ton capacity hopper cars
with bottom discharge dumping has continued to make rail transportation relatively
cost competitive.
Coal exports, which surged in 1980, are primarily transported nationwide to
export facilities by rail, with 65 percent of annual production hauled by rail. 3 2 In
contrast, almost all coal arriving or passing through the Lower Mississippi region is
transported by barge. Barge traffic accounts for approximately 80 to 90 percent of
all coal transported to the Lower Mississippi. Yet, recent developments to allow
rail companies to enter into long-term contracts and the ability to improve new
facilities (and abandon old facilities) has helped rail companies to compete more
effectively for a share of total coal export.

70
TABLE 25
Railroad Lines Operated in Louisiana
Operating Railroads
Class I Railroad:,Atchison, Topeka and Sante FeIllinois Central GulfKansas City SouthernLouisville and NashvilleMissouri Pacific
Southern Pacific
St. Louis Southwestern
Southern
TotalClass m Railroads:
Arkansas and Louisiana MissouriLouisiana and MidlandNorth Louisiana and GulfNew Orleans and Lower CoastNew Orleans Public BeltLouisiana & North West
Total
Total AD Railroads
Miles in Percent Type ofLouisiana of Total Commodity Handled
64574790
361,195
520
38
73
3,190
396840352637
245
34 ,35
1.916.720.1
1.134.8
15.1
1.1
2.1
92.9
1 .12.01 .11.00.81.17.1
100.0
Paper & wood productsPaper, wood, food, & chemicalsChemicalsFood & chemicalsChemicals, food, wood, &petroleum products
Chemicals, food, farm, andpetroleum products
Wood, petroleum, and non-metallic minerals
Opens up the port of New Orleans
FoodWood productsWood productsPetroleum, coal, & chemicalsConnects many rail yardsPaper & concrete
Source: Louisiana State Rail Update Plan, 1981.

71
There are only three passenger rail routes in Louisiana: (1) the Cresent
providing service between New York and New Orleans, (2) the City of New Orleans
providing service between Chicago and New Orleans, and (3) the Sunset Limited
providing services between Los Angeles and New Orleans. Each of these routes are
operated by the National Rail Passenger Corporation (AMTRAK) through agree-
ments with separate rail carriers for use of existing trackage.
Although Louisiana has no direct jurisdiction over the railroad facilities or
companies operating in the state, the state provides assistance in the development
of rail planning and ensures the safety of its citizens by monitoring the movement
of commodities within the state. C
The state recommends financial assistance for selected branchline segments
designated as either post-abandonment projects or pre-abandonment projects. The
program from 1979 to 1982 has generated over $3.6 million in federal funds and
private assistance for these lines, approximately $18,000 of which constituted
funds required by the state to match these contributions. Federal funds require an
80:20 match by the railroad for rehabilitation and a similar match by the state for
program operations.
Investment Needs
An assessment of Louisiana rail facility needs by the Office of Aviation and
Public Transportation has identified certain branchline segments slated for rehabil-
itation. This report projects a total of $626,558 in needed revenues for three pre-
abandonment projects recommended for federal funding in 1981 but not yet funded.
No firm projections for additional future requests are available.

72
However, an update to this rail plan indicates that anticipated commodity
traffic patterns for the state preclude 20 rail line segments determined to be of
comparatively minor significance. These lines for the most part serve local
markets, have relatively low density, and are generally classified as functional
class A and B branchlines. Combined, these lines account for 1,152 miles of track
within Louisiana. Assuming that these lines run the risk of becoming abandoned
and eventually will be considered for assistance, then an approximation for future
investment needs can be derived.
The average cost of rehabilitating these lines is assumed to be $20,211 per
. 33 Thus total investment need in 1983 dollars for rail assistance for the
period 1983 to 2000 may be as much as
1,152 mi x $20,211 - $23.3 million.
This is equivalent to an annual investment need for railroads of $1.3 million over
the next two decades.
Since federal budget cutbacks have virtually. eliminated federal grants for the
rehabilitation of railroad branchlines, the shortfall of $23 million would have to be
made up by the state. Currently there is no mechanism whereby state funds
available can be allocated among different rail projects.
3.5 Airports
A comprehensive airport planning process serves as the foundation for the
development of a statewide air transportation system in Louisiana. This plan
encompasses over 286 landing facilities in the state, of which 65 are publicly owned
airports. Of these, seven are classified as air carrier airports which offer
scheduled passenger service. All of these air carrier airports serve the larger
population centers. The more rural areas of the state are serviced by an extensive

73
use of commuter or third level carriers. Approximately all but four parishes
(counties) have access to a publicly owned airport. Fifty-six of these facilities are
non-tower airports. Government involvement includes not only the allocation of
funds to build airports but also financing the purchase of land for airports, clear
zones, and development of adequate maintenance procedures.
Investment Needs
Capital investment needs for upgrading and maintaining the state's system of
public airports are determined according to a demand/capacity analysis.3 4 That is,
forecasted demands upon the future aviation system are assessed in terms of
whether existing facilities can adequately meet these needs. Requirements for
apron space, automobile parking, terminal building and runway capacity are
projected based on anticipated aircraft operations. Also included is an assessment
of the primary navigational aid system.
Based on this system, most of the smaller airports have been assessed as
deficient in the areas of runway length, width, and pavement strength. Electronic
navigational aids are also seriously deficient. Total public expenditures for airport
rehabilitation and construction in the past have been distributed for clear zone
problems, hangar and runway construction, lighting and navigational aids, and land
acquisition. Maintenance expenditures have traditionally been left to the local
parishes (counties) which own the facilities. User charges in the form of tie-down,
hangar, leases, and fuel flowage fees finance these expenditures.
Preliminary investment needs in 1983 dollars for the period 1983 to 2000 are
listed in Table 26. These data represent cursory capital investment needs
summarized from a preliminary draft of the Louisiana Department of Transporta-
tion and Development, Office of Aviation, airport improvement plan. Costs of
improvements include the construction and upgrading of the airport system in

74
general, new navigational equipment, and the upgrading of the length, width, and
pavement strength of runways. A total of $68 million is estimated for the
improvement of these facilities over the next two decades. Thus to improve and
expand general aviation airports it is estimated that $4 million per year should be
expended in the interim through the year 2000.
Revenues
Federal revenues available for airport investment needs provided through the
Airport Development Assistance Program (ADAP) are distributed on a 90:10
federal-to-local matching basis. Estimates of anticipated federal grants for next
year indicate a funding level of $20.4 million. 3 5 State and local funds are
estimated to equal $4.4 million. Approximately 18 percent of total state and local
revenue for airports is assumed to be local funds. Thus total revenue available for
airports is expected to equal $24.8 million for next year. No further estimates
were available for future years.
Needs versus Revenues
Airport needs and revenues are summarized in Table 27 assuming current
anticipated funding levels for fiscal year 1983-84 are realized. Total revenues
available from federal, state and local sources fall short of total investment needs
by $2.5 million per year. Sources of funding for this shortfall could be made up on
an on-going basis by an increased reliance on user fees charged at each airport
facility or through normal appropriations at the federal, state, or local level.
Given the fact that large federal deficits appear to be ominous, the possibility
exists that revenues-from federal sources for airports may be affected and possible
program changes enacted.

75
TABLE 26
Cost of Airport Facility Needs by Period(Amount in million 1983 dollars)
1983-85 1986-1990 1991-2000 Total
Airport $55.8 $5.0 $7.2 $68.0
Source: Louisiana Airport Plan Update, preliminary, 1983.
Table 27
* Capital Investment Needs and Revenuesfor Airports, 1983-2000
(Amount in millions of 1983 dollars)
AnnualNeeds Revenues Shortfall Additional Investment
$68.0 $24.8 $43.2 $2.5Airports

76
3.6 Public Transportation
Public transit programs in Louisiana include an urban transit assistance
program, a state transit subsidy, a rural transit assistance program, a special
transportation fund for the elderly and handicapped, a ridesharing program, and a
technical assistance program for the benefit of the Mississippi River Bridge
Authority and for the Regional Transit Authority-New Orleans.3 6 These services
provide assistance to cities, towns and parishes (counties) for the development of
efficient and effective rural and urban public transportation systems. Special
studies are done and technical expertise is provided to all interested persons.
Federal, state and local funds are appropriated to finance public transit operations.
There are seven major urbanized areas in Louisiana which provide public
transit services. Transit operators and the form of ownership are given in Table
28. In general, all of the systems offer fixed route services with traffic patterns
oriented toward the central city and limited crosstown services. In addition, the
St. Bernard (BUCAT) system is operated in conjunction with a demand-responsive
taxi service which provides transporation for passengers to and from a bus stop.
The New Orleans Public Service, Inc. system provides the most extensive services.
Table 29 shows the total annual patronage on these systems for 1979-and
1981. Operating results are shown in Table 30. In fiscal year 1977, total operating
deficits equalled $19.2 million. By fiscal year 1982, total operating deficits
increased to $32.4 million, an increase of 68.6 percent. Thus greater financial
support from federal, state, or local level has been necessary to ensure an adequate
level of service and to provide for an increase in patronage of 7.12 percent from
1979 to 1981.

77
TABLE 28
Public Transit System in Louisiana(Urban Areas)
System
Alexandria MunicipalBus Line
City of LafayetteTransit System
City of Lake CharlesBus System
Sportran (Shreveport)
Capitol TransportationCorporation (Baton Rouge)
New Orleans PublicService, Inc.
Kenner Loop
Westside Transit
Harvey Transit
St. Bernard Bus (BUCAT)
Ownership
Public
Public
Public
Public
Non-profitCorporation
Private UtilityCompany
Private
Private
Private
Private
Source: Louisiana Mass Transit Study, 1979.

78
TABLE 29
Total Annual Patronage for LouisianaUrban Transit Systems
1979 1981
Alexandria 804,000 1,000,000
Lafayette 2,075,000 977,000
Lake Charles 359,000 485,000
Monroe 1,099,000 1,317,000
Shreveport 4,242,000 5,681,000
Baton Rouge 3,044,000 5,479,000
New Orleans 86,430,000 88,330,000
Louisiana Transit 3,402,000 4,180,000
Westside Transit 3,167,000 3,121,000
Harvey Transit 235,000 91,000
St. Bernard 81,000 NA
Total 103,309,000 110,661,000
Source: Louisiana Mass Transit Study, preliminary 1983.
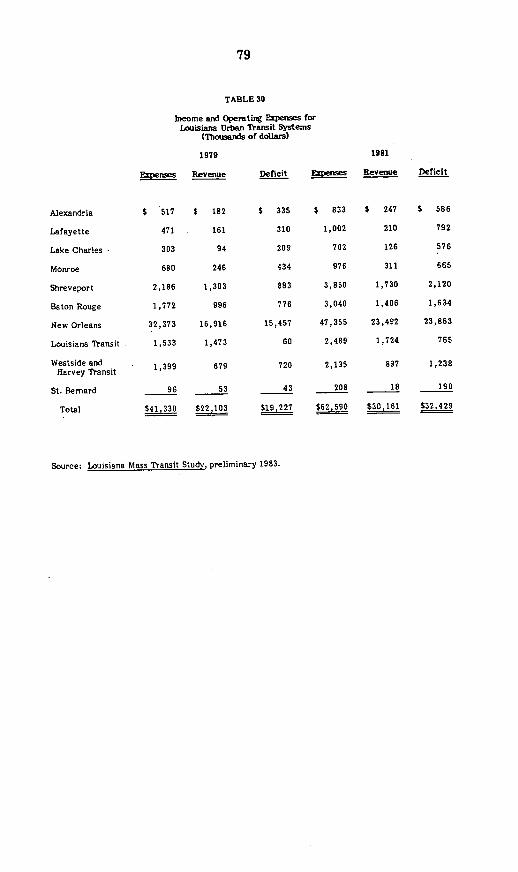
79
TABLE 30
Income and Operating Expenses forLouisiana Urban Transit Systems
(Thouands of dollars)
1979 1981
Expenses Revenue Deficit apenses Revenue Deficit
Alexandria $ 517 $ 182
Lafayette 471 161
Lake Charles 303 94
Monroe 600 246
Shreveport 2,186 1,303
Baton Rouge 1,772 996
New Orleans 32,373 16,916
Louisiana Transit 1,533 1,473
Westside and 1,399 679Harvey Transit 1,9 67
St. Bernard
Total
96 53
$41,330
$22,103
$ 335 $ 833 $ 247 $ 586
310 1,002 210 792
209 702 126 576
434 976 311 665
883 3,850 1,730 2,120
776 3,040 1,406 1,634
15,457 47,355 23,492 23,863
60 2,489 1,724 765
720 2,135 897 1,238
43 208 1i 190
19,227 $62,59 $ $32.429
Source: Louisiana Mass Transit Study, preliminary 1983.

80
Investment Needs
Preliminary estimates of public transit capital investment needs and required
operating expenses in 1983 dollars anticipated for the period 1983 to 1990 are given
in Table 31.37 These projections are based upon assumptions regarding vehicle
replacement schedules, fleet sizes, trends in operating expenses for each system,
user revenues, and an average expected inflation rate of 7 percent during this
period. Capital investment requirements include new storage, maintenance and
service facilities, terminal and administrative buildings, and new buses.
Maintenance expenses, and wages and salaries are reflected in the required
operating expenses per year.
Total operating and capital investment needs for mass transit are expected to
equal $67 million in 1983. By 1990, this total increases to $86 million, an increase
of 27.4 percent over 8 years. For the period 1983 to 1990, total net project costs
equal $597 million. This is equivalent to an average annual investment need of $75
million. Extending this to the period 1991 to 2000, total net project costs equal
$1.27 billion.
Revenues
Estimated revenues in 1983 dollars available for the financing of mass transit
investment needs are given in Table 32. These estimates are taken from a prelimi-
nary study of mass transit needs in Louisiana conducted by the Department of
Transportation and Development, Office of Aviation and Public Transportation.
Total federal assistance is projected to equal $166 million over the period 1983 to
1990. This is equivalent to an annual average funding level of $21 million. The
difference between the anticipated federal funding level and total expenditures for
mass transit that must be financ-i (net nonfederal project cost) is estimated to
equal $431 million over the period 1983 to 1990, or $54 million per year.

81
TABLE 31
Mass Transit Investment Needs for Louisiana, 1983-1990(Amount in thousands 1983 dollars)
Year
1983
1984
1985
1986
1987
1988
1989
1990
Total
Annual Need
Net Project CostOperating
$ 49,020
52,354
56,019
60,220
64,556
69,075
73,772
78,5862
$ 503,878
$ 62,L985
$ 18,329
5,804
8,092
13,447
6,615
16,309
17,339
6, 958
$ 92,893
$ 11,612
Source: Louisiana Mass Transit Study, preliminary 1983.
31-880 0 - 84 - 7
Total
$ 67,349
58,158
64,111
73,667
71,171
85,384
91,111
85, 820
$ 596.771
$ 74,596

82
TABLE 32
Revenues for Mass Transit System in Louisiana, 1983-1990(Amount in thousands 1983 dollars)
Source of Revenue
Year
19831984198519861987198819891990
Total
Annual Average
FederalAssistance
$ 19,33817,77318,17422,81217,71325,81526,30418 292
1Tfi21
NetNonfederal
Project Cost
$ 48,01340, 38545,93750,85453,45759,56964,80767,528
$430,550
$ 53,819
Source: Louisiana Mass Transit Study, preliminary 1983.
TABLE 33
Mass Transit Investment Needs Versus Revenues, 1983-1990(Amount in millions of 1983 dollars)
AnnualNeed Revenues Shortfall Additional Investment
$597 $266 $331 $41.4Mass Transit

83
Needs versus Revenues
Total mass transit investment needs and available revenues are presented in
Table 33. If it is assumed that state assistance remains constant at its anticipated
current funding level of $12.5 million per year, then total investment needs exceed
revenues by $331 million over the period 1983 to 1990. Extending this to the period
1990 to 2000, total shortfall equals $703.8 million. This shortfall constitutes the
total local requirement needed over the period 1983 to 2000 to provide for mass
transit needs.
3.7 Ports and Waterways
Louisiana's ports and river resources are vital to the state's economy. Each
year water related activities account for billions of dollars in commerce. Probably
no other industry has a greater impact on employment and income. It is estimated
that the total economic impact of water related activities amounts to more than
17 percent of the state's total gross product. 3 8
There are over 5,000 miles of navigable rivers in Louisiana- one-fifth of the
nation's total navigable miles of waterway. Because of the Mississippi River, ports
in Louisiana have become the major import-export point for nearly 21 states in the
mid-America heartland. The Intracoastal Canal, which runs west to east from the
Mexican border to Florida, plus other smaller rivers provide for shallow-draft
inland ports and attractive opportunities for industrial development.
There are three major deep water ports in Louisiana: New Orleans, Baton
Rouge, and Lake Charles. The Port of New Orleans handles more than 160 million
tons of cargo per year and ranks as the second largest port in the nation behind
New York. Most of the tonnage handled is grain exports.
Baton Rouge ranks behind the Port of New Orleans as being the second
largest port in the state and the fourth largest in the nation in terms of tonnage

84
handled. It is estimated that approximately 90 percent of the cargo handled at the
Port of Baton Rouge is dry bulk commodities. The Port of Baton Rouge is the first
downstream port on the Mississippi where cargo can be transferred from barge to
ship.
The Port of Lake Charles handles in excess of 30 million tons per year. This
makes it one of the nation's top twenty-five ports. The major commodities handled
include rice and crude petroleum. In fact, the Port of Lake Charles is the leading
rice export facility in the nation.
In 1982, the nation's first offshore oil port designed to handle giant oil
supertankers, called the Superport, started operations on a full-time basis. The
Superport initially has the capacity to handle 1.4 million barrels of crude oil a day.
The facility ensures necessary support for the petroleum and petrochemical
industries. Located approximately 18 miles offshore from Louisiana, the port
facilities include a marine terminal which can accomodate tankers with 90-foot
drafts, underground storage facilities, and a large pipeline for transporting oil.
Besides these major ports, there are many more smaller ports operating in
Louisiana. The more than 4,500 miles of waterfront acreage for industrial
development provide ample opportunity for smaller ports to operate.
Investment Needs
While port facilities are quasi-public enterprises, due to the impact on the
economy the state has a natural vested interest in their operations. Support for
the development of port facilities during the past few years is given in Table 34. In
1977, total capital expenditures for ports equalled $16.8 million. By 1982, capital
expenditures for ports increased to $50.5 million, an average annual increase of
49.8 percent. In addition, there are currently outstanding $789.2 million of general
obligation and self-supporting debt issued to finance capital improvements for

85
TABLE 34
Authorized Expenditures on Ports in Louisiana(Amount in Millions of Dollars)
Percentage ChangeYear Facilities from Preceding Year
1977 $16.8 -%
1978 10.4 -38.1
1979 36.6 251.9
1980 39.1 6.8
1981 48.8 24.8
1982 50.5 3.5
Average $33.7 49.8%
Source: Capital Outlay Acts.

86
ports. Approximately 85 percent of this debt outstanding is for the development of
the Superport. There is also $55.8 million of authorized but unissued general
obligation debt for ports still waiting to be issued.
Future investment needs can be functionally classified into two categories:
need for new or modified navigation channels to handle an increased volume of
traffic with different characteristics, and need for replacement of structurally
obsolete facilities. According to a recent rail/port facility needs assessment, the
major geographical areas which emerge as most likely to be affected by the need
for new or modified navigation channels to handle an increased volume of traffic
and to facilitate an interfacing with rail transportation include:
(1) the Red River Waterway and surrounding lignite
development area between Shreveport and the
confluence of the Red, Old, and Mississippi Rivers, (2)
the south Louisiana coastal region between Lake
Charles and New Orleans, (3) the Mississippi River
region from Baton Rouge to the Gulf of Mexico, (4) the
left ascending bank of the Mississippi River from Baton
Rouge to the Louisiana/Arkansas state line, and (5) the
Ouachita-Black River Region of Northeast Louisiana.
The first three regions represent areas which may well
feel the impact of developments in a relatively short
time, while the remaining two promise development
possibilities and consequential impacts in relation to a
longer time frame. 3 9

87
Much attention has been focused on the Red River Waterway project
(currently under construction). The estimated cost of the project is $1.7 billion.
Funding for this project is from the current Energy and Water Development Act.
Opponents to the project argue that the project will be wasted owing to the fact
that the river constantly shifts course. Proponents support the project because of
its estimated impact on rail service development. 4 0
The south Louisiana coastal region between Lake Charles and New Orleans
benefits from the offshore oil industry, and chemical and petroleum industrial
development. Within this region, the Intracoastal Canal has been the subject of a
study to determine the economic justification and environmental impact of
enlarging that section between Mississippi and Atchafalaya Rivers.41 Other pro-
jects have been considered within this region but all depend heavily upon public
financing.
The Mississippi River region from Baton Rouge to the Gulf of Mexico serving
the public ports of New Orleans and Baton Rouge has been the subject of much
study because the channel depth is limited to 40 feet. This channel depth allows
access only to oceangoing vessels less than 60,000 D.W.T. Estimates indicate that
approximately 40 percent of the world fleet is in excess of this maximum size.
Initial estimates to provide access to much larger ships by deepening the channel to
55 feet are at $500 million with an annual maintenance expenseiof $175 million.4 2
The ascending left bank of the Mississippi River between Baton Rouge and
the Louisiana/Arkansas State Line consists of many small river ports. Further
economic development of these small rural parish river ports is considered
plausible only in the event the Mississippi River could be enlarged to accommodate
larger barge tows and perhaps small oceangoing vessels. The likelihood of this
happening is remote.

88
The Ouachita and Black River region has several U.S. Army Corps of
Engineer projects currently under construction. The purposes of these projects are
to improve locks, channel maintenance, and bank stabilization. No short-run
projects are feasible to change the characteristics of existing traffic.
Data on the need for the replacement of structurally obsolete facilities
within the state are unavailable. No cost estimates have been compiled to
determine the investment need in this area. Based on tonnages handled, queuing
theory, average tow sizes and tonnage capacity, only a few navigation structures
have been assessed in terms of time till replacement.
More planning is needed to assess the investment needs of ports and
waterways in Louisiana. An increased government involvement in ports and
waterways can be explained on the basis of protectionist motives. That is,
governments may be obligated to protect certain industries against income losses
or to encourage greater investment because of the impact exogenous changes may
have on the cost competitiveness of resources which do not have the opportunities
available to mobile factors. Thus greater capital investment in ports and
waterways may be justified on the basis of some form of social justice. However,
no estimates regarding this support are available. At best, if the state continues
its support of port facilities at its current funding level, then annual investment
needs may equal $33.7 million per year.

89
IV. WATER SUPPLY, TREATMENT AND DISTREBUTION
4.1 Water Supply
Water supply in Louisiana appears less foreboding than in other parts of the
nation owing to an abundant supply of water and an average rainfall of 50 to 60
inches a year. Surface water covers 3,097 square miles, or about six percent of the
state. Sources of surface water include the Mississippi River and its tributaries
and a large number of lakes, channels, streams, reservoirs, bayous, and swamps.
Fresh groundwater is found in six major aquifer systems. Some areas of the state,
however, contain no productive freshwater aquifers due to variable hydrogeologic
features and- the presence of saline water.43 Quality becomes of extreme
importance in these areas where supplies are becoming relatively scarce.
Water for residential use has traditionally come from groundwater. Water
obtained from underground sources is generally more costly than water obtained
from surface sources but is of better quality. Surface water is regarded as having
a low quality and usually requires more treatment before it is distributed for
consumption. According to a survey of Louisiana water utilities, groundwater is
the predominant source of supply.44
Public control of water utilities in Louisiana takes the form of either direct
ownership or regulation of rate setting policies. Legal jurisdiction over pricing
policy is exercised by the Louisiana Public Service Commission which regulates
private water utilities, the Farmers Home Administration which controls rural
nonprofit corporate water utilities, and the respective local governmental units
which regulate their own municipally owned utilities. It is estimated that
approximately 35 percent of water utilities are under thetegulatory powers of the
Louisiana Public Service Commission, 42 percent are controlled by municipal
governments, and the remainder are under the auspices of the Farmers Home

90
Administration.4 5 The form of ownership of these water utilities has a direct
bearing on the costs of water supplies, the structure of water rates, the financial
solvency of water utilities, and the level of future supplies.
The greatest volume of water for residential use is controlled by publicly
owned municipal water utilities. This market is local in nature and is influenced to
a large extent by changes in population and the level of economic activity within
certain areas. Approximately 45 percent of these water utilities serve a population
of 500 or less while 68 percent serve a population of 1,000 or less. 4 6
investment Needs
Providing water supply for public consumption is a complex function because
water utilities are expected to have a supply capacity not only sufficient to meet
average daily needs but also variations in seasonal and peak demands. Present
municipal water use is considered to be well within an acceptable level of supply in
most regions. In terms of projected water requirements, the Gulf South Research
Institute predicted that total water requirements of Louisiana will reach 35,817.1
million gallons per day in 2000, an increase of 120 percent from its estimated level
in 1980 (see Table 35).46 The dependence on groundwater means water utilities are
going to have to drill wells to greater depths with the likelihood of encountering
lower quality of water. This may mean surface water will become a growing
source of supply as has been the case already in some regions.
The cost of providing for future water needs depends on the population
served, the topography of the area, and the pumping capacity of the utility. While
no comprehensive overview of these capital needs exists, it has been estimated
that investment per capita on the part of water utilities is $143.3 (in 1971
dollars).48 Total investment includes investment in wells, storage facilities,

91
TABLE 35
Water Requirements for Louisiana, 1970-2000(Million Gallons Per Day)
Use Category 1970 1980 2000
Municipal 416.0 549.0 801.9
Agricultural 1,637.5 2,896.8 3,245.9
Industrial 4,969.4 7,968.3 19,643.2
Thermoelectric 2,890.2 4,865.6 12,126.1
Total 9,913.1 16,279.7 35,817.1
Source: Gulf South Research Institute, Present and Projected Water Requirementsfor Louisiana, 1970 - 2020, 1971.

92
pumps, treatment plants, buildings and distribution lines. The composition of this
investment varies according to the three types of water utilities and area (see
Table 36).
Using this data, representative investment needs required by water utilities
can be determined. Assuming per capita investment remains constant, then total
investment needs in 1983 dollars can be determined by multiplying the estimated
investment cost per capita times the change in population over this period. That
is,
$143.30 x 926,006 x 2.33 = $308,799,780
where the multiplier 2.33 converts the dollar figure to current 1983 dollars. Thus
total investment needs to facilitate an increased demand for water may be as much
as $309 million. This figure likely overstates investment needs since water utilities
typically experience increasing economies of scale. Increasing economies of scale
or decreasing total cost per capita is a trait of water utilities that explains why
they exist as a natural monopoly and consequently the need for government
involvement.
Sources of revenues to meet these needs depend on the user fees charged by
water utilities. These user charges are generated by either a system of flat rates,
metered rates, or a combination of flat and metered rates. Special charges
imposed by water utilities include outside area-limits charges, tapping fees, meter
installation charges, reconnection fees, surcharges or demand charges, and fire
protection charges. Faced with regulated rates on these charges, continued ability
to meet water demands is determined largely by regulation and financial strength.
Ignoring distributional and equity issues, an efficient allocation of water among the
different users and user groups depends solely on marginal cost pricing (i.e. user
fees). In the absence of user fees, the ability of local governments to issue debt to
finance municipally owned water utilities will greately affect water supply in the
future.
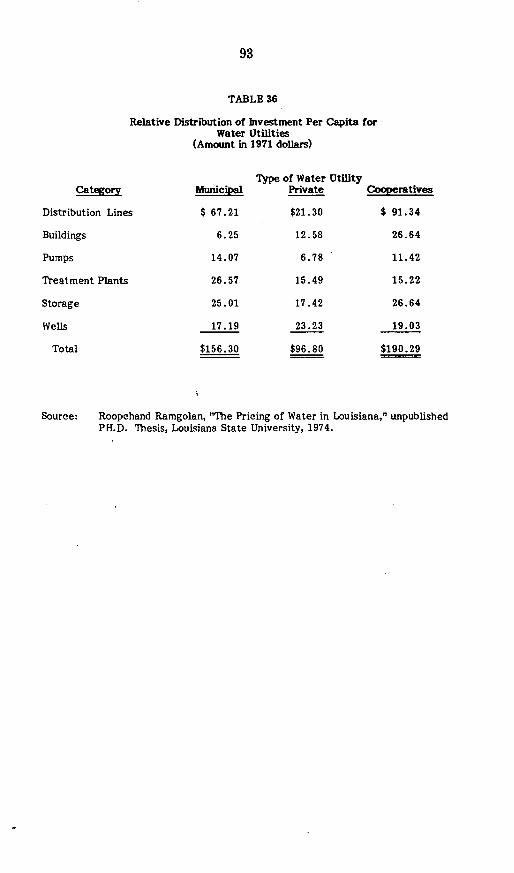
93
TABLE 36
Relative Distribution of Investment Per Capita forWater Utilities
(Amount in 1971 dollars)
Category
Distribution Lines
Buildings
Pumps
Treatment Plants
Storage
Wells
Total
Municipal
$ 67.21
6.25
14.07
26.57
25.01
17.19
$156.30
Type of Water UtilityPrivate Cooperatives
$21.30 $ 91.34
12.58 26.64
6.78 11.42
15.49 15.22
17.42 26.64
23.23 19.03
$96.80 $190.29
Source: Roopchand Ramgolan, "The Pricing of Water in Louisiana," unpublishedPH.D. Thesis, Louisiana State University, 1974.

94
4.2 Wastewater Treatment
The need for adequate wastewater treatment of organic and inorganic
discharge materials stems from the fact that if not properly treated, these
pollutants could endanger streams of fish and wildlife, transmit disease, or cause
public health hazards. In fact, the Clean Water Act of 1977 calls for "fishable and
swimmable" water by 1983 and zero discharge of pollutants by 1985. Coping with
this mandate presents serious problems.
Existing municipal wastewater treatment facilities in Louisiana provide
various levels of services. These services range from collection with no treatment
to collection with advanced treatment. Most common treatment includes lagoons,
activated sludge, and trickling filters. For the New Orleans-Baton Rouge metro-
politan area, 86 percent of the municipal wastewater treatment facilities use the
activated sludge and trickling filter processes and oxidation ponds. 49 By 2000,
total municipal wastewater flow is projected to equal 418 million gallons per day
for this area. This is equivalent to a 42 percent increase in current capacity. In
general, the large municipal wastewater treatment facilities are located in the
metropolitan areas within the state and account for most of the total average daily
municipal wastewater flow.
In the past, municipal wastewater treatment has depended primarily on the
population served and the commitment by communities to upgrade existing
facilities. Any actual action, though, has depended heavily on federal grants.
Without the use of federal grants, most planned improvements have been postponed
owing to the fact that construction of wastewater treatment facilities requires
such a major undertaking.

95
Investment Needs
Table 37 presents the estimated backlog of sewage wastewater construction
and stormwater runoff spending in Louisiana as determined by the Environmental
Protection Agency (EPA). These needs represent construction spending necessary
to meet current EPA goals based on 1980 population. The survey estimates include
the cost of secondary treatment, advanced treatment, infiltration and inflow
correction, major sewer rehabilitation, new collectors, new interceptors, overflow
correction and control of stormwaters. Also included in the survey are estimates
of the costs of meeting the needs of the population for the year 2000. The
incremental cost 'thus represents the additional cost necessary to meet future
needs.
Total backlog of needed construction is estimated at $1,895 million. Over 66
percent of this need is attributable to control of stormwater runoff. This can be
compared to year 2000 assessment of total needed construction of $2,411 million.
Based on this, the additional future sewage and stormwater control runoff needs
are $516 million.
Revenues
Trends in spending on construction of publicly-owned wastewater treatment
facilities and sanitation has on average accounted for aproximately 25 percent of
total expenditures by local governments during the period 1975 to 1980. According
to the Louisiana Municipal Association, this by far constitutes the major ticket
item for municipal governments. 5 0 Likely funding of the entire EPA assessment of
needs represents an impossible challenge.
Estimates of total revenues available over the period 1983 to 2000 are given
in Table 38. These estimates are derived from EPA estimates of total annual
expenditures projected for this period for the nation on the whole and adjusted to

96
TABLE 37
EPA Assessments for Construction of Publicly-Owned WastewaterTreatment Facilities(Millions of dollars)
Badclog of Year 2000Category Needed Construction EPA Assessment
Secondary Treatment $ 173 $ 431Advanced Treatment 2 7Correction of Infiltration/Inflow 52 52Major Rehabilitation of Sewers 11 11New Collectors 272 314New Interceptors 120 331Overflow Correction 0 0Control of Stormwaters 1,265
Total 1,895 $ 2,411
Source: Needs Survey: Cost Estimates for Construction of Publicly-Owned WastewaterTreatment Facilities, EPA.
TABLE 38
Estimated Expenditures for Wastewater Treatment Facilities(Amount in Millions)
Capital Outlay: 1983 - 2000
Federal Grants $ 587Local 29Other 247Sub-Total 863
Total Annual Expenditures:Operations and
Maintenance 362Other 358Sub-Total 720
Total Outlays $1,583
Source: Needs Survey: Cost Estimates for Construction of Publiclv-Owned WastewaterTreatment Facilities, EPA.

97
Louisiana. Total expenditures for the construction of public facilities, private
facilities, residential systems, and annual operations and maintenance costs are
reflected in the estimates. The projections assume no changes in funding
strategies of federal and state agencies.
Based on these projections, total annual expenditures equal $1,583 million.
This is equivalent to $93 million per year.
Needs versus Revenues
Comparison of investment needs versus revenues suggests an annual shortfall
of $49 million (see Table 39). Total additional investment required over the period
1983 to 2000 equals $828 million. The magnitude of this investment need reflects
the relative inability of local governments to cope with the problem of water
pollution. It also raises the question as to whether or not local governments are
best suited to meet the goals of the Clean Water Act.
4.3 Flood Control
Generally, the federal government exercises control over the development of
the major river basins in Louisiana. In this context, the federal government can be
singled out as the prime supplier of irrigation water, navigation improvements,
flood control storage or levee and channel improvements, and other water related
projects. Yet, the distribution of water and the use of water is governed by state
laws.
Traditionally, the primary method for reducing flood damage has been
through structural measures such as dams, dikes, levees, channel improvements and
seawalls. These have been constructed by the U.S. Army Corps of Engineers, at
least for the major rivers. In fact, during the past quarter century federal
expenditures for flood protection have nearly doubled. These increases are
31-880 0 - 84 - 8
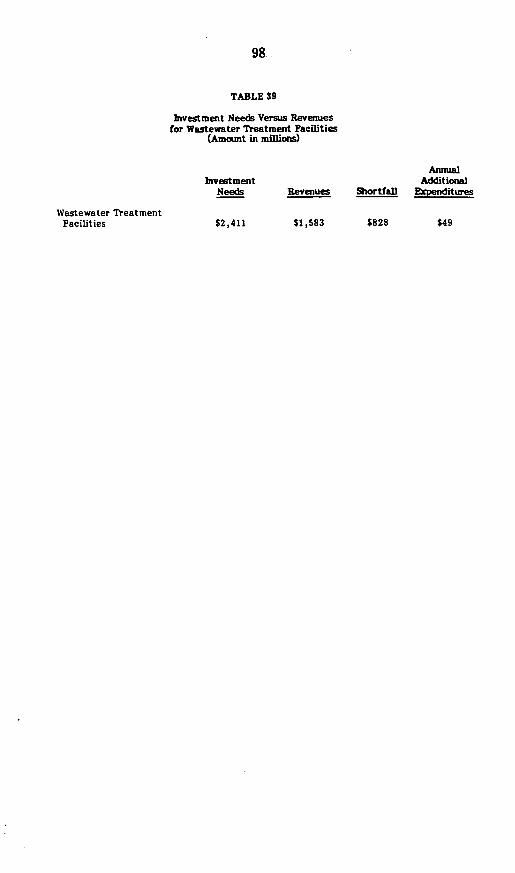
98
TABLE 39
Investment Needs Versus Revenuesfor Wastewater Treatment Facilities
(Amount in millions)
AnnualInvestment Additional
Needs Revenues Shortfall Expenditures
Wastewater TreatmentFacilities $2,411 $1,583 $828 $49

99
attributable to expanding urban development and increased land utilization of
floodplain areas. 5 1 Part of the protection against flood losses also comes from the
National Flood Insurance Program. This insurance program provides subsidized
flood insurance policies to property owners in designated flood hazard areas and
requires communities to adopt and enforce floodplain management regulations.
Since approximately one fourth of the flood damage in the United States occurs in
Louisiana, flood control represents an important concern.
Flood control programs in Louisiana provide for the construction of
structures which protect against headwater and backwater flooding. Under the
direction of the Secretary of the Corps of Engineers and the supervision of the
Chief of Engineers, the Mississippi River Commission, created in 1879, is
responsible for this protection within the Mississippi alluvial valley. Total
authorized cost to accomplish this work is $7 billion, of which about $4 billion has
been spent. Maintenance costs alone equal $46 million per year. Smaller projects
(less of a national priority) are the responsibility of the state.
There is no comprehensive study that reflects total investment needs for the
state in terms of flood control. However, a statewide flood control program has
been recently enacted (Louisiana Statewide Flood Control Program). The purpose
of this program is to design 'long-term solutions to specific flood problems by
protecting existing towns, facilities and fields in high hazard areas while not
encouraging expansion into flood prone areas."52 The program was initiated
because of reduced availability of federal funds for flood control and delays in
implementing federal projects, and will fund smaller projects not handled by
federal programs. While the funding system requires a 70:30 state-to-local match,
maintenance of the structure once constructed will be the responsibility of the
local government. No estimates are included in the total investment needs of the
state for this category.
100
V. SOLID WASTE DISPOSAL
Solid waste systems involve the assimilation and movement of solid waste
from points of origin to a disposal site, and the destruction and final disposition of
the solid waste collected. Inputs used in the collections activity include collection
trucks, bins and labor. Disposal methods available consist of landfills, dumps and
incinerators. Each of these disposal methods observed in parishwide and municipal
systems in Louisiana require the use of a different set of inputs.
While new patterns of solid waste generation have caused problems for
municipalities and local governments throughout the nation, the main problem in
Louisiana relates to regulations limiting siting of solid waste facilities in wetlands
or floodplains. The Resource Recovery and Conservation Act (RCRA) and
Louisiana state law require that all solid waste either be utilized for resource
recovery, deposited in a sanitary landfill, or otherwise disposed in an
environmentally safe manner. These regulations severely restrict the location of
sanitary landfills in wetlands or floodplains. Since approximately half the state,
housing more than two-thirds of the population, can be classified as a wetland or
floodplain area, solid waste disposal siting presents some serious problems.
The Louisiana solution to the problem calls for the utilization of waste for a
useful purpose rather than depositing in a sanitary landfill. This goal solves the
problem of the siting of solid waste facilities in wetland and floodplain areas plus
provides for an economic solution to the disposal of waste products. Under the
Louisiana Resource and Development Authority, the responsibility of developing an
economically safe solid waste disposal system in order to recover salable materials
and energy resides with the Authority.

101
Still the most commonly used method of disposal of solid waste in Louisiana
involves sanitary landfills which are regulated by the Louisiana Solid Waste
Management Program. This program exercises control over all existing open dump
sites (all new open dump sites have been banned from operating since 1981). The
program also sets forth the requirements to close or upgrade all existing facilities.
Control over these sites consists of issuing permits, inspection, monitoring, and
enforcement procedures.
Investment Needs
Current estimates indicate that solid waste generation in Louisiana will
increase over 31 percent for the period 1983 to 1995, an average annual rate of
increase of 2.6 percent per year.53 Currently, approximately 397 existing disposal
sites handle 62,900 tons of solid waste per week statewide. By 1995, the amount of
solid waste generated is estimated to increase to 82,576 tons per week.
To meet these increased demands on solid waste disposal in Louisiana, it is
estimated that $89 million (in 1983 dollars) in capital costs will be needed to
develop an effective parishwide collection and disposal system. Operating and
maintenance costs are projected to equal $134 million per year. These proposed
waste management improvements include the formation of sanitation districts to
lower per capita costs, upgrading the type of collection system for unincorporated
or unserved areas, and the continued operation of separate systems in larger
communities. In sum, an additional 41 landfill sites are necessary, 22 landfill sites
must be upgraded, 4 landfills will be franchised operations, and 5 landfills will
continue to operate in the present mode.

102
Compared to the alternative of a resource recovery system, regional landfills
comprise a capital cost savings of $540 million and lower operating and
maintenance costs of approximately $3.5 million per year. These estimates depend
heavily on the demand for the steam generated from the resource recovery sites.
Given a great enough demand, these sites may become cost effective and make
resource recovery more feasible.
Revenues
The methods of financing municipal and parishwide solid waste management
systems in Louisiana range from revenue sharing, to user fees, and to sales,
property, sewage, ad valorem and special maintenance taxes or any combination
thereof. In the future, the proposed capital investment and maintenance costs will
probably have to be met by a greater reliance on debt financing backed by higher
property taxes and/or user fees. Given the precarious nature of state and local
revenues, it is uncertain as to whether or not local governments can adequately
cope with the problem.
Needs versus Revenues
While the per capita costs of providing for solid waste disposal services is
relatively less expensive than other utilities, local government budgets already
appear to be overextended. Thus to ensure an adequate level of service and not to
confer any distribution benefits to selected classes of individuals it is likely that
higher user fees will be charged in the future to support solid waste disposal.
Efficient marginal pricing techniques should be able to overcome any shortfall in
revenues assuming individuals are willing to bear the burden.

103
APPENDIX
An important application of econometric models is the quantitative assess-
ment of the impact of changes in economic policy. That is, it is important to
understand the impact of a change in economic policy on target variables of
primary concern to policymakers. Policy instruments such as state and local
expenditures, tax rates, and the favorable tax treatment of tax-exempt interest
rates vis-a-vis taxable securities can have differential effects on public policy.
The simpliest technique of analyzing these impacts using an econometric model is
known as multiplier analysis.
The purpose of this appendix is to derive policy multipliers to assess the
comparative impact of different types of policies aimed at public infrastructure
investment. The main advantage of multiplier analysis for quantifying these
impacts is that once computed these multipliers can be used directly to approxi-
mate policy changes. However, the procedure also has certain limitations. Only if
the policy changes are not very complex and assuming that several variables do not
change at once is this relevant for computing approximations of dynamic real world
responses.
Static Model
The model considers three behavioral equations and one identity:
(1) X = cY
(2) T = aY + Fed
(3) STL = bo I - b1 Rex I
(4) X + I = STL + T

104
where X = government expenditures on goods and services excluding capital
outlays, Y = real gross personal income, T = taxes, Fed = federal grants-in-aid, STL
= supply of tax-exempt securities, Rex = tax-exempt interest rate, and I =
government expenditures on capital outlays. Equation (1) is a consumption function
of the demand for public goods and services provided by the government; equation
(2) is a simplified behavioral relationship relating tax receipts to gross personal
income plus federal grants-in-aid; equation (3) assumes that issues of tax-exempt
securities should be strongly related to capital outlays and negatively related to
tax-exempt yields; equation (4) is an identity which relates the sources and uses of
funds.
In order to focus on the impact of policy variables on public infrastructure
variables, Y, Fed, and Rex are considered exogenous (taken as pre-determined)
while X, I, T, and STL are assumed to be determined within the system. The lower
case letters a, boy b1 , and c denote behavioral coefficients. The coefficient c is
the marginal propensity to consume; the coefficient a represents the fraction that
tax revenues increase given an increase in gross personal income; the coefficient
b0 represents the relationship between issues of tax-exempt securities and capital
construction outlays and b1 reflects the impact of rising tax-exempt yields on
issues of new securities.
Multipliers
The multipliers can be derived by solving this system of equations for the
endogenous variables X, 1, T, and STL. From these reduced form equations, the
multipliers for public infrastructure investment with respect to a change in tax
policy, a change in tax-exempt interest rates, a change in federal grants-in-aid and
a change in real income are:

105
(5) Al = Y Aa
1(bo-bi Rex)
(6) Al = -bl ARex1-6b0 -bRex)
(7) Al = 1 AFed1-(b 0 -b1Rex)
(8) Al= (a-c) AY
1 b0 -b1 Rex)
where refers to the change in the variable.
Let a = 0.112, b0 = 0.56 and bi = 20.54 Assuming that the income elasticity
of the demand for government goods and services is 0.70, then the multipliers
55are
(5') %AI = 2.848%Aa
(6') %Al =-.8035%ARex
(7') %AI = .2289%AFed
(8') %AI = 1.065%AY
From equations (5)-(8), it is obvious that these multipliers depend on the tax-
exempt interest rate. Given a change in this rate, the multipliers also will change.
Equations (5')48') can be interpreted as the percentage change in government
investment given a percent change in the policy variable.

106
FOOTNOTES
1An Introduction to the Louisiana Statewide Flood Control Program, created byAct 351 of the 1982 Regular Session of the Louisiana Legislature, November 1982.
2See Richard W. Tresch, Public Finance: A Normative Theory, BusinessPublications, Inc. Plano, Texas, 1981, pp. 614-616.
3 William J. Baumol and Wallace E. Oates, The Theory of Environmental Policy:Externalities, Public Outlays, and the Quality of Life, Prentice Hall, Inc., EnglewoodCliffs, N.J., 1975, pp. 243-44, 248, 258-64, 265-66.
4A recent Louisiana Legislative Fiscal Office study indicates that state aid tolocal governments contain many distributional inequities on a per capita basis. Smallparishes are favored over larger parishes whereas wealthier parishes are favored overless wealthier parishes. For more details see Louisiana Legislative Fiscal Office,Louisiana State and Local Fiscal Study, 1982.
5 Data on intergovernmental aid are from Louisiana Legislative Fiscal Office,Louisiana State and Local Fiscal Study, 1982.
6 See George M. VonFurstenberg and Burton C. Malkiel, "The Government andCapital Formation: A Survey of Recent Issues," Journal of Economic Literature, vol.XV (3), September 1977, pp. 835-878.
7J. Chester Johnson, "Current Financial Conditions and Capital FinancingOptions for State and Local Governments," Governmental Finance, vol. H, September1982, pp. 51-55.
8 Congressional Budget Office, Baseline Budget Projections for Fiscal Years1983-1987, February 1982.
9 Public Affairs Research Council of Louisiana, "Louisiana's Capital Budgeting:Progress or Paper Reforms," 1983.
1 0 Tresch, Public Finance, pp. 44-59.
'1 R. Lipsey and K. Lancaster, "The General Theory of Second-Best," Review ofEconomic Studies, vol. 24, 1956-57.
1 2 Peter Greenston and Carl Snead, A Selected Review of Urban EconomicDevelopment, Report prepared by the Urban Institute for the Economic DevelopmentAdministration, May 1976.
1 3 Benjamin Chinitz and Raymond Vernon, "Changing Forces in Industrial Loca-tion," Harvard Business Review, January/February 1960, pp. 126-136.
1 4 Economic Development Administration, Survey of Industrial Location Determ-inants, 1971.
1 5 Public Affairs Research Council of Louisiana, "Survey of Louisiana Manu-facturers," 1975.

107
1 6 Gary Fromm, "Civil Aviation Expenditures," in Measuring Benefits of Govern-ment Investment, edited by Robert Borfman, Washington, D.C., Brookings Institution,1965, pp. 172-230.
17William J. Baumol, "On the Social Rate of Discount," American EconomicReview, September 1968, 58 (4), pp. 788-802.
1 8 R. S. Friedman, State and Local Relations in Highway Finance in Louisiana,Louisiana State University, 1962.
1 9 Louisiana Department of Transportation and Development, Highway Needs andPriorities, 1981.
20La DOTD, Highway Needs, 1981.
2 1Investment needs for highways were obtained from the Louisiana Departmentof Transportation and Development, Office of Highways.
2 2 Estimated based on average lane widths, thickness, road surface and terrain,Louisiana Department of Transportation and Development, Office of Highways.
23Richard A. Musgrave, The Theory of Public Finance, New York: McGraw-Hill,1959.
2 4William G. Black, "Louisiana Revenues and Expenditures: The Next FiveYears," Louisiana Business Review, Winter 1982.
The information in this section is based on an interview with the officials ofLouisiana Department of Transportation and Development, Office of Highways. AUestimates regarding investment needs and revenues for bridge replacement andrehabilitation were obtained from information relating to that interview.
26According to the Louisiana Department of Transportation and Development,Office of Highways, local governments depend heavily on federal and state inter-governmental grants and probably do not have a sufficient source of own revenuesavailable for bridge replacement.
2 7 Louisiana Legislative Fiscal Office, Louisiana State and Local Fiscal Study,1982.
2 8 Louisiana Municipal Association.
2 9 Source of information is from the Department of Civil Engineering, LouisianaState University.
3 Average cost of resurfacing local roads is based on estimates obtained fromBaton Rouge City Parish Government, Department of Public Works, EngineeringDivision.
3 1 See Louisiana Department of Transportation and Development, Office ofAviation and Public Transportation, Louisiana State Rail Plan Update, 1981.
3 2 See Louisiana Department of Transportation and Development, Louisiana StateRail Plan, 1981.

108
3 3 The cost of rail rehabilitation per mile is taken to equal the total cost ofrehabilitating past branchlines divided by the total miles of rail improved.
3 4This section is based on an interview with officials of the LouisianaDepartment of Transportation and Development, Office of Aviation and PublicTransportation.
3 5 Estimates of revenues for airports are based on data from the LouisianaDepartment of Transportation and Development, Office of Aviation and PublicTransportation for the fiscal year 1983-84.
3 6 For a complete description of public transit programs in Louisiana seeLouisiana Department of Transportation, Office of Aviation and Public Transportation,Louisiana Mass Transit Study, 1979.
3 7 Estimated investment needs and revenues for public transportation are fromLouisiana Department of Transportation and Development, Office of Aviation andPublic Transportation, Louisiana Mass Transit Study, preliminary 1983.
38 Jim Bradshaw, "Ports: Pivot of Louisiana's Prosperity," Acadiana Profile,1980, pp. 38-58.
3 9 Louisiana Department of Transportation and Development, Office of Aviationand Public Transportation, Louisiana Rail Port Assessment Needs, 1982.
4 0 See William L. Chaze, Robert Barr and Robert S. Dudney, "The $75 BillionPork-Barrel Ripoff," U.S. News and World Report vol. 97 (17), May 2, 1983, pp. 18-21.
4 1 U.S. Army Corps of Engineers, New Orleans-Baton Rouge Metropolitan AreaWater Resources Study, February 1981, pp. 205-212.
4 2 Louisiana Department of Transportation and Development, Office of Aviationand Public Transportation, Louisiana Rail/Port Needs Assessment, 1982.
4 3 Gulf South Research Institute, Present Municipal Water Use in Louisiana,October 1969.
4 4 Roopchand Ramgolan, "The Pricing of Water in Louisiana," unpublished Ph.D.Thesis, Louisiana State University, 1974, pp. 91-98.
4 5Ramgolan, "The Pricing of Water in Louisiana," pp. 79-82.
4 6 Ramgolan, "The Pricing of Water in Louisiana," pp. 82-90.
47These predictions are based on 1969 data. See Gulf South Research Institute,Present Municipal Water Use in Louisiana, October 1969.
4 8 Ramgolan, "The Pricing of Water in Louisiana," pp. 98-103.
49See U.S. Army Corps of Engineers, New Orleans-Baton Rouge MetropolitanArea Water Resources Study, February 1981, pp. 31-78.
5 0 The Louisiana Municipal Association ranked capital expenditures on publicly-owned wastewater treatment facilities and sanitation as a major barrier to urbandevelopment in Louisiana.

109
51Virginia R. Van Sickle, "The National Flood Insurance Program: A RegulatoryApproach for Reducing Flood Losses," Louisiana Business Review vol. 44 (12),December 1980, pp. 2-6.
52An Introduction to the Louisiana Statewide Flood Control Program created byAct 351 of the 1982 Regular Session of the Louisiana Legislature, November 1982.
5 3Investment needs data for solid waste disposal are taken from Solid WasteManagement State of State Report for Louisiana. Department of Natural Resources,Office of Environmental Affairs, Solid Waste Management Division, March 1983.
5 4 These parameters are based on Baumol and Oates, The Theory of Environ-mental Policy, and Patric H. Hendershott, "Analysis of the Impact of Capital SpecificPolicies or Legislation: Application to Reforms of the Tax-Exempt Market," workingpaper, Purdue University.
5 5 Tax-exempt rate of interest was assumed to equal 9 percent in the calculationof these multipliers.