a case study of instructional methods used for private
TRANSCRIPT

Brigham Young UniversityBYU ScholarsArchive
All Theses and Dissertations
2017-11-01
A Case Study of Instructional Methods Used forPrivate Pilot Certification at Utah Valley UniversityFlight SchoolMichael Robert GrahamBrigham Young University
Follow this and additional works at: https://scholarsarchive.byu.edu/etd
Part of the Engineering Commons
This Thesis is brought to you for free and open access by BYU ScholarsArchive. It has been accepted for inclusion in All Theses and Dissertations by anauthorized administrator of BYU ScholarsArchive. For more information, please contact [email protected], [email protected].
BYU ScholarsArchive CitationGraham, Michael Robert, "A Case Study of Instructional Methods Used for Private Pilot Certification at Utah Valley University FlightSchool" (2017). All Theses and Dissertations. 6601.https://scholarsarchive.byu.edu/etd/6601

A Case Study of Instructional Methods Used for Private Pilot
Certification at Utah Valley University Flight School
Michael Robert Graham
A thesis submitted to the faculty of Brigham Young University
in partial fulfillment of the requirements for the degree of
Master of Science
Steven L. Shumway, Chair Kip Christensen
Geoffrey A. Wright
School of Technology
Brigham Young University
Copyright © 2017 Michael Robert Graham
All Rights Reserved
ABSTRACT
A Case Study of Instructional Methods Used for Private Pilot Certification at Utah Valley University Flight School
Michael Robert Graham School of Technology, BYU
Master of Science
In this case study, researchers investigated the instructional methods used to train private pilot students at Utah Valley University. Traditional one-on-one individualized learning methods were replaced with cooperative learning methods. Descriptive statistics were used to determine the effectiveness and efficiency of the cooperative learning methods used. Reduced training time, less repeated lessons and a reduced number of flight hours showed that cooperative learning methods were more efficient and a more effective way to train private pilot students at Utah Valley University.
Keywords: Cooperative Learning, Aviation, Flight Training
ACKNOWLEDGEMENTS
I would like to acknowledge Dr. Wright and Dr. Christensen for their help and many
great suggestions. A huge thank you to Dr. Shumway for his patience and hard work. I would
like to thank my wife for her support and encouragement. Also, thank you to my children for the
many memorable distractions.

iv
TABLE OF CONTENTS
LIST OF TABLES .................................................................................................................... vi
LIST OF FIGURES ................................................................................................................. vii
1 Introduction ..........................................................................................................................1
Introduction to the Problem ...........................................................................................1
Problem ........................................................................................................................2
Goal Structures in a Classroom: Individualistic and Cooperative Learning ....................3
Purpose .........................................................................................................................4
Research Questions .......................................................................................................4
2 Review of Literature..............................................................................................................5
3 Research Methods ............................................................................................................... 14
Population and Research Group .................................................................................. 14
Dependent and Independent Variables......................................................................... 15
Design ........................................................................................................................ 15
Treatment Group ......................................................................................................... 18
Treatment Group: Incorporation of Cooperative Learning Strategies ........................... 19
Control Groups ........................................................................................................... 23
Data ............................................................................................................................ 24
4 Findings ............................................................................................................................. 28
Findings for Research Question #1 .............................................................................. 29
Findings for Research Question #2 .............................................................................. 34
Findings for Research Question #3 .............................................................................. 38

v
5 Summary, Discussion, Conclusions and Recommendations ................................................. 41
Summary and Discussion Relevant to Research Question #1 ....................................... 41
Summary and Discussion Relevant to Research Question #2 ....................................... 43
Summary and Discussion Relevant to Research Question #3 ....................................... 44
Limitations .................................................................................................................. 45
Major Conclusions ...................................................................................................... 48
Recommendations ....................................................................................................... 48
REFERENCES ......................................................................................................................... 50
APPENDIX A ........................................................................................................................... 51

vi
LIST OF TABLES
Table 3-1 Group Comparison .................................................................................................... 27
Table 4-1 Average Number of Days to Complete the Private Pilot Flight Course ...................... 29
Table 4-2 Average Number of Day to Complete Private Pilot Flight Course .............................. 30
Table 4-3 Average Number of Days to Complete Stage Checks ................................................ 33
Table 4-4 Average Times Stage Checks and Practical Test were Repeated ................................ 36
Table 4-5 Average Times Stage Checks and Practical Test were Repeated ................................ 37
vii
LIST OF FIGURES
Figure 4-1 Average Days to Complete ....................................................................................... 32
Figure 4-2 Average Times Lessons Were Repeated ................................................................... 35
Figure 4-3 Average Flight Hours ............................................................................................... 39
Figure 4-4 Flight Hours per Semester ........................................................................................ 40
1
1 INTRODUCTION
The effects of implementing cooperative learning strategies into an aviation training
course at Utah Valley University were examined in this study. Traditionally, aviation training is
taught with an individualized instruction approach. Increased demand for pilots requires that new
training methods be investigated to determine if time-to-completion can be reduced for flight
certification. This study investigated a different teaching method to train pilots in an equally
effective but more efficient way.
Introduction to the Problem
There is a tremendous need for commercial Airline Pilots. The estimated demand for
commercial pilots in the United States alone predicts that only two-thirds of the new pilot
demand will be met in the next 20 years. Additionally commercial air service is predicted to
increase (Prentice and Gouel, 2016). This creates a large gap between the supply of new pilots
and the demand for commercial airline pilots
Many factors contribute to the large gap between supply and demand of commercial
pilots. Increased flight training time requirements is the largest contributing factor for the
current pilot shortage (Swelbar, 2014). Previous to 2013, the FAA required that a pilot hold a
commercial pilot certificate (minimum 180 flight hours if the pilot received training from a Part
141 School, or 250 flight hours from a Part 61 School) to be hired as a co-pilot for a regional
2
airliner. In August of 2013 the FAA changed the requirement. A pilot must hold an Airline
Transport Pilot certificate (ATP) to be hired as a co-pilot for a regional airliner. The ATP
certificate, with some exceptions, requires 1,500 total flight hours (Prentice and Gouel, 2016)
(Swelbar, 2014) and this increase of required flight hours greatly increases the overall time it
takes for a pilot to become certified. The time it will take a potential pilot to acquire the required
1,500 flight hours depends on several factors. Two of the main factors are: (1) how long it takes
to complete the commercial pilot certificate, (2) and how long it takes after this certification to
acquire 1,500 hours and complete the ATP certificate.
Multiple licenses, or certificates, are required during training. After training, a pilot must
build flight time before being eligible for hire for a regional airline. Working as a certified flight
instructor (CFI) is a common route to acquire hours, however, there are three additional
certificates that a pilot must earn before the pilot can be hired as a CFI. Each certificate takes
time to complete and not completing a certificate in the prescribed time frame only delays further
training.
Problem
Utah Valley University (UVU) is currently experiencing this problem. The private pilot
certificate is taking more than the recommended one semester to complete. According to one of
the Assistant Chief Flight Instructors, just over one and a half semesters (1.53) is the average
time it took students from the previous semester to complete the private pilot certificate (J.
Sutherland, 2016). Delaying completion of the private pilot certificate delays further instruction.
Changing the way some training is done could reduce the time it takes for students to complete
the private pilot certificate.

3
Goal Structures in a Classroom: Individualistic and Cooperative Learning
Humphreys, Johnson, and Johnson (1982) assert that the way in which students interact
with each other as they learn may be just as important and have a greater impact on students’
performance than the curriculum. Two of the most common goal structures are individualistic
learning and cooperative learning. Individualized learning is the predominant method of
instruction currently being used during ground instruction and flight instruction of the private
pilot course at UVU. Typically, students trying to obtain the private pilot certificate have been
assigned to meet with an assigned Certified Flight Instructor (CFI) three times each week for
individualized instruction. During these meetings, depending upon the needs of the student, the
CFI would complete a flight lesson with the student to complete required flight hours or the CFI
and student would complete a ground lesson to prepare for the certification test.
An alternate method for ground instruction would be to incorporate cooperative learning
strategies into the ground instruction. In a meta-analysis conducted on cooperative learning
methods, Johnson, Johnson and Stanne (2000) found that when implemented properly, students
in a cooperative learning setting consistently outperformed students in individualistic learning
environments in measures of academic achievement. Cooperative teaching has been found
successful among many grade levels and many subjects (Maceiras et. al, 2011). With such a
broad success this method could be adapted to aviation at a college level.
In the new instruction model investigated in this study, the flight instruction component
of instruction would continue to be individualized because of the physical restrictions of the
airplane. However, during the ground instruction component, the students were assigned to work
together in small cooperative groups called “crews” to complete course requirements rather than
meet individually with the Certified Flight Instructor (CFI).

4
Purpose
The purpose of this research was to investigate whether changing the primary method of
ground instruction from individualized learning to one that incorporates cooperative learning
strategies would potentially reduce the time it takes for UVU Flight students to complete the
private pilot certificate without decreasing student understanding.
Research Questions
The research helped answer the following questions:
1. Will putting students into a cooperative group classroom situation for ground instruction
reduce the number of days needed for students to complete the private pilot certificate?
2. Will putting students into a cooperative group classroom situation for ground instruction
result in better understanding of the course material by the students and thus result in
fewer lessons needing to be repeated?
3. Will putting students into a cooperative group classroom situation for ground instruction
reduce the number of flight hours needed for students to complete the private pilot
certificate?

5
2 REVIEW OF LITERATURE
This study examined the effects of implementing cooperative learning strategies into an
aviation training course at Utah Valley University. Traditionally aviation training is taught with a
one-on-one direct instruction approach. Increased demand for pilots requires new training
methods be investigated to determine if time-to-completion can be reduced for flight
certification. This study provided a way to investigate a potentially more time efficient way to
train pilots in order to help meet industry demands.
Throughout the world there is a tremendous need for commercial Airline Pilots. It is
projected that Europe and Asia will need over 300,000 pilots in the next two decades (Prentice
and Gouel, 2016). The demand for commercial pilots is similar in the United States - only two-
thirds of the new pilot demand will be met in the next 20 years. Projections of an additional
95,000 needed commercial airline pilots verses a predicted 64,000 pilots to be supplied in the
next 20 years shows the drastic gap between supply and demand. (Prentice and Gouel, 2016).
Additionally, it is projected that the commercial air service will increase by 7.7% over the next
20 years, requiring more demand for commercial airline pilots (Prentice and Gouel, 2016).
The large gap between supply and demand of pilots has many contributing factors.
Military pilots have traditionally made up most of the airline pilot work force, but currently they
only make up about one third of airline pilots. Demand for pilots overseas also contributes to the
pilot shortage in the US, with a predicted 40% increase in the world-wide commercial aircraft
6
fleet in 20 years (Prentice and Gouel, 2016). While the military supplying fewer pilots and air
service in the global economy demanding more pilots have been significant contributors to the
current pilot shortage, perhaps even greater factors are current rates of pilot retirement and
increased pilot training requirements.
Airline pilots are regulated in all aspects of flying including a mandatory retirement age
of 65. The article “The Coming U.S. Pilot Shortage Is Real” in Aviation Week & Space
Technology illustrates how drastic the mandatory retirement is. According to the article, close to
20,000 pilots will be required to retire in the US in the next seven years (The Coming U.S. Pilot
Shortage Is Real, 2016). Swelbar points out that nearly 14,000 major air carrier pilots will be
retiring by 2022 (Swelbar, 2014). Major airlines are tasked with the challenge to replace retiring
pilots while also trying to keep up with industry growth. These replacements generally come
from regional airlines and according to data provided by Swelbar, regional airlines currently only
have 18,000 pilots total (Swelbar, 2014). The major airlines could easily exhaust this hiring pool.
With thousands of pilots retiring, aspiring pilots have great opportunity to fill the
upcoming vacancies. However, flight training takes time and the Federal Aviation
Administration recently increased the time it takes to become certified to be a regional airline
pilot (Prentice and Gouel, 2016). According to Swelbar, increased flight training time
requirements is the largest contributing factor for the current pilot shortage (Swelbar, 2014).
Previous to 2013, the FAA required that a pilot hold a commercial pilot certificate (minimum
180 flight hours if the pilot received training from a Part 141 School, or 250 flight hours from a
Part 61 School) to be hired as a co-pilot for a regional airliner. In August of 2013 the FAA
changed the requirement. A pilot must hold an airline transport pilot certificate (ATP) to be hired
as a co-pilot for a regional airliner. The ATP certificate, with some exceptions, requires 1,500
7
total flight hours (Prentice and Gouel, 2016) (Swelbar, 2014) and this increase of required flight
hours greatly increases the overall time it takes for a pilot to meet the qualificaitons needed to be
hired.
The time it will take for a person to acquire the required 1,500 flight hours depends on
many factors. The two main factors are how long it takes to finish training (how long it takes to
complete the commercial pilot certificate) and how long it takes after training to acquire 1,500
hours and complete the ATP certificate.
The flight training portion includes multiple licenses, also called certificates. The private
pilot certificate, instrument rating, multi-engine private pilot, commercial multi-engine and
single-engine commercial certificates are required to complete training. After training, a pilot is
eligible for hire for certain occupations. Air tours, skydiving, and flight instruction are a few
occupations that hire pilots immediately after training. A pilot will fly for these operations to
acquire the remainder of the 1,500 hours required to be hired as a co-pilot for a regional airline.
Working as a certified flight instructor (CFI) is a common route to acquire hours. This
route requires up to three more certificates (certified flight instructor or CFI, certified flight
instructor-instrument or CFII and multi-engine instructor or MEI), depending on the flight
schools requirements. A CFI teaches students flight operations, in the aircraft, as well as other
knowledge areas, on the ground. Once the CFI determines the student is proficient enough to
pass the FAA practical test, the CFI will endorse the students’ logbook so that the student can
take the practical test. As the CFI flies with the student, both the CFI and the student can log the
flight time.

8
Flight schools have dual purpose. First the school provides students with an aircraft and a
CFI to teach flight skills. Second the flight school provides students and aircraft for CFI’s who
are trying to build hours. Flight schools can be found at most airports. Utah Valley University
offers flight training at the Provo, Utah airport as well as a 4 year bachelor’s degree in aviation
science. These flight schools supply pilots to regional airlines as CFI’s become eligible for hire.
Each certificate takes time to complete. If one certificate takes longer than the proscribed
time, it delays other training and ultimately it delays being hired at a regional airline. The current
training method at UVU has one semester outlined to complete the private pilot certificate. The
training syllabus is designed to meet the FAA requirements to pass the FAA private pilot
practical exam. Flight skills, as well as certain knowledge areas, must be learned by the student.
The knowledge areas are called ground knowledge, because it is taught on the ground, not in the
aircraft. The FAA requires 35 flight hours to be eligible to take the private pilot practical exam
(an oral exam followed by a practical flight test with an FAA approved examiner).
Data compiled from the Utah Valley University (UVU) computer data base, indicates that
recent UVU students enrolled in the private pilot course are taking too long to complete the
private pilot certificate. According to the assitant chief flight instructor, the certification plan
created by the UVU aviation program states that the private pilot course should be completed in
one semester, with a typical semester being 116 days from the first day of class to last day of
finals (J. Sutherland, 2016),. Data indicates that of the 36 students enrolled in the private pilot
course in Fall 2015, only 20 (55.55%) finished the course as of May 3, 2016. For those who
finished the course, the average time it took them to complete the private pilot course was 1.53
semesters (J. Sutherland, 2016). Aviation faculty at UVU recognized the need for change and

9
were eager to examine possible solutions to reduce the time it takes for student pilots to finish
this private pilot certificate.
A one-to-one individualized teaching method is currently being used at Utah Valley
University to teach students during flight training. This method, although effective, can use
excessive time and resources. Gordon claims that, “the secret of education is to find out what the
learner already knows and teach accordingly” (Gordon, 2003). She continues by pointing out that
in a group setting, especially in a large group, finding out what everyone in the group already
knows is an impossible task. One-to-one teaching allows a teacher to learn what a student knows
and then match the material to the student. She calls this one of the “most powerful ways of
‘influencing students’” (Gordon, 2003). With such power, one-to-one teaching is an obvious
choice for any teaching opportunity.
Currently the students meet individually with their CFI three times per week,
accomplishing flight lessons or ground lessons as necessary for the student to progress. There are
26 flight lessons that must be completed and 3 ground lessons. The flight lessons, in general, are
2.5 hour time blocks, where the first half hour is used to train on any ground items that may be
necessary for the flight and pre-flight inspection. The next 1.5 hours is used to accomplish the
flight lesson and the last half hour is used to evaluate the flight lesson, sign the students log book
and brief the student about the next lesson. The 2.5 hour block is flexible and often more ground
instruction is given if needed. The 3 ground lessons are usually split up throughout the training
and are done when the CFI decides they would be most beneficial. Students also may use these
ground lessons as tutor sessions for any concept that they struggle with.
The one-to-one teaching method is often used in aviation because many training aircraft
only have two seats (one for the student, one for the instructor) and therefore this method is the

10
only option. On the ground, one-to-one training is used because of convenience. A student is
paired with a flight instructor for flight operations, and therefore the ground will be done in the
same manner.
One possible solution to reduce the time it takes to finish the private pilot certificate is to
change the way ground instruction is given by the CFI. An alternate method for ground
instruction would be to incorporate cooperative learning strategies into the ground instruction
when possible. Ferris sums up Amin and Hoons cooperative learning study by saying, “Research
has shown that students taught in this way retain more material for longer as it prepares learners
to be independent thinkers, a vital skill in the fast changing world of medicine” (Ferris, 2015).
Though the study referenced was conducted on medical students, similar hand-eye coordination
and decision making skills are needed in aviation. Mohammadjani and Tonkaboni found similar
results with Fourth Graders. They found that because opinions could be expressed using
strategies of cooperative learning the students guided the learning. This created learning that was
deeper and longer lasting (Mohammadjani and Tonkaboni, 2015). Cooperative teaching could be
used because of the many benefits that come from the cooperative learning environment. The
benefits that cooperative teaching have are found in many different studies covering many
different topics.
A form of cooperative teaching was used in Group A for this experiment. Mohammadjani
and Tonkaboni refer to cooperative teaching as a method where, “students cooperatively work
towards achieving common goals (Mohammadjani and Tonkaboni, 2015).” There is a strong
emphasis that each student must be working towards the same goal. Cooperative learning,
however, is not the same thing as unorganized group projects (Maceiras, 2011). Just because
groups are formed does not mean that cooperation will occur (Johnson and Johnson, 2016).There

11
must be more than students assigned to work together. There must be organization. Maceiras and
Johnson and Johnson give a list of items that cooperative teaching must have to work well.
Cooperative teaching must include (Johnson and Johnson, 2016) (Maceiras, 2011).:
• “Positive interdependence” – If one student does not complete tasks, all others must see
consequences (Maceiras, 2011). Johnson and Johnson emphasize that the students must
believe that they will, “sink or swim together (Johnson and Johnson, 2016).”
• “Individual accountability” – Students must also exclusively be held accountable.
Students must each master the material (Maceiras, 2011). However, the group must also
be accountable for how each student is performing (Johnson and Johnson, 2016).
• “Face-to-face promotive interaction” – Students may be assigned by the group to
individually go home and work on different tasks, but there also must be group
collaboration. The group must meet face-to-face to teach each other and help each other
learn (Maceiras, 2011). This is achieved, “when members share resources and help,
support, encourage, and praise each other’s efforts to learn (Johnson and Johnson,
2016).”
• “Appropriate use of collaborative skills” – In addition to teaching each other, students
must also use and develop, “trust building, leadership, decision making, communication
and conflict management skills (Maceiras, 2011).” Johnson and Johnson call this,
“teaching students the required interpersonal and small group skills.” They emphasize
that the teacher must teach these skills as they would any academic subject (Johnson and
Johnson, 2016).
• “Group processing” – Students must evaluate how the group is doing and set new goals
to function more effectively (Maceiras, 2011). The group must be able to discuss what

12
action, or inactions, are working and not working. The group members must put forth
effort to help the group succeed (Johnson and Johnson, 2016).
The five items listed above must be present for cooperative teaching to work well.
Johnson and Johnson go as far as saying that a teaching environment without these five things is
not cooperative teaching (Johnson and Johnson, 2016). In addition to the five items and a clear
goal, the students must also put forth an effort to maximize the learning of their peers as well as
that of themselves (Mohammadjani and Tonkaboni, 2015). The instructor must give the students
the correct environment, but in the end the student must put forth the required effort to ensure
that the necessary learning takes place.
Cooperative learning was studied because of the many benefits that come from the
cooperative learning environment. Cooperative learning has been found to be successful among
many grade levels and subjects (Maceiras, 2011). Cooperative learning is even preferred among
many subjects at many levels of learning. It is used world-wide in universities and schools with
students of all ages (Johnson and Johnson, 2016).
Academic achievement and improvement are common results of cooperative learning.
Mohammadjani and Tonkaboni report increases in math skills and higher scores on evaluation
tests when cooperative teaching was used with fourth grade elementary school students.
Knowledge was also found to be more concrete or “durable” when cooperative learning was
employed (Mohammadjani and Tonkaboni, 2015). Flight training concepts are often built on
previous knowledge. Retention of previously learned knowledge would decrease review time
needed to prepare for the students’ practical test.
Benefits of cooperative learning reached further than just academic achievement; social
skills were improved as well (Mohammadjani and Tonkaboni, 2015). Social skills are important

13
for all aspects of life and are used daily when flight training. The improvement of social skills
will be a huge benefit to student pilots because clear communication is essential to safe flight.
Cooperative learning helps those who struggle to overcome challenges and succeed.
Students not only must work for themselves but they must also work for the other members of
the group. “Within cooperative situations, individuals seek outcomes that are beneficial to
themselves and beneficial to all other group members” (Johnson and Johnson, 2016). Seeking
positive outcomes for the entire group is a great attribute for pilots to learn. In other words, the
pilot must learn to seek the safest outcome for the entire crew and all the passengers.
A unique aspect of cooperative learning is that the student will have a chance to not only
study topics but were given the chance to teach material to the other members of the group. As
students help each other learn, the concept of “learning by teaching” applies. “Learning by
teaching” is a powerful tool for learning. Knowledge gained by teaching can allow for deeper
understanding of material by students (Maceiras, 2011). A deeper understanding of knowledge
will benefit the student pilot especially during advanced stages of flight training. Another benefit
of the “learning by teaching” principle is that after a pilot finishes the commercial pilot
certificate he or she commonly builds flight hours by becoming a certified flight instructor (CFI).
The cooperative teaching technique will give the student some valuable teaching experience
before receiving any formal CFI training.

14
3 RESEARCH METHODS
The purpose of this research study was to investigate whether changing the primary
method of ground instruction from traditional, individualized learning to one that incorporates
cooperative learning strategies would potentially reduce the time it takes for UVU Flight
students to complete the private pilot certificate without decreasing the pass rate. Research
methods were used to collect data for students participating in a cooperative learning method
during the private pilot flight course. Data from students who participated in tradition,
individualized learning methods were then compared to determine the effectiveness of the
cooperative learning method.
Population and Research Group
This case study consisted of 149 flight students at Utah Valley University. The
population included students who were enrolled during or after the spring 2014 semester who
completed their private pilot certificate prior to July 18, 2017. Typically, the private pilot
students at UVU are between the ages of 18 and 30 and are working to become airline pilots. Of
the 149 students, 6% were women and 11% were not US citizens. The treatment group, or
students that were given cooperative learning instruction included 23 total students from the
summer 2016, fall 2016 and spring 2017 semesters. This group included 4% women and 22%
non-US citizens.

15
Dependent and Independent Variables
The independent variable in this research study was the instructional method used to
prepare students for the private pilot certificate. This consisted of three groups: Group A in
which students were put into “crews” and participated in groups that incorporated cooperative
learning strategies, Group B, which was on the same timeframe as Group A but in which the
students were taught using an individualized learning strategy, and Group C, which also used an
individualized learning strategy but which consisted of students participating in the private pilot
license program from the prior two years (2014-2016). Exactly how the independent variables
were operationalized for this study are presented in sections below.
The dependent variables used in this study to answer the research questions included:
1. Time to Completion: The total number of days needed for the students to complete the
private pilot certificate. As a subcomponent of time to completion, a log of student daily
progress and the time required for students to complete stage checks (proficiency exams)
was recorded.
2. Knowledge of Content: To measure this the number of times a lesson had to be repeated
before proficiency was achieved was recorded for each student.
3. Flight Hours: The number of flight hours needed for a student to demonstrate flight
competency was also recorded.
Design
In this research study, data from three groups of students participating in two different
instructional systems were compared to determine if one instruction system was more effective
in terms of time to completion of certification. Because of the small size of student cohorts

16
participating in the private pilot course at UVU, and given the lack of administrative control of
the researcher, it was not feasible to randomly assign students into simultaneous treatment and
control groups for this research study and have groups large enough to conduct a test of
statistical significance on the resulting data. To allow for greater confidence in the findings of
this study, students participating in the treatment group (Group A), were not only compared
against students in the control group (Group B) participating simultaneously in the training
program but also against similar students (Group C) that had participated in the training program
for two-years previous. Additionally, because of the small size of groups and given that random
selection and random assignment were not employed in this study, descriptive statistics,
including mean scores and standard deviations were the primary method of analysis rather than
tests of statistical significance.
Specifically, Group A, the sample or independent group, was trained via the treatment
method and consisted of students enrolled in the summer 2016, fall 2016 and spring 2017
semesters at UVU. These 23 students were chosen based on their availability to meet for crew
meetings. Group B consisted of 22 selected students enrolled in the summer 2016, fall 2016 and
spring 2017 semesters at UVU who completed the FAA private pilot practical exam and received
traditional individualized training. Finally, group C, consisted of all 104 private pilot students
enrolled at UVU, from 2014, 2015, and spring 2016, who completed the FAA private pilot
practical exam and received traditional individualized training.
Students participating in Group A were introduced to and asked to work in cooperative
groups called “crews”. Data collected on Group A was compared against data from students in
Groups B and C. Students in each of the groups used the same training syllabus for flight
lessons as approved by the Federal Aviation Administration (FAA) and took the same ground

17
training course and were required to pass the same FAA written exam. Each student had to also
pass three stage checks (an oral and practical exam given by a Check Instructor) given as lessons
10, 20 and 25. Students in all groups were required to pass the FAA private pilot practical exam
given by an FAA Designated Pilot Examiner (DPE). This exam also consisted of an oral and
practical portion and was recorded as lesson 26.
The instruction for the private pilot license consisted of 26 flight-related lessons split into
three stages with each stage ending with a “stage” check that did not allow students to progress
unless they demonstrated proficiency. Each stage check consisted of an oral exam and a practical
flight exam. Simultaneous to the flight lessons, the students were engaged in ground instruction
which was also split into three sections called lessons. Ground lesson one was taught
simultaneous to the flight lessons in stage one, ground lesson two was simultaneous to the flight
lessons in stage two and ground lesson three was taught simultaneous to flight lessons in stage
three.
The 26 flight lessons were completed in a Diamond DA-20, two-seat training aircraft.
Flight Lessons 9, 12, 13, 19, 21, and 22 were solo lessons as the student must be the sole
occupant of the aircraft. Lessons 10, 20 and 25 were the stage check lessons that were split into a
ground (10G, 20G, 25G) and flight (10F, 20F, 25F) portion and were given by an advanced CFI.
The stage check was a test that the student must pass before continuing training. Because of the
inherent danger of sending an inexperienced pilot solo, lessons 9 and 19 were completed out of
order, after a stage check. Stage 1 check (lesson 10) for example, was completed prior to the
first solo flight (lesson 9) and the stage 2 check (lesson 20) was completed prior to the first solo
to an unfamiliar airfield (lesson 19).
18
Stage 1, which was comprised of Lessons 1-8, was individualized instruction with the
CFI aboard the aircraft teaching the student how to fly the aircraft. This instruction was
foundational, and if done well, enabled the student to progress smoothly through the certification
process. This stage involved a heavy psychomotor component being approximately 70% flight
skill and 30% knowledge (cognitive domain). Usually lessons 1-7 were done quickly and lesson
8 was repeated to keep the flight skills sharp while the student continued to master the ground
lessons to prepare for the stage check (lesson 10G/10F).
In Stage 2, the instruction was focused on learning navigation techniques and then
applying them to the airplane. This stage was more cognitive in nature with approximately 30%
flight skill and 70% knowledge. In Stage 3, the CFI and the student spent time honing both
ground and flight skills for the practical test (50% flight skill, 50% knowledge). As mentioned
previously, simultaneous to the lessons in each of the stages, the students were also participating
in ground lessons to develop the knowledge component needed for the stage check.
Treatment Group
Ground lessons for each of the three stages were changed from a predominate use of
individualized instruction to incorporate cooperative learning strategies. Group A consisted of
students assigned to “crews” to meet together to accomplish the ground training instruction that
was required. There were 11 different crews in Group A, consisting of 2-4 students and 9
different CFI’s. The crews met together as a group twice each week: once with a CFI and once as
a study group. The group meeting with the CFI lasted for about 2 hours, where the CFI went over
all ground knowledge needed for the next 4 flight lessons, questions were answered, and any
reading was assigned. The CFI also guided the group with instructions on what material to cover
19
and what study methods to use during the group study session. The group study session was at
least one hour during the week without the CFI, where crews discussed concepts and helped each
other understand the material. The students that were included in this study were in groups that
held consistent crew meetings that included the five items (see below) that Johnson and Johnson
(2016) claimed must be present for cooperative learning to occur. A description of how these
concepts of cooperative learning were incorporated into the “crew meetings” is provided in the
section below Johnson and Johnson (2016).
• “Positive interdependence”
• “Individual accountability”
• “Face-to-face promotive interaction”
• “Appropriate use of collaborative skills”
• “Group processing”
The scheduled ground instruction was no longer necessary before each flight, and
therefore scheduled meeting times for flight were shortened by a half hour. The first 0.3 hours of
meeting time were used to do preflight inspection. Approximately 1.5 hours were used to
accomplish at least 1 flight lesson. If a flight lesson was accomplished and there was more time
left the next flight lesson was started. The last 0.2 hours were used to evaluate the flight and sign
the students’ logbook (See table 3.1).
Treatment Group: Incorporation of Cooperative Learning Strategies
Positive interdependence required that students were held back if other students did not
complete lessons. The students in Group A met individually with the CFI three times during the
week to fly. Each week at least three lessons were supposed to be completed by each student in

20
each crew; however, if one of the students in the crew was struggling and three lessons were not
competed by one of the students, other crew members slowed their pace to allow for the
struggling student to catch up. Conversely if students all progressed quickly a fourth lesson could
be completed. It was imperative that all students in the crew progressed at approximately the
same pace so that all crew members were kept in the same stage of training. This ensured that the
ground lessons remained beneficial to each student.
During crew meetings with the CFI, reading assignments were assigned for the next
week. Crew members often split up reading assignments and then reported back to the crew the
information they were assigned. Each student was held accountable for the information that they
were assigned as well as the information the other crew members presented. If students did not
do their required reading, the group or the assigned CFI would collaborate with the individual to
help them determine a way to improve their personal study habits and ability to accomplish
assigned tasks. Crew members also had to be individually accountable for the information taught
during the crew meetings by other crew members. Each crew member met one-on-one with the
assigned CFI prior to the stage exam. The review was to determine the individual students’
preparation for the stage exam. If the student was found deficient in any area the student met
with other crew members to help complete the knowledge needed to pass the stage exam. The
student then took the stage exam individually with an Advanced CFI. If the student did not
individually learn and understand the material, the exam was failed and the student had to
receive more training before the exam could be completed. Failing these stage exams effected
the students’ time to completion. The CFI would also give out short quizzes during crew
meetings to check understanding of individual students.
21
Each crew would meet face-to-face twice each week. The first meeting with the CFI was
used more to instruct and guide the student on the upcoming flights. It was also used to assign
different reading assignments for students. The crew meeting without the CFI was the meeting
that allowed the students to collaborate ideas and help each other understand and apply important
concepts.
Crews needed the skills required for a group to function effectively. Leadership skills,
decision making skills and communication skills did not come naturally to every crew member.
Aviation students learn these skills in normal flight training. Cooperative learning requires the
use of these collaborative skills. This requirement allowed cooperative learning and aviation
training to mix naturally. Crew members were taught leadership skills in crew meetings and in
flight training by the CFI. When a student pilots an aircraft, the student is learning to act as PIC
(Pilot in Command). The PIC must lead a flight crew and is ultimately responsible for the safety
of each flight. Decision making is also part of flight training. Aeronautical Decision Making
(ADM) is required material for private pilot training. Effective communication between pilot and
co-pilot, CFI and student or pilot and air traffic control is essential for safety and is taught as
CRM (Crew Resource Management) in all flight training. These skills were already taught in
flight training and were continually taught in flight training throughout the case study. During
the study the collaborative skills were also being taught and re-enforced in crew meetings
attended by student in the treatment goup, allowing for students to develop the required skills to
collaborate and function as a group or a flight crew. Occasionally the CFI would attend the crew
study session to observe and make sure these skills were being used to collaborate and progress
the crew.

22
The crew meetings were designed for students to help each other and to split up the
workload so that progress could be made quicker. However, at times issues arose that made the
crews work less efficiently. Students not doing their part or students not getting along are natural
parts of group work. When these issues arose, the CFI would talk to the student one-on-one,
usually during one of their flights, and try and motivate the student to work harder. Students also
got involved as they realized that the actions of another student effected their progress. Students
spoke with their peers and made sure the work was getting done. Students helped each crew
member be accountable for the work assigned. Each week the crew would set goals and discuss
ways the effectiveness of the crew could be improved.
Crew members were also given the opportunity to rate the other students in the crew. The
rating system was kept simple. On a sheet of paper the crew member was to write the names of
each crew member, including themselves, and whether or not he or she was doing assigned tasks.
The student was then asked to give specific details regarding their answer. The CFI would then
review the ratings and decide if any student needed extra help or motivation. Finally, to ensure
that Group A was implementing true cooperative learning strategies, the researcher monitored
each crew to be sure that all five characteristics were present consistently throughout training. If
there were concerns, the researcher met with the CFI’s and the crews to help implement solutions
for the concerns.
The flight lessons were also changed slightly for students in the treatment group. The
assigned flight times were reduced to 2 hours for each flight but the student still met individually
with the CFI three times each week to fly. Because the ground knowledge was taught during the
crew meeting the preflight briefing could be reduced to 0.2 hours and the post flight briefing
could be reduced to 0.3 hours. The flight time was kept at 1.5 hours. This time reduction was
23
necessary in order to give the CFI enough time during the week to complete all flights and crew
meetings.
Control Groups
Group B consisted of students who were enrolled in the private pilot flight course during
the summer 2016, fall 2016 and spring 2017 semesters. There were 22 students in Group B,
taught by 13 different CFI’s. While individualized instruction was the primary method of
instruction used in Group B, it should be noted that there were situations in which groups of
students met with the CFI’s for instruction. However, in these informal groups, no attempt was
made to incorporate the five characteristics of cooperative learning, as outlined by Johnson and
Johnson (2016) as was done for the students participating in Group A.
Group C consisted of students who were taught using an individualized teaching method.
Group C had 104 students and 40 different CFI’s teaching. During the time frame of Group C,
individualized training was required by CFI’s and no other teaching method was used. These
students were scheduled to meet with their CFI three times per week, accomplishing flight
lessons or portions of a ground lesson, as necessary, for the student to progress. The flight
lessons, in general, were 2.5 hour time blocks, where the first half hour was used to train on any
ground items that were necessary for the flight and pre-flight inspection. The next 1.5 hours were
used to accomplish the flight lesson and the last half hour was used to evaluate the flight lesson,
sign the students log book and brief the student about the next lesson. The schedule of the 2.5
hour block was flexible, where additional ground instruction was given if needed, but the block
usually didn’t last the full 2.5 hours. The three ground lessons were split up throughout the
training and were done when the CFI decided they would be most beneficial during the regularly

24
scheduled flight time. Students also could have used these ground lessons as tutor sessions for
any concept that they struggled with (see table 3.1).
Data
Data was collected to answer three research questions regarding the efficiency of training
at UVU.
1. Will the incorporation of cooperative learning strategies reduce the amount of time it
takes for a student to complete the FAA private pilot certificate?
2. Will the incorporation of cooperative learning strategies reduce the number of times a
lesson must be repeated before it is complete? (Including the FAA private pilot
practical test).
3. Will the incorporation of cooperative learning strategies reduce the number of flight
hours a student has after completion of the FAA private pilot practical exam?
The data for all groups of students (Groups A, B and C) regarding ground training time,
pre/post flight time and flight time was recorded by CFI’s using UVU’s electronic record
software, AIMS, for each attempted lesson. The record also included if the lesson was complete
or incomplete.
To answer research question #1 (time to complete) the dates for each lesson were
recorded. Day 1 was the first time the student met with a CFI, whether it was for ground or
flight. The completion day for each of the lessons was tracked and recorded by the CFI’s using
UVU course software. The last day recorded was the day that the practical test (lesson 26) was
completed. The number of days between day one and the last day were calculated, including the
first and last days. Because weather is a huge factor in aviation training, and because weather

25
patterns remain similar during different seasons, the average number of days it took students to
complete the private pilot course was also compared based on the semester the training was
conducted. Fall semester (Sept-Dec) generally has similar weather to previous fall semesters and
to future fall semesters as well. Students in Group A and Group B who were enrolled in the fall
2016 semester were compared to students in Group C enrolled in fall semesters in 2014 and
2015. This was also done for the spring (Jan- April) and summer (May- Aug) semesters.
In addition to the average number of days for each group to complete the private pilot
course, data was also collected to show the daily progress for each lesson completed for each
group to see if there was a particular part of the training that was more or less efficient, thus
impacting the time for completion. Finally, data regarding stage checks (lessons 10F, 20F and
25F) and how long it took to complete each of these lessons was checked as an additional
indication of progression through the training process.
For research question #2 (repeated lessons) the number of times a lesson was attempted
was recorded. This data was looked at specifically for the practical test (lesson 26) because the
FAA requires flight schools to maintain an 80% first time pass rate for this lesson.
The data for research question #3 (flight hours) was the number of flight hours each
student had after the practical test (lesson 26). For each flight that was conducted the total
number of hours in the aircraft was recorded and then added up when the student completed the
practical test (lesson 26).
Once the data was collected, descriptive statistics including mean scores and standard
deviations were used to compare each of the groups. Tests of statistical significane were
considered for this study. However, because participants were chosen based upon availability

26
rather than random selection and given that groups were not randomly assigned to treatment or
control groups and given the small n-size in this study, descriptive statistics were considered
more appropriate. The average number of days it took students to complete the private pilot
practical test, the average number of times each lesson was repeated and the average number of
flight hours were compared for each group. The descriptive statistics were compared in three
ways:
1. Group A (Treatment) vs Group B (Control): Similar timeframe
2. Group A (Treatment) vs Group C (Data from two previous years) were compared.
3. The third comparison was that the data was compared per semester. In other words,
summer semester students in Group A were compared to summer semester students in
Group C. This was done for fall and spring semesters as well.

27
Table 3-1 Group Comparison
Group A Group B Group C All
Syllabus Jeppeson Private Pilot Syllabus
Flight Lessons
26
Ground Lessons
3
Evaluation of Progress
Stage Checks
Final Evaluation
FAA Private Pilot Practical Exam
Flight Lessons Completed Each Week
Determined
by Group
Goal
Determined by Instructor
Determined by Instructor
Flight Time Per Lesson
~1.5 Hours
Pre/Postflight Per Lesson
.5 hours .5 hours 1 hour
Total Time to Complete Syllabus
Affected by Group Progress
Affected by Individual Progress
Affected by Individual Progress
Teaching Method
Cooperative Learning
Mostly Individualized
Individualized Instruction
One-on-One Flight Training
Crews 11 0 0 11
CFI’s 9 13 40 49
Students 23 22 104 149
28
4 FINDINGS
The data for this case study was collected from UVU students who were enrolled in the
private pilot flight course during or after the spring 2014 semester and who completed the FAA
private pilot practical test prior to July 18, 2017. The control group consisted of students who
were trained in the traditional, individualized training and was divided into two groups, Group B
and Group C. Students in Group B consisted of 22 selected students enrolled in the summer
2016, fall 2016 and spring 2017 semesters at UVU who completed the FAA private pilot
practical exam. Students in Group C consisted of all 104 private pilot students enrolled at UVU,
from spring semester 2014 until spring semester 2016, who completed the FAA private pilot
practical exam.
The independent or treatment group consisted of students who were enrolled in the
summer 2016, fall 2016 and spring 2017 semesters and who were put into crews that were
operationalized based upon cooperative learning strategies as outlined by Johnson, Johnson and
Stanne (2000). This group, which was labeled Group A for the study, included 23 private pilot
students.
Data was collected to answer three research questions regarding the efficiency of training
at UVU. Will the incorporation of cooperative learning strategies into instruction reduce the
amount of time it takes for a student to complete the FAA private pilot certificate? Will the

29
incorporation of cooperative learning strategies into instruction reduce the number of times a
lesson must be repeated before it is complete (Including the FAA private pilot practical test)?
Will the incorporation of cooperative strategies into instruction learning reduce the number of
flight hours a student has after completion of the FAA private pilot practical exam? The number
of times each lesson was repeated, what day the lesson was completed and how many flight
hours the student had were all recorded using the UVU electronic record AIMS.
Findings for Research Question #1
In research question #1, the amount of time it takes for students to complete the private
pilot flight course was investigated. Day 1 was recorded as the first time the student met with the
assigned CFI and the last day that was recorded was the day the student completed the FAA
private pilot practical exam. The recommended time for students to complete the private pilot
course, according to UVU Aviation Program administration is 116 days (J. Sutherland, 2016).
The average number of days for completion of each group is provided in Table 4.1.
Table 4-1 Average Number of Days to Complete the Private Pilot Flight Course
Group A* Group B** Group C***
Mean (Days) 122.43 145.59 200.39
Standard Deviation 29.06 57.73 90.28
*Group A = Treatment Group **Group B = Control group from similar time period ***Group C = Control Group from previous semesters
30
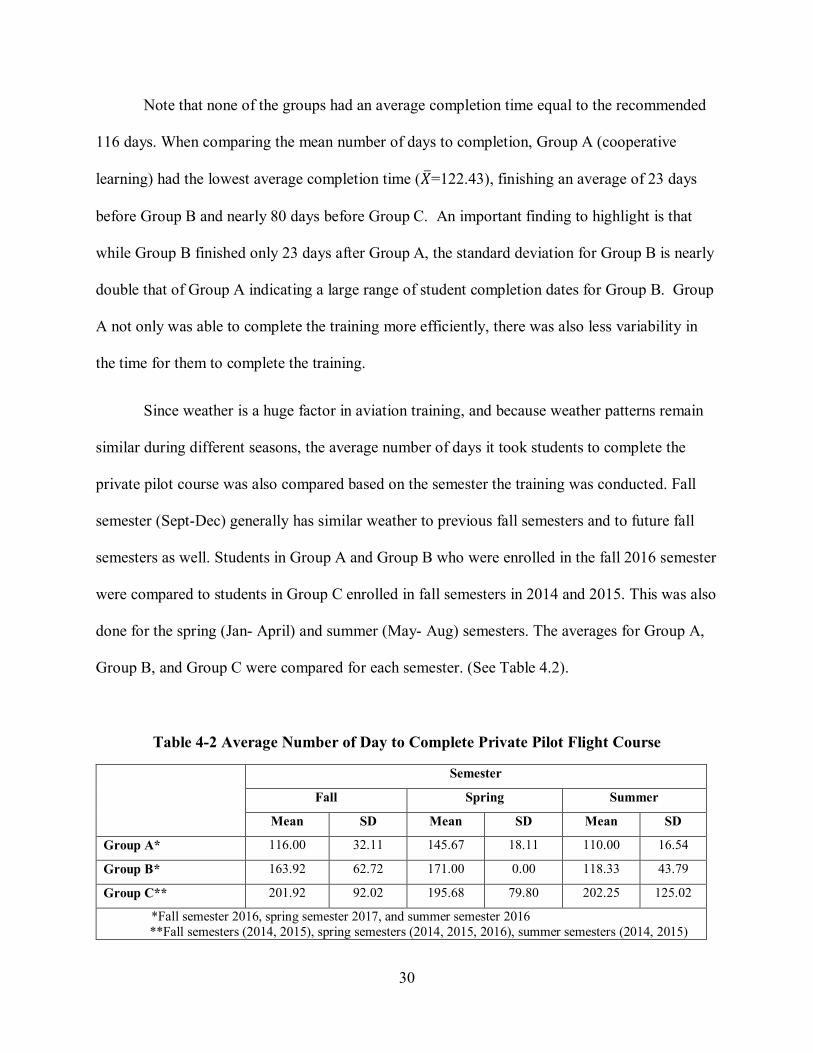
Note that none of the groups had an average completion time equal to the recommended
116 days. When comparing the mean number of days to completion, Group A (cooperative
learning) had the lowest average completion time (𝑋𝑋�=122.43), finishing an average of 23 days
before Group B and nearly 80 days before Group C. An important finding to highlight is that
while Group B finished only 23 days after Group A, the standard deviation for Group B is nearly
double that of Group A indicating a large range of student completion dates for Group B. Group
A not only was able to complete the training more efficiently, there was also less variability in
the time for them to complete the training.
Since weather is a huge factor in aviation training, and because weather patterns remain
similar during different seasons, the average number of days it took students to complete the
private pilot course was also compared based on the semester the training was conducted. Fall
semester (Sept-Dec) generally has similar weather to previous fall semesters and to future fall
semesters as well. Students in Group A and Group B who were enrolled in the fall 2016 semester
were compared to students in Group C enrolled in fall semesters in 2014 and 2015. This was also
done for the spring (Jan- April) and summer (May- Aug) semesters. The averages for Group A,
Group B, and Group C were compared for each semester. (See Table 4.2).
Table 4-2 Average Number of Day to Complete Private Pilot Flight Course
Semester
Fall Spring Summer
Mean SD Mean SD Mean SD
Group A* 116.00 32.11 145.67 18.11 110.00 16.54
Group B* 163.92 62.72 171.00 0.00 118.33 43.79
Group C** 201.92 92.02 195.68 79.80 202.25 125.02
*Fall semester 2016, spring semester 2017, and summer semester 2016 **Fall semesters (2014, 2015), spring semesters (2014, 2015, 2016), summer semesters (2014, 2015)

31
From Table 4.2 it is evident that students in the treatment group (Group A) finished more
quickly than the control groups in all three semesters. The standard deviation for Group A was
also smaller for each semester, with the exception of spring semester Group B in which there
was only one student and thus no standard deviation. It is interesting to note that during Fall and
Summer semester, the students in Group A, who were placed into cooperative crews, were able
to complete the private pilot course within the recommended 116-day timeframe. These two
semesters were the only two times in a timespan of almost three years that students were able to
complete the training in the recommended timeframe.
From the data provided in Table 4.1 it is evident that Group A was able to complete
course requirements in less days that Group B and Group C. To investigate specifics as to why
this might have happened, data was also collected to show the daily progress for each lesson
completed for each group to see if there was a particular part of the training that was more or less
efficient, thus impacting the time for completion. In Figure 4.1., the timeframe for completion
for each lesson was reported for each group to show the progress of the groups.

32
Figure 4-1 Average Days to Complete
In the methods section, it was noted that students in the 11 different crews that made up
Group A, met together as a group twice each week: once with a CFI and once as a study group.
The group meeting with the CFI lasted for about 2 hours in which the CFI went over all ground
knowledge needed for the next 4 flight lessons, questions were answered, and any reading was
assigned. The CFI also guided the group with instructions on what material to cover and what
study methods to use during the group study session. The group study session was at least one
hour during the week without the CFI, where students discussed concepts and helped each other
understand the material.
0
25
50
75
100
125
150
175
200
225St
art D
ate
Less
on 1
Less
on 2
Less
on 3
Less
on 4
Less
on 5
Less
on 6
Less
on 7
Less
on 8
Less
on 9
Less
on 1
0GLe
sson
10F
Less
on 1
1Le
sson
12
Less
on 1
3Le
sson
14
Less
on 1
5Le
sson
16
Less
on 1
7Le
sson
18
Less
on 1
9Le
sson
20G
Less
on 2
0FLe
sson
21
Less
on 2
2Le
sson
23
Less
on 2
4Le
sson
25G
Less
on 2
5FLe
sson
26
Group A vs Group B vs Group C
Group A Group B Group C

33
Figure 4.1 shows the daily progress of Group A compared to Group B and Group C.
Note that Group A and Group B have similar progress data until the start of Stage 3 (Lesson 21)
in which student in Group A quickly pass and finish an average of nearly 23 days less than
Group B. Group A compared to Group C shows a more drastic difference. The first four lessons
are nearly the same, yet Group A quickly separated from Group C and finished almost 78 days
prior to Group C. Overall there was a continual progression. Note that the main separation
between the groups was manifested starting with Lesson 21 and continued to slightly increase
steadily through Lesson 26 at which time there is a sizable gap between the groups. To examine
this time separation further, an investigation of how well students learned lesson content as
measured by the average number of lessons that needed to be repeated is presented in Research
Question #2.
Additionally, as flight stage checks are an important indication of progression, how long
it took students to complete each of these stage checks (lessons 10F, 20F and 25F) was also
investigated. The stage check lessons were used to check not only the knowledge of the student
but also the flight skills. A stage check was considered complete when the flight lesson was
complete. Figure 4.3 is a table showing the average number of days to complete each stage
check.
Table 4-3 Average Number of Days to Complete Stage Checks
Lesson 10F Lesson 20F Lesson 25F
Mean SD Mean SD Mean SD
Group A 44.13 12.08 87.09 17.45 118.17 28.28
Group B 49.00 13.13 93.36 27.74 139.77 57.04
Group C 65.55 30.97 134.09 54.31 192.74 89.50

34
Group A, on average, finished every stage check quicker than Group B or Group C. The
reason for this difference was greatly impacted by the numbers of times a lesson was repeated.
The data for lessons repeated will be presented in a later section. The groups completed Lesson
10F relatively close to each other, compared to Lesson 25F where Group A finished nearly 74
days before Group C. The standard deviation for Group A is also much smaller for all three stage
checks.
Findings for Research Question #2
To answer the second research question, data was collected to investigate whether the
incorporation of cooperative learning methods into instruction would affect the understanding of
each student throughout private pilot training as measured by the number of times a student had
to repeat a lesson. When a lesson was attempted, the student had to demonstrate adequate
knowledge and skill to complete the lesson. If the student did not meet the lesson standard the
lesson was repeated. The number of times each lesson was repeated was recorded to examine
whether cooperative learning hindered or improved understanding by either increasing or
decreasing the number of times a lesson was repeated.
Each lesson that was repeated delayed a students’ progress and meant that a student had
to fly an extra time to finish that lesson. Figure 4.2 shows the number of times each lesson taken
and then repeated for Group A, Group B and Group C. Note: As everyone has to take the lesson
a first time, all groups start with a value of one. For example, in Lesson 8, students in Group C
took the lesson a first time and then on average, had to repeat the lesson three more times for a
total of four lessons.
35
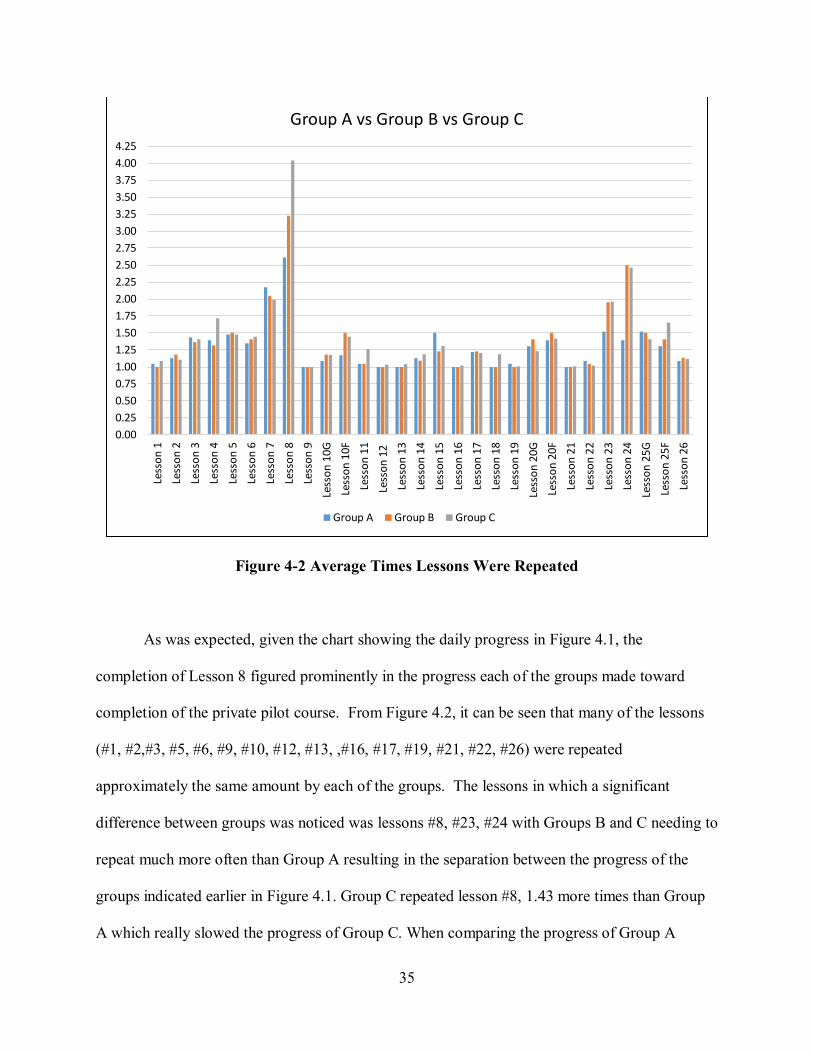
Figure 4-2 Average Times Lessons Were Repeated
As was expected, given the chart showing the daily progress in Figure 4.1, the
completion of Lesson 8 figured prominently in the progress each of the groups made toward
completion of the private pilot course. From Figure 4.2, it can be seen that many of the lessons
(#1, #2,#3, #5, #6, #9, #10, #12, #13, ,#16, #17, #19, #21, #22, #26) were repeated
approximately the same amount by each of the groups. The lessons in which a significant
difference between groups was noticed was lessons #8, #23, #24 with Groups B and C needing to
repeat much more often than Group A resulting in the separation between the progress of the
groups indicated earlier in Figure 4.1. Group C repeated lesson #8, 1.43 more times than Group
A which really slowed the progress of Group C. When comparing the progress of Group A
0.000.250.500.751.001.251.501.752.002.252.502.753.003.253.503.754.004.25
Less
on 1
Less
on 2
Less
on 3
Less
on 4
Less
on 5
Less
on 6
Less
on 7
Less
on 8
Less
on 9
Less
on 1
0GLe
sson
10F
Less
on 1
1Le
sson
12
Less
on 1
3Le
sson
14
Less
on 1
5Le
sson
16
Less
on 1
7Le
sson
18
Less
on 1
9Le
sson
20G
Less
on 2
0FLe
sson
21
Less
on 2
2Le
sson
23
Less
on 2
4Le
sson
25G
Less
on 2
5FLe
sson
26
Group A vs Group B vs Group C
Group A Group B Group C

36
compared to Group B, Lessons 8, 23 and 24 figured prominently in the separation of the two
groups.
Of the total 26 flight lessons, Group A repeated lessons less times than Group B and
Group C 42.3% of the time (11 flight lessons). This provides an indication that students that were
part of the cooperative crews of Group A were able to learn the ground lesson better, thus
repeating the lessons fewer times resulting in a more efficient completion of the training. That is
nearly double Group B, which repeated lessons less times than Group A and Group C six
different times (23.1%). Group C repeated lessons less than Group A and B five times (19.2%).
Of special note is lessons #7 and #15 which noticeably were repeated most by Group A.
The stage check lessons and the FAA practical test were particularly important to look at
because if a student had to repeat a stage check lesson or the FAA practical test, the students’
time to completion was negatively affected. Table 4.4 shows the number of times each stage
check and the FAA practical test were repeated.
Table 4-4 Average Times Stage Checks and Practical Test Were Repeated
Group A Group B Group C Mean 1.09 1.18 1.17 SD 0.29 0.50 0.38
Mean 1.17 1.50 1.45 SD 0.39 0.51 0.67
Mean 1.30 1.41 1.23 SD 0.56 0.59 0.45
Mean 1.39 1.50 1.42 SD 0.50 0.51 0.68
Mean 1.52 1.50 1.41 SD 0.79 0.60 0.65
Mean 1.30 1.41 1.65 SD 0.47 0.50 0.64
Mean 1.09 1.14 1.12 SD 0.29 0.35 0.35
37
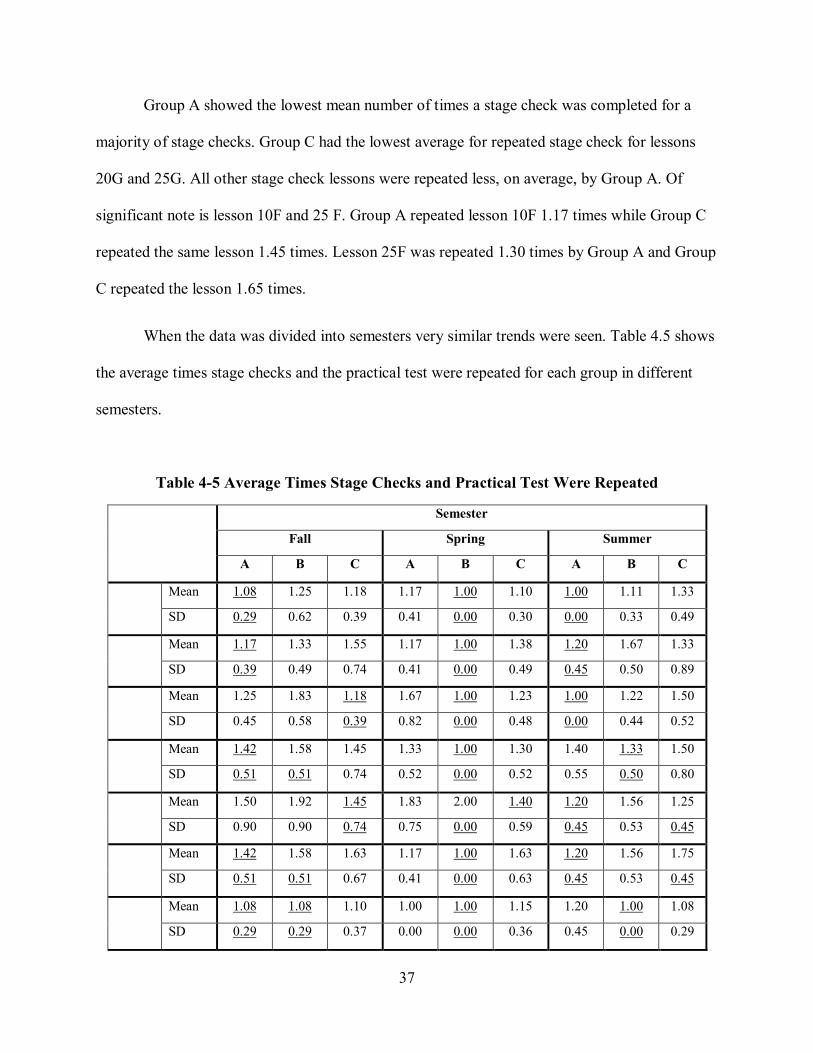
Group A showed the lowest mean number of times a stage check was completed for a
majority of stage checks. Group C had the lowest average for repeated stage check for lessons
20G and 25G. All other stage check lessons were repeated less, on average, by Group A. Of
significant note is lesson 10F and 25 F. Group A repeated lesson 10F 1.17 times while Group C
repeated the same lesson 1.45 times. Lesson 25F was repeated 1.30 times by Group A and Group
C repeated the lesson 1.65 times.
When the data was divided into semesters very similar trends were seen. Table 4.5 shows
the average times stage checks and the practical test were repeated for each group in different
semesters.
Table 4-5 Average Times Stage Checks and Practical Test Were Repeated
Semester
Fall Spring Summer
A B C A B C A B C
Mean 1.08 1.25 1.18 1.17 1.00 1.10 1.00 1.11 1.33
SD 0.29 0.62 0.39 0.41 0.00 0.30 0.00 0.33 0.49
Mean 1.17 1.33 1.55 1.17 1.00 1.38 1.20 1.67 1.33
SD 0.39 0.49 0.74 0.41 0.00 0.49 0.45 0.50 0.89
Mean 1.25 1.83 1.18 1.67 1.00 1.23 1.00 1.22 1.50
SD 0.45 0.58 0.39 0.82 0.00 0.48 0.00 0.44 0.52
Mean 1.42 1.58 1.45 1.33 1.00 1.30 1.40 1.33 1.50
SD 0.51 0.51 0.74 0.52 0.00 0.52 0.55 0.50 0.80
Mean 1.50 1.92 1.45 1.83 2.00 1.40 1.20 1.56 1.25
SD 0.90 0.90 0.74 0.75 0.00 0.59 0.45 0.53 0.45
Mean 1.42 1.58 1.63 1.17 1.00 1.63 1.20 1.56 1.75
SD 0.51 0.51 0.67 0.41 0.00 0.63 0.45 0.53 0.45
Mean 1.08 1.08 1.10 1.00 1.00 1.15 1.20 1.00 1.08
SD 0.29 0.29 0.37 0.00 0.00 0.36 0.45 0.00 0.29

38
Fall and summer show similarities in that Group A only repeated two lessons more times
than Group B or C. In nearly every case the smallest standard deviation is associated with the
lowest average of times a lesson was repeated. In summary, the number of times a lesson was
repeated was significant because this directly impacted the daily progress of the students and
thus resulted in a large difference between the groups in their time to completion. The students
of Group A that were put into crews and engaged in cooperative learning strategies during their
ground lessons as outlined by Johnson and Johnson (2016) had to repeat lessons less times that
Group B and Group C 42% of the time.
Findings for Research Question #3
The third research question investigated the amount of flight time a student had at the end
of the FAA practical test (Lesson 26). The FAA requires a minimum of 35 hours to complete the
private pilot certificate. The flight hours a student has after the FAA practical test directly
reflects how much money a student spends on the private pilot certificate. If incorporation of the
cooperative learning method into instruction were to reduce the total number of days to finish the
private pilot certificate but, in turn, increased the number of hours flown and the associated costs
therefore the cost, the cooperative learning method would not be a financially viable option.
Flight times were therefore compared.
Students must fly more when a lesson is not completed. In order to show that the
cooperative learning method would not increase flight time and therefore increase cost, the
average flight hours a student had after the completion of the FAA practical test (Lesson 26)
were recorded. Figure 4.3 shows the average number of flight hours between groups A, B and C.

39
Figure 4-3 Average Flight Hours
Group A has the lowest average number of flight hours (𝑋𝑋�=48.83). Group B is a close
second (𝑋𝑋�=50.03), but Group C averaged 57.24 flight hours which is more than 8 hours more
than Group A. The number of flight hours was also divided by semester. Fall semesters tend to
have the same type of weather that other fall semesters will have. This is true for spring and
summer too. The weather affects how often a student flies and for how long each flight is. Figure
4.4 shows the number of hours each group had divided up by semester.
48.83
50.03
57.24
46.00
48.00
50.00
52.00
54.00
56.00
58.00
Group A Group B Group C
Group A vs Group B vs Group C

40
Figure 4-4 Flight Hours per Semester
The flight hours showed a decrease in hours for Group A compared to Group C in all
three semesters. Summer Group B, however, showed less flight hours than both summer
semester Group A and C. Fall Group A had 46.08 flight hours, the lowest average number of
flight hours. In summary, students in Group A, that were placed in cooperative crews, were able
to complete Lesson 26, practical flight training in less time than students in Group B or Group C.
This provides a possible indication that the students working in the cooperative crews are not
only able to progress through their ground lessons more efficiently, but also in a manner that
enables them to need less flight hours to complete the final flight check.
49.27
55.4056.39
54.92
50.39
60.55
46.08
49.32
56.05
35.00
40.00
45.00
50.00
55.00
60.00
65.00
Group A(Spring2017)
Group B(Spring2017)
Group C(Spring'14 '15
'16)
Group A(Summer
2016)
Group B(Summer
2016)
Group C(Summer'14 '15)
Group A(Fall
2016)
Group B(Fall
2016)
Group C(Fall '14
'15)
Group A vs Group B vs Group C

41
5 SUMMARY, DISCUSSION, CONCLUSIONS AND RECOMMENDATIONS
Given the current shortage of commercial pilots, and given that increased requirements
and regulations are resulting in increased time for students to complete their commercial pilot
certifications, instructors at flight schools must look for opportunities to decrease the time it
takes for students to finish training. The purpose of this research study is to investigate whether
changing the primary method of ground instruction from traditional, individualized learning to
one that incorporates cooperative learning strategies will potentially reduce the time it takes for
UVU flight students to complete the private pilot certificate as measured by 1) the time it took to
complete the private pilot certificate, 2) the number of times lessons were repeated during private
pilot training and 3) the number of flight hours a student had after private pilot licensure.
Summary and Discussion Relevant to Research Question #1
In research question #1, data was collected from the three groups of students (Group A,
Group B, Group C) to determine if putting students into a cooperative group classroom situation
for ground instruction could reduce the number of days needed for students to complete the
private pilot certificate. The findings indicate that the 23 students in Group A that were placed
into 11 cooperative crews consisting of 2-4 students that met together twice each week with their
CFI or to study together, were able to complete the requirements for private pilot license more

42
efficiently than the students in Group B and Group C that were engaged in individualized
learning environments.
Group A was not only able to complete the training more efficiently, there was also less
variability in the time for them to complete the training when compared to Group B and Group
C. Additionally, when investigating individual semesters to account for possible variances in the
data due to weather patterns and students not being able to fly, Group A was also able to
progress more rapidly toward completion of certification in each of the semesters (Spring,
Summer, Fall) investigated.
One possible explanation of this difference is that students participating in the
cooperative crews of Group A were required to progress through the ground lessons together as
outlined by Johnson, Johnson and Stanne (2000) as being a necessary component of successful
cooperative groups. It is also interesting to note that the separation between the groups
manifested starting with Lesson 21 and continued to slightly increase steadily through Lesson 26
at which time there is a sizable gap between the groups This provides some indication that it
took the crews some time to fully implement cooperative learning strategies and realize their
benefits.
As students in Group A, working in cooperative crews during the Spring and Summer
semesters, were the only groups of students in the last three years able to finish certification
within the recommended 116-day timeframe, another conclusion is that the only way students
can meet the goals as outline by the university, is if they help each other. Data from this study
would indicate that if students continue to operate in an individualized goal structure, it is not
realistic that they will be able to complete the private pilot certification in the recommended time
frame as outlined by university personnel. The university administrators and instructors should

43
consider having students working cooperative groups to complete certification or rethink the
timeframe for completion.
Summary and Discussion Relevant to Research Question #2
In research question #2, data was collected from the three groups of students (Group A,
Group B, Group C) to determine if putting students into a cooperative group classroom situation
for ground instruction would result in better understanding of the course material by the students
and thus result in fewer lessons needing to be repeated. Decreasing the time it took to complete
the private pilot certificate is a great accomplishment, unless the students are not understanding
concepts. Understanding concepts, subject matter and developing skills are far more important
than completion of an exam but completion of the FAA practical exam was the final standard in
determining a students’ understanding. Research question #2 examined the number of times
students repeated lessons. The lessons were repeated if a student did not understand the material
required by that lesson. Emphasis was placed on the stage checks (Lessons 10, 20 and 25) and
the FAA practical test (Lesson 26) because these lessons were in test conditions, demonstrating a
students’ understanding. A lack of repeated lessons and stage checks shows that a student
understands the skills and information required.
The findings from this study demonstrate that students working in the cooperative crews
of Group A understood the material in the private pilot flight course at Utah Valley University
better than Group B and C as measured by the number of times they needed to repeat lessons. In
most cases, the average number of times a lesson was repeated was less in Group A than in
Group B and C. The indication is that the individual accountability needed for a successful
incorporation of cooperative learning strategies enabled the students to check each other’s
understanding of the material and not only complete the lessons quicker but also pass the FAA

44
private pilot practical exam more efficiently than students in the individualized learning
environments.
Summary and Discussion Relevant to Research Question #3
In research question #3, data was collected from the three groups of students (Group A,
Group B, Group C) to determine if putting students into a cooperative group classroom situation
for ground instruction might reduce the number of flight hours needed for students to complete
the private pilot certificate. Research question #3 indirectly addresses the concern of training
cost. Although a pilot is trying to build hours to become completely certified, each hour has a
cost. During training the cost falls on the student pilot. After training, but before completing
certification a pilot must build more hours. The cost of the time building hours usually falls on an
employer. Therefore reducing the flight hours during training reduces cost to the student pilot.
Research question #3 investigated if the number of flight hours a student had after the
completion of the FAA practical test (Lesson 26) were reduced when using the experimental
method.
Group A had the lowest flight hours compared to Group B and Group C. Cooperative
learning reduced the number of flight hours it took to complete the FAA private pilot certificate.
By reducing the hours spent in an aircraft, cooperative learning also lowered the cost of the
private pilot flight course. In summary, students in Group A, that were placed in cooperative
crews, were able to complete Lesson 26, practical flight training in less time than students in
Group B or Group C. This provides a possible indication that the students working in the
cooperative crews are able to progress through their lessons, not only more efficiently, but also
in a manner that enables them to need less flight hours to complete the final flight check.
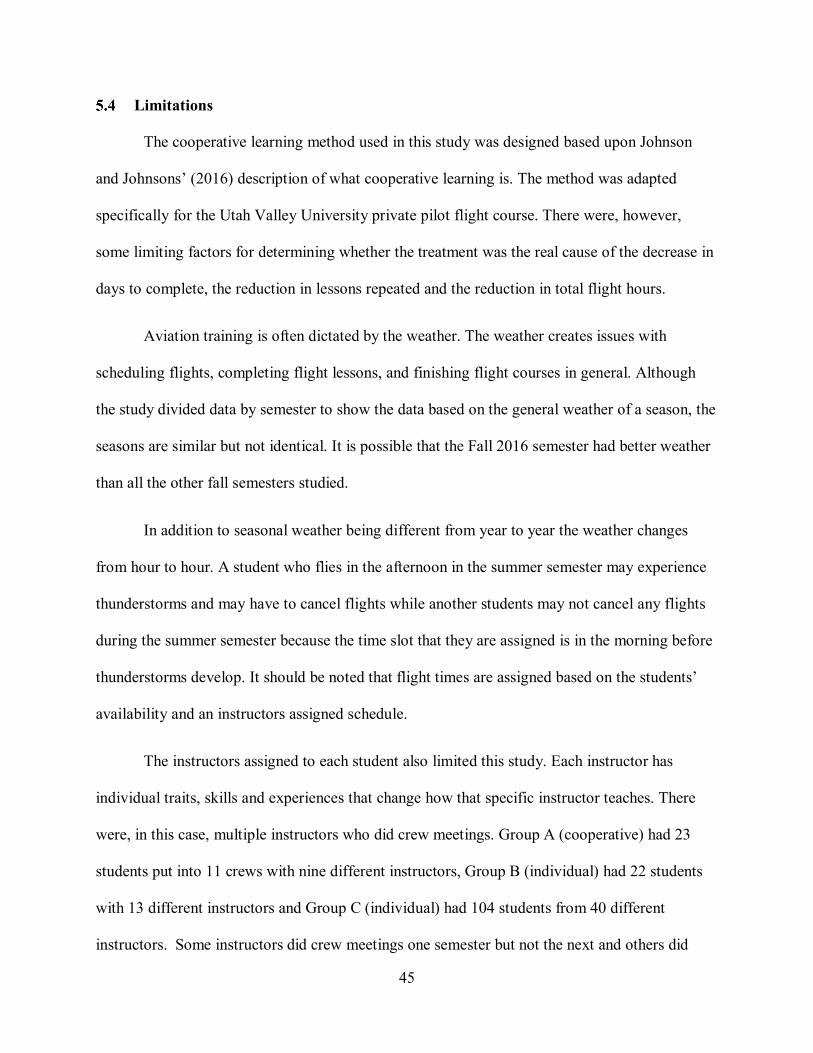
45
Limitations
The cooperative learning method used in this study was designed based upon Johnson
and Johnsons’ (2016) description of what cooperative learning is. The method was adapted
specifically for the Utah Valley University private pilot flight course. There were, however,
some limiting factors for determining whether the treatment was the real cause of the decrease in
days to complete, the reduction in lessons repeated and the reduction in total flight hours.
Aviation training is often dictated by the weather. The weather creates issues with
scheduling flights, completing flight lessons, and finishing flight courses in general. Although
the study divided data by semester to show the data based on the general weather of a season, the
seasons are similar but not identical. It is possible that the Fall 2016 semester had better weather
than all the other fall semesters studied.
In addition to seasonal weather being different from year to year the weather changes
from hour to hour. A student who flies in the afternoon in the summer semester may experience
thunderstorms and may have to cancel flights while another students may not cancel any flights
during the summer semester because the time slot that they are assigned is in the morning before
thunderstorms develop. It should be noted that flight times are assigned based on the students’
availability and an instructors assigned schedule.
The instructors assigned to each student also limited this study. Each instructor has
individual traits, skills and experiences that change how that specific instructor teaches. There
were, in this case, multiple instructors who did crew meetings. Group A (cooperative) had 23
students put into 11 crews with nine different instructors, Group B (individual) had 22 students
with 13 different instructors and Group C (individual) had 104 students from 40 different
instructors. Some instructors did crew meetings one semester but not the next and others did

46
crew meetings all three semesters. The instructors teaching skill level is a variable that could not
be controlled. However, because flight instructors take standardized exams to become instructors
and because the UVU flight program sends all flight instructors hired, regardless of previous
experience, through a standardization course, uniformity is created between instructors. The
standardization course includes training on the syllabus, course materials, teaching methods, and
other topics to make sure that training is consistent between instructors. This standardization is
industry practice and because of this rigorous training each flight instructor is considered similar.
Therefore, for this study one of the assumptions that needs to be contemplated is that each
instructor was considered the same.
Another factor to consider it that the flight instructor job, in general, is a time building
job. It is designed to build a pilots’ hours to allow that CFI to be hirable by a regional airline.
When an instructor moves on, is let go, or quits for any reason, the students assigned to that
instructor are reassigned and training continues right where it was left off. The transition from
one flight instructor to another can take time, slowing the progress of the student. The length of
time it took to change instructors was not recorded in the previous years (Group C) and
therefore, was not recorded for Group A or Group B either. If this happened in Group A, the
crew was kept together under a different instructor or, if the crew was split up, the students were
moved to Group B. This happened to two crews, one was able to remain in Group A and the
other was moved to Group B.
Although the results of this study show a reduction of time in the training of private pilots
at Utah Valley University, it would be difficult to generalize any conclusions for the entire
aviation training industry. The specificity of the sample sizes in the study create a unique
situation that should be studied further before generalized conclusions are made. The small

47
number of students studied alone would be cause to delay generalization of the conclusions of
this study. Flight schools with similar curriculum and sample sizes to that found in this study
should carefully study the methods used, and conclusions presented before determining if the
incorporation of cooperative lerning strategies would be an efficient way to conduct private pilot
flight training in their school.
Because the students in this research study were aware that they were participating in a
new instructional method that was being studied the Hawthorne effect should also be considered
when generalizing the results of this study. It should be noted that private pilot students are new
to flight training so they had no preconceived notions as to whether the training should be
individualized or cooperative and that they were not informed if they were in the treatment or
control group.
In addition to the students working harder during the study, the CFI’s conducting the
training could have also worked harder resulting in some experimenter effect. The CFI’s using
cooperative learning methods with their students knew the traditional way of training and knew
that cooperative learning was different. They knew that the study was being done by a coworker.
This could have caused the CFI’s to work harder.
Finally, the small sample size that was available and the lack of the ability to randomly
select and then randomly assign students to treatment and control groups limited the depth of this
study. Statistical significance was not calculated because of the small sample size and therefore
the ability to generalize this study to other populations becomes more difficult. To help
strengthen the results of this study, the treatment group was compared to a control group of the
same size and timeframe and to students that had completed the same training the previous two
years. Unfortunately, because groups were formed based upon availability and convenience and
48
not on random assignment, those attempting to generalize the result of this study to similar
training programs should be cautious. The results from this study are promising, but far from
conclusive.
Major Conclusions
As the pilot shortage continues in the US, steps need to be taken to decrease the time it
takes to train pilots. The findings of this study preliminarily indicate that the incorporation of
cooperative learning strategies is potentially an effective way to train private pilots at Utah
Valley University. The incorporation of cooperative learning strategies decreased the time it took
to train private pilots without hindering the understanding of students. The results of this study
parallel the findings of the meta-analysis conducted by Johnson, Johnson and Stanne (2000) who
found that when implemented properly, students engaged in cooperative learning environments
consistently outperformed students in individualistic learning environments in academic
measures.
Recommendations
Given the findings of this study, it is recommended that UVU consider the adoption of
cooperative learning crews into the course description and curriculum, requiring students to
participate fully and completely in cooperative learning during ground instruction. A full
implementation of the cooperative learning method would help students succeed at a faster pace,
allowing for other advanced training to be started on time.
If private pilot certification is completed on time, flight training for the flight courses
after private pilot may then be started on time. However, these advanced flight courses also must

49
finish on time to reduce training time altogether. In order to reduce the other flight courses to
only one semester cooperative learning should be implemented for all other flight courses. Test
groups could be used for each flight course to further research and determine the effectiveness of
cooperative learning for advanced flight courses.
Applying cooperative learning at UVU for all flight courses would help UVU increase
the number of pilots that are training in the UVU aviation program. However, UVU cannot
single handedly offset the pilot shortage in the US. More research should be done at other
university flight programs as well as other non-collegiate flight schools concerning the
effectiveness of cooperative learning methods and flight training.

50
REFERENCES
"The Coming U.S Pilot Shortage Is Real.". 2015 Aviation Week & Space Technology (February 16): 3/2/16 (accessed 3/2/16).
Ferris, H. 2015. "The Use of Small Group Tutorials as an Educational Strategy in Medical Education." International Journal of Higher Education 4, no. 2: 225-228.
Gordon, J. 2003. "ABC of learning and teaching in medicine One to one teaching and feedback." British Medical Journal 326: 543.
Humphreys, B., Johnson, R., & Johnson, D. (1982). Effects of cooperative, competitive, and individualistic learning on students’ achievement in science class. Journal of Research in Science Teaching,19, 357-365.
Johnson, D. W. and Johnson, R. T. "An Overview of Cooperative Learning." co-operation.org (accessed 04/15, 2016).
Johnson, D. W. Johnson, R. T. and Stanne M. B. 2000. "Coopertive Learning Methods: A Meta-Analysis.", University of Minnesota. researchgate.net.
Maceiras, R., et al. 2011. "Experience of Cooperative Learning in Engineering." European Journal of Engineering Education 36, no. 1: 13-19.
Mohammadjani, F. and Tonkaboni F. 2015. "A Comparison between the Effect of Cooperative Learning Teaching Method and Lecture Teaching Method on Students' Learning and Satisfaction Level." International Education Studies 8, no. 9: 107-112.
Prentice, B. and Gouel, P. 2016. "Pilto Shortage Threatens To Slow U.S. Airline Growth." Forbes (January 28, 2016): 3/2/16 (accessed March 3, 2016).
Sutherland, J. Interview by Author. Provo, Utah, May 3, 2016
Swelbar, W. S. 2014. "Yes, There Is A Pilot Shortage." Aviation Week & Space Technology 176, no. 35: 58.

51
APPENDIX A
A-1 D
ays t
o Com
plete
Lesso
n#
Crew
Mee
tings
Start
Date
Lesso
n 1Le
sson 2
Lesso
n 3Le
sson 4
Lesso
n 5 L
esso
n 6Po
pulat
ion Av
erag
e14
91.0
05.5
89.0
713
.7519
.3824
.1628
.48Al
l of G
roup
A23
Yes
1.00
4.52
8.65
12.39
17.43
21.48
24.91
Stand
ard De
viatio
n Gro
up A
0.00
3.87
6.51
6.83
9.70
10.56
10.90
Grou
p B an
d C12
6No
1.00
5.78
9.14
14.00
19.73
24.65
29.13
Grou
p B22
No1.0
03.2
75.9
510
.5014
.9119
.3222
.41Sta
ndard
Devia
tion G
roup
B0.0
02.0
52.8
05.1
09.1
510
.5811
.02Gr
oup C
104N
o1.0
06.3
19.8
214
.7420
.7525
.7830
.56Sta
ndard
Devia
tion G
roup
C0.0
05.1
15.3
86.4
27.5
59.1
910
.82
Grou
p A (S
pring
2017
)6Y
es1.0
08.1
715
.6720
.0027
.6732
.0036
.17Sta
ndard
Devia
tion (
Grou
p A Sp
2017
)0.0
05.9
89.0
08.1
014
.1415
.5915
.48Gr
oup B
(Spr
ing)
1No
1.00
1.00
3.00
24.00
52.00
57.00
61.00
Stand
ard De
viatio
n (Gr
oup B
Sp 20
17)
0.00
0.00
0.00
0.00
0.00
0.00
0.00
Grou
p C (S
pring
)43
No1.0
06.8
310
.5114
.9522
.4427
.4132
.41Sta
ndard
Devia
tion (
Grou
p C Sp
ring)
0.00
5.26
5.03
5.89
7.68
9.53
9.70
Grou
p A (S
umme
r 201
6)5Y
es1.0
02.8
07.2
010
.4013
.4017
.6021
.60Sta
ndard
Devia
tion (
Grou
p A Su
2016
)0.0
00.4
53.4
93.6
52.5
15.5
56.6
9Gr
oup B
(Sum
mer)
9No
1.00
4.00
6.67
11.11
13.78
18.78
22.00
Stand
ard De
viatio
n (Gr
oup B
Su 20
16)
0.00
1.32
2.12
3.95
3.42
7.29
7.81
Grou
p C (S
umme
r)13
No1.0
05.1
79.1
712
.5019
.0824
.7528
.67Sta
ndard
Devia
tion (
Grou
p C Su
mmer
)0.0
04.6
16.9
87.2
28.2
110
.6312
.15
Grou
p A (F
all 20
16)
12Ye
s1.0
03.4
25.7
59.4
214
.0017
.8320
.67Sta
ndard
Devia
tion (
Grou
p A Fa
2016
)0.0
01.9
32.5
33.9
64.2
04.4
34.3
3Gr
oup B
(Fall
)12
No1.0
02.9
25.6
78.9
212
.6716
.5819
.50Sta
ndard
Devia
tion (
Grou
p B Fa
2016
)0.0
02.3
93.2
34.3
24.4
46.1
36.5
4Gr
oup C
(Fall
)48
No1.0
06.1
09.2
714
.5719
.2924
.1829
.06Sta
ndard
Devia
tion (
Grou
p C Fa
ll)0.0
05.1
95.2
55.9
16.5
68.0
211
.10
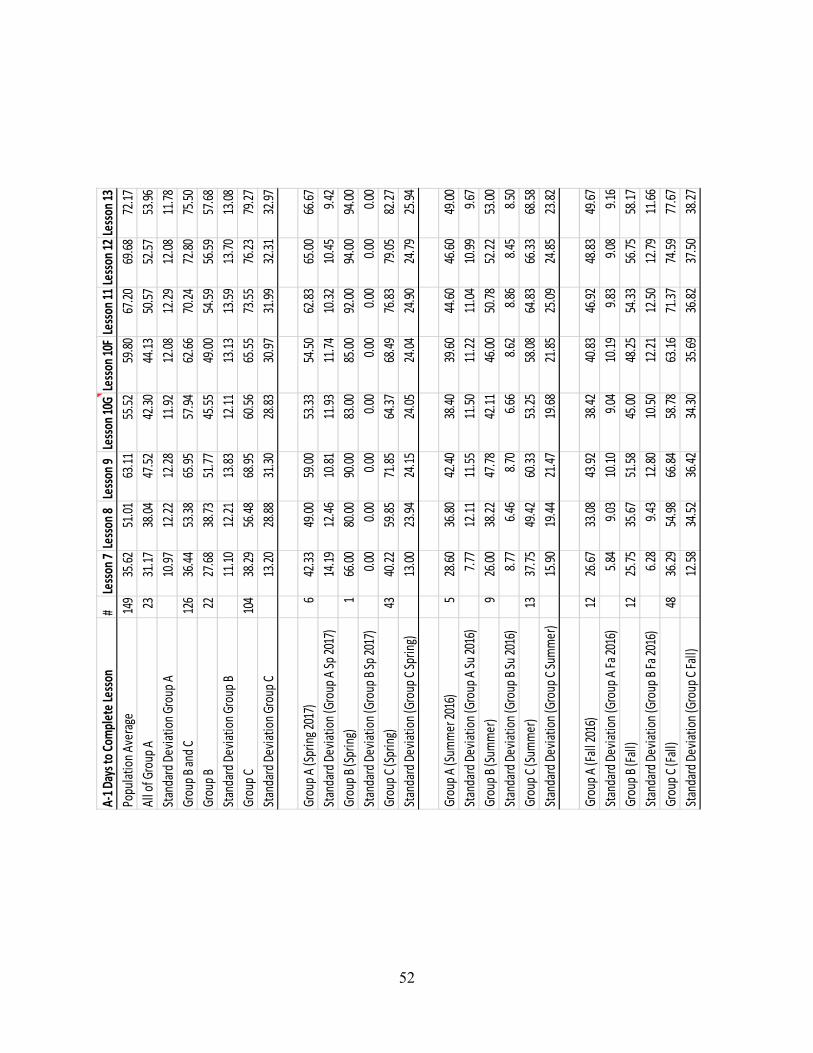
52
A-1 D
ays t
o Com
plete
Lesso
n#
Lesso
n 7Le
sson 8
Lesso
n 9Le
sson 1
0GLe
sson 1
0FLe
sson 1
1Les
son 1
2Les
son 1
3Po
pulat
ion Av
erag
e14
935
.6251
.0163
.1155
.5259
.8067
.2069
.6872
.17Al
l of G
roup
A23
31.17
38.04
47.52
42.30
44.13
50.57
52.57
53.96
Stand
ard De
viatio
n Gro
up A
10.97
12.22
12.28
11.92
12.08
12.29
12.08
11.78
Grou
p B an
d C12
636
.4453
.3865
.9557
.9462
.6670
.2472
.8075
.50Gr
oup B
2227
.6838
.7351
.7745
.5549
.0054
.5956
.5957
.68Sta
ndard
Devia
tion G
roup
B11
.1012
.2113
.8312
.1113
.1313
.5913
.7013
.08Gr
oup C
104
38.29
56.48
68.95
60.56
65.55
73.55
76.23
79.27
Stand
ard De
viatio
n Gro
up C
13.20
28.88
31.30
28.83
30.97
31.99
32.31
32.97
Grou
p A (S
pring
2017
)6
42.33
49.00
59.00
53.33
54.50
62.83
65.00
66.67
Stand
ard De
viatio
n (Gr
oup A
Sp 20
17)
14.19
12.46
10.81
11.93
11.74
10.32
10.45
9.42
Grou
p B (S
pring
)1
66.00
80.00
90.00
83.00
85.00
92.00
94.00
94.00
Stand
ard De
viatio
n (Gr
oup B
Sp 20
17)
0.00
0.00
0.00
0.00
0.00
0.00
0.00
0.00
Grou
p C (S
pring
)43
40.22
59.85
71.85
64.37
68.49
76.83
79.05
82.27
Stand
ard De
viatio
n (Gr
oup C
Sprin
g)13
.0023
.9424
.1524
.0524
.0424
.9024
.7925
.94
Grou
p A (S
umme
r 201
6)5
28.60
36.80
42.40
38.40
39.60
44.60
46.60
49.00
Stand
ard De
viatio
n (Gr
oup A
Su 20
16)
7.77
12.11
11.55
11.50
11.22
11.04
10.99
9.67
Grou
p B (S
umme
r)9
26.00
38.22
47.78
42.11
46.00
50.78
52.22
53.00
Stand
ard De
viatio
n (Gr
oup B
Su 20
16)
8.77
6.46
8.70
6.66
8.62
8.86
8.45
8.50
Grou
p C (S
umme
r)13
37.75
49.42
60.33
53.25
58.08
64.83
66.33
68.58
Stand
ard De
viatio
n (Gr
oup C
Summ
er)
15.90
19.44
21.47
19.68
21.85
25.09
24.85
23.82
Grou
p A (F
all 20
16)
1226
.6733
.0843
.9238
.4240
.8346
.9248
.8349
.67Sta
ndard
Devia
tion (
Grou
p A Fa
2016
)5.8
49.0
310
.109.0
410
.199.8
39.0
89.1
6Gr
oup B
(Fall
)12
25.75
35.67
51.58
45.00
48.25
54.33
56.75
58.17
Stand
ard De
viatio
n (Gr
oup B
Fa 20
16)
6.28
9.43
12.80
10.50
12.21
12.50
12.79
11.66
Grou
p C (F
all)
4836
.2954
.9866
.8458
.7863
.1671
.3774
.5977
.67Sta
ndard
Devia
tion (
Grou
p C Fa
ll)12
.5834
.5236
.4234
.3035
.6936
.8237
.5038
.27
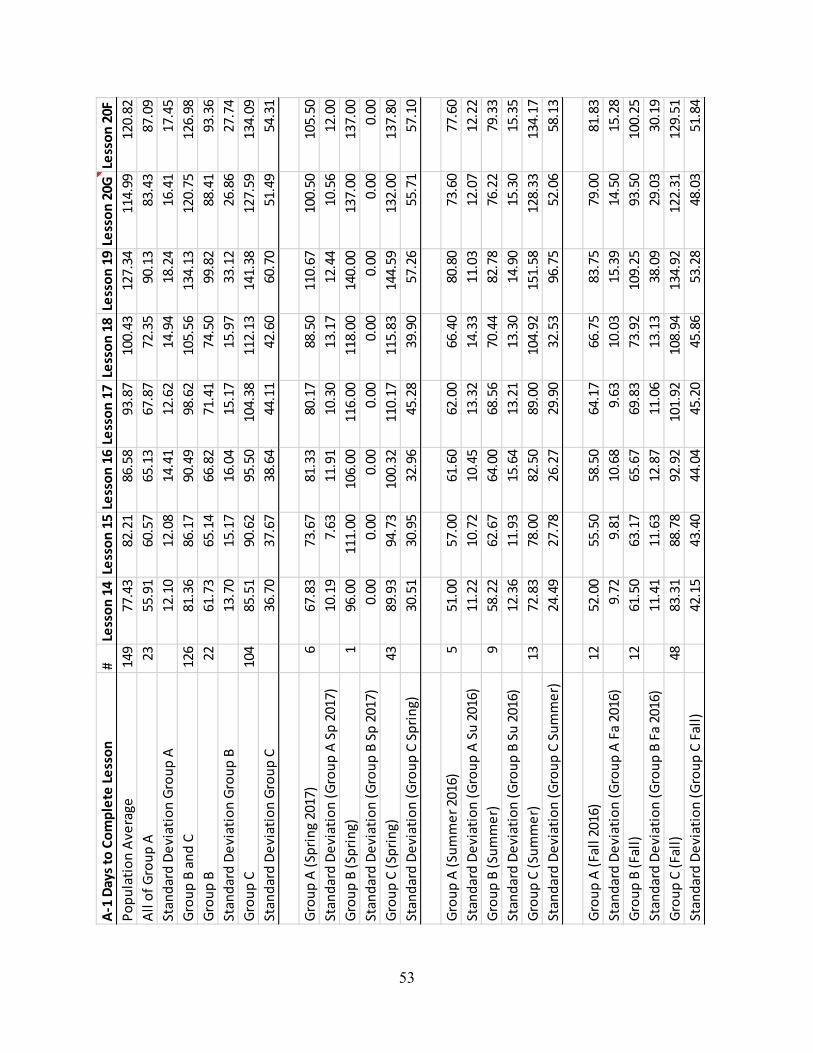
53
A-1
Days
to C
ompl
ete
Less
on#
Less
on 1
4Le
sson
15
Less
on 1
6Le
sson
17
Less
on 1
8Le
sson
19
Less
on 2
0GLe
sson
20F
Popu
latio
n Av
erag
e14
977
.43
82.2
186
.58
93.8
710
0.43
127.
3411
4.99
120.
82Al
l of G
roup
A23
55.9
160
.57
65.1
367
.87
72.3
590
.13
83.4
387
.09
Stan
dard
Dev
iatio
n Gr
oup
A12
.10
12.0
814
.41
12.6
214
.94
18.2
416
.41
17.4
5Gr
oup
B an
d C
126
81.3
686
.17
90.4
998
.62
105.
5613
4.13
120.
7512
6.98
Grou
p B
2261
.73
65.1
466
.82
71.4
174
.50
99.8
288
.41
93.3
6St
anda
rd D
evia
tion
Grou
p B
13.7
015
.17
16.0
415
.17
15.9
733
.12
26.8
627
.74
Grou
p C
104
85.5
190
.62
95.5
010
4.38
112.
1314
1.38
127.
5913
4.09
Stan
dard
Dev
iatio
n Gr
oup
C36
.70
37.6
738
.64
44.1
142
.60
60.7
051
.49
54.3
1
Grou
p A
(Spr
ing
2017
)6
67.8
373
.67
81.3
380
.17
88.5
011
0.67
100.
5010
5.50
Stan
dard
Dev
iatio
n (G
roup
A S
p 20
17)
10.1
97.
6311
.91
10.3
013
.17
12.4
410
.56
12.0
0Gr
oup
B (S
prin
g)1
96.0
011
1.00
106.
0011
6.00
118.
0014
0.00
137.
0013
7.00
Stan
dard
Dev
iatio
n (G
roup
B S
p 20
17)
0.00
0.00
0.00
0.00
0.00
0.00
0.00
0.00
Grou
p C
(Spr
ing)
4389
.93
94.7
310
0.32
110.
1711
5.83
144.
5913
2.00
137.
80St
anda
rd D
evia
tion
(Gro
up C
Spr
ing)
30.5
130
.95
32.9
645
.28
39.9
057
.26
55.7
157
.10
Grou
p A
(Sum
mer
201
6)5
51.0
057
.00
61.6
062
.00
66.4
080
.80
73.6
077
.60
Stan
dard
Dev
iatio
n (G
roup
A S
u 20
16)
11.2
210
.72
10.4
513
.32
14.3
311
.03
12.0
712
.22
Grou
p B
(Sum
mer
)9
58.2
262
.67
64.0
068
.56
70.4
482
.78
76.2
279
.33
Stan
dard
Dev
iatio
n (G
roup
B S
u 20
16)
12.3
611
.93
15.6
413
.21
13.3
014
.90
15.3
015
.35
Grou
p C
(Sum
mer
)13
72.8
378
.00
82.5
089
.00
104.
9215
1.58
128.
3313
4.17
Stan
dard
Dev
iatio
n (G
roup
C S
umm
er)
24.4
927
.78
26.2
729
.90
32.5
396
.75
52.0
658
.13
Grou
p A
(Fal
l 201
6)12
52.0
055
.50
58.5
064
.17
66.7
583
.75
79.0
081
.83
Stan
dard
Dev
iatio
n (G
roup
A F
a 20
16)
9.72
9.81
10.6
89.
6310
.03
15.3
914
.50
15.2
8Gr
oup
B (F
all)
1261
.50
63.1
765
.67
69.8
373
.92
109.
2593
.50
100.
25St
anda
rd D
evia
tion
(Gro
up B
Fa
2016
)11
.41
11.6
312
.87
11.0
613
.13
38.0
929
.03
30.1
9Gr
oup
C (F
all)
4883
.31
88.7
892
.92
101.
9210
8.94
134.
9212
2.31
129.
51St
anda
rd D
evia
tion
(Gro
up C
Fal
l)42
.15
43.4
044
.04
45.2
045
.86
53.2
848
.03
51.8
4
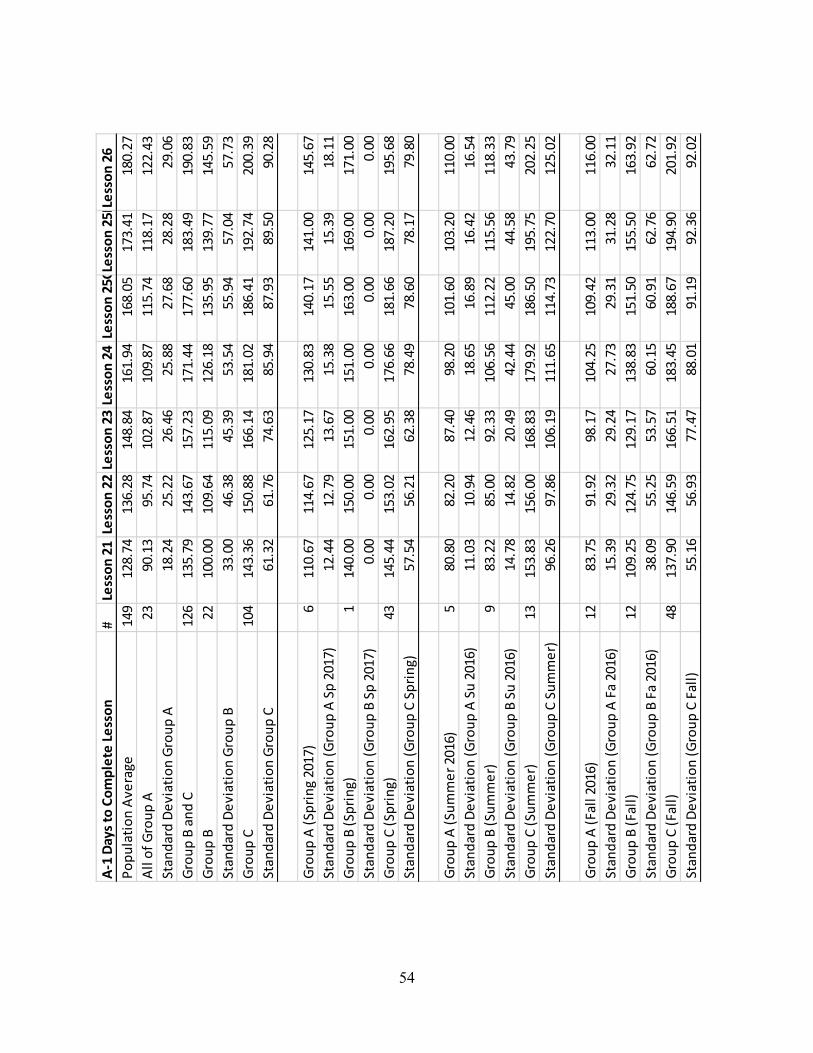
54
A-1
Days
to C
ompl
ete
Less
on#
Less
on 2
1Le
sson
22
Less
on 2
3Le
sson
24
Less
on 2
5GLe
sson
25F
Less
on 2
6Po
pula
tion
Aver
age
149
128.
7413
6.28
148.
8416
1.94
168.
0517
3.41
180.
27Al
l of G
roup
A23
90.1
395
.74
102.
8710
9.87
115.
7411
8.17
122.
43St
anda
rd D
evia
tion
Grou
p A
18.2
425
.22
26.4
625
.88
27.6
828
.28
29.0
6Gr
oup
B an
d C
126
135.
7914
3.67
157.
2317
1.44
177.
6018
3.49
190.
83Gr
oup
B22
100.
0010
9.64
115.
0912
6.18
135.
9513
9.77
145.
59St
anda
rd D
evia
tion
Grou
p B
33.0
046
.38
45.3
953
.54
55.9
457
.04
57.7
3Gr
oup
C10
414
3.36
150.
8816
6.14
181.
0218
6.41
192.
7420
0.39
Stan
dard
Dev
iatio
n Gr
oup
C61
.32
61.7
674
.63
85.9
487
.93
89.5
090
.28
Grou
p A
(Spr
ing
2017
)6
110.
6711
4.67
125.
1713
0.83
140.
1714
1.00
145.
67St
anda
rd D
evia
tion
(Gro
up A
Sp
2017
)12
.44
12.7
913
.67
15.3
815
.55
15.3
918
.11
Grou
p B
(Spr
ing)
114
0.00
150.
0015
1.00
151.
0016
3.00
169.
0017
1.00
Stan
dard
Dev
iatio
n (G
roup
B S
p 20
17)
0.00
0.00
0.00
0.00
0.00
0.00
0.00
Grou
p C
(Spr
ing)
4314
5.44
153.
0216
2.95
176.
6618
1.66
187.
2019
5.68
Stan
dard
Dev
iatio
n (G
roup
C S
prin
g)57
.54
56.2
162
.38
78.4
978
.60
78.1
779
.80
Grou
p A
(Sum
mer
201
6)5
80.8
082
.20
87.4
098
.20
101.
6010
3.20
110.
00St
anda
rd D
evia
tion
(Gro
up A
Su
2016
)11
.03
10.9
412
.46
18.6
516
.89
16.4
216
.54
Grou
p B
(Sum
mer
)9
83.2
285
.00
92.3
310
6.56
112.
2211
5.56
118.
33St
anda
rd D
evia
tion
(Gro
up B
Su
2016
)14
.78
14.8
220
.49
42.4
445
.00
44.5
843
.79
Grou
p C
(Sum
mer
)13
153.
8315
6.00
168.
8317
9.92
186.
5019
5.75
202.
25St
anda
rd D
evia
tion
(Gro
up C
Sum
mer
)96
.26
97.8
610
6.19
111.
6511
4.73
122.
7012
5.02
Grou
p A
(Fal
l 201
6)12
83.7
591
.92
98.1
710
4.25
109.
4211
3.00
116.
00St
anda
rd D
evia
tion
(Gro
up A
Fa
2016
)15
.39
29.3
229
.24
27.7
329
.31
31.2
832
.11
Grou
p B
(Fal
l)12
109.
2512
4.75
129.
1713
8.83
151.
5015
5.50
163.
92St
anda
rd D
evia
tion
(Gro
up B
Fa
2016
)38
.09
55.2
553
.57
60.1
560
.91
62.7
662
.72
Grou
p C
(Fal
l)48
137.
9014
6.59
166.
5118
3.45
188.
6719
4.90
201.
92St
anda
rd D
evia
tion
(Gro
up C
Fal
l)55
.16
56.9
377
.47
88.0
191
.19
92.3
692
.02

55
A-2
Num
ber o
f Tim
es R
epea
ted
#Cr
ew M
eetin
gsLe
sson
1Le
sson
2Le
sson
3Le
sson
4Le
sson
5Le
sson
6Le
sson
7Le
sson
8Le
sson
9Po
pula
tion
Aver
age
149
1.07
1.12
1.41
1.61
1.48
1.43
2.03
3.70
1.00
All o
f Gro
up A
23Ye
s1.
041.
131.
431.
391.
481.
352.
172.
611.
00St
anda
rd D
evia
tion
Grou
p A
0.21
0.46
0.90
0.66
0.59
0.57
1.53
1.47
0.00
Grou
p B
and
C12
6N
o1.
071.
121.
401.
651.
481.
442.
003.
901.
00Gr
oup
B22
No
1.00
1.18
1.36
1.32
1.50
1.41
2.05
3.23
1.00
Stan
dard
Dev
iatio
n Gr
oup
B0.
000.
500.
730.
480.
740.
590.
792.
020.
00Gr
oup
C10
4N
o1.
091.
111.
411.
721.
481.
451.
994.
041.
00St
anda
rd D
evia
tion
Grou
p C
0.32
0.31
0.58
0.85
0.68
0.70
1.05
3.12
0.00
Grou
p A
(Spr
ing
2017
)6
Yes
1.17
1.33
2.00
2.17
1.67
1.67
2.00
1.67
1.00
Stan
dard
Dev
iatio
n (G
roup
A S
p 20
17)
0.41
0.82
1.55
0.75
0.52
0.52
0.89
0.82
0.00
Grou
p B
(Spr
ing)
1N
o1.
001.
005.
003.
002.
002.
002.
003.
001.
00St
anda
rd D
evia
tion
(Gro
up B
Sp
2017
)0.
000.
000.
000.
000.
000.
000.
000.
000.
00Gr
oup
C (S
prin
g)43
No
1.13
1.10
1.30
1.75
1.43
1.30
1.83
4.63
1.00
Stan
dard
Dev
iatio
n (G
roup
C S
prin
g)0.
400.
300.
460.
840.
640.
651.
064.
240.
00
Grou
p A
(Sum
mer
201
6)5
Yes
1.00
1.20
1.20
1.20
1.80
1.60
3.60
3.60
1.00
Stan
dard
Dev
iatio
n (G
roup
A S
u 20
17)
0.00
0.45
0.45
0.45
0.84
0.89
2.51
2.30
0.00
Grou
p B
(Sum
mer
)9
No
1.00
1.11
1.22
1.11
1.56
1.33
2.00
2.89
1.00
Stan
dard
Dev
iatio
n (G
roup
B S
u 20
17)
0.00
0.33
0.44
0.33
0.73
0.50
0.71
0.60
0.00
Grou
p C
(Sum
mer
)13
No
1.00
1.25
1.33
2.25
1.58
1.67
2.75
3.92
1.00
Stan
dard
Dev
iatio
n (G
roup
C S
umm
er)
0.00
0.45
0.65
0.97
0.90
0.65
1.29
2.15
0.00
Grou
p A
(Fal
l 201
6)12
Yes
1.00
1.00
1.25
1.08
1.25
1.08
1.67
2.67
1.00
Stan
dard
Dev
iatio
n (G
roup
A F
a 20
16)
0.00
0.00
0.45
0.29
0.45
0.29
0.89
1.07
0.00
Grou
p B
(Fal
l)12
No
1.00
1.17
1.42
1.25
1.50
1.33
1.92
3.50
1.00
Stan
dard
Dev
iatio
n (G
roup
B F
a 20
16)
0.00
0.58
0.90
0.45
0.67
0.65
1.00
2.20
0.00
Grou
p C
(Fal
l)48
No
1.08
1.08
1.49
1.53
1.49
1.53
1.96
3.59
1.00
Stan
dard
Dev
iatio
n (G
roup
C F
all)
0.28
0.28
0.62
0.77
0.68
0.74
0.93
2.11
0.00

56
A-2
Num
ber o
f Tim
es R
epea
ted
#Le
sson
10G
Less
on 1
0FLe
sson
11
Less
on 1
2 Le
sson
13
Less
on 1
4Le
sson
15
Less
on 1
6Le
sson
17
Less
on 1
8Po
pula
tion
Aver
age
149
1.16
1.41
1.20
1.02
1.03
1.16
1.33
1.01
1.21
1.13
All o
f Gro
up A
231.
091.
171.
041.
001.
001.
131.
501.
001.
221.
00St
anda
rd D
evia
tion
Grou
p A
0.29
0.39
0.21
0.00
0.00
0.34
0.60
0.00
0.42
0.00
Grou
p B
and
C12
61.
181.
461.
221.
021.
031.
171.
301.
021.
211.
15Gr
oup
B22
1.18
1.50
1.05
1.00
1.00
1.09
1.23
1.00
1.23
1.00
Stan
dard
Dev
iatio
n Gr
oup
B0.
500.
510.
210.
000.
000.
290.
430.
000.
530.
00Gr
oup
C10
41.
171.
451.
261.
031.
041.
181.
311.
021.
201.
19St
anda
rd D
evia
tion
Grou
p C
0.38
0.67
0.59
0.17
0.19
0.39
0.58
0.14
0.51
0.66
Grou
p A
(Spr
ing
2017
)6
1.17
1.17
1.17
1.00
1.00
1.00
1.67
1.00
1.17
1.00
Stan
dard
Dev
iatio
n (G
roup
A S
p 20
17)
0.41
0.41
0.41
0.00
0.00
0.00
0.82
0.00
0.41
0.00
Grou
p B
(Spr
ing)
11.
001.
001.
001.
001.
001.
003.
001.
001.
001.
00St
anda
rd D
evia
tion
(Gro
up B
Sp
2017
)0.
000.
000.
000.
000.
000.
000.
000.
000.
000.
00Gr
oup
C (S
prin
g)43
1.10
1.38
1.25
1.05
1.05
1.25
1.33
1.05
1.25
1.15
Stan
dard
Dev
iatio
n (G
roup
C S
prin
g)0.
300.
490.
540.
220.
220.
440.
620.
220.
630.
48
Grou
p A
(Sum
mer
201
6)5
1.00
1.20
1.00
1.00
1.00
1.40
1.80
1.00
1.40
1.00
Stan
dard
Dev
iatio
n (G
roup
A S
u 20
17)
0.00
0.45
0.00
0.00
0.00
0.55
0.45
0.00
0.55
0.00
Grou
p B
(Sum
mer
)9
1.11
1.67
1.11
1.00
1.00
1.11
1.33
1.00
1.33
1.00
Stan
dard
Dev
iatio
n (G
roup
B S
u 20
17)
0.33
0.50
0.33
0.00
0.00
0.33
0.50
0.00
0.71
0.00
Grou
p C
(Sum
mer
)13
1.33
1.33
1.58
1.00
1.08
1.25
1.25
1.00
1.25
1.75
Stan
dard
Dev
iatio
n (G
roup
C S
umm
er)
0.49
0.89
1.16
0.00
0.29
0.45
0.45
0.00
0.62
1.54
Grou
p A
(Fal
l 201
6)12
1.08
1.17
1.00
1.00
1.00
1.08
1.27
1.00
1.17
1.00
Stan
dard
Dev
iatio
n (G
roup
A F
a 20
16)
0.29
0.39
0.00
0.00
0.00
0.29
0.47
0.00
0.39
0.00
Grou
p B
(Fal
l)12
1.25
1.33
1.00
1.00
1.00
1.17
1.00
1.00
1.00
1.00
Stan
dard
Dev
iatio
n (G
roup
B F
a 20
16)
0.62
0.49
0.00
0.00
0.00
0.39
0.00
0.00
0.00
0.00
Grou
p C
(Fal
l)48
1.18
1.55
1.20
1.02
1.02
1.10
1.31
1.00
1.16
1.08
Stan
dard
Dev
iatio
n (G
roup
C F
all)
0.39
0.74
0.41
0.14
0.14
0.31
0.58
0.00
0.37
0.28

57
A-2
Num
ber o
f Tim
es R
epea
ted
#Le
sson
19
Less
on 2
0GLe
sson
20F
Less
on 2
1Le
sson
22
Less
on 2
3Le
sson
24
Less
on 2
5GLe
sson
25F
Less
on 2
6Po
pula
tion
Aver
age
149
1.01
1.27
1.43
1.01
1.03
1.89
2.30
1.44
1.56
1.11
All o
f Gro
up A
231.
041.
301.
391.
001.
091.
521.
391.
521.
301.
09St
anda
rd D
evia
tion
Grou
p A
0.21
0.56
0.50
0.00
0.29
0.73
0.66
0.79
0.47
0.29
Grou
p B
and
C12
61.
011.
261.
431.
011.
021.
962.
471.
421.
611.
12Gr
oup
B22
1.00
1.41
1.50
1.00
1.05
1.95
2.50
1.50
1.41
1.14
Stan
dard
Dev
iatio
n Gr
oup
B0.
000.
590.
510.
000.
211.
331.
540.
600.
500.
35Gr
oup
C10
41.
011.
231.
421.
011.
021.
962.
471.
411.
651.
12St
anda
rd D
evia
tion
Grou
p C
0.10
0.45
0.68
0.10
0.14
0.99
2.76
0.65
0.64
0.35
Grou
p A
(Spr
ing
2017
)6
1.00
1.67
1.33
1.00
1.00
1.67
1.33
1.83
1.17
1.00
Stan
dard
Dev
iatio
n (G
roup
A S
p 20
17)
0.00
0.82
0.52
0.00
0.00
1.21
0.52
0.75
0.41
0.00
Grou
p B
(Spr
ing)
11.
001.
001.
001.
001.
001.
001.
002.
001.
001.
00St
anda
rd D
evia
tion
(Gro
up B
Sp
2017
)0.
000.
000.
000.
000.
000.
000.
000.
000.
000.
00Gr
oup
C (S
prin
g)43
1.00
1.23
1.30
1.00
1.00
1.95
2.43
1.40
1.63
1.15
Stan
dard
Dev
iatio
n (G
roup
C S
prin
g)0.
000.
480.
520.
000.
000.
883.
610.
590.
630.
36
Grou
p A
(Sum
mer
201
6)5
1.20
1.00
1.40
1.00
1.00
1.80
2.00
1.20
1.20
1.20
Stan
dard
Dev
iatio
n (G
roup
A S
u 20
17)
0.45
0.00
0.55
0.00
0.00
0.45
1.00
0.45
0.45
0.45
Grou
p B
(Sum
mer
)9
1.11
1.22
1.33
1.00
1.00
1.78
1.89
1.56
1.56
1.00
Stan
dard
Dev
iatio
n (G
roup
B S
u 20
17)
0.33
0.44
0.50
0.00
0.00
0.83
0.93
0.53
0.53
0.00
Grou
p C
(Sum
mer
)13
1.00
1.50
1.50
1.08
1.00
1.83
2.00
1.25
1.75
1.08
Stan
dard
Dev
iatio
n (G
roup
C S
umm
er)
0.00
0.52
0.80
0.29
0.00
0.72
0.85
0.45
0.45
0.29
Grou
p A
(Fal
l 201
6)12
1.00
1.25
1.42
1.00
1.17
1.33
1.17
1.50
1.42
1.08
Stan
dard
Dev
iatio
n (G
roup
A F
a 20
16)
0.00
0.45
0.51
0.00
0.39
0.49
0.39
0.90
0.51
0.29
Grou
p B
(Fal
l)12
1.00
1.83
1.58
1.00
1.17
1.92
2.00
1.92
1.58
1.08
Stan
dard
Dev
iatio
n (G
roup
B F
a 20
16)
0.00
0.58
0.51
0.00
0.39
1.68
1.60
0.90
0.51
0.29
Grou
p C
(Fal
l)48
1.02
1.18
1.45
1.00
1.04
1.98
2.59
1.45
1.63
1.10
Stan
dard
Dev
iatio
n (G
roup
C F
all)
0.14
0.39
0.74
0.00
0.20
1.15
2.32
0.74
0.67
0.37
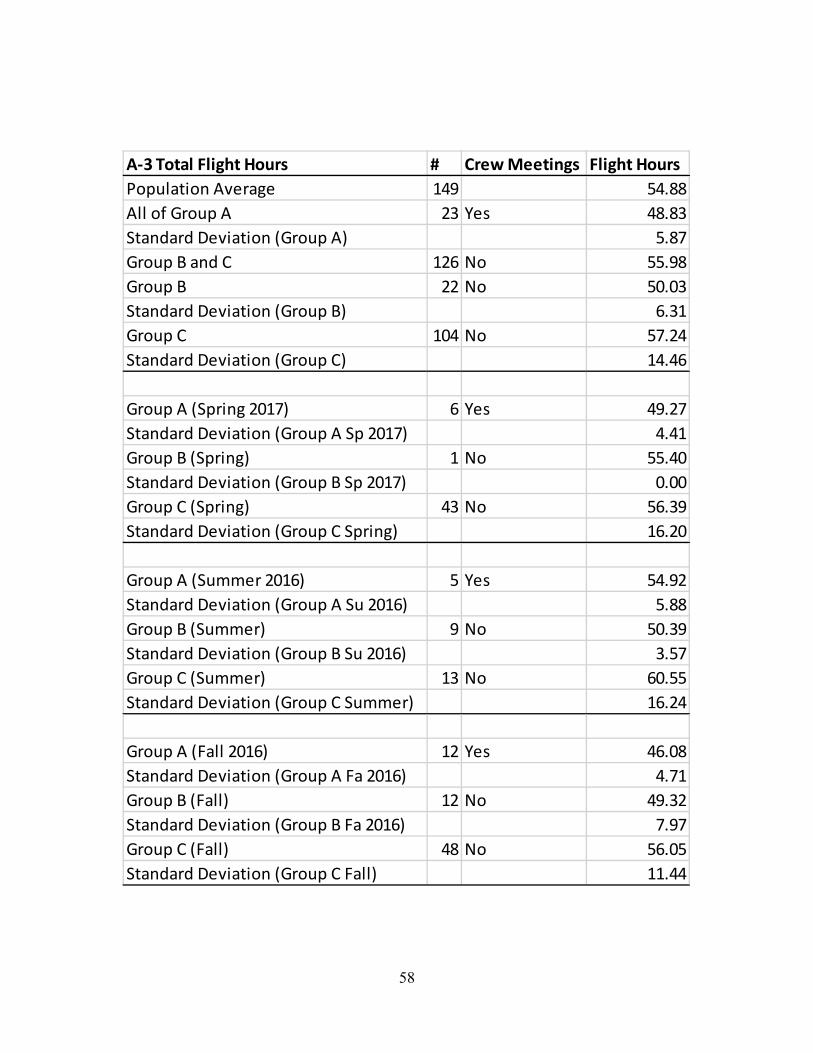
58
A-3 Total Flight Hours # Crew Meetings Flight HoursPopulation Average 149 54.88All of Group A 23 Yes 48.83Standard Deviation (Group A) 5.87Group B and C 126 No 55.98Group B 22 No 50.03Standard Deviation (Group B) 6.31Group C 104 No 57.24Standard Deviation (Group C) 14.46
Group A (Spring 2017) 6 Yes 49.27Standard Deviation (Group A Sp 2017) 4.41Group B (Spring) 1 No 55.40Standard Deviation (Group B Sp 2017) 0.00Group C (Spring) 43 No 56.39Standard Deviation (Group C Spring) 16.20
Group A (Summer 2016) 5 Yes 54.92Standard Deviation (Group A Su 2016) 5.88Group B (Summer) 9 No 50.39Standard Deviation (Group B Su 2016) 3.57Group C (Summer) 13 No 60.55Standard Deviation (Group C Summer) 16.24
Group A (Fall 2016) 12 Yes 46.08Standard Deviation (Group A Fa 2016) 4.71Group B (Fall) 12 No 49.32Standard Deviation (Group B Fa 2016) 7.97Group C (Fall) 48 No 56.05Standard Deviation (Group C Fall) 11.44