a case study of the kisumu municipal health facilities
TRANSCRIPT
QUALITY OF HEALTH CARE AND ITS EFFECTS ON THE UTILIZATION OF MATERNAL AND CHILD HEALTH
SERVICES
A CASE STUDY OF THE KISUMU MUNICIPAL HEALTHFACILITIES
BY
DR. MICHAEL O. AUDO—MBCh.B, Cert. EPI (NRB).
A THESIS SUBMITTED AS PART FULFILMENT FOR THE AWARD OF THE DEGREE OF MASTERS IN PUBLIC HEALTH (MPH) OF THE
UNIVERSITY OF NAIROBI
2004.
V > .c
V i %University o< NAIROBI Library

DECLARATION :
I declare that this thesis is my original work and has not been presented in any other
University.
S i g n e d _________________ Date 1 ° ° *
Dr Michael Oleng Audo
MBCh.B, Cert EPI. (Nairobi).
1

APPROVED BY:
In terna l supervisors:
Dr. Allan Ferguson, PhD.
Lecturer, Department of Community Health,
University of Nairobi.
Signed —> Date I
Dr. Peter Njoroge, MBChB, MPH.
Lecture, Department of Community Health,
University o f Nairobi
Signed 3 L ° f r l o ?
External Supervisor:
Dr. B. Ogutu Ragama, MBChB, MMED, PhD.
Research Officer,KEMRI
KJSUMU
Date
C hairm an, D epartm ent of Com m unity Health,
University o f Nairobi
Prof. A. M. Mwanthi, BSc, MSEH, PhD.
Signed — »Date J j j l o j o U -
11

DEDICATION :
This thesis is dedicated to my wife Cecilia, and my sons Bruce and Tony for their
sacrifice and endurance while I was away pursuing my course, my farther and late mother
for their encouragement and inspiration during my up-bringing.
iii

ACKNOWLEDGMENT:
I would like to thank all those who assisted me in one way or another in order to make
this thesis a success. First, I would like to express my sincere appreciation to my internal
supervisors. Dr Allan Ferguson and Dr. Peter Njoroge for their expert guidance in the
development o f the proposal to the write-up of the final document. I would also like to
thank the external supervisor. Dr. Ogutu for his advice and encouragement during the
report writing.
Not to be forgotten are Mr. Nyabola of DCH for his valuable encouragement, Dr Ogonji
o f Maseno University for allowing me un-limited access to his computer, and all the
lectures of the Community Health Department for their excellent training during the
coursework and which gave me a good foundation for the thesis.
IV

TABLE OF CONTENTS
TITLE________________________________________________________PAGE
DECLARATION...................................................................................................................... iLIST OF SUPERVISORS..................................................................................................... iiDEDICATION........................................................................................................................... iiiACKNOWLEDGMENTS....................................................................................................... ivTABLE OF CONTENTS......................................................................................................... vLIST OF ABBREVIATIONS................................................................................................. viiLIST OF TABLES..................................................................................................................... viiiLIST OF FIGURES................................................................................................................... xABSTRACT................................................................................................................................ xi
CHAPTER 1: INTRODUCTION........................................................................................... 11.1 BACKGROUND INFORMATION.................................................................... I1.2 QUALITY OF CARE.............................................................................................. 41.3 STATEMENT OF PROBLEM.............................................................................. 111.4 RATIONALE/JUSTIFICATION......................................................................... 121.5 OBJECTIVES.......................................................................................................... 13
1.5.1 GENERAL OBJECTIVE............................................................................. 131.5.2 SPECIFIC OBJECTIVES........................................................................... 13I 5 3 RESEARCH QUESTIONS........................................................................ 13
CHAPTER 2. LITERATURE REVIEW................................................................................. 14
CHAPTER 3. METHODOLOGY............................................................................................ 203.1 STUDY AREA...................................................................................................... 203.2. STUDY POPULATION...................................................................................... 223.3. STUDY DESIGN.................................................................................................. 223.4 SAMPLING............................................................................................................. 223.5. SAMPLE SIZE........................................................................................................ 243.6. VARIABLES............................................................................................................ 243.7. DATA COLLECTION...................................................................................... 26
3.7.1 INSTRUMENTS...................................................................................... 263.7.2 PROCEDURE........................................................................................... 27
3.8. MINIMIZATION OF ERRORS/BIAS................................................................. 273.9 DATA MANAGEMENT......................................................................................... 283.10 ETHICAL CONSIDERATIONS.......................................................................... 283.11 LIMITATIONS..................................................................................................... 28
CHAPTER 4. RESULTS...................................................................................4.1 HOUSEHOLD..............................................................................
4.1.1. SOCIO-DEMOGRAPHIC CHARACTERISTICS ..4.1.2. UTILISATION OF MCH SERVICES.........................
4.1.3. BY-PASS OF MUNICIPAL FACILITIES..............4.1.4. EVER-ATTENDANCE OF MCK FACILITIES...4.1.5. PERCEPTION OF QUALITY OF CARE................
4.2. EXIT INTERVIEWS..................................... .......... ...............4 2.1 SOCIO-DEMOGRAPHIC CHARACTERISTICS4.2.2 REASONS FOR VISIT...............................................4.2.3 PHYSICAL EXAMINATION..................................4.2.4 PERCEPTION OF QUALITY OF C A R E .............
4.3. FACILITY A U D IT................................................................4.3.1. CHECK-LIST................................................................4.3.2. STAFFING AND WORK-LOAD.............................4.3.3. A VAIL ABILITY OF MCH SERVICES....................4.3.4. TRAINING.....................................................................
292929343641455353555556 58 58 62 64 66
c
5 aft* A**P O\T‘3 5
£O r-’ S ■z %
Vv

4.3.5. ADMINISTRATIVE ISSUES.......................................................... 664.4 CORRELATIONS......................................................................................... 68
CHAPTER 5: DISCUSSION................................................................................................... 88
CHAPTER 6: CONCLUSION AND RECOMMENDATIONS..................................... 946.1. CONCLUSION....................................................................................... 946.2. RECOMMENDATIONS.................................................................... 95
REFERENCES.......................................................................................................................... 97
ANNEXES: Annex 1-Facility inventory checklist.Annex 2-Household questionnaire Annex 3-Exit interview questionnaireAnnex 4-Utilisation o f MCH services by facility catchment Annex 5-Resuhs from facility inventory
vi

LIST OF ABBREVIATIONS.
AIDS - Acquired immunodeficiency syndrome.HIV - Human immunodeficiency virus.£pi - Exapanded program on immunization.KEPI - Kenya expanded program on immunization.[MCI - Integrated management of childhood illnesses.WHO - World Health Organization.unicef - United Nation Children’s Fund.MOH - Ministry of HealthDMOH - District Medical Officer o f Health.V1MOH - Municipal Medical Officer o f Health.PMO - Provincial Medical Officer.VICK - Municipal Council of KisumuDSRS - Department o f Standards and Regulations.<QM - Kenya Quality Model.VlCH/FP - Maternal and Child Health/Family Planning.3RT - Oral Rehydration TherapyARI - Acute Respiratory Infections.(SPA - Kenya Service Provision Assessment.(GO - Non-Governmental Organization.5TI - Sexually Transmitted Infections.:dd - Control of Diarrhoeal Diseases.(H - Reproductive Health.JON - University o f Nairobi.-ISM - Health Service ManagementICO - Registered clinical officerIRN - Kenya Registered nurse:i - Confidence interval(DH - Kisumu District Hospital>GH - Provincial General Hospital
Hvii
PAGELIST OF TABLES:
Table 4 1-.Sample sue. mean age of respondent*, mantal status, mean household size
and mean number of under-fives in households by facility catchment.................................................................... 29
Table 4.2-EducaUon status o f respondents by facility catchment................................................................................................ 30
Table 4.3-Occupalion of re^tondents by facility catchm ent....................................................................................................... 31
Table 4 4-Type of dwelling of respondents and house ownership by facility ra trh m rrt....................................................... 32
Table 4 5-J tilisaUon of MCH services by facility ownership.................................................................................................... 34
Table 4.6-f'tilisation rales of Municipal facilities for MCH services by facility catchment................................................... 35
Table 4 7-By-pass rate for MCI! services............................................................................................................................... 36
Table 4 8-By-pass o f Municipal facilities for MCH services by facility catchment............................................................ 37
Table 4.9-Cruss-tabulation o f education status and by-pass of Municipal facilities.............................................................. 38
Table 4.10-Crosvtabulation of occupation of respondent and by-pass of Municipal facilities.............................................. 39
Table 4 11 -Cross-tabulation of type of dwelling and by-pass of Municipal facilities tor MCH services........................ 39
Table 4 12-Reasons for by-passing Municipal facilities............................................................................................................. 40
Table 4 .13-Reasons for preferring attended facilities.................................................................................................................. 41
Table 4.14-Reasons for not using Municipal facilities................................................................................................................. 42
Table 4.15-Source o f information about Municipal facilities....................................................................................................... 42
Table 4.16-Cross-tabulation of education status of respondent and ever-attcwdance o f Municipal facility......................... 43
Tabic 4.17-Croo-tabulahon ofoccupation of respondent and ever-usc o f Municipal facility............................................... 43
T able 4 18-Cross-tabulation of type of dwelling and ever-aUendance........................................................................................ 44
Table 4.19-Variables associated with by-pass of Municipal facilities....................................................................................... 44
Table 4 20a-Response on handling of client by provider........................................................................................................... - 45
Table 4 20b-Perception of provider-client relationship and provider competence..................................................................... 46
Table4.21-Mothers rating of drug availability.................................................................................................................................. 47
Table 4 22-Respondents perception of waiting tim e ....................................................................................................................... 47
Table 4 23-Respondents judgement of operation tim e ................................................................................................................... 48
Table 4.24-Respondents rating of mtrastructurc............................................................................................................................. 48
Table 4.25-Respondents rating of overall quality of c a re .......................................................................................................... - ■**
Table 4.26-Facility to be attended should respondent fall s ick .................................................................................................... *9
Table 4.27-Areas that respondents want improved......................................................................................................................... 50
Table 4.28-Mean quality index by tiKalitv catchment..................................................................................................................... 51
Table 4 29-Mcan age and marital status of exit respondents by facility.................................................................................... 54
Table 4 30-Kducalion status of exit respondents by facility ....................................................................................................... 54
Tabic 4 31-Reason for hospital visit ..............................................................................................................................................
Table 4.32-Exammations earned out on ANC m others................................................................................................................
Table 4 33-Hxammations earned out on children .........................................................................................................................
Table 4 34-Respondents satisfaction with quality param eters.................................................................................................... 56
Table 4.35-Mean quality index by facility ................................................................................................................................. -
Table 4J6-Facility scores bv qualm indicator............................................................................................................................. ^0
Table 4J7-Overall performance of facilities by indicator.........................................................................................................
Table 4.38-Wcighted scores for quality indicators by facility....................................................................................................
Table 4.39-Staffing pattern and workload...................................................................................................................................
Table 4 40-Number of nursing staff against number o f clients attended by period................................................................
Table 4.41-Number of .VNC and Immunization clinics per w eek............................................................................................
Table 4.42-In-service training for nurses and clinical officers....................................................................................................... 66
Table 4.43-Observed service tim e...............................................................................................................................................
Tabic 4.44-Quality variables by facility.....................................................................................................................................
viii

LIST OF FIGURES . PAGE
Figure 3.1-Map of Kisumu Municipality showing distribution of Municipal health facilities
Figure 4.1 -Distribution of mean household quality index.................................................................................. 53
Figure 4 2-Distribution of mean exit quality index ........................................................................................... 57
Figure 4.3-Relationship between utilization of ANC and household quality index......................................... 69
Figure 4 4-Relationship between utilization of immunization services and household quality index............. 70
Figure 4.5-Relationship between utilization of child treatment services and household quality index.............. 71
Figure 4 6-Relationship between utilization of ANC services and exit quality index........................................72
Figure 4.7-Relationship between utilization of immunization services and exit quality index..........................73
Figure 4 8-Relationship between child treatment attendance and exit quality index......................................... 73
Figure 4.9-Relationship between utilization of ANC services and capacity of facility to offer care................ 75
Figure 4 10-Relationship between utilization of immunization services and capacity of facility to offer care.. 76
Figure 4 .11 -Relationship between utilization of child treatment services and facility capacity to offer care... 77
Figure 4.12-Relationship between by-pass and perception of quality from household survey......................... 78
Figure 4.13-Relationship between bv-pass and capacity of facility to offer c a re .................................................79
Figure 4 14-Relationship between over-use of Municipal facilities and perception of quality horn
household survey................................................................................................................................80
Figure 4.15-Relationship between bv-pass and distance between facility and PGH.......................................... 82
Figure 4.16-Relationship between by-pass and distance between facility and KDII........................................ 82
Figure 4.17-Relationship between facility capacity and perceived quality of care from household survey 84
Figure 4.18-Rclationship between exit quality index and household quality index........................................... 84
Figure 4.19-Rolationship between facility capacity and exit quality index........................................................ 85
Figure 4.20-Relationship between client-nurse ratio and perceived quality of care from household.............. 86
Figure 4.21-Relationship between clicnt-nurse ratio and by-pass......................................................................
ix
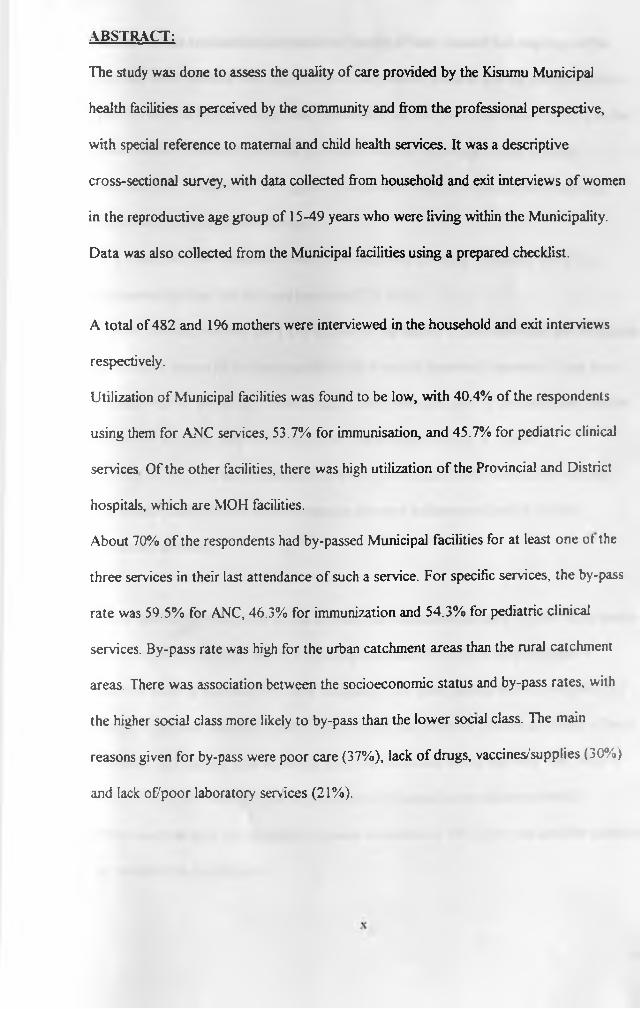
ABSTRACT:
The study was done to assess the quality o f care provided by the Kisumu Municipal
health facilities as perceived by the community and from the professional perspective,
with special reference to maternal and child health services. It was a descriptive
cross-sectional survey, with data collected from household and exit interviews o f women
in the reproductive age group of 15-49 years who were living within the Municipality.
Data was also collected from the Municipal facilities using a prepared checklist.
A total of 482 and 196 mothers were interviewed in the household and exit interviews
respectively.
Utilization o f Municipal facilities was found to be low, with 40.4% o f the respondents
using them for ANC services, 53.7% for immunisation, and 45.7% for pediatric clinical
services Of the other facilities, there was high utilization o f the Provincial and District
hospitals, which are MOH facilities.
About 70% o f the respondents had by-passed Municipal facilities for at least one ot the
three services in their last attendance of such a service. For specific services, the by-pass
rate was 59.5% for ANC, 46.3% for immunization and 54.3% for pediatric clinical
services. By-pass rate was high for the urban catchment areas than the rural catchment
areas. There was association between the socioeconomic status and by-pass rates, with
the higher social class more likely to by-pass than the lower social class. The main
reasons given for by-pass were poor care (37%), lack o f drugs, vaccines/supplies (30%)
and lack of/poor laboratory services (21%).
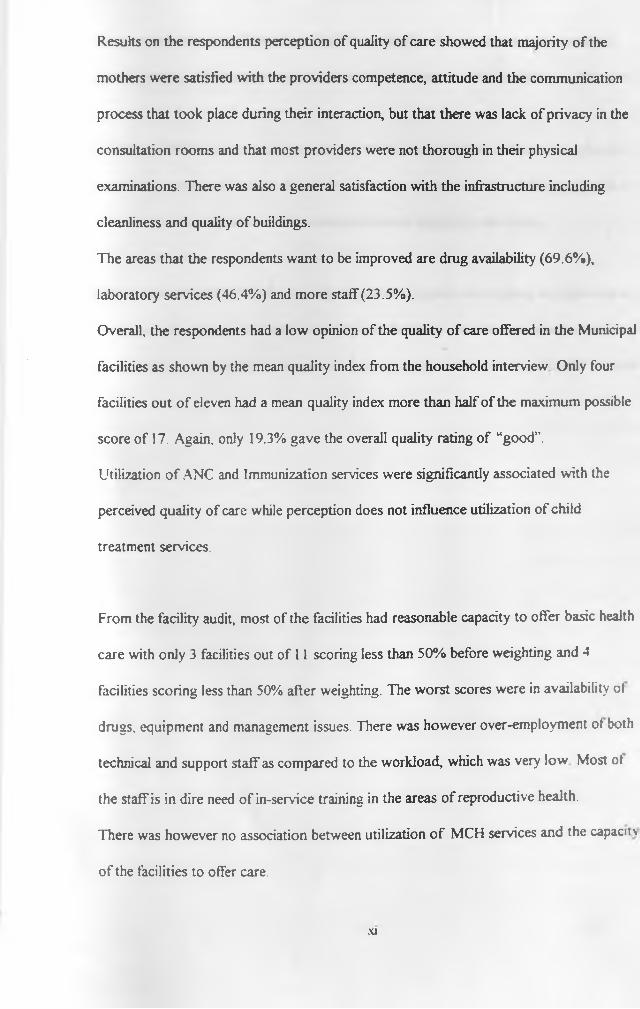
Results on the respondents perception of quality of care showed that majority o f the
mothers were satisfied with the providers competence, attitude and the communication
process that took place during their interaction, but that there was lack of privacy in the
consultation rooms and that most providers were not thorough in their physical
examinations. There was also a general satisfaction with the infrastructure including
cleanliness and quality o f buildings.
The areas that the respondents want to be improved are drug availability (69.6%),
laboratory services (46.4%) and more staff (23.5%).
Overall, the respondents had a low opinion of the quality o f care offered in the Municipal
facilities as shown by the mean quality index from the household interview Only four
facilities out o f eleven had a mean quality index more than half of the maximum possible
score of 17. Again, only 19.3% gave the overall quality rating of “good”.
Utilization o f ANC and Immunization services were significantly associated with the
perceived quality of care while perception does not influence utilization of child
treatment services.
From the facility audit, most of the facilities had reasonable capacity to offer basic health
care with only 3 facilities out of 11 scoring less than 50% before weighting and 4
facilities scoring less than 50% after weighting. The worst scores were in availability ot
drugs, equipment and management issues. There was however over-employment ot both
technical and support staff as compared to the workload, which was very low Most ot
the staff is in dire need o f in-service training in the areas o f reproductive health.
There was however no association between utilization o f MCH services and the capacitv
o f the facilities to offer care.
XI

By-pass and ever-use of Municipal facilities is significantly associated with perceived
quality of care, while they are not influenced by the capacity of the facilities to offer care.
CONCLUSION: There is under-utilization of Municipal health facilities due to the low
opinion the community has on the quality of care they provide and that this perception is
influenced by the respondent’s socioeconomic status especially education.
RECOM M ENDATION: The Municipality should improve on supplies, equipment and
medicines, rehabilitate and maintain the physical facilities, establish continous education
for staff* and set up a Health Management Board to oversee the running of health services
Xll

1: INTRODUCTION.
1.1. BACKGROUND INFORMATION.
The provision of health services in Municipalities and Cities has historically been a shared
responsibility between the Ministry o f Health and the Urban Councils. It is stipulated in the Public
Health Act (Cap. 242 of the Laws of Kenya) that the provision of health services in the country is the
responsibility of the Central Government. However, for effective management of health delivery
services, the Central Government delegated some of the responsibilities to the Local Authorities or
Urban Councils and retained the responsibility to develop and manage District and Provincial
Hospitals.
There was a change in 1970 when the Ministry of Health took over the management of all health
facilities in the country from local authorities except Nairobi, Mombassa, Nakuru, kisumu and
Eldoret. These municipalities therefore continued to meet the objectives of providing quality health
services for their urban residents as set in the Public Health Act.
Urban migration is meanwhile proceeding rapidly all over the world. It is projected that by the year
2020, more than half of the population of the developing world will live in cities and towns (World
Bank 1995). In 1960, less than 22% of the population of low to middle income countries was urban
By 1990, that population had increased by roughly half to 34%. Yet even as cities increasingly
became the nexus of economic and population growth, they do not deliver on the promise ol better
quality of life and services to the extent they should. Millions of urban residents do not have access
to portable water, basic sanitation is often lacking and access to health services and education is
wanting in many cities.
The selection of urban health as the subject of the Technical Discussion at the forty-fourth World
Health Assembly was a highly significant turning point and marked the explicit recognition of this
issue. It indicated a distinct shift away from the pre-occupation with the problems of the rural health
1
to recognition that there is an impending urban crisis in health and that problems of rural and urban
areas are interrelated and indivisible.
There are now many initiatives for improving health in urban areas, like “Healthy Cities” project of
the WHO Regional office for Europe, and such associations as Metropolis (World Association of
Major Metropolis), Citinet, (a regional network based in Asia and the pacific of City Authorities) and
Non-Governmental organisations concerned with the management of human settlements, and other
International and National Public Health Associations.
Primary health care, comprising both preventive measures and curative facilities at neighbourhood
level, though often a statutory Municipal function, has not generally been well targeted at or adapted
to urban poor neighbourhoods. As a result, the urban poor lack access to health care.
The World Health Organisations (WHO) Global Strategy for Health for All by the year 2000
identities primary health care as the key to achieving the goal of health for all. The declaration ot
Alma Ata identified the following eight activities:
■ Health education
■ Food supply and proper nutrition
■ Provision of safe water and basic sanitation
■ Maternal and child care
■ Immunisation
■ Prevention and control of endemic diseases
■ Basic treatment of health problems
■ Provision of essential drugs.
In Kenya, according to the Ministry o f Health National Health sector strategic plan 199d - 2004. the
over arching goal of services delivery is to provide essential priority packages which are acceptable.
2

affordable and accessible to all Kenyans at all levels while creating an enabling environment for
other stakeholders, including the Municipalities, to contribute to reduction of the burden of disease
and unmet needs.
The high priority packages are:
■ Malaria prevention and treatment package
■ Reproductive health package H1V/AIDS/TB prevention and management package
■ Integrated management of childhood illnesses (IMCI) package
■ Expanded program on immunization (EPI)
■ Control and prevention of major environmental health related communicable diseases such as
cholera. Typhoid and dysentery as well as food safety.
From these strategies, it is noted that emphasis is put on issues concerning women and children’s
health (maternal and child health) in trying to improve the health status of the population. I he> are
also the most vulnerable to the adverse environmental conditions and related diseases brought about
by rapid urbanisation.
For the desired, favourable outcomes of these interventions to be felt, the communities for whom
they are meant must utilise the available services. Studies have shown that there is a significant need
for these services, but their demand depends on the quality of service provided. Poor quality works
to shift or discourage demand, (Obonyo et al 1993).
3
1.2. QUALITY OF CARE:
1.2.1. Definition
Quality of care is difficult to define. The term is generally considered an evaluative statement
(judgement) o f the process of care. No single comprehensive definition has evolved over the years.
The following four examples of health care definitions illustrate the evolution o f the thinking over
the past sixty years as presented by Willy DeGeyudt (World Bank, 1995)
■ Good medical care is the kind o f medicine practised and taught by the recognised leaders of the
medical profession at a given time or period of social, cultural and professional development in a
community or population (Lee and Jones 1933, pg. 6).
■ Standards of quality of care should be based on the degree to which care is available, acceptable,
comprehensive, continues and documented, as well as on the extent to which adequate therap> is
based on an accurate diagnosis and not on symptomatology (Esselstyn, 1968).
■ Quality of care is the degree to which health services for individuals and populations increases
the likelihood of desired outcomes and is consistent with current professional knowledge
(Institute of Medicine 1990 pg. 4).
■ Total quality management is a management process of continuous improvement - process ol
continuously striving to exceed customer expectations
(Melum and Sinioris 1992 Pg.2.)
Donabedian (1980, 1982, 1985), the most renowned expert on quality, points out that the basic
components of care are both the technical quality of care such as providers behaviour in making
interventions and applying technology and the management of the interpersonal process. Ihe
interpersonal elements of quality are judged as good or bad according to how the care complies with
social norms, ethical, standards, client’s expectations and amenities. There are also social elements
4

of quality that arc non-clinical in nature including accessibility of the services, the efficiency with
which they are delivered and the convenience of using the services (Newbrander, 2000).
1.2.2. History of Quality of Care:
Concern for quality of care is as old as medicine itself. Individual practitioners from Hypocrates to
Florence Nightingale have recorded their observations of poor quality care and made
recommendations for improvement (Wright et al, 1992).
The first formal systems for the assurance of quality care however developed alongside the general
professsionalisation of medicine, nursing and other health professions. As early as the I6’h century,
the Royal College of Physicians made reference in its founding charter to the need to “uphold
standards for public benefit". In most cases, the colleges and other professional associations took
their responsibility for “upholding standards”, to include regulation of education and training, control
of admission and development of powers of dismissal from the profession on grounds of malpractice.
The Royal College of Nursing set up the “Standards of Care" project in 1965, while the Royal
College of General Practitioners launched the “Quality Initiative" in 1985.
It is clear from the above that both Government and professions have now recognised the importance
of quality assurance in health care. In Kenya, there are various professional associations responsible
for the maintenance of standards and ethics in the practice of their respective members. Some of
these are Kenya Medical Association, National Association of Nurses of Kenya. Kenya Clinical
Officers Association etc. There are also legally constituted bodies, established through the Act ot
parliament to regulate and control the practice of doctors, dentists and nurses. These are The Kenya
Medical Practitioners and Dentists Board, and The Nursing Council of Kenya. I he Ministry ot
Health has been overseeing quality care in the country through these bodies.
5
Recognising the continued need and importance of improving quality of health services in the
country, the Ministry of Health established the Department of Standards and Regulatory Services
(DSRS) in the year 2000. The department has developed the Kenyan Quality Model (KQM), which
provides a framework for Quality improvement in Health care in Kenya.
The Kenya Quality Model is designed to integrate two quality improvement approaches. Firstly, a
standards approach to ensure delivery of safe and effective health services, and secondly, the gradual
introduction of quality management to health managers and service providers (Mboya et al 2001).
1.2.3. Importance of Quality Care:
The main objectives of improving quality care are:
■ To comply with societal commitments.
Society in all cultures has entrusted the medical profession or its equivalent with the authority and
power to prolong life, to relieve stress, to restore function, and to prevent disability and unnecessary
deaths. The discharge of this public trust must be bolstered by quality assurance measures.
■ To enhance efficiency in using existing resources in all countries as resources a\ailahle for the
health services has continued to decline.
■ Protecting the health of the public through less individual variations among physicians in the use
of diagnostic and therapeutic procedures, the appropriate introduction, diffusion and use of ne\s
technology, reduction in medically unnecessary procedures, and applying effective public health
measures.
■ Monitoring and ensuring that the quality of service provided to the patients and to the community
meets the criteria of fiduciary responsibility for the assigned human, financial and technical
resources.
6

■ Quality assessment has an educational purpose. It forms the basis for research, provides the
teaching materials for continuing education of health care professionals, and defines the role and
the responsibility of the patient in the process.
1.2.4 Dimensions of Quality of Care:
These can be grouped into three broad categories:
1. Technical aspects including:
- Accuracy of diagnosis
- Efficacy of treatment
- Excellence according to professional standard
- Necessity of care
- Appropriateness of care
- Continuity of care
- Consistency
2. Interpersonal aspects including:
- Patient satisfaction
- Acceptability of care
- Time spent with provider
Attitudes of provider and treatment by staff
- Amenities
3. Social aspects including:
- Efficiency
- Accessibility
7
From these elements, it is evident that quality is determined not solely by professional service
providers but also by patients and society perception.
1.2.5 Framework used in describing quality of care:
Although there is not a common definition of quality care, there has been close to universal
agreement on a basic conceptual framework for assessing quality.
A. Donabedians (1966,1988) framework
This has been accepted and modified by others. He proposed three categories into which service
could be characterised; and also noted that these describe approaches for gathering and analysing
information about quality rather than being actual attributes of quality.
I. Structure
Structure denotes the attributes of the setting in which the provision of health care occurs. They are
inputs, which are concrete, measurable and often visible. These include:
■ Physical inputs - grounds, buildings, equipment, pharmaceuticals, storage facilities, furniture,
medical and office supplies etc.
■ Personnel - quality and quantity o f health staff and supportive personnel.
* Financial resources - budget to operate services.
■ Organisational Structure - administration structure.
II. Process.*
This incorporates all aspects of the performance of activities of care and include:
■ Functions - prevention, diagnosis, treatment, screening, follow up.
■ Patient and provider compliance.
■ Programmes - EPI. ORT, AR1, MCH/FP.
8

■ Support tasks - planning, training, supervising, financial management, logistics, and community
mobilisation.
III. Out-come:
This denotes the end results of care/service and includes:
■ Morbidity
■ Mortality
■ Functional Impairment
■ Pain and suffering
■ Patient satisfaction
■ Behavioural change.
All the 3 categories need to be considered to obtain a balanced view of quality of care.
B. Juran / Maxwell framework:
These are frameworks developed for health from a number of industrial and other sources.
■ Timeliness of care - include access, waiting time and action time.
■ Information - clarification by answering what, why, how, when and who.
■ Technical competence - includes medical knowledge, skills and expertise, ethics, technology,
completeness and success of treatment.
■ Personal interaction with practitioner/client - include courtesy, respect and bedside manner.
■ Environment - include buildings, cleanliness, and amenities.
9
1.2.6 Methodologies for assessing Quality.
Indicators of quality can be measured using three methods of data collection (measure evaluation
project - 1999, Vol.2).
1. Facility audit with selected questions to programme/facility manager.
2. Observation of client - provider interaction and selected clinical procedures.
3. Client interviews - either exit or household interviews.
Each instrument contributes information that may be used to create a more comprehensive picture of
quality of care in a given set of facilities. The facility audit is used to determine the readiness of
each facility to serve the client. Information is collected about types of services provided, types and
amount of supplies in stock, the condition of the facility, and the types of records kept. In
observation, a person with clinical training follows the client and evaluates the performance of the
provider during the care giving sessions - clinical, counselling or procedures, thereby collecting
information on technical competence of the provider.
Client interview's collects information about the clients experience at a given health facility. It
provides information about the quality of services received from the client's perspective. Household
survey has the advantage of capturing even people not attending care in the facility and therefore
their views are free from courtesy bias. It has been observed that clients are likely to report that they
feel satisfied with the services that they have received and will not speak negatively about the clinic
or clinic staff during exit interviews. Exit interviews on the other hand are cheap and quick and
clients have fresh memory of the experiences.
10
13. STATEMENT OF PROBLEM:
The rapid urbanisation in Kenya has been coupled with increased population growth and worsening
poverty. It is estimated that 50% of urban population world-wide live in conditions of extreme
deprivation with poor housing, water and sanitation facilities. This has led to adverse health
consequences like increased morbidity and mortality from communicable diseases including
HIV/AIDS, chronic diseases, drug abuse and crime (WHO, 1992).
There has often been an assumption that, because there is a high concentration of health facilities in
the towns and cities as compared with rural areas, there is no urban health problem. However, for
the poor and especially those living in slums and shantytowns, the level of access to health facilities
falls below the minimum equitable level. Where primary health care facilities are available, their
location, resources, quality and performance are often poor, their links to deprived communities arc
inadequate and their utilisation is low (WHO, 1992).
Kisumu Municipal Council operates twelve (12) health facilities providing preventive, promotivc
and curative services. Over the years, it has been observed that the workload or attendance rate
continues to decline. At the same time, the Kisumu District Hospital and Nyanza Provincial
Hospital, which are referral hospitals, continue to be congested with people seeking all kinds ot
services including those that could be easily and cheaply handled at Health centres and Dispensaries.
For example, in the period July 2001 to June 2002 the Provincial and District hospitals combined had
an outpatient attendance of 131,674, excluding those attending special referral clinics, while all the
Municipal facilities had a total of 96,193.
The council, which has been recommended for upgrading to city status, is meanwhile in perennial
financial and political problems, which hamper provision o f services. Revenue collection continues
to shrink due to poor collection strategies and corruption. The council is unable to service its debts
running to the tune of Ksh.500 million. It is also unable to meet effectively its recurrent expenditures
like staff salaries, which is always in arrears.
11
This study was therefore designed to investigate the reasons for the low attendance in the health
facilities and if with all the problems facing the council, they are still able to offer quality health
services to the residents. It also determined the factors that influence the demand for health services
and the important decision variables for users choosing a health provider.
1.4. RATIONALE/JUSTIFICATION
As discussed above, rapid urban migration has led to poor environmental conditions and povcrt>.
Women and children are the most disadvantaged in this scenario and hence health programmes
targeting them should be strengthened.
The WHO concept of primary health care recognises that health care should be planned to optimise
the use of resources available and that quality standards must be met at all service deliver) points.
Kisumu Municipal Council is therefore expected to offer quality health care to meet the high
expectations of the residents and also meet the goal and mission of the Ministry' of Health and Kenya
Government.
The study highlighted the quality of care provided by the municipal health facilities, both from the
professional and client perspectives, and its affects on the utilisation of these facilities/services, w ith
special reference to maternal and child health services.
This information would hopefully be used to make recommendations on how' to increase coverage
of the offered services in a resource-poor setting and also to draw the attention of those concerned,
including the Ministry of Health, to take appropriate action to improve the situation.
1.5. OBJECTIVES:
1.5.1 General Objective:
The general objective was:
To assess the quality of care provided by the Kisumu Municipal health facilities.
Specific Objectives:
1. To determine the community’s perception of the quality of care provided at the municipal health
facilities.
2. To assess the capacity of the health facilities to offer quality care with emphasis on MCH services.
3. To determine the utilisation of MCH services at the Kisumu Municipal health facilities by Kisumu
residents
4. To relate the perception of quality of care and the utilisation of the services.
5. To make recommendations on the improvement of quality of care in the said facilities.
1.5.3 Research Questions
1. How does the community perceive the quality of care proved by the Municipal health facilities?
2. Does this perception affect their utilisation of the MCH services at the facilities?
3. Do the facilities have the capacity to offer quality services?
1.54. Null Hypotheses
1. Utilisation rate is not significantly related to, a) Perceived quality ot care
b) Capacity of the facilities to offer quality care.
2. Ever use of municipal health facilities is not significantly influenced by perception ot quality ot
care, other factors being equal
3. By-pass of municipal facilities is not influenced by the perceived quality ot care.
4. By-pass is not influenced by the capacity of the facility to offer services
13

2. LITERATURE REVIEW
Several studies have been done on quality of care both in urban and rural health services. From past
studies on patient attitudes and perceptions of quality of care, a consistent finding has been that the
community evaluates the adequacy of health services in two ways.
1. The availability of medical supplies and equipment especially drugs, as well as items such as
x-ray services, laboratory tests, dressings, bed linen etc.
2. Acceptability of the experience of obtaining care including factors like reasonable waiting
time, cleanliness of waiting places and toilets, well painted walls etc.
Patients rating of these factors are critical in determining the attractiveness of services. Poor rating
of services is likely to lead to a shift from use of the health facilities in addition to patient and
community complaints (Obonyo et al 1993).
In the 1999 Kenya Service Provision Assessment (KSPA) survey, which measured the capacity ot
the facilities to serve clients through facility inventory and interviews with health workers, only
about a third of the facilities had all the basic equipment while inadequate supplies such as drugs,
vaccines and contraceptives was a common feature. There was also concern on training of staff (in
service), infrastructure and supervision.
In a study on patient's perception of quality of care at MOH hospitals (Obonyo et al 1993), exit
surveys were conducted with patients using MOH facilities. Overall, most patients (93.1% of
outpatients and 96.79% of inpatients) felt that the quality of services were rated good to fair. Some
out- patients (38.24%) and in-patients (22.5%) of respondents indicated however, that the most
important thing requiring improvement was availability of drugs. The second and third most
important things to improve included additional staff and cleanliness.
14

According to the Nairobi Area study (NAS) (REACH 1988), the critical areas of weakness in the
health system were identified as:
■ The under-utilisation of physical facilities
■ Man-power development and shortage
■ Management systems weak
■ Patient flow and
■ Area-wide organisation and co-ordination.
The strategic Health Plan for the Nairobi area (1992) reported that a majority of Nairobi residents
used the city council health facilities (60%) more than any other category of facility (MOH, Private,
Mission). Other findings regarding the level of preventive/promotive services were that:
■ The number of service delivery points (SDP), are more than adequate
■ Utilisation of MCH/FP services low
■ Professional stall larger than necessary (ratio of MCH/FP nursing staff to target population
was 1:1400, approximately double that required).
■ The scope, effectiveness and efficiency of preventive/promotive services need
improvement.
■ Inefficient equipment was noted to be a major problem affecting the effectiveness of these
health facilities - either lacking or out of order.
In the focus group discussions with some groups selected from resident communities, all members of
the groups felt that the services could be improved if drugs and medicines were available. I hey
would like to have specialised services such as laboratory and x-ray available at their facilities.
A client satisfaction tool has been developed from a study done at the University of Free State
(Abdul et al, 2000), and showed that client satisfaction depends on:
15
■ Factors related to clinical aspects of health care e.g. correct diagnosis, explaining illness to
client etc.
■ Factors related to the humanness of care and personal demeanour of the clinic personnel,
such as being caring and friendly etc.
■ Factors related to the management of care in clinic such as waiting time, availability of
medicines etc.
■ Factors related to the physical facilities within which caring/treatment takes place, such as
seating area, cleanliness, ventilation etc.
Abdul concluded that the client satisfaction tool provided useful factual information that helped
clinic staff to discuss the problems, workout solution and strengthen team spirit for quality care.
‘A Quality of care Beneficiary Assessment Study' was commissioned by World Bank in Zambia
(1992) designed to provide preliminary indicators of the extent of the differences in quality of care
provided in rural and urban areas and the differences in perception of quality of care issues expressed
by beneficiaries. Results indicated a need for quality assurance in that rural areas complained ot
problem of distance and lack of staff, and urban areas complained of shortage of drugs and poor staff
attitudes (WHO 1994).
The input of quality on utilisation was shown in a UNICEF (1995) Bamako initiative baseline study
of public sector primary health care services. This study found that, in one district in Pakistan, the
community saw no value in using local health facilities for necessary care due to the low quality of
care there; only 5% of sick children were taken to local health facilities for treatment.
In a study of rural health facilities in Papua New Guinea (Gayner, et al, 1990), the private mission
health centres were found to have a higher quality of care than the Government health centres. The
study used structural indicators to assess quality. It reviewed the performance of the health centres
16
in basic but essential tasks, such as immunisations, and in adherence to treatment protocols, as well
as assessing their staffing, equipment and facilities. Two explanations for their ability to offer higher
quality care were that the mission health centres had more staff and used more money to operate.
They also had better communication, supervision and maintenance.
A cost study of government facilities (Fabricant et al, 1994) used structural indicators and found that
the reference private Mission facilities provided higher quality care based on those indicators. The
higher quality was evidenced by fewer drug stock-outs, better-trained and supervised staff, more
functional essential equipment and better maintenance of the equipment and facilities. The demand
for health services was much greater in part due to their higher quality, and they drew their patients
from a much wider geographical area than the comparable government facilities.
The w illingness of users of health services to pay for quality has been studied. In general, it has been
found that quality of care is important in determining user demand and utilisation patterns for health
care providers. For example, Denton et al (1991) examined the question of how quality changes
would affect demand for health services and found significant increment in demand. Patients were
willing to pay for these quality increases. Improvements would have a larger impact on increasing
demand than lower prices. However, these findings were not observed changes but simulations trom
the data.
Wouters (1991) reviewed a number o f the studies of willingness to pay for health services. I he
demand studies suggested that quality was an important decision variable for users choosing a
provider and that they were willing to pay for quality improvements. Since those studies relied on
structural assessments of quality, they found that the most important variable was the availability of
17
drugs. There was a much weaker relationship between choice of provider and other aspects of
quality such as amenities, properly maintained facilities and type of provider.
The WHO study group on Primary Health Care in urban areas in their report on the role of health
centres in the development o f urban health systems cites experience in different countries (WHO,
1992) as follows.
1. In 1990, the Dar es Salaam urban health project was established with the aim of promoting high
quality decentralised health care management. An analysis of health service utilisation rates led
to the identification of geographical areas where populations are under served. In order to
improve access to, and coverage o f health services, first contact health units (local dispensaries
and health centres) were renovated and equipped to enable them to handle most of the common
diseases, thus easing the burden on the hospitals. In order to promote integration, emphasis is
placed on the co-ordination of health activities by all relevant institutions.
. 2. In Bombay, an examination of the pattern of health service utilisation by the urban poor revealed
that a large majority of them use health services in the private sector for minor ailments. In part,
this was due to widespread unawareness of the existence of health posts because ol poor trained
staff, and to problems in planning and management. In addition, emphasis on family planning
and immunisation has led to neglect of other areas.
3. In Dakar, (Senegal) coverage by health centres is still very uneven and access to primary health
care is greatly hampered by geographical factors. Health Centres are not adequately equipped to
offer more than health posts (dispensaries) do, while there is no first referral hospital, and the
University teaching Hospital is overwhelmed with inappropriate cases as a result. There is a
political will to decentralise services, but it is proving difficult to do so.
3. In Cali, Columbia’s third largest city, there has been a deliberate effort on the part of the local
health authorities to reduce pressure on the university hospital. An initial survey ot the use ot
18

ambulatory facilities showed that the health centres were under-utilised, while the University
hospital was mainly engaged in procedures of a fairly elementary kind. To remedy this, five
strategically located centres were chosen to offer 24 hour medical attention, their diagnostic
facilities were upgraded, delivery rooms for low risk pregnancies attended by trained nurse
midwives were opened, and a surgical programme for outpatient and short stay day surgery was
started. These upgraded health centres have become the cornerstones of the health care delivery
system.
19

3. METHODOLOGY
3.1.1. STUDY SITE:
The study was conducted within the Kisumu Municipal Council in Kisumu District, Nyanza
Province. The District is mainly inhabited by the Luo community, but the municipality is
cosmopolitan with members of all communities who have moved in with the urbanisation. The
Municipal boundaries extend well into the rural areas.
3.1.2.KISUMU DISTRICT/MUNICPALITY PROFILE
Kisumu Municipality occupies Winam Division of Kisumu District. Kisumu District is one of the
twelve (12) Districts in Nyanza Province and is the Provincial Headquarters. The District has a total
population of 539, 966 people of which 21,599 and 97,194 are estimated to be children below one and
five years respectively. Of the total population, 353,254 people are in the Municipality or Winam
Division.
Table 3.1. Population by Division, Number of Household, Are and Density (2002)
Division Total Pop. <5 Years HH Area (km2) Density
District 539,966 97,194 123,341 918.5 549Winam 353,254 63,586 82,834 395.1 837Maseno 69,915 12,585 15,170 168.7 411Korn be wa 64,432 11,598 14,289 192.1 333Kadi bo 52,267 9,426 11,048 162.7 319
Note: Population Projection from 1999 census figures considering growth rate ot 2.3%
The General Fertility Rate (GFR) of the District is 172/1000 while the Infant Mortality Rate (1MR).
Under 5 Mortality Rate (U5MR) and Maternal Mortality Rate (MMR) are 90/1000, 110/1000 and
200-223/100.000 respectively. The immunization coverage is 56%.
The five leading causes of outpatient morbidity are Malaria, Diseases of the respiratory system. Diseases
of the skin. Diarrheal diseases and Intestinal worms, (Kisumu District Health Profile, 2002).
20

3.1.3. KISUMU MUNCIPAL COUNCIL
The Municipality falls under Winam Division and covers an area of 395.1 Km2 with a population of
353,254 and a population density of 887 Km2. The Local Authorities Act and several pieces of
legislation govern the operations of the Municipality. The council's main functions are:
■ Mobilize internal and external resources and, within existing regulatory framework, to divert
resource towards meeting basic social needs of the population in the Municipality.
■ Provide social services especially water and sewerage services.
■ Infrastructure development (roads, parking spaces, houses).
■ Environmental sanitation, garbage collection and disposal.
■ Housing, Health, Education, welfare-markets and sports.
■ Nurturing an enabling environment for the enhanced participation of the citizens in urban
development.
Public Health Department:
The Municipal Medical Officer of Health (MMOH) assisted by the Chief Public Health Officer, Matron
and various sectional heads this.
Facilities operated by the Council:
Type No
Hospital 0
Health center with beds 2
Health center without beds 2
Dispensaries 7
Clinics 1 (in Town E
These are represented in the map overleaf (figure 3.1).
21
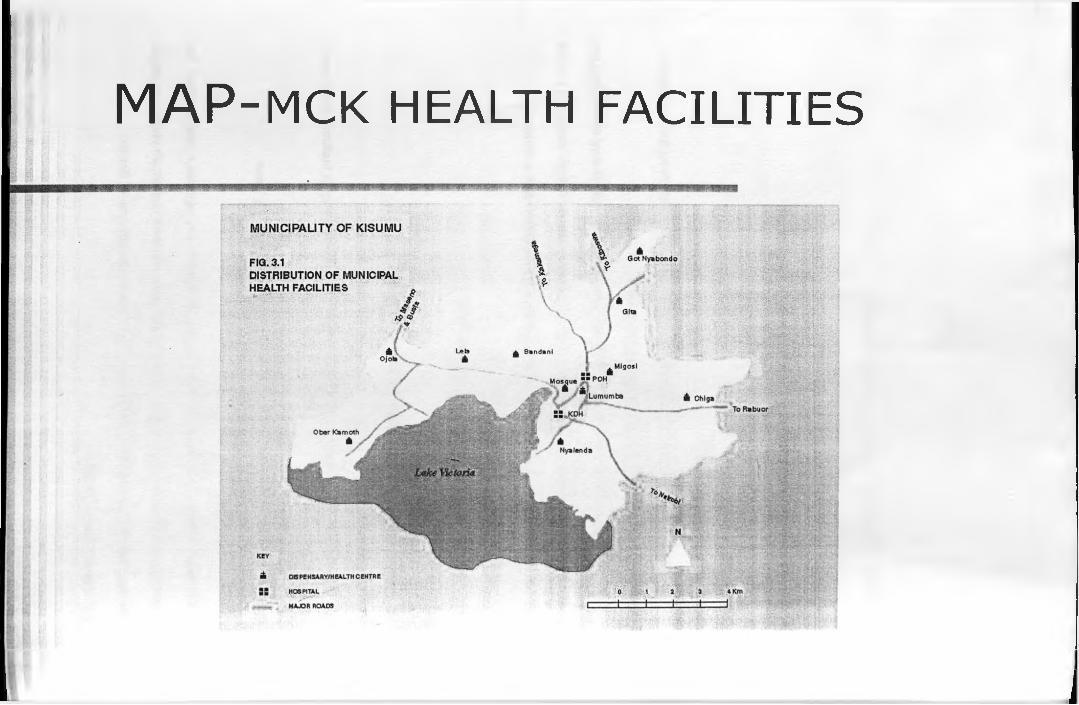
MAP-mck health facilities
J

3.2. STUDY POPULATION;
Data was collected from three sources, so as to give a more rounded view of quality.
1. Household Interviews with mothers in their homes from the areas selected by random sampling.
Questions mainly focused on Antenatal clinic attendance and children's immunisation and
treatment attendance.
The study population was women in the reproductive age group (15 - 49) years.
Inclusion Criteria
■ Women in the age bracket 1 5 -4 9 years and have at least one child, or pregnant at the time of
the survey
■ Women who are residents within the area (municipality)
Exclusion Criteria
■ Women outside the age bracket of 15 - 49 years.
■ Women who have never been pregnant
■ Visitors to the area/ temporary residents who have stayed for less than 6 months
2. Facility audit to determine the capacity of the facilities to deliver quality services. 11 health
facilities were included in the study. Town Hall clinic, which deals mainly with council staff and
immunisation of international travellers, was excluded.
3. Exit interviews of a small sample of clients attending ANC/MCH clinics in all the 11 facilities.
3.3. STUDY DESIGN:
The study was a descriptive cross-sectional survey:
3.4. SAMPLING:
The facility audit was done in all the 11 health facilities.
22
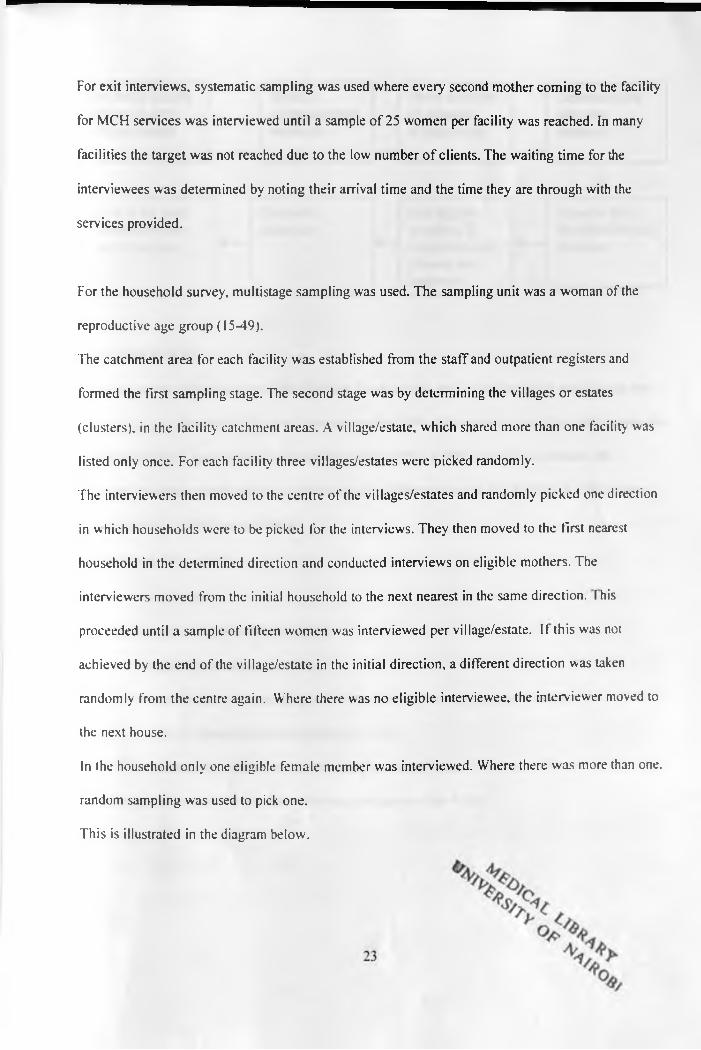
For exit interviews, systematic sampling was used where every second mother coming to the facility
for MCH services was interviewed until a sample of 25 women per facility was reached. In many
facilities the target was not reached due to the low number of clients. The waiting time for the
interviewees was determined by noting their arrival time and the time they are through with the
services provided.
For the household survey, multistage sampling was used. The sampling unit was a woman of the
reproductive age group (15-49).
The catchment area for each facility was established from the staff and outpatient registers and
formed the first sampling stage. The second stage was by determining the villages or estates
(clusters), in the facility catchment areas. A village/estate, which shared more than one facility was
listed only once. For each facility three villages/estates were picked randomly.
The interviewers then moved to the centre of the villages/estates and randomly picked one direction
in which households were to be picked for the interviews. They then moved to the first nearest
household in the determined direction and conducted interviews on eligible mothers. The
interviewers moved from the initial household to the next nearest in the same direction. I his
proceeded until a sample of fifteen women was interviewed per village/estate. It this was not
achieved by the end of the village/estate in the initial direction, a different direction was taken
randomly from the centre again. Where there was no eligible interviewee, the interviewer moved to
the next house.
In the household only one eligible female member was interviewed. Where there was more than one.
random sampling was used to pick one.
This is illustrated in the diagram below.
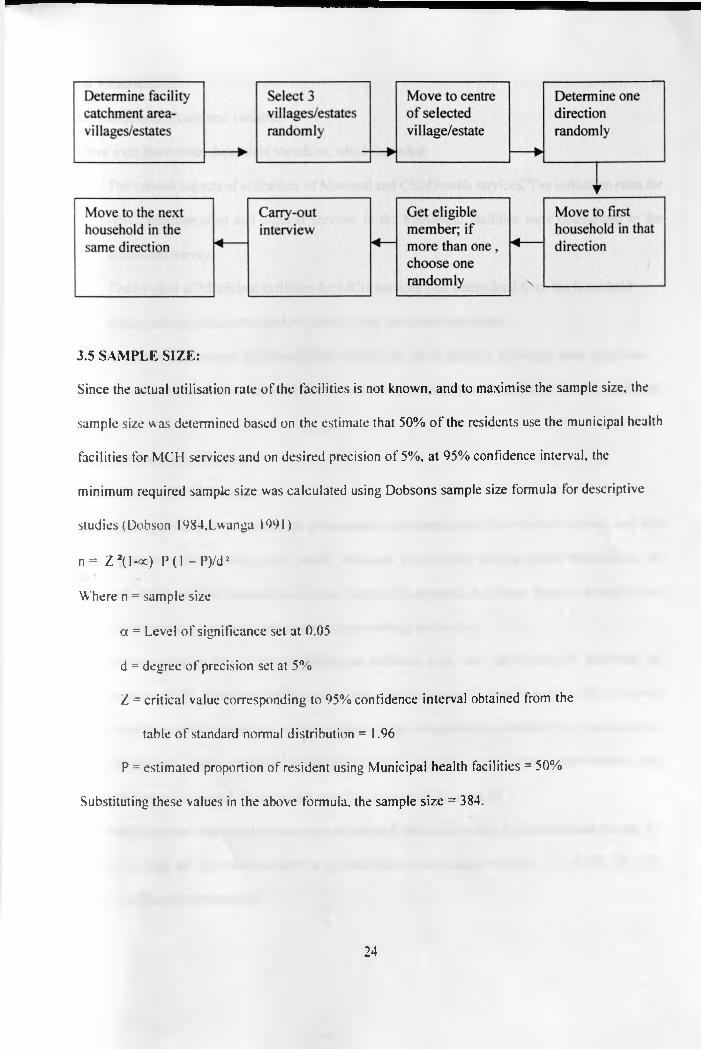
3.5 SAMPLE SIZE:
Since the actual utilisation rate of the facilities is not known, and to maximise the sample size, the
sample size was determined based on the estimate that 50% of the residents use the municipal health
facilities for MCH services and on desired precision of 5%, at 95% confidence interval, the
minimum required sample size was calculated using Dobsons sample size formula lor descriptive
studies (Dobson 1984,Lwanga 1991)
n = Z 2(l-oc) P(1 -P ) /d 2
Where n = sample size
a = Level of significance set at 0.05
d = degree of precision set at 5%
Z = critical value corresponding to 95% confidence interval obtained from the
table of standard normal distribution = 1.96
P = estimated proportion of resident using Municipal health facilities = 50%
Substituting these values in the above formula, the sample size = 384.
24

3.6 VARIABLES:
3.6.1.Dependent/outcome variable:
There were three main dependent variables, which included:
1. The various aspects of utilisation o f Maternal and Child health services. The utilisation rates for
ANC, Immunisation and clinical services in the Municipal facilities were determined in the
household survey.
2. The by-pass of Municipal facilities for MCH services was determined from the household
survey and the rates computed for various facilities catchment areas.
3. Ever-use of Municipal facilities by the mothers for MCH services in the last three years was
also determined from household interview and the percentages computed per facility catchment
areas.
3.6.2 Independent variables.
These included the following.
1. Quality o f care as perceived by respondents was determined from both household and exit
interviews. It focussed mainly on the structural aspects like client-provider relationship, the
providers technical competence, physical inputs like grounds, buildings, drugs and supplies and
administrative issues including opening and waiting times e.t.c.
2. Quality o f care from the professional or technical view was determined by assessing the
capacity of the facilities to offer quality care. This was done by facility audit using a prepared
checklist containing various variable categories like infrastructure, availability of basic medical
equipment, drugs, vaccines, infection control facilities and other management and
administrative issues. The detailed checklist is attached in appendix 1.
The staffing pattern and workload was also determined for each facility. Also determined was the in-
service training for the technical staff in various areas of reproductive health, like KEPI, FP. SI I.
IMCI, CDD, and management.
25
3. In addition socio-demographic variables that may be hypothesised to influence attendance was
taken including age, education status, marital status, pregnancy status, occupation, household
size, type o f dwelling, etc.
3.7 DATA COLLECTION:
37.1 Instruments:
The survey was conducted using,
1. Household questionnaire with closed-ended questions for the respondents perceived quality
of care.
2 . (Questionnaire for exit interviews.
4. Facility audit checklist tilled with the help of the facility in-charges and investigator
observation.
In the household interview mothers were questioned about their nearest Municipal health tacilities
and where they go for MCH services and the reasons for not attending Municipal health tacilities for
those who do not. Those who utilise the municipal facilities were asked to rate the services using the
various attributes of quality of care, from the conceptual framework adapted and modified from
Donabedian and Juran. Data was also collected on the socio-demographic characteristics ot the
respondents.
Exit interviews were conducted on a few clients mainly focussing on staff competence and
interaction with the client. The length of time taken by the clients to get treatment was also
determined
The household and exit surveys were complemented by a facility audit/inventory to determine the
readiness of the facilities to serve the clients, with emphasis on MCH services. Data was collected
about structural attributes of quality of care including the physical infrastructure, availability of basic
26

equipment, drugs and other supplies, staffing and management issues e.g. staff meetings, supervision
etc. Observations were made on opening and closing time o f the facility, time first patient arrived
and the time he/she is seen, and length o f lunch-break.
3.7.2 Procedure:
After the necessary approvals, (University of Nairobi and Ministry of education), the investigator
called on the Municipal MOH and Town Clerk to brief them and get their approval as well and notify
the health facilities.
The District Officer of Winam Division was also briefed so that he informs the Chiefs and Sub
chiefs to mobilise the communities accordingly.
The research team was then recruited and trained on the questionnaire and interviewing techniques
so as to make the interviewing standardised.
The survey was then done over a period of fourteen days, with the principal investigator supervising
the teams daily. I he interviewers asked all the study subjects the same questions in the manner and
order using the same words. Three languages, English, Kiswahili, and Luo were used depending on
which the interviewee is comfortable with.
The Principal investigator was concurrently conducting facility audit with the help of an assistant in
the facilities.
3.8 MINIMISATION OF ERRORS AND BIAS
Non-sampling errors were reduced by proper training of the interviewers so that they understand the
questions well. They were made to understand and be in a position to ask the questions in all possible
languages- Luo, Kiswahili and English. To get the confidence of the mothers, only female
interviewers were recruited. The questionnaire was pre-tested at the District Hospital for exit
27

interview and in a few households for the household questionnaire and any ambiguity corrected
before the survey started.
The filled questionnaires were edited at the end of each day for completeness and accuracy of data.
Confidentiality o f information was emphasised to the respondents.
Bias was minimised by random sampling procedure .The survey program included weekends so as to
get as many mothers at home as possible. The interviewers were also instructed to make return visits
where women were missed.
3.9. DATA MANGEMENT
All collected data was entered into the computer and analysed using SPSS package. Data was
presented in form of tables, diagrams and graphs. Descriptive statistics were determined on the
respondent's socio-demographic characteristics. Rates and proportions were determined during the
analysis. Statistical analysis was performed using chi square and Spearmans rank coefficient
measures of association.
3.10. ETHICAL CONSIDERATIONS
Informed consent was obtained from respondents before commencing the interview. The respondents
had the option to decline the interview or answering questions they are not comtortable with. Ihe
information collected was kept confidential and names of respondents were not included on the
questionnaire. In particular all respondents were explained the objectives of the study.
For facility audit and exit interviews, the investigator did not participate in any procedures or
interfere with patient management or smooth running of the facility.
3.11. LIMITATIONS
1. Some mothers were missed during the survey; either they had gone to work or the farms. Return
visits were hampered by logistical problems.
2. Some mothers refused to be interviewed especially in the affluent estates.
28

4.RESULTS:
4.1.HOUSEHOLD:
4.1.1.SOCIO-DEMOGRAPHIC CHARACTERISTICS:
A total of 482 mothers were interviewed and all responded to the questionnaire, though some were
undecided about some of the questions.
The socio-demographic characteristics are summarised in table 4.1 below.
Table 4.1: Sample size, mean age of respondents, marital status mean household size and mean
number of under-fives in households by facility catchment
Facilitycatchment
Sample size of mothers
Mean age ofmothers
Meanhouseholdsize
Mean no. U5 in household
Lumumba 43 28 4.7 1.5Ober kamoth 45 27 5.0 1.5Migosi 45 26 4.9 1.3Gita 45 27 4.9 1.5Lela 45 26 5.0 1.5Bandani 48 26 5.0 1.5Nyalenda 46 26 4.6 1.4G.Nyabono 42 28 5.9 1.6
Mosque 40 26 4.4 1.4Chiga 41 28 5.5 1.8Ojola 42 27 5.3 1.6
TOTAL 482 27 5.0 1.5
As can be seen above, there is minimal difference in the shown characteristics between the different
catchment areas.
fhe respondents had a mean age of 26.8 years (SD 7.04).
The average household size of the respondents was 5 (SD 1.94), while the mean number of under-
Five year old children was 1.5 per household.
About 80% of these women were married while 8.9% and 8.7% were single and widowed
respectively.
29
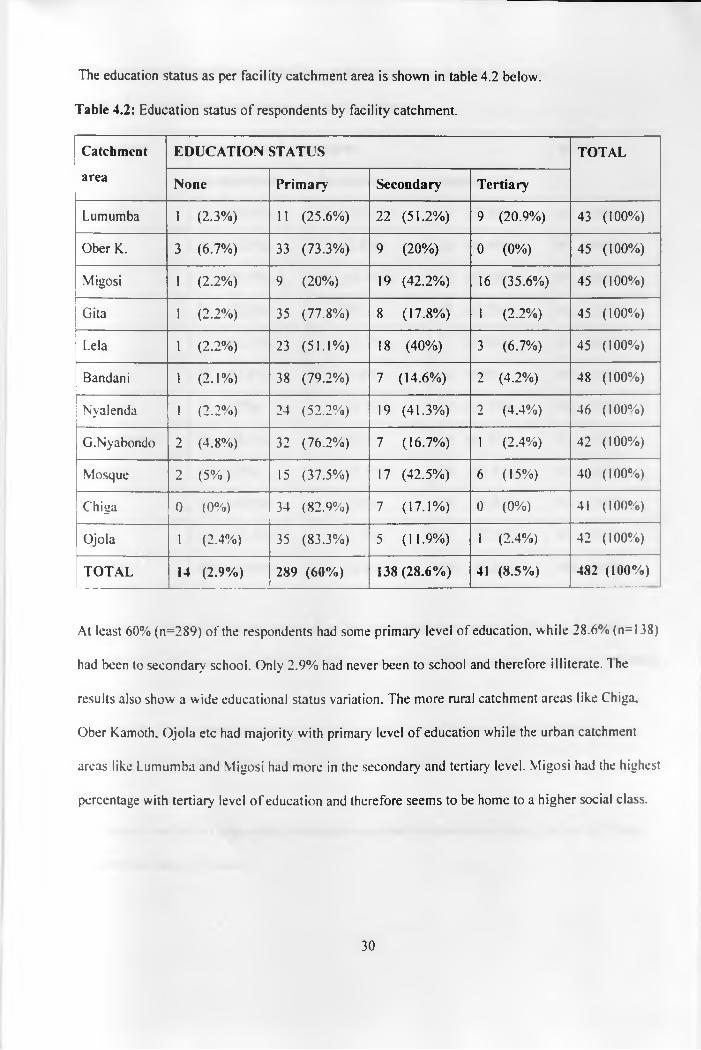
The education status as per facility catchment area is shown in table 4.2 below.
Table 4.2: Education status o f respondents by facility catchment.
Catchment EDUCATION STATUS TOTAL
area None Primary Secondary Tertiary
Lumumba 1 (2.3%) 11 (25.6%) 22 (51.2%) 9 (20.9%) 43 (100%)
Ober K. 3 (6.7%) 33 (73.3%) 9 (20%) 0 (0 %) 45 (100%)
Migosi 1 (2 .2%) 9 (20%) 19 (42.2%) 16 (35.6%) 45 (100%)
Gita 1 (2 .2%) 35 (77.8%) 8 (17.8%) 1 (2 .2%) 45 (100%)
Lela 1 (2 .2%) 23 (51.1%) 18 (40%) 3 (6.7%) 45 (100%)
Bandani 1 (2 . 1%) 38 (79.2%) 7 (14.6%) 2 (4.2%) 48 (100%)
Nyalenda 1 (2 .2%) 24 (52.2%) 19 (41.3%) 2 (4.4%) 46 (100%)
G.Nyabondo 2 (4.8%) 32 (76.2%) 7 (16.7%) 1 (2.4%) 42 (100%)
Mosque 2 (5%) 15 (37.5%) 17 (42.5%) 6 (15%) 40 (100%)
Chiga 0 (0%) 34 (82.9%) 7 (17.1%) 0 (0%) 41 (100%)
Ojola 1 (2.4%) 35 (83.3%) 5 (11.9%) 1 (2.4%) 42 (100%)
TOTAL 14 (2.9%) 289 (60%) 138 (28.6%) 41 (8.5%) 482 (100%)
At least 60% (n=289) of the respondents had some primary level of education, while 28.6% (n= 138)
had been to secondary school. Only 2.9% had never been to school and therefore illiterate. The
results also show a wide educational status variation. The more rural catchment areas like Chiga.
Ober Kamoth, Ojola etc had majority with primary level of education while the urban catchment
areas like Lumumba and Migosi had more in the secondary and tertiary level. Migosi had the highest
percentage with tertiary level of education and therefore seems to be home to a higher social class.
30

The occupation o f respondents by facility catchment is shown in table 4.3 below.
Table 4.3: Occupation o f respondents by facility cathment.
Catchment Occupation of respondent TOTAL
area Un-employed Employed Business lady
Lumumba 20 (46.5%) 11 (25.6%) 12 (27.9%) 43 ( 100%)
Ober k. 24 (53.3%) 1 (2 .2%) 2 0 (44.4%) 45 ( 100%)
Migosi 13 (29.5%) 19 (43.2%) 12 (27.3%) 44 ( 100%)
Gita 26 (57.8%) 0 (0%) 19 (42.2%) 45 ( 100%)
Lela 23 (61.1%) 5 ( 11.1%) 17 (37.8%) 45 ( 100%)
Bandani 22 (45.8%) 2 (4.2%) 24 (50%) 48 ( 100%)
Nyalenda 17 (37%) 5 (10.9%) 24 (52.2%) 46 ( 100%)
G.Nyabondo 16 (38.1%) 0 (0%) 26 (61.9%) 42 ( 100%)
Mosque 14 (35%) 7 (17.5%) 19 (47.5%) 40 ( 100%)
Chiua 20 (48.8%) 1 (2.4%) 20 (48.8%) 41 ( 100%)
Ojola 26 (61.9%) 1 (2.4%) 15 (35.7%) 42 ( 100%)
TOTAL 221 (45.9%) 52 (10.8%) 208 (43.2%) 481 (100%)
Again, it can be noted that more women from the urban catchment areas like Migosi, Lumumba.
Mosque were in formal employment than those from rural, like Ober Kamoth, Chiga, Got Nyabondo,
Ojola, etc.
At least 43% of the respondents were involved in some form of business, while 42.2% were
housewives. Only 10.8% were in formal salaried employment.
The type of dwelling of respondents was also determined by observation during the survey. These
are shown in table 4.4 below.
31
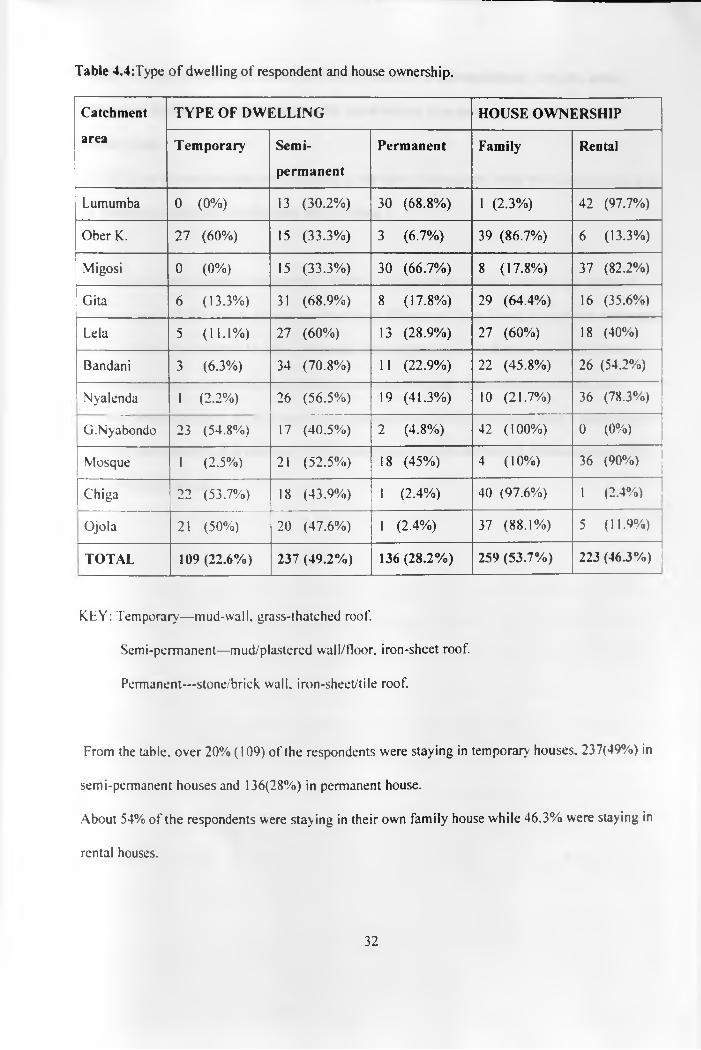
Table 4.4:Type o f dwelling of respondent and house ownership.
Catchment
area
TYPE OF DWELLING HOUSE OWNERSHIP
Temporary Semi
permanent
Permanent Family Rental
Lumumba 0 (0%) 13 (30.2%) 30 (6 8 .8%) 1 (2.3%) 42 (97.7%)
Ober K. 27 (60%) 15 (33.3%) 3 (6.7%) 39 (86.7%) 6 (13.3%)
Migosi 0 (0%) 15 (33.3%) 30 (66.7%) 8 (17.8%) 37 (82.2%)
Gita 6 (13.3%) 31 (68.9%) 8 (17.8%) 29 (64.4%) 16 (35.6%)
Lela 5 (11.1%) 27 (60%) 13 (28.9%) 27 (60%) 18 (40%)
Bandani 3 (6.3%) 34 (70.8%) 11 (22.9%) 22 (45.8%) 26 (54.2%)
Nyalenda 1 (2 .2%) 26 (56.5%) 19 (41.3%) 10 (21.7%) 36 (78.3%)
G.Nyabondo 23 (54.8%) 17 (40.5%) 2 (4.8%) 42 (100%) 0 (0%)
Mosque 1 (2.5%) 21 (52.5%) 18 (45%) 4 (10%) 36 (90%)
Chiga 22 (53.7%) 18 (43.9%) 1 (2.4%) 40 (97.6%) 1 (2.4%)
Ojola 21 (50%) 20 (47.6%) 1 (2.4%) 37 (88.1%) 5 (11.9%)
TOTAL 109 (22.6%) 237 (49.2%) 136 (28.2%) 259 (53.7%) 223 (46.3%)
KEY: Temporary—mud-wall, grass-thatched roof.
Semi-permanent—mud/plastered wall/floor, iron-sheet roof.
Permanent—stone/brick. wall, iron-sheet/tile roof.
From the table, over 20% (109) of the respondents were staying in temporary houses, 237(49%) in
semi-permanent houses and 136(28%) in permanent house.
About 54% of the respondents were stay ing in their own family house while 46.3% were staying in
rental houses.
32

The same variation between the urban and rural differences is still manifested , with the urban
mothers more likely to be living in permanent, rental houses than their counterparts in rural
catchment areas.
Some 58.3% of the respondents were lactating at the time of the survey while 6% were pregnant and
were therefore expected to be attending MCH clinics.
From the socio-demographic characteristics, there is a significant variation between the different
catchment areas, which can be viewed as urban-rural difference. Those living in the urban catchment
areas like Migosi, Lumumba, Mosque, Nyalenda, have higher level of education, more in formal
salaried employement and more likely living in permanent houses. The mothers from the rural
catchment areas like Chiga, Ober kamoth. Got Nyabondo etc on the other hand have a lower level of
education, un-employed or in informal business and more likely to be staying in temporary or semi
permanent family house.
33
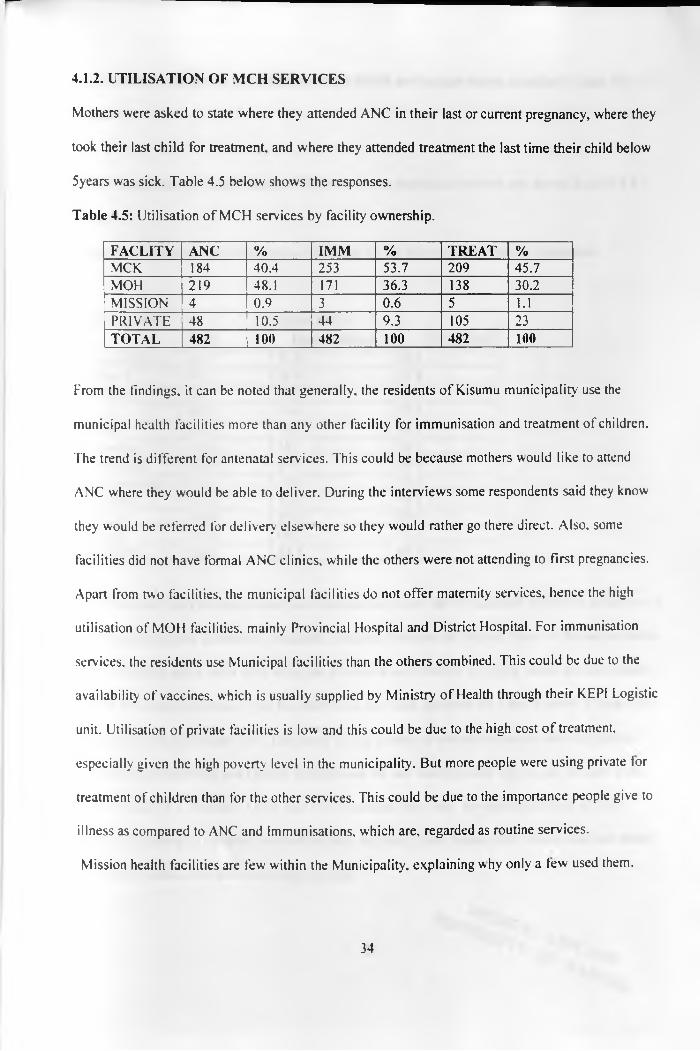
4.1.2. UTILISATION OF MCH SERVICES
Mothers were asked to state where they attended ANC in their last or current pregnancy, where they
took their last child for treatment, and where they attended treatment the last time their child below
5years was sick. Table 4.5 below shows the responses.
Table 4.5: Utilisation of MCH services by facility ownership.
FACLITY ANC % IMM % TREAT %MCK 184 40.4 253 53.7 209 45.7MOH 219 48.1 171 36.3 138 30.2MISSION r~4 0.9 3 0.6 5 1.1PRIVATE 48 10.5 44 9.3 105 23TOTAL 482 100 482 100 482 100
From the findings, it can be noted that generally, the residents of Kisumu municipality use the
municipal health facilities more than any other facility for immunisation and treatment of children.
The trend is different for antenatal services. This could be because mothers would like to attend
ANC where they would be able to deliver. During the interviews some respondents said they know
they would be referred for delivery elsewhere so they would rather go there direct. Also, some
facilities did not have formal ANC clinics, while the others were not attending to first pregnancies.
Apart from two facilities, the municipal facilities do not offer maternity services, hence the high
utilisation of MOH facilities, mainly Provincial Hospital and District Hospital. For immunisation
services, the residents use Municipal facilities than the others combined. This could be due to the
availability of vaccines, which is usually supplied by Ministry of Health through their KEPI Logistic
unit. Utilisation of private facilities is low and this could be due to the high cost o f treatment,
especially given the high poverty level in the municipality. But more people were using private tor
treatment of children than for the other services. This could be due to the importance people give to
illness as compared to ANC and Immunisations, which are, regarded as routine services.
Mission health facilities are few within the Municipality, explaining why only a tew used them.
34

As for individual facilities, the utilisation of the MCH services are shown in tables 1, 2 and 3 in
Annex 4.
The utilisation rates (%) of Municipal facilities for the individual services are shown in table 4.6
below.
Table 4.6: Utilisation rate of Municipal facilities for MCH services by facility catchment
FACILITY UTILISATION %
1 ANC Immunization TreatmentLumumba 34.1 42.9 36.6
[Ober K. 91.1 88.9 57.8Migosi 4.4 20.5 20.5Gita 64.9 74.4 39.5Lela 43.2 53.3 40.0
j Bandani 15.6 29.2 36.21 Nyalenda 32.6 44.4 34.9
G.nyabondo 37.1 51.3 52.6Mosque 13.2 33.3 40.5Chiga 78.0 89.7 78.0
1 Ojola 31.7 66.7 71.1\ TOTAL 40.4 53.7 45.7
It can be noted from the results that the utilisation rate is low for the facilities within the urban part ot
the Municipality like Lumumba, Nyalenda, Bandani, Mosque and Migosi. Most o f the people within
these catchment areas seem to be using the Provincial and District hospitals, which are also located
within the urban municipality. On the other hand, the rural facilities like Ober Kamoth, Chiga. Gita,
Ojola have high utilisation rates. This could be due to lack o f alternative service delivery points,
given that the Provincial and District hospitals are far and transport cost high as can be seen in the
map in section 3.1. Bandani, Ojola. and Got Nyabondo have very low utilisation rates of ANC
services compared to the other services because they don't have formal ANC clinics and just attend
to whoever comes, and then refers appropriately.
1S /? y ~ O # * y Op35

Tables 1,2 and 3 in Annex 4 also show that most of those who were not using the Municipal facilities
were more likely to use Provincial or District hospitals. Further analysis showed that the distance
from the two MOH hospitals from the respondent’s area of residence had a bearing on which of the
two facilities they would use. This is illustrated more clearly in chapter 4.4.
4.13. BY-PASS OF MUNICIPAL FACILITIES:
By-pass was defined as attending a service from a facility other than the nearest Municipal facility
for any of the three MCH serv ices.
Bypass rates of municipal facilities were determined for each service as shown in table 4.7 below.
Table 4.7: By-pass rate of MCH services.
SERVICES BY-PASSYES NO TOTAL
ANC 271 ( 59.5%) 184 (40.5%) 455 (100)IMMUN. 218 (46.3%) 253 (53.7%) 471 (100)TREATMENT 248 (54.3%) 209 (45.7%) 457 (100)
! TOTAL 737 (53.4%) 646 (46.7%) 1383 (100)
Hence the by-pass rate for ANC and treatment is more than 50% while it is less than 50% for
immunisation. A majority of the mothers therefore preferred municipal facilities for immunisation
while preferring other facilities especially MOH for the other MCH services.
The by-pass rate for at least one MCH service was as shown in table 4.8 below.
36
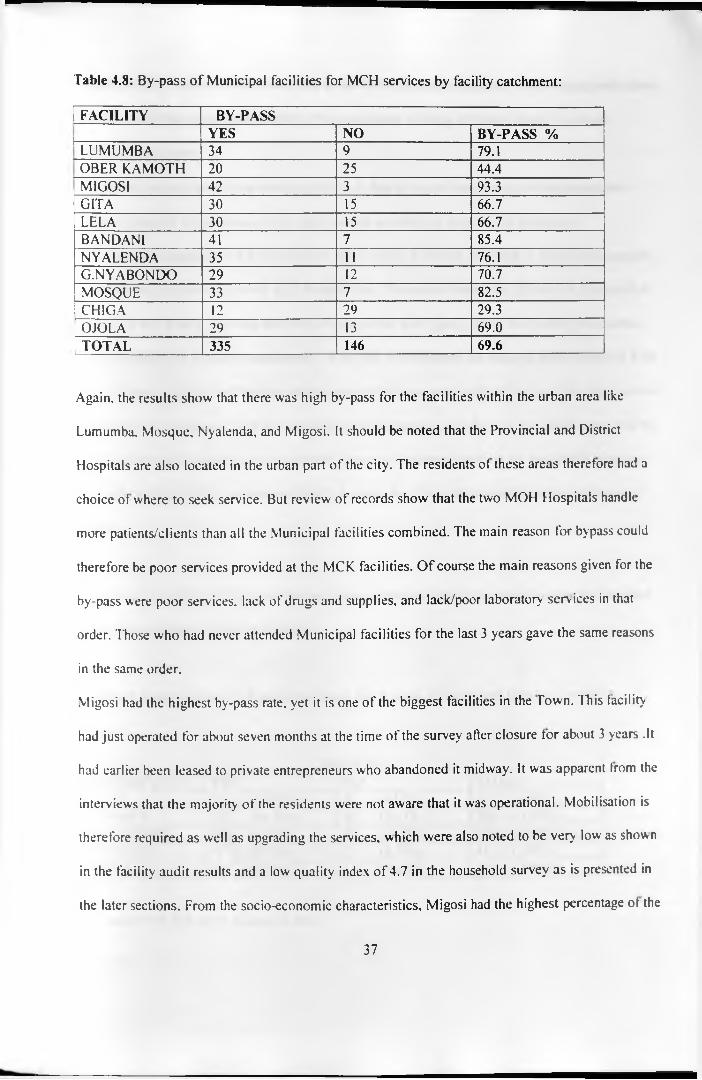
Table 4.8: By-pass o f Municipal facilities for MCH services by facility catchment:
FACILITY BY-PASS| YES NO BY-PASS %
LUMUMBA 34 9 79.1OBER KAMOTH 20 25 44.4MIGOSI 42 3 93.3GITA 30 15 66.7LELA 30 15 66.7BANDANI 41 7 85.4NYALENDA 35 11 76.1G.NYABONDO 29 12 70.7MOSQUE 33 7 82.5
| CHIGA 12 29 29.3I OJOLA 29 13 69.0[ t o t a l 335 146 69.6
Again, the results show that there was high by-pass for the facilities within the urban area like
Lumumba. Mosque, Nyalenda, and Migosi. It should be noted that the Provincial and District
Hospitals are also located in the urban part of the city. The residents ot these areas therefore had a
choice of where to seek service. But review of records show that the two MOH Hospitals handle
more patients/clients than all the Municipal facilities combined. The main reason for bypass could
therefore be poor services provided at the MCK facilities. O f course the main reasons given for the
by-pass were poor services, lack of drugs and supplies, and lack/poor laboratory services in that
order. Those who had never attended Municipal facilities for the last 3 years gave the same reasons
in the same order.
Migosi had the highest by-pass rate, yet it is one of the biggest facilities in the Town. This facility
had just operated for about seven months at the time of the survey after closure for about 3 years .It
had earlier been leased to private entrepreneurs who abandoned it midway. It was apparent from the
interviews that the majority of the residents were not aware that it was operational. Mobilisation is
therefore required as well as upgrading the services, which were also noted to be very low as shown
in the facility audit results and a low quality index of 4.7 in the household survey as is presented in
the later sections. From the socio-economic characteristics, Migosi had the highest percentage ot the
37
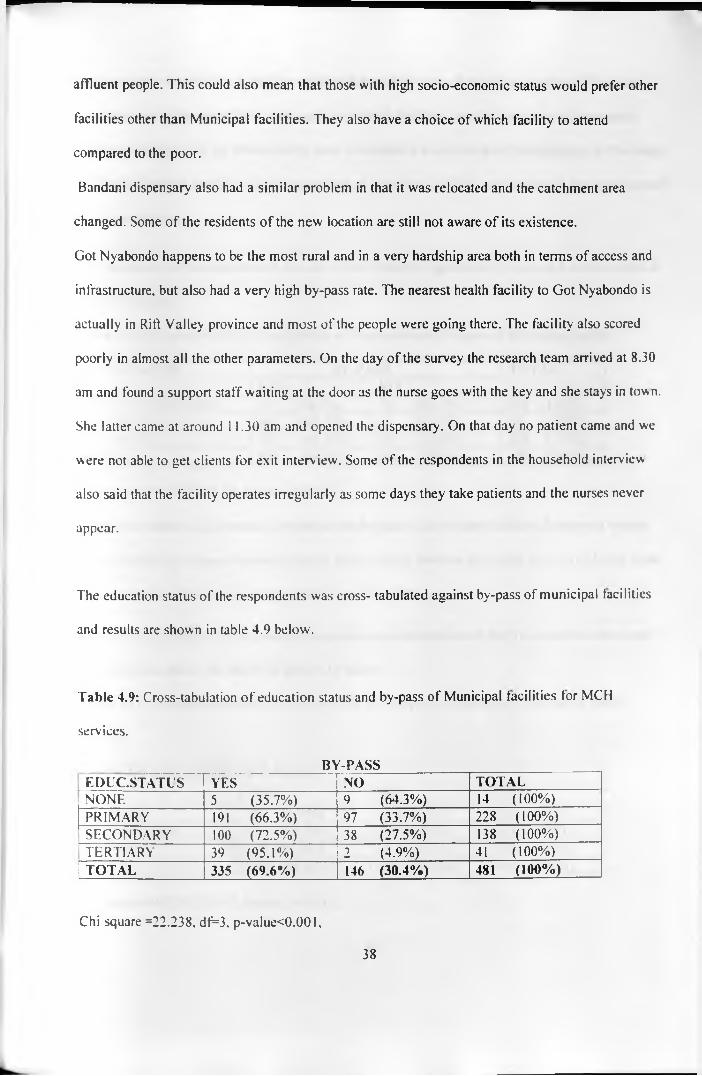
affluent people. This could also mean that those with high socio-economic status would prefer other
facilities other than Municipal facilities. They also have a choice of which facility to attend
compared to the poor.
Bandani dispensary also had a similar problem in that it was relocated and the catchment area
changed. Some of the residents of the new location are still not aware of its existence.
Got Nyabondo happens to be the most rural and in a very hardship area both in terms of access and
infrastructure, but also had a very high by-pass rate. The nearest health facility to Got Nyabondo is
actually in Rift Valley province and most of the people were going there. The facility also scored
poorly in almost all the other parameters. On the day of the survey the research team arrived at 8.30
am and found a support staff waiting at the door as the nurse goes with the key and she stays in town.
She latter came at around 11.30 am and opened the dispensary . On that day no patient came and we
were not able to get clients for exit interv iew. Some of the respondents in the household interview
also said that the facility operates irregularly as some days they take patients and the nurses never
appear.
The education status of the respondents was cross- tabulated against by-pass of municipal facilities
and results are shown in table 4.9 below.
Table 4.9: Cross-tabulation of education status and by-pass of Municipal facilities for MCH
services.
BY-PASSEDUC.STATUS YES NO TOTAL
j NONE 5 (35.7%) 9 (64.3%) 14 ( 100%)PRIMARY 191 (66.3%) 97 (33.7%) 228 ( 100%)SECONDARY 100 (72.5%) 38 (27.5%) 138 ( 100%)TERTIARY 39 (95.1%) 2 (4.9%) 41 ( 100%)
1 TOTAL 335 (69.6%) 146 (30.4%) 481 (100%)
Chi square =22.238, df=3. p-value<0.001.
38
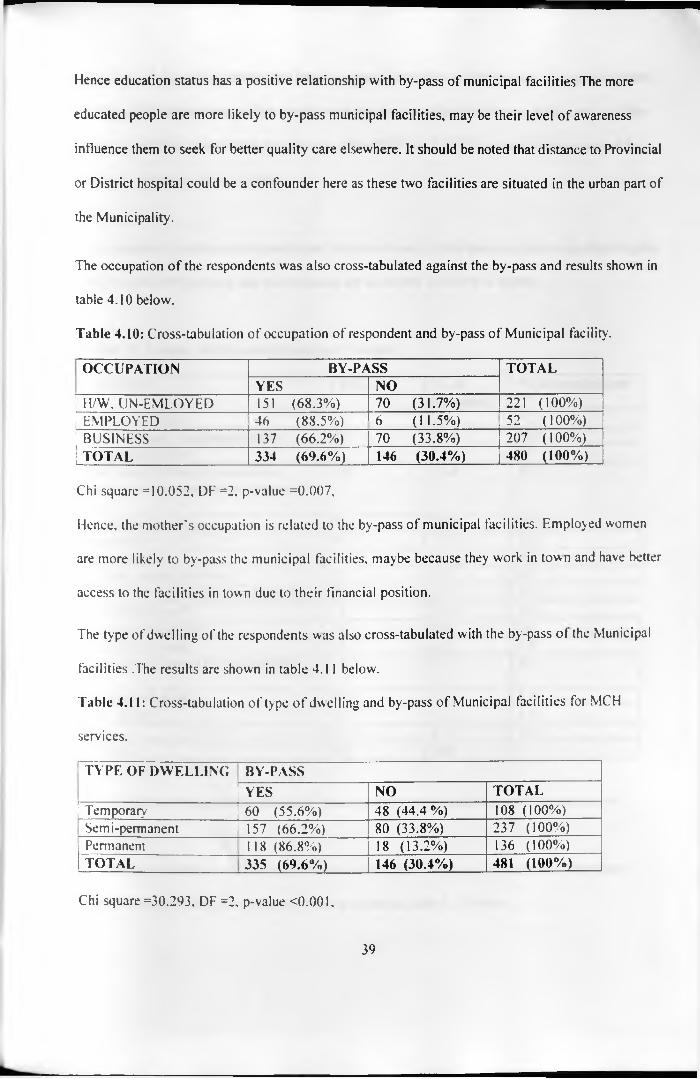
Hence education status has a positive relationship with by-pass of municipal facilities The more
educated people are more likely to by-pass municipal facilities, may be their level of awareness
influence them to seek for better quality care elsewhere. It should be noted that distance to Provincial
or District hospital could be a confounder here as these two facilities are situated in the urban part of
the Municipality.
The occupation of the respondents was also cross-tabulated against the by-pass and results shown in
table 4.10 below.
Table 4.10: Cross-tabulation of occupation of respondent and by-pass of Municipal facility.
OCCUPATION BY-PASS TOTALYES NO
[ H/W, UN-EMLOYED 151 (68.3%) 70 (31.7%) 221 ( 100%)[ e m p l o y e d 46 (88.5%) 6 (11.5%) 52 (100%)[ b u s in e ss 137 (66.2%) 70 (33.8%) 207 (100%)1 t o t a l 334 (69.6%) 146 (30.4%) 480 (100%)
Chi square =10.052, DF =2, p-value =0.007,
Hence, the mother's occupation is related to the by-pass of municipal facilities. Employed women
are more likely to by-pass the municipal facilities, maybe because they work in town and have better
access to the facilities in town due to their financial position.
The type of dwelling of the respondents was also cross-tabulated with the by-pass of the Municipal
facilities .The results are shown in table 4 .11 below.
Table 4.11: Cross-tabulation of type o f dwelling and by-pass of Municipal facilities for MCH
services.
TYPE OF DWELLING BY-PASSYES NO TOTAL
I Temporary 60 (55.6%) 48 (44.4%) 108 ( 100%)Semi-permanent 157 (66.2%) 80 (33.8%) 237 (100%)Permanent 118 (8 6 .8%) 18 (13.2%) 136 (100%)TOTAL 335 (69.6%) 146 (30.4%) 481 (100%)
Chi square =30.293, DF =2, p-value <0.001,
39
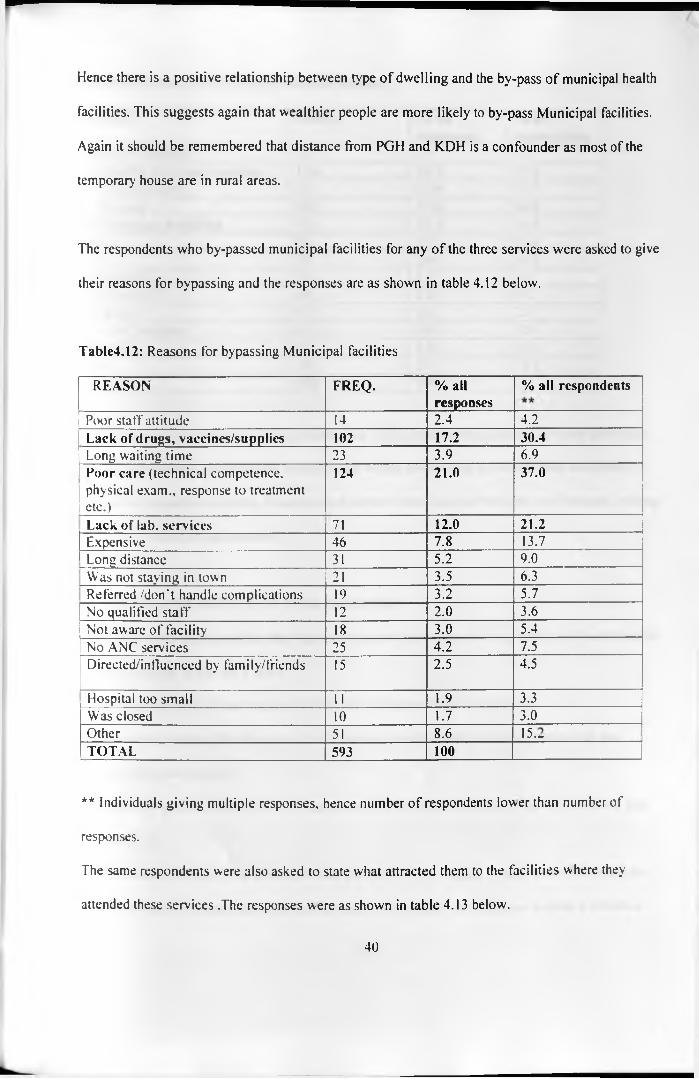
Hence there is a positive relationship between type of dwelling and the by-pass of municipal health
facilities. This suggests again that wealthier people are more likely to by-pass Municipal facilities.
Again it should be remembered that distance from PGH and KDH is a confounder as most of the
temporary house are in rural areas.
The respondents who by-passed municipal facilities for any of the three services were asked to give
their reasons for bypassing and the responses are as shown in table 4.12 below.
Table4.12: Reasons for bypassing Municipal facilities
REASON FREQ. % allresponses
% all respondents
Poor staff attitude 14 2.4 4.2Lack of drugs, vaccines/supplics 102 17.2 30.4Long waiting time 23 3.9 6.9Poor care (technical competence, physical exam., response to treatmentetc.)
124 21.0 37.0
Lack of lab. services 71 12.0 21.2Expensive 46 7.8 13.7Long distance 31 5.2 9.0Was not staying in town 21 3.5 6.3Referred /don't handle complications 19 3.2 5.7No qualified staff 12 2 .0 3.6Not aware of facility 18 3.0 5.4No ANC services 25 4.2 7.5Directed/influeneed by family/friends 15 2.5 4.5
Hospital too small 11 1.9 3.3Was closed 10 1.7 3.0Other 51 8.6 _LL“_____________ ,TOTAL 593 100
** Individuals giving multiple responses, hence number of respondents lower than number of
responses.
The same respondents were also asked to state what attracted them to the facilities where they
attended these services .The responses were as shown in table 4.13 below.
40

Table 4.13: Reasons for preferring attended facilities
REASON FREQ. % allresponses
% allrespondents
Better staff attitude 15 2.4 4.5Availability of drugs/vaccines 126 19.9 37.6Short waiting time 66 10.4 19.7Better care 184 29.0 54.9Lab. Services available 72 11.4 21.5Cheap 53 8.4 15.8Near 34 5.4 10.2Big hospital 13 2.1 3.9Qualified staff 14 2 .2 4.2Influenced 9 1.4 2.7
i Has ANC services 6 0.9 1.8Referred 6 0.9 1.8
Other 36 5.7 10.7|TOTAL 634 100
The main reasons for by-pass were poor care, lack of drugs/supplies and lack ot or poor laboratory
services in that order. These are the same factors, which pulled them to the facilities where they
attended the respective services. It seems most mothers were satisfied with the stall attitude, waiting
time cost of treatment and distance.
4.1.4. EVER-ATTENDANCE OF MCK FACLITIES
The mothers were asked whether they had ever attended their nearest or any Municipal health facility
for MCH services in the last 3 years.
336 respondents (69.7%) had attended while 146 respondents (30.3%) had not.
Those who had attended the Municipal facilities were asked to state how many times they had
attended in the last 2 years.
Out of the 229 people (68%) who could remember, the average number ot times of attendance was
3.86 (SD 2.32).
The 146 mothers who had not attended Municipal facilities for the last 3 years were then asked the
reasons for their not using Municipal facilities and the responses are as shown in table 4.14 below.
41

Table 4.14: Reasons for not using Municipal facilities.
REASON FREQ. % of all responses
% of all respondents
Poor staff attitude 8 2.5 5.5Lack of drugs/vaccines/supplies 79 24.5 54.1Long waiting time 27 8.4 18.5No lab. services 52 16.2 35.6Expensive 13 4.0 8.9Long distance 7 2 .2 4.8Poor care 83 25.8 56.8Influence of friends/neighbours 4 1.3 2.7Not aware of facility 8 2.5 5.5
| Other 40 13.0 27.4|TOTAL 321 100
The most important reasons were again poor care and lack o f drugs/vaccines. A reasonable
percentage also gave lack of laboratory services as their reason for not attending municipal facilities.
The same group was asked the source of information for the reasons they gave given that they had
not been to these facilities for the last 3 years. Out of 132 people who responded, 50% got the
information from friends while 22% got from relatives. The rest are shown in table 4.15 below.
Table 4.15: Source of information about Municipal facilities.
SOURCE FREQ %FRIENDS 66 50RELATIVES 29 22
JUST BELIEVE 18 13.6PAST EXPERIENCE 10 7.6OTHER 9 6 .8
I TOTAL 132 100
Thus, friends play a major role in influencing health-seeking behaviour of the community, followed
by relatives. Interesting though was the finding that 13.6% of the mothers had never attended the
Municipal facilities from mere belief that the services were wanting.
42
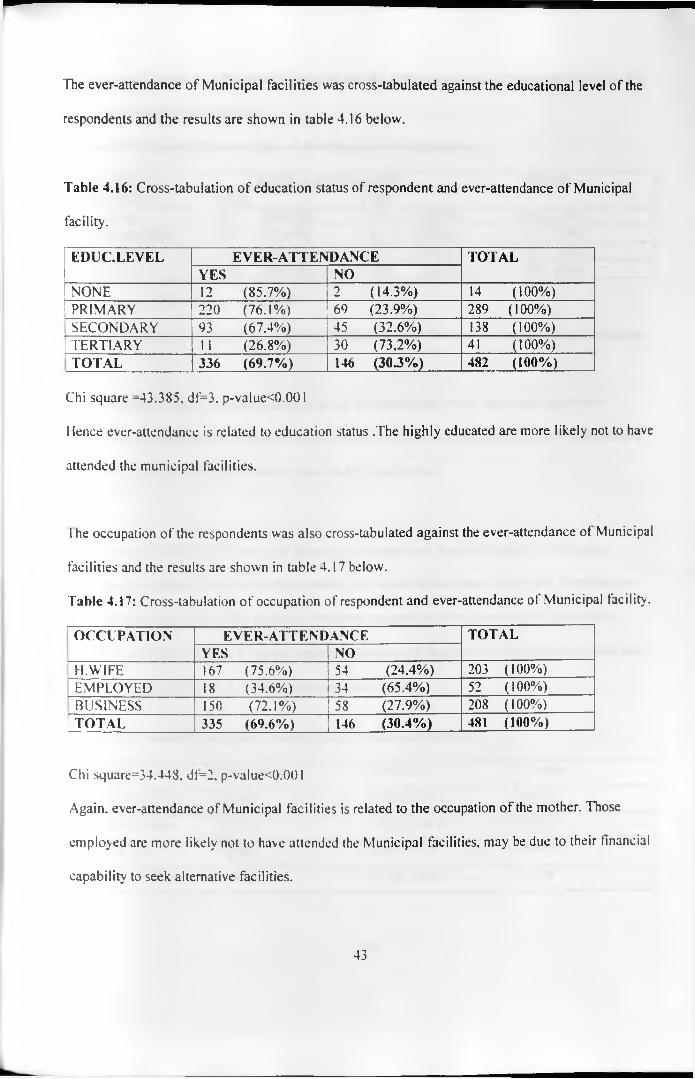
The ever-attendance of Municipal facilities was cross-tabulated against the educational level of the
respondents and the results are shown in table 4.16 below.
Table 4.16: Cross-tabulation of education status of respondent and ever-attendance of Municipal
facility.
EDUC.LEVEL EVER-ATTEN DANCE TOTALYES NO
NONE 12 (85.7%) 2 (14.3%) 14 ( 100%)PRIMARY 220 (76.1%) 69 (23.9%) 289 ( 100%)
j SECONDARY 93 (67.4%) 45 (32.6%) 138 ( 100%)TERTIARY 11 (26.8%) 30 (73,2%) 41 ( 100%)TOTAL 336 (69.7%) 146 (30.3%) 482 (100%)
Chi square =43.385, df=3, p-value<0.001
Hence ever-attendance is related to education status .The highly educated are more likely not to have
attended the municipal facilities.
l he occupation of the respondents was also cross-tabulated against the ever-attendance ot Municipal
facilities and the results are shown in table 4.17 below.
Table 4.17: Cross-tabulation of occupation of respondent and ever-attendance ot Municipal facility .
OCCUPATION EVER-ATTENDANCE TOTALYES NO
H.W1FE 167 (75.6%) 54 (24.4%) 203 (100%)EMPLOYED 18 (34.6%) 34 (65.4%) 52 (100%)BUSINESS 150 (72.1%) 58 (27.9%) 208 ( 100%)
1TOTAL 335 (69.6%) 146 (30.4%) 481 (100%)
Chi square=34.448. df=2. p-value<0.001
Again, ever-attendance of Municipal facilities is related to the occupation of the mother. Those
employed are more likely not to have attended the Municipal facilities, may be due to their financial
capability to seek alternative facilities.
43
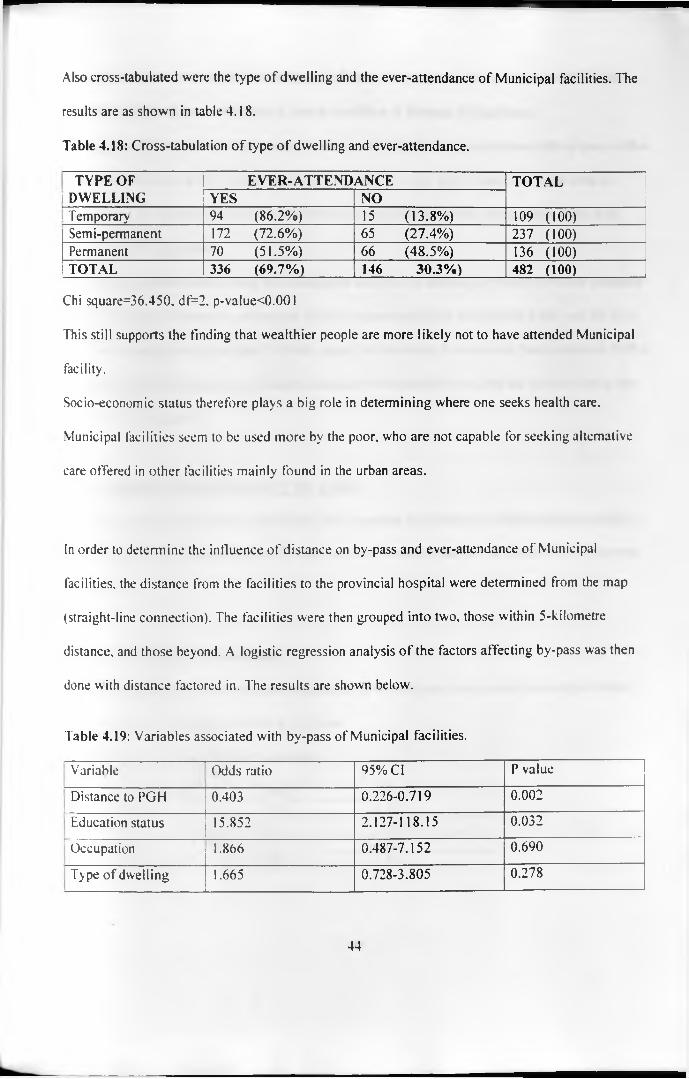
Also cross-tabulated were the type of dwelling and the ever-attendance of Municipal facilities. The
results are as shown in table 4.18.
Table 4.18: Cross-tabulation of type of dwelling and ever-attendance.
TYPE OF EVER-ATTENDANCE TOTALi DWELLING YES NOi Temporary 94 (8 6 .2 %) 15 (13.8%) 109 (100)
Semi-permanent 172 (72.6%) 65 (27.4%) 237 (100)Permanent 70 (51.5%) 66 (48.5%) 136 (100)TOTAL 336 (69.7%) 146 30.3%) 482 (100)
Chi square=36.450. df=2, p-value<0.001
This still supports the finding that wealthier people are more likely not to have attended Municipal
facility.
Socio-economic status therefore plays a big role in determining where one seeks health care.
Municipal facilities seem to be used more by the poor, who are not capable for seeking alternative
care offered in other facilities mainly found in the urban areas.
In order to determine the influence of distance on by-pass and ever-attendance of Municipal
facilities, the distance from the facilities to the provincial hospital were determined from the map
(straight-line connection). The facilities were then grouped into two, those within 5-kilometre
distance, and those beyond. A logistic regression analysis of the factors affecting by-pass was then
done with distance factored in. The results are shown below.
Table 4.19: Variables associated with by-pass of Municipal facilities.
Variable Odds ratio 95% Cl P value
Distance to PGH 0.403 0.226-0.719 0.002
Education status 15.852 2.127-118.15 0.032
Occupation 1.866 0.487-7.152 0.690
Type of dwelling 1.665 0.728-3.805 0.278
44

It can be seen that distance has the strongest influence on by-pass, with a p-value o f 0.002. The
confidence interval does not include 1, hence the effect of distance is significant.
It is apparent from the table that education status is still significantly associated with by-pass, with a
p-value of 0.032 and a 95% Cl that does not including 1. It can also be seen that those with no
education at all are about sixteen times less likely to by-pass Municipal facility than those with
tertiary level of education.
Hie relationship between by-pass and occupation and type o f dwelling of the respondents disappear
after factoring in distance as can be seen in the p-values which are greater than 0.005 and the 95%
confidence interval which include 1 in both cases. But of course it was shown that distance to PGH is
related to these two parameters as better houses and more employed people are found in the urban
part of the Municipality.
4.1.5. PERCEPTION OF QUALITY OF CARE
I he respondents who said they had utilised MCH services in Municipal facilities were asked their
perception of the various attributes of quality of care. The responses are described in the following
sub-sections.
4.1.5.1.Provider-client relationship:
The mothers were asked how the staff handled them the last time they attended municipal facility.
The responses are as shown in table 4.22 below.
Table 4.20a. Handling of client by provider.
RESPONSE NO. %Well 219 65.2Fair 96 28.6Poor 21 6.3TOTAL 336 100
45

Generally, it can be noted that the respondents were satisfied with the way they are handled by the
health workers, with only 6.3% giving a rating of poor.
The responses to the other parameters o f the provider-client relationship are given in the table below.
Table 4.20b: Perception of provider-client relationship and provider competence.
Parameter No. of responsesYes No Don’t know TOTAL
Provider explained problem 170(50.7%)
164(49.0%)
3(0.3%)
337( 100%)
Client free to ask questions 195(58.7%)
137(41.3%)
- 332( 100%)
Good physical examination 155(46.4%)
136(40.7%)
43(12.9%)
334( 100%)
Provider looked competent 178(53.1%)
33(9.9%)
124(37%)
335( 100%)
Though the ratings look marginally satisfactory, there is concern that 49% of the clients were not
explained their or their child's problem by the provider, while 41.3% of the clients did not feel free
to ask the providers questions concerning their/their child's problem. Another 40.7% also felt that the
providers did not do a good physical examination.
On the prov ider's competence, although it is encouraging that the majority of the respondents
(53.1%) were satisfied, a whole 37% were non-committal, which could still suggest lack of
satisfaction.
4.1.5.2. Drug availability:
The mothers were asked if they got all the drugs prescribed for them the last time they attended
municipal facility. Only 113 (36%) said they got all the drugs, while 201(64%) did not get all.
The mothers were then asked their opinion on the general drug availability in the facility they
attended last. The responses are shown in table 4.21 below.
46

Table 4.21: Mothers rating o f drug availability.
Drug availability No. %Good 72 21 .6Fair 169 50.6Poor 75 22.5Don't know 18 5.5
|TO TA L 334 100
Again, only 21.6% of the mothers gave a rating of good. These findings will be more corroborated
later under facility audit.
4.1.5.3 Administrative issues.
The mothers were asked about the time duration they took to be attended in the facility. The
responses are as shown in table 4.22 below.
Table 4.22: Respondents perception of waiting time
Waiting time No. %Short; reasonable 228 85.7Too long 48 12.5Don't know 6 1.8
TOTAL 336 100
Hence, the waiting time was reasonable according to the majority of the respondents. This is
consistent with the earlier findings of the pull and push factors. This could be due to the low number
of people attending the facilities, hence low workload.
The mothers were then asked whether the facilities open for a reasonable time during the day and
gave the responses shown in table 4.23.
47
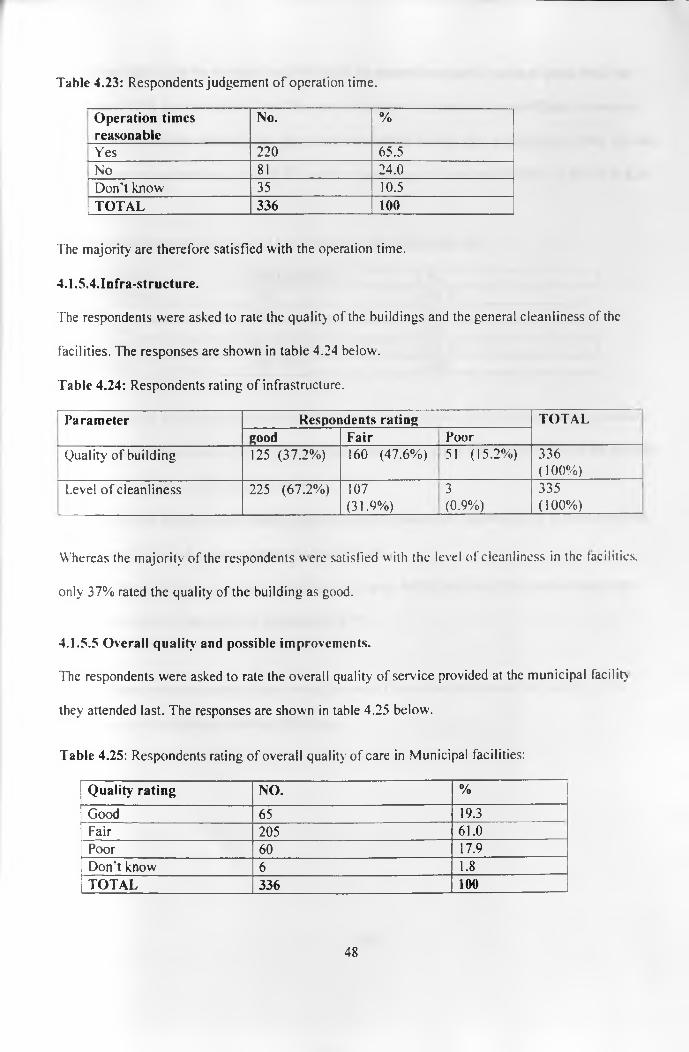
Table 4.23: Respondents judgement o f operation time.
Operation times reasonable
No. %
Yes 220 65.5No 81 24.0Don’t know 35 10.5
1 TOTAL 336 100
The majority are therefore satisfied with the operation time.
4.1.5.4.Infra-structure.
The respondents were asked to rate the quality of the buildings and the general cleanliness of the
facilities. The responses are shown in table 4.24 below.
Table 4.24: Respondents rating of infrastructure.
Parameter Respondents rating TOTALgood Fair Poor
Quality of building 125 (37.2%) 160 (47.6%) 51 (15.2%) 336( 100%)
Level of cleanliness 225 (67.2%) 107(31.9%)
3
(0.9%)335( 100%)
Whereas the majority of the respondents w ere satisfied w ith the level of cleanliness in the facilities,
only 37% rated the quality of the building as good.
4.1.5.5 Overall quality and possible improvements.
The respondents were asked to rate the overall quality of service provided at the municipal facility
they attended last. The responses are shown in table 4.25 below'.
Table 4.25: Respondents rating of overall quality of care in Municipal facilities:
Quality rating NO. %
Good 65 19.3Fair 205 61.0Poor 60 17.9Don’t know 6 1.8TOTAL 336 100
48
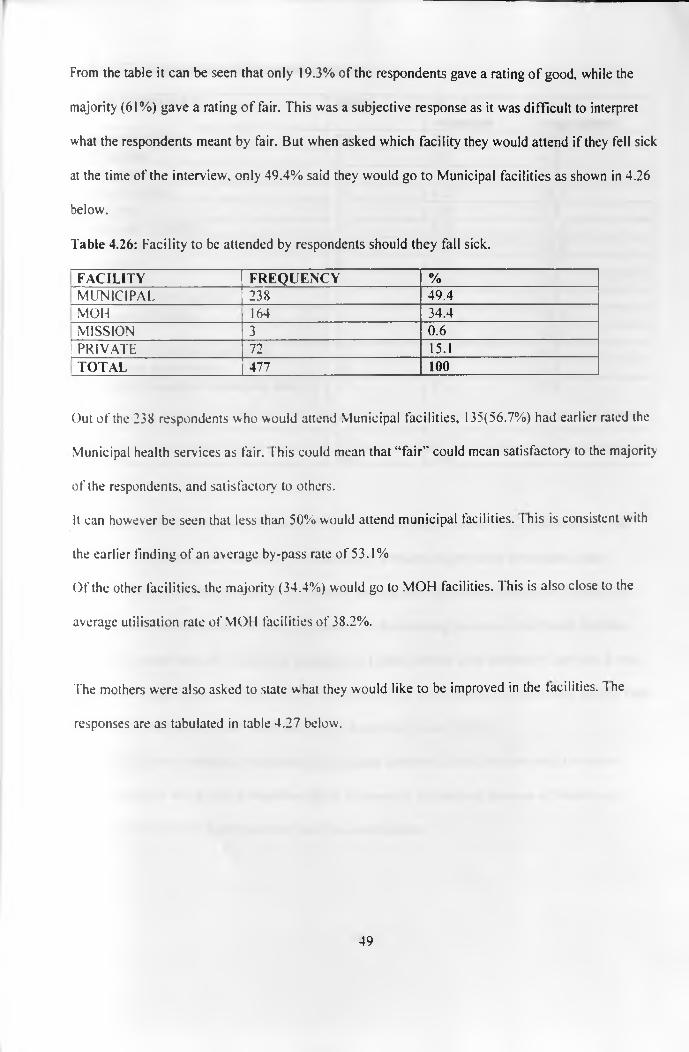
From the table it can be seen that only 19.3% of the respondents gave a rating of good, while the
majority (61%) gave a rating of fair. This was a subjective response as it was difficult to interpret
what the respondents meant by fair. But when asked which facility they would attend if they fell sick
at the time of the interview, only 49.4% said they would go to Municipal facilities as shown in 4.26
below.
Table 4.26: Facility to be attended by respondents should they fall sick.
FACILITY FREQUENCY %[ m u n ic ip a l 238 49.4MOH 164 34.4MISSION 3 0 .6
[ p r iv a t e 72 15.1TOTAL 477 100
Out of the 238 respondents who would attend Municipal facilities, 135(56.7%) had earlier rated the
Municipal health services as fair. This could mean that “fair’' could mean satisfactory to the majority
of the respondents, and satisfactory to others.
It can however be seen that less than 50% would attend municipal facilities. I his is consistent with
the earlier finding of an average by-pass rate of 53.1%
Of the other facilities, the majority (34.4%) would go to MOH facilities. This is also close to the
average utilisation rate of MOl 1 facilities of 38.2%.
The mothers were also asked to state what they would like to be improved in the facilities. The
responses are as tabulated in table 4.27 below.
49
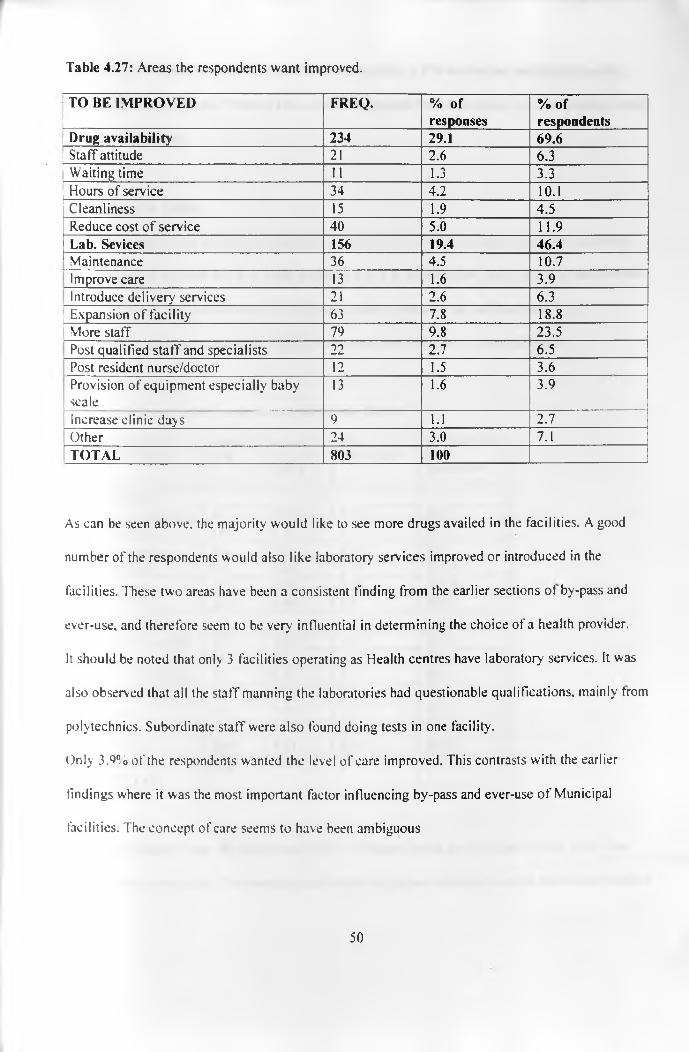
Table 4.27: Areas the respondents want improved.
TO BE IMPROVED FREQ. % of responses
% ofrespondents
Drug availability 234 29.1 69.6Staff attitude 21 2.6 6.3Waiting time 11 1.3 3.3Hours of service 34 4.2 10.1Cleanliness 15 1.9 4.5Reduce cost of service 40 5.0 11.9Lab. Sevices 156 19.4 46.4Maintenance 36 4.5 10.7Improve care 13 1.6 3.9Introduce delivery services 21 2.6 6.3
| Expansion of facility 63 7.8 18.81 More staff 79 9.8 23.5
Post qualified staff and specialists 22 2.7 6.5Post resident nurse/doctor 12 1.5 3.6Provision of equipment especially babyscale
13 1.6 3.9
Increase clinic days 9 1.1 2.7Other 24 3.0 7.1TOTAL 803 100
As can be seen above, the majority would like to see more drugs availed in the facilities. A good
number of the respondents would also like laboratory services improved or introduced in the
facilities. These two areas have been a consistent finding from the earlier sections of by-pass and
ever-use, and therefore seem to be very influential in determining the choice of a health provider.
It should be noted that only 3 facilities operating as Health centres have laboratory services. It was
also observed that all the staff manning the laboratories had questionable qualifications, mainly from
polytechnics. Subordinate staff were also found doing tests in one facility.
Only 3.^% of the respondents wanted the level of care improved. This contrasts with the earlier
findings where it was the most important factor influencing by-pass and ever-use of Municipal
facilities. The concept of care seems to have been ambiguous
50
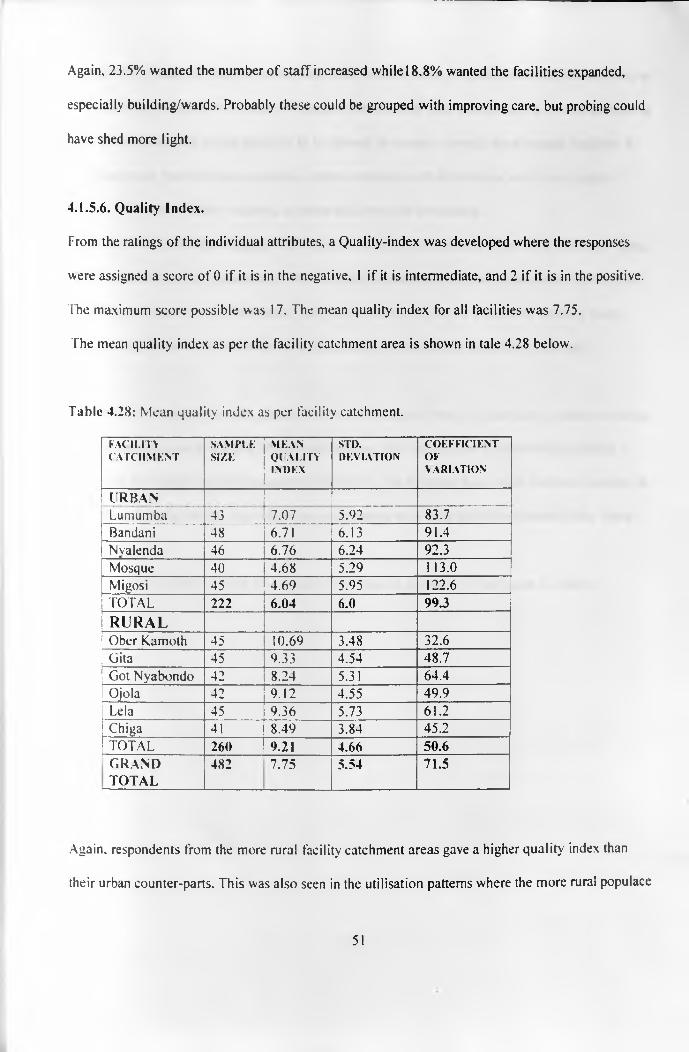
Again, 23.5% wanted the number of staff increased while 18.8% wanted the facilities expanded,
especially building/wards. Probably these could be grouped with improving care, but probing could
have shed more light.
4.1.5.6. Quality Index.
From the ratings of the individual attributes, a Quality-index was developed where the responses
were assigned a score of 0 if it is in the negative, 1 if it is intermediate, and 2 if it is in the positive.
The maximum score possible was 17. The mean quality index for all facilities was 7.75.
The mean quality index as per the facility catchment area is shown in tale 4.28 below.
Table 4.28: Mean quality index as per facility catchment.
FACILITYC A T C H M E N T
S A M P L ESIZE
M E A NQ l 'A L I T YIN D E X
STD.D E V IA T IO N
C O E F F I C IE N TO FV A R IA T IO N
URBANLumumba 43 7.07 5.92 83.7Bandani 48 6.71 X f 3 91.4Nvalenda 46 6.76 6.24 92.3Mosque 40 4.68 5.29 113.0Migosi 45 4.69 5.95 122.6TOTAL 222 6.04 6.0 99.3R U R A LOber Kamoth 45 10.69 3.48 32.6Gita 45 9.33 4.54 48.7Got Nyabondo 42 8.24 5.31 64.4Ojola 42 9.12 4.55 49.9Lela 45 9.36 5.73 61.2Chiga 41 8.49 3.84 45.2TOTAL 260 9.21 4.66 50.6GRANDTOTAL
482 7.75 5.54 71.5
Again, respondents from the more rural facility catchment areas gave a higher quality index than
their urban counter-parts. This was also seen in the utilisation patterns where the more rural populace
51

had a lower by-pass rate than the urban ones. The rural folk have very few options to choose from, as
well as finding it expensive in terms o f transport costs to seek care in the MOH or Private facilities in
town. Their perception seems therefore to be skewed favourably towards their nearest facilities. It
could also mean that low socio-economic status correlates with satisfaction with lower quality
services. This needs further research, as these data were not conclusive.
Got Nyabondo had a rather high quality index, consistent with the trend in the rural catchment areas,
but inconsistent with a by-pass rate of 70.7%. It may mean that there was a parameters that had an
over-riding influence on the attendance, may be availability o f health workers or working hours.
Unfortunately, there were no clients for exit interviews, which could have shed more light.
Correlation of variation from the catchment areas showed that there is much more variation of rating
where the mean score is low like Migosi and Mosque. This shows a wide difference in opinion
concerning the quality parameters under investigation. On the other hand, there was less variation in
perception of quality in the areas where the mean scores were high like Ober Kamoth, Gita, Ojola
etc.
The mean quality index showed a near normal distribution as shown in the figure 4.1 below.
52
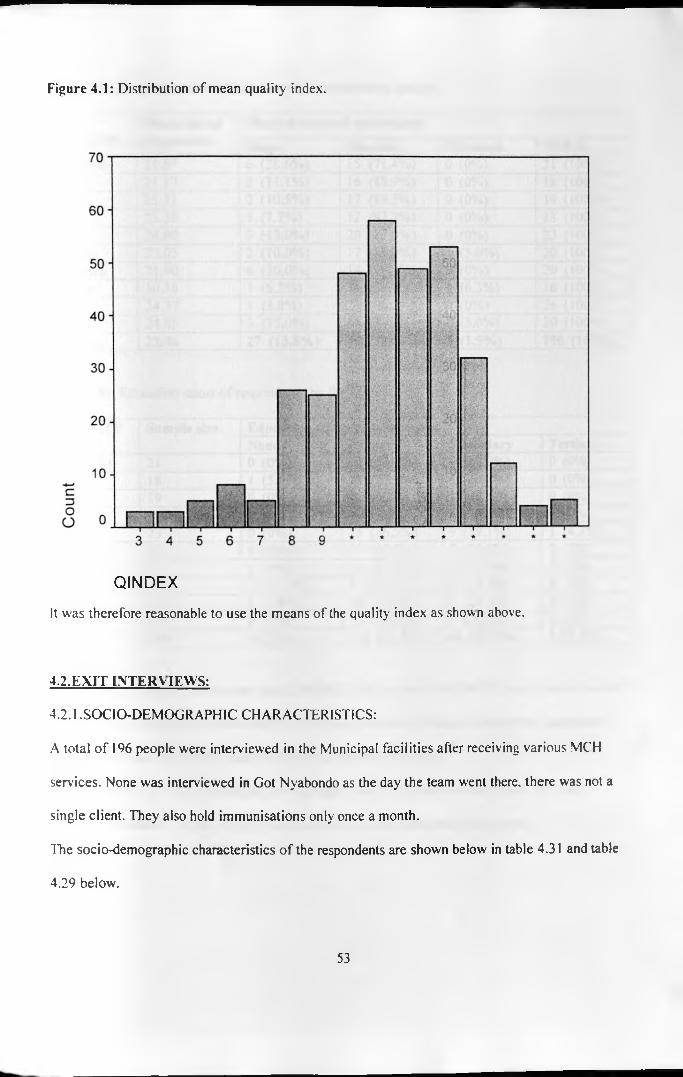
Figure 4.1: Distribution of mean quality index.
Q I N D E X
It was therefore reasonable to use the means of the quality index as shown above.
4.2.EXIT INTERVIEWS:
4.2.1 .SOCIO-DEMOGRAPHIC CHARACTERISTICS:
A total of 196 people were interviewed in the Municipal facilities after receiving various MC'H
services. None was interviewed in Got Nyabondo as the day the team went there, there was not a
single client. They also hold immunisations only once a month.
The socio-demographic characteristics of the respondents are shown below in table 4.31 and table
4.29 below.
53
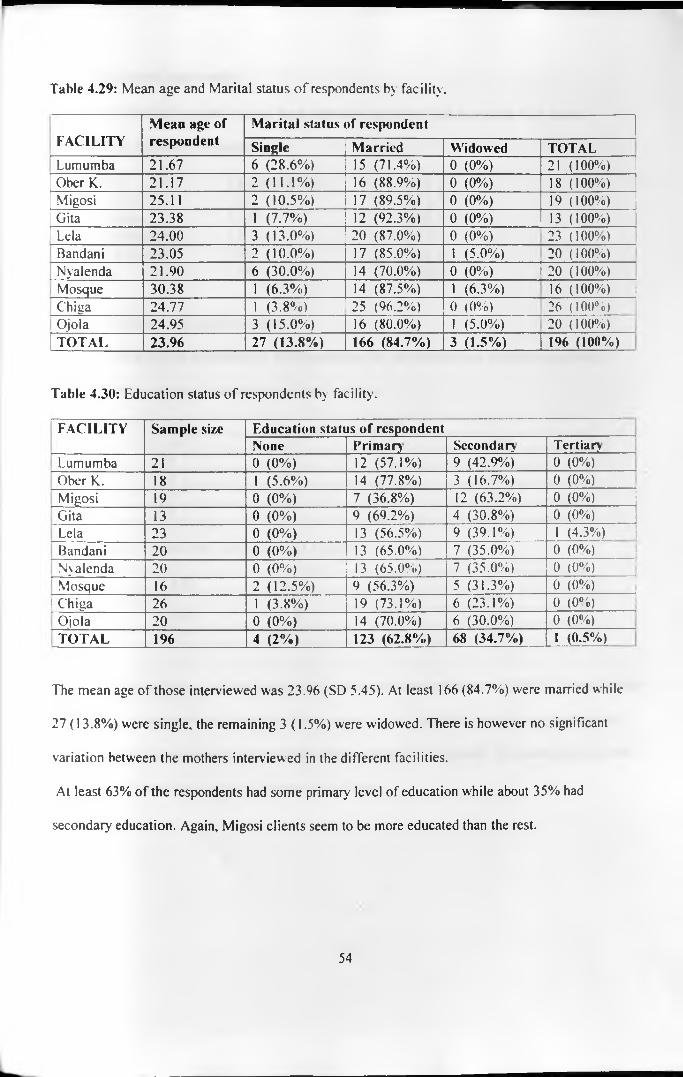
Table 4.29: Mean age and Marital status o f respondents by facility.
FACILITYMean age of respondent
Marital status of respondent
Single Married Widowed TOTALLumumba 21.67 6 (28.6%) 15 (71.4%) 0 (0%) 21 ( 100%)Ober K. 21.17 2 ( 11 . 1%) 16 (88.9%) 0 (0%) 18 (100%)Migosi 25.11 2 (10.5%) 17 (89.5%) 0 (0%) 19 ( 100%)Gita 23.38 1 (7.7%) 12 (92.3%) 0 (0%) 13 ( 100%)Lela 24.00 3 (13.0%) 20 (87.0%) 0 (0%) 23 (100%)Bandani 23.05 2 ( 10 .0 %) 17 (85.0%) 1 (5.0%) 20 ( 100%)Nyalenda 21.90 6 (30.0%) 14 (70.0%) 0 (0%) 20 ( 100%)Mosque 30.38 1 (6.3%) 14 (87.5%) 1 (6.3%) 16 ( 100%)Chiga 24.77 1 (3.8%) 25 (96.2%) 0 (0%) 26 ( 100%)Ojola 24.95 3 (15.0%) 16 (80.0%) 1 (5.0%) 20 ( 100%)TOTAL 23.96 27 (13.8%) 166 (84.7%) 3 (1.5%) 196 (100%)
Table 4.30: Education status of respondents by facility.
FACILITY Sample size Education status of respondentNone Primary Secondary Tertiary
f Lumumba 21 0 (0%) 12 (57.1%) 9 (42.9%) 0 (0%)Ober K. 18 1 (5.6%) 14 (77.8%) 3 (16.7%) 0 (0%)Migosi 19 0 (0%) 7 (36.8%) 12 (63.2%) 0 (0%)Gita 13 0 (0 %) 9 (69.2%) 4 (30.8%) 0 (0%)Lela 23 0 (0%) 13 (56.5%) 9 (39.1%) 1 (4.3%)Bandani 20 0 (0%) 13 (65.0%) 7 (35.0%) 0 (0%)Nyalenda 2 0 0 (0%) 13 (65.0%) 7 (35.0%.) 0 (0%)Mosque 16 2 (12.5%) 9 (56.3%) 5 (31.3%) 0 (0%)
! Chiga 26 1 (3.8%) 19 (73.1%) 6 (23.1%) 0 (0%)Ojola 20 0 (0%) 14 (70.0%) 6 (30.0%) 0 (0%)TOTAL 196 4 (2%) 123 (62.8%) 68 (34.7%) 1 (0.5%)
The mean age of those interviewed was 23.% (SD 5.45). At least 166 (84.7%) were married while
27 (13.8%) were single, the remaining 3 (1.5%) were widowed. There is however no significant
variation between the mothers interviewed in the different facilities.
At least 63% of the respondents had some primary' level of education while about 35% had
secondary education. Again, Migosi clients seem to be more educated than the rest.
54
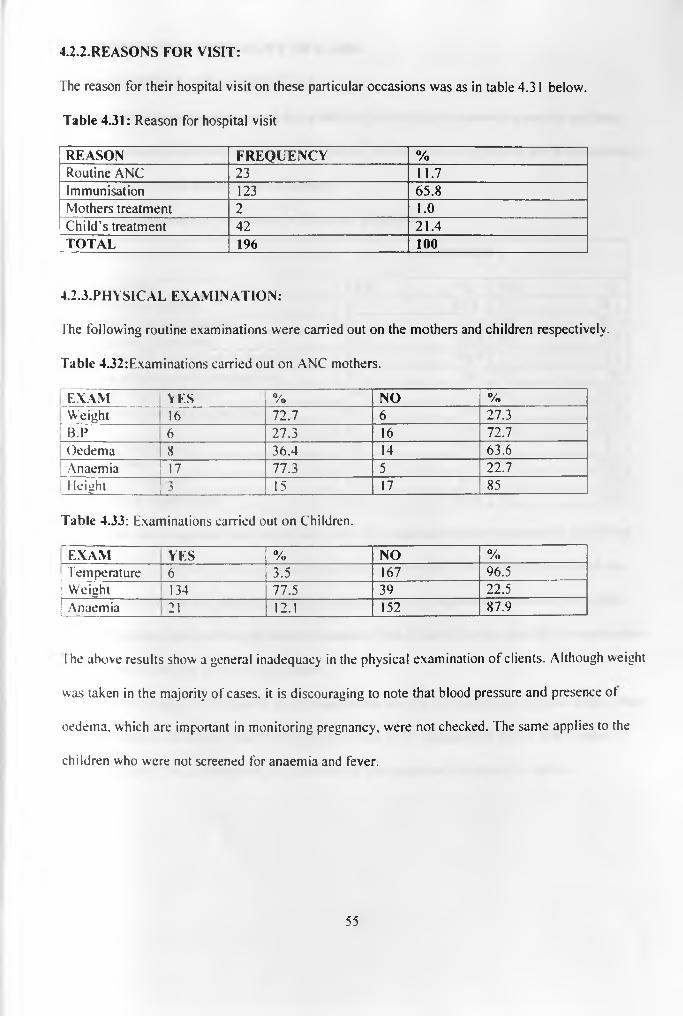
4.2.2.R E A SO N S F O R V IS IT :
The reason for their hospital visit on these particular occasions was as in table 4.31 below.
Table 4.31: Reason for hospital visit
REASON FREQUENCY %Routine ANC 23 11.7Immunisation 123 65.8Mothers treatment 2 1.0Child’s treatment 42 21.4TOTAL 196 100
4.2.3.PHYSICAL EXAMINATION:
The following routine examinations were carried out on the mothers and children respectively.
Table 4.32:Examinations carried out on ANC mothers.
[ EXAM YES 0//o NO %[ Weight 16 72.7 6 27.3\ t p 6 27.3 16 72.7Oedema 8 36.4 14 63.6Anaemia 17 77.3 5 22.71 leiuht----- *_________ l_£_____________ 15 17 85
Table 4.33: Examinations carried out on Children.
EXAM YES % NO %Temperature 6 3.5 167 96.5Weight 134 77.5 39 22.5Anaemia 21 12.1 152 87.9
The above results show a general inadequacy in the physical examination of clients. Although weight
was taken in the majority of cases, it is discouraging to note that blood pressure and presence ot
oedema, which are important in monitoring pregnancy, were not checked. The same applies to the
children who were not screened for anaemia and fever.
55

4.2.4.PERCEPTION OF QUALITY OF CARE:
4.2.4.1: RESPONDENTS SATISFACTION.
Results of the respondents reports on the quality of care indicators concerning mainly on client-
provider interaction are shown in table 4.34 below. The responses are grouped into those showing
satisfaction or not of the particular indicators
Table 4.34: Respondents satisfaction with quality parameters.
SATISFIED
| INDICATOR YES % NO %Physical examination 121 65.8 63 34.2Explanation of examination 24 12.4 169 87.6Competence of provider 156 80.4 38 19.6Understanding of problem by provider 53 96.4 2 3.6
1 Discuss problem with client/patient 33 60 22 40Freedom to ask questions 146 75.3 48 24.7
; Satisfactory answers to questions 84 89.4 10 10.6
| Privacy 85 44.3 107 55.7Friendly interaction 188 96.9 6 3.1
1 Waiting time 141 73.4 51 26.6Given appointment 167 89.8 19 10.2
Satisfaction with services 165 85.5 28 14.5
The results show a general satisfaction with most of the indicators except explanation of physical
examination and privacy. Lack of privacy can affect the provider's ability to talk freely with the
client and vice versa, and hence should be improved. It is also important to note that 34% of the
clients were not satisfied with physical examination. This is rather high as most of the examinations
done in MCH services are of routine nature.
The mean waiting time as reported by the respondents was 38.96 (SD 45.19), minutes with a range
o f 2 -80 minutes, while the observed waiting time was 41.70 minutes (SD 34.81) with a range of
5-204 minutes. This is reasonable, as supported by the respondent's satisfaction above.
56
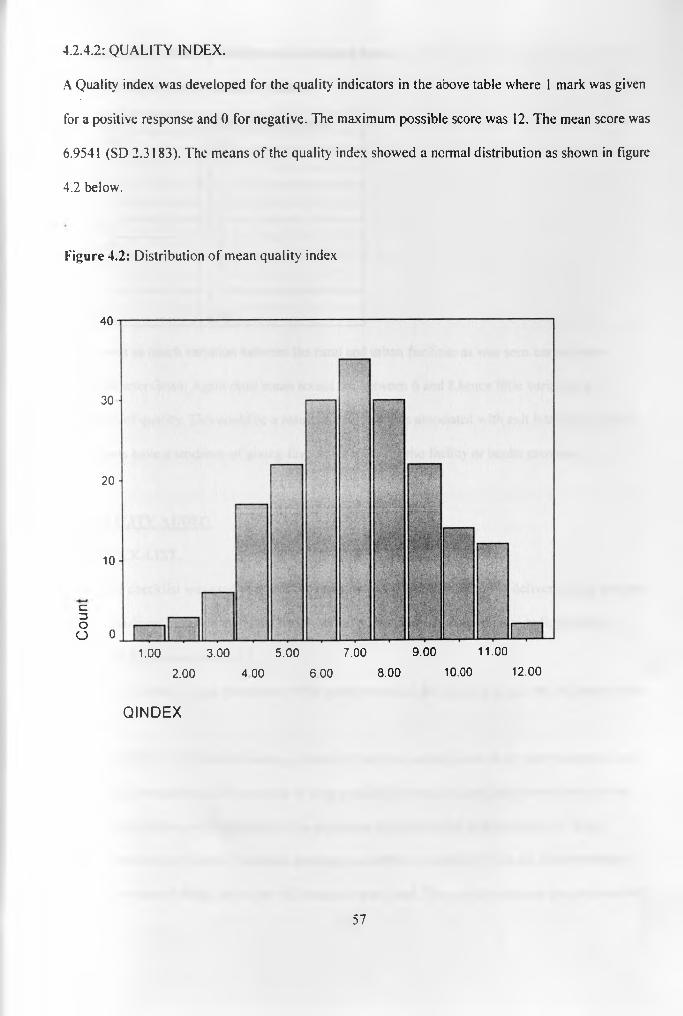
4.2 .4 .2 : Q U A L IT Y IN D E X .
A Quality index was developed for the quality indicators in the above table where 1 mark was given
for a positive response and 0 for negative. The maximum possible score was 12. The mean score was
6.9541 (SD 2.3183). The means of the quality index showed a normal distribution as shown in figure
4.2 below.
Figure 4.
40
30
20
10
01.00 3.00 5.00 7.00 9.00 11.00
2.00 4 00 6.00 8.00 10.00 12.00
Q I N D E X
c=3Oo
2: Distribution of mean quality index
57
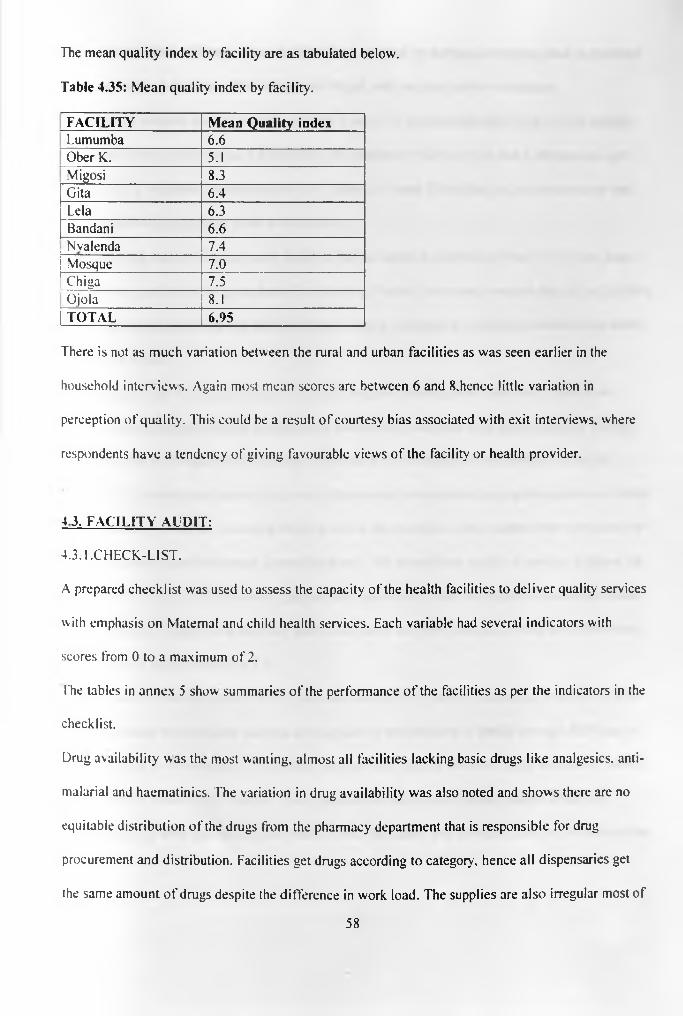
The mean quality index by facility are as tabulated below.
Table 4.35: Mean quality index by facility.
FACILITY Mean Quality indexLumumba 6.6Ober K. 5.1Migosi 8.3Gita 6.4Lela 6.3Bandani 6.6Nvalenda 7.4Mosque 7.0Chiga 7.5Ojola 8.1TOTAL 6.95
There is not as much variation between the rural and urban facilities as was seen earlier in the
household interviews. Again most mean scores are between 6 and 8 .hence little variation in
perception of quality. This could be a result of courtesy bias associated with exit interviews, where
respondents have a tendency of giving favourable views of the facility or health provider.
4 3. FACILITY AUDIT:
4.3.1.CHECK-LIST.
A prepared checklist was used to assess the capacity of the health facilities to deliver quality services
with emphasis on Maternal and child health services. Each variable had several indicators with
scores from 0 to a maximum of 2 .
The tables in annex 5 show summaries of the performance of the facilities as per the indicators in the
checklist.
Drug availability was the most wanting, almost all facilities lacking basic drugs like analgesics, anti-
malarial and haematinics. The variation in drug availability was also noted and shows there are no
equitable distribution of the drugs from the pharmacy department that is responsible for drug
procurement and distribution. Facilities get drugs according to category, hence all dispensaries get
the same amount of drugs despite the difference in work load. The supplies are also irregular most of
58

the time due to lack of funds. Some facilities have resorted to starting a revolving fund to purchase
some essentials, a practice which is however illegal, and can also lead to corruption.
Equipment is another area of concern. Though 5 out of 11 scored more than 50%, a close scrutiny
reveal that only 2 facilities had a functioning BP machine, while only one had a stethoscope, yet
these are very important instruments in ANC clinics. At least 2 facilities had no thermometer and
could therefore not diagnose fever with certainty.
Also worry ing was the finding that 9 facilities had no needle holder while 7 had no scissors, basic
equipment's used in minor procedures like stitching. Further interviews revealed that all the facilities
apart from Lumumba could not stitch or dress a wound, yet these are common conditions especially
in the rural areas.
Management issue was another area of concern. Regular meetings and supervisory visits from
higher-level authorities provide facilities with incentives to maintain high quality service. Though
most facilities hold regular staff meetings, sectional heads meetings at the MMOHs office are
irregular. The Municipal Matron is the only officer noted to be conducting regular supervisory visits
to the facilities, while the Municipal MOH is rare in the facilities. This, coupled with irregularity of
meetings demotivates the already demoralised staff, and also affects quality of service. It seems the
PMOs office and the DMOH are not play ing their supervisory role with regards to local authorities.
Most of the staff interviewed said they don’t even know how they look like, while some have seen
the PMO only in newspapers or TV.
All the facilities had adequate stocks of vaccines except BCG, which was lacking from the District
stores. It should be noted that vaccines are supplied by the Ministry of Health through KEPI and so
far their work is commendable. But at least two facilities did not have cold chain equipment, mainly
fridge. Migosi collect their vaccines from Lumumba on the days of immunisations while Got
Nyabondo keep their vaccines at Gita which is over 5km away and therefore carry' out immunisations
59
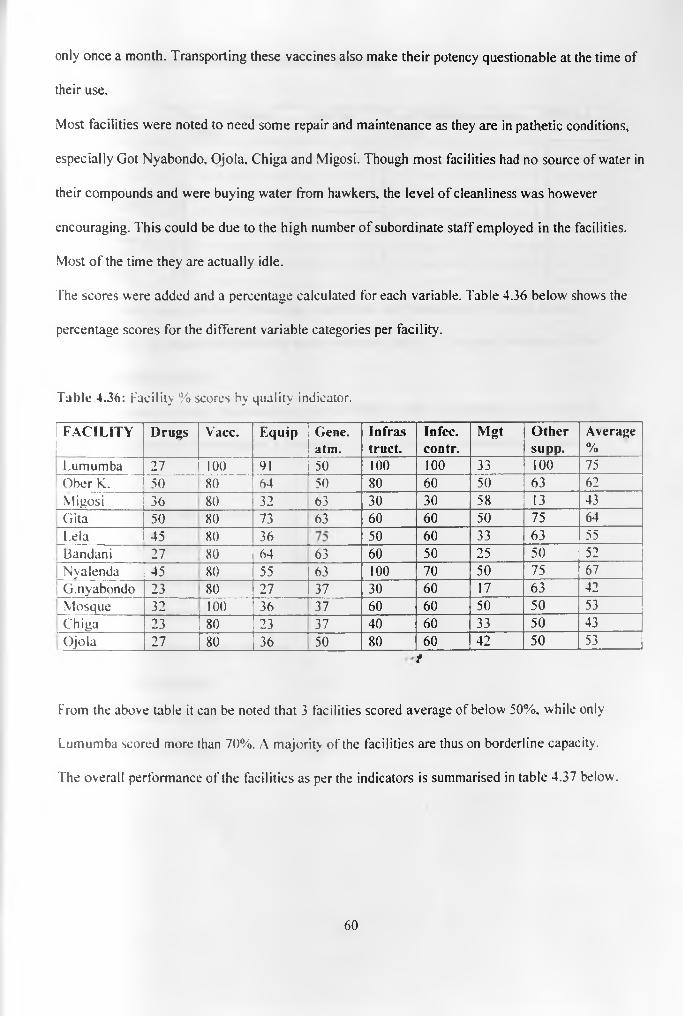
only once a month. Transporting these vaccines also make their potency questionable at the time of
their use.
Most facilities were noted to need some repair and maintenance as they are in pathetic conditions,
especially Got Nyabondo, Ojola, Chiga and Migosi. Though most facilities had no source of water in
their compounds and were buying water from hawkers, the level of cleanliness was however
encouraging. This could be due to the high number of subordinate staff employed in the facilities.
Most of the time they are actually idle.
The scores were added and a percentage calculated for each variable. Table 4.36 below shows the
percentage scores for the different variable categories per facility.
Table 4.36: Facility % scores by quality indicator.
FACILITY Drugs Vacc. Equip Gene.atm.
Infrastruct.
Infec.contr.
Mgt Othersupp.
Average%
Lumumba 27 100 91 50 100 100 33 100 75Ober K. 50 80 64 50 80 60 50 63 62Migosi 36 80 32 63 30 30 58 13 43Gita 50 80 73 63 60 60 50 75 64L.ela 45 80 36 50 60 33 63 55Bandani 27 80 64 63 60 50 25 50 52Nyalenda 45 80 55 63 100 70 50 75 67
1 G.nyabondo 23 80 27 37 30 60 17 63 42Mosque 32 100 36 37 60 60 50 50 53Chiga 23 80 23 37 40 60 33 50 43Ojola 27 80 36 50 80 60 42 50 53
f
From the above table it can be noted that 3 facilities scored average of below 50%, while only
Lumumba scored more than 70%. A majority of the facilities are thus on borderline capacity.
The overall performance of the facilities as per the indicators is summarised in table 4.37 below.
60
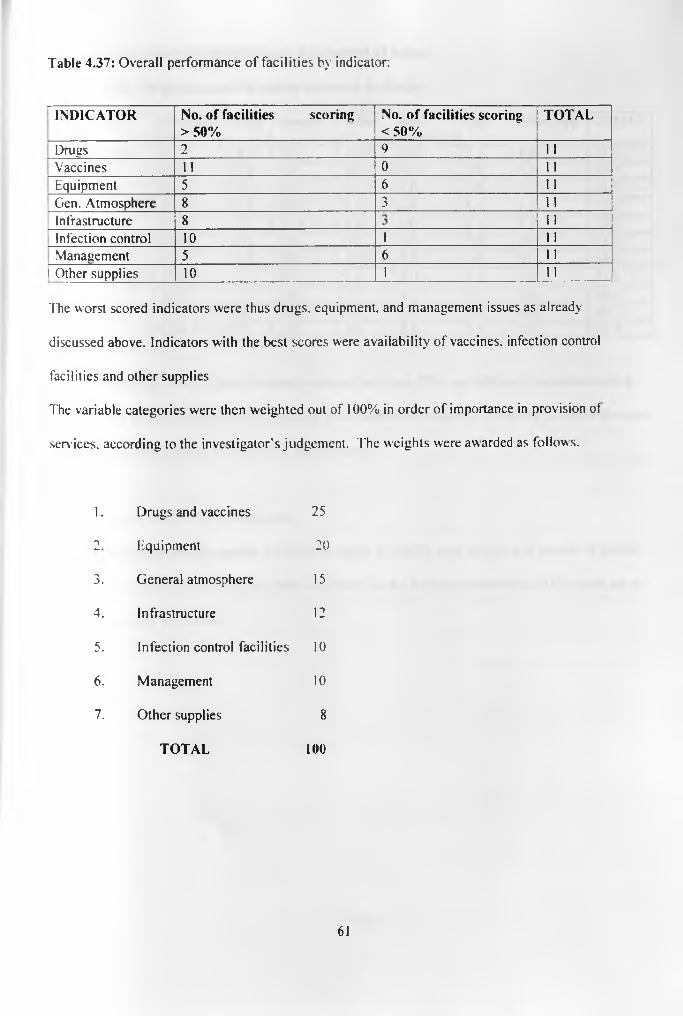
Table 4.37: Overall performance of facilities by indicator:
INDICATOR No. of facilities scoring > 50%
No. o f facilities scoring < 50%
TOTAL
Drugs 2 9 11Vaccines 11 0 11Equipment 5 6 11Gen. Atmosphere 8 3 11Infrastructure 8 i i
Infection control 10 1 11Management 5 6 11
1 Other supplies 10 1
The worst scored indicators were thus drugs, equipment, and management issues as already
discussed above. Indicators with the best scores were availability of vaccines, infection control
facilities and other supplies
The variable categories were then weighted out of 100% in order of importance in provision of
services, according to the investigator's judgement. The weights were awarded as follow s.
1. Drugs and vaccines 25
2 Equipment 20
3. General atmosphere 15
4. Infrastructure 12
5. Infection control facilities 10
6 . Management 10
7. Other supplies 8
TOTAL 100
61
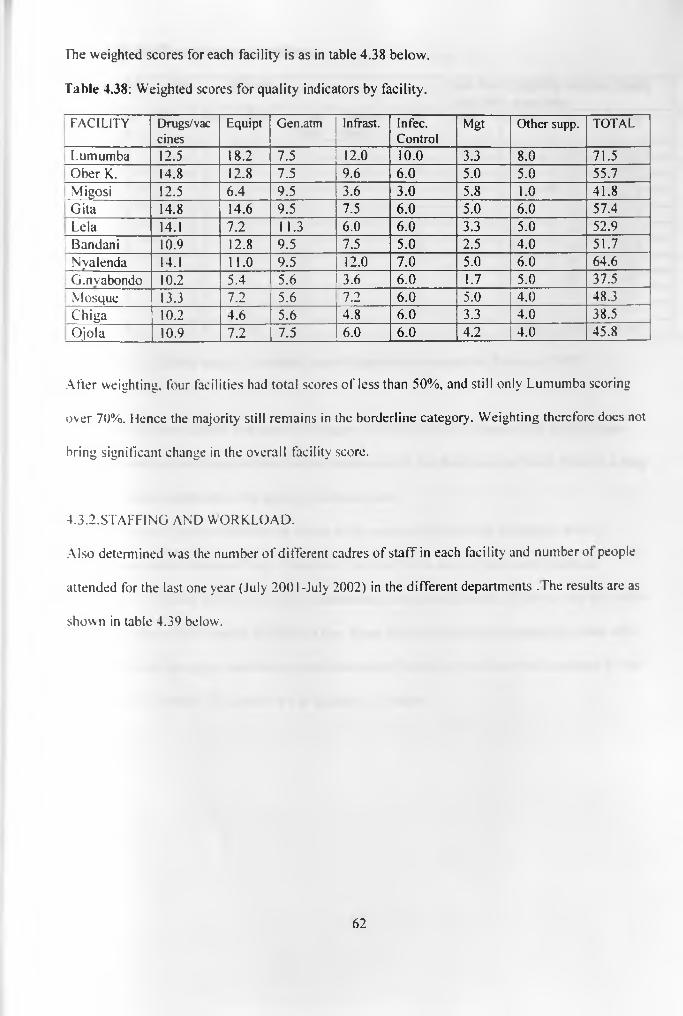
The weighted scores for each facility is as in table 4.38 below.
Table 4.38: Weighted scores for quality indicators by facility.
FACILITY Drugs/vaccines
Equipt Gen.atm Infrast. In fee. Control
Mgt Other supp. TOTAL
Lumumba 12.5 18.2 7.5 12.0 10.0 3.3 8.0 71.5Ober K. 14.8 12.8 7.5 9.6 6 .0 5.0 5.0 55.7Migosi 12.5 6.4 9.5 3.6 3.0 5.8 1.0 41.8Gita 14.8 14.6 9.5 7.5 6 .0 5.0 6 .0 57.4Lela 14.1 7.2 11.3 6.0 6 .0 3.3 5.0 52.9
1 Bandani 10.9 12.8 9.5 7.5 5.0 2.5 4.0 51.7! Nyalenda 14.1 11.0 9.5 12.0 7.0 5.0 6 .0 64.6; G.nvabondo 10.2 5.4 5.6 3.6 6 .0 1.7 5.0 37.5
Mosque 13.3 7.2 5.6 7.2 6 .0 5.0 4.0 48.3Chiga 10.2 4.6 5.6 4.8 6 .0 3.3 4.0 38.5Ojola 10.9 7.2 7.5 ' 6.0 6 .0 4.2 4.0 45.8
After weighting, four facilities had total scores of less than 50%, and still only Lumumba scoring
over 70%. Hence the majority still remains in the borderline category. Weighting therefore docs not
bring significant change in the overall facility score.
4.3.2.STAFFING AND WORKLOAD.
Also determined was the number of different cadres of staff in each facility and number of people
attended for the last one year (July 2001-July 2002) in the different departments . The results are as
shown in table 4.39 below.
62
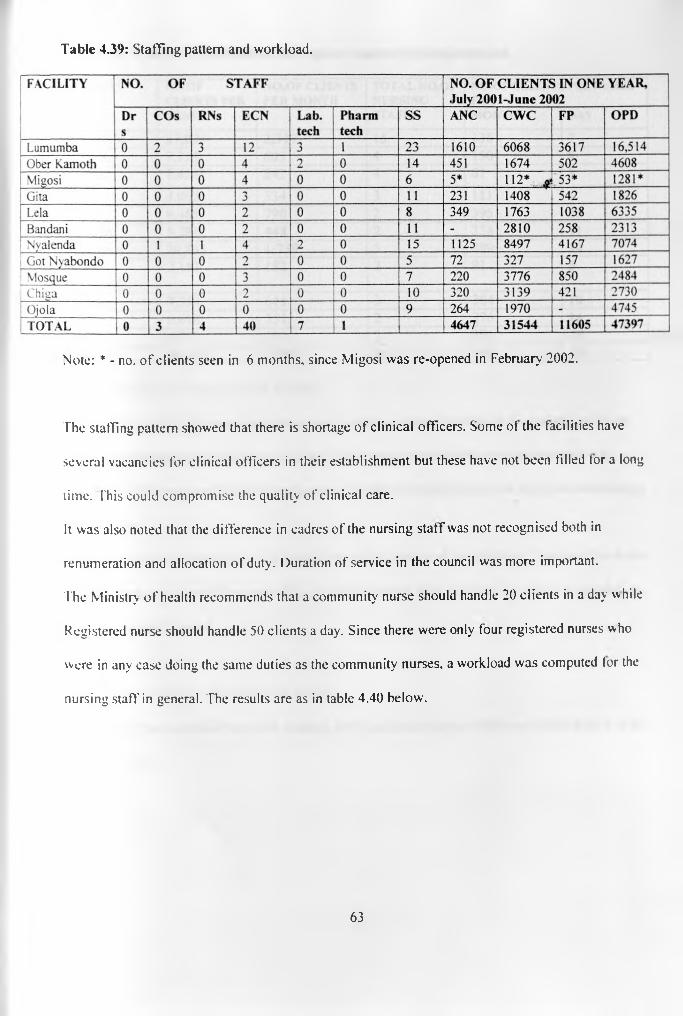
Table 4.39: Staffing pattern and workload.
Note: * - no. of clients seen in 6 months, since Migosi was re-opened in February 2002.
The staffing pattern showed that there is shortage of clinical officers. Some of the facilities have
several vacancies for clinical officers in their establishment but these have not been filled tor a long
time. This could compromise the quality of clinical care.
It was also noted that the difference in cadres of the nursing staff was not recognised both in
renumeration and allocation of duty. Duration of service in the council was more important.
The Ministry of health recommends that a community nurse should handle 20 clients in a day w hile
Registered nurse should handle 50 clients a day. Since there were only tour registered nurses who
were in any case doing the same duties as the community nurses, a workload was computed tor the
nursing staff in general. The results are as in table 4.40 below.
63
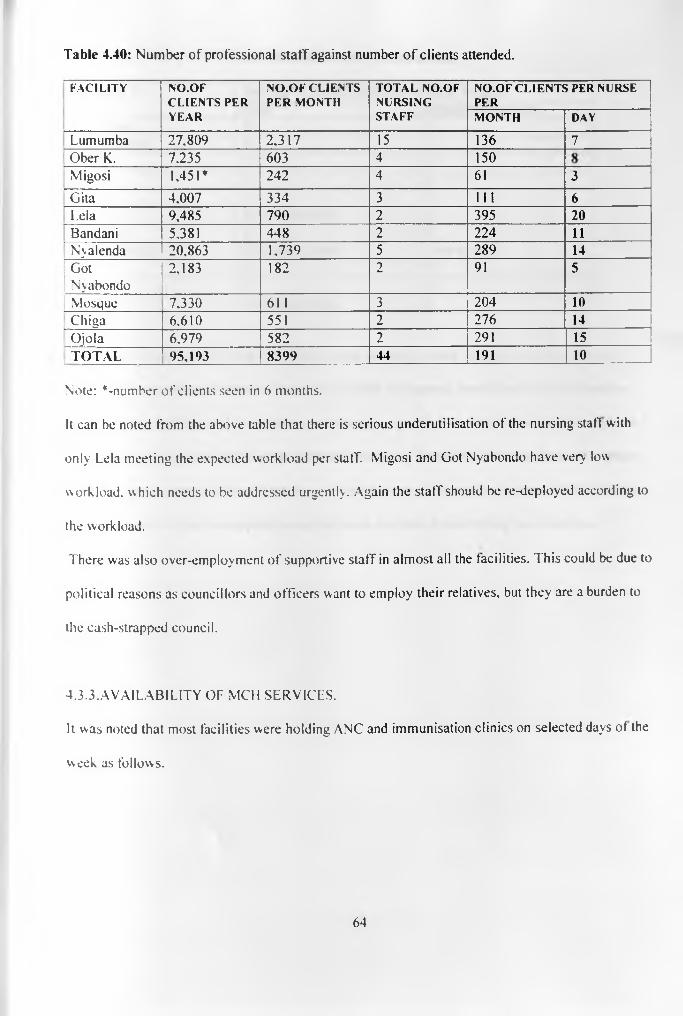
Table 4.40: Number of professional staff against number o f clients attended.
F A C I L I T Y N O . O FC L I E N T S P E R
Y E A R
N O . O F C L I E N T S
P E R M O N T HT O T A L N O . O F
N U R S I N GS T A F F
N O . O F C L I E N T S P E R N U R S E P E R
M O N T H D A Y
Lumumba 27,809 2,317 15 136 7Ober K. 7,235 603 4 150Migosi 1,451* 242 4 61 3Gita 4.007 334 3 111 6Lela 9,485 790 2 395 2 0
Bandani 5,381 448 2 224 11Nyalenda 20,863 1,739 5 289 14
; GotNyabondo
2,183 182 2 91 5
Mosque 7,330 61 1 3 204 1 0
Chiga 6,610 551 2 276 14Ojola 6,979 582 2 291 15TOTAL 95,193 8399 44 191 1 0
Note: ^-number of clients seen in 6 months.
It can be noted from the above table that there is serious underutilisation of the nursing staff with
only Lela meeting the expected workload per staff. Migosi and Got Nyabondo have very low
workload, which needs to be addressed urgently. Again the staff should be re-deployed according to
the workload.
There was also over-employment of supportive staff in almost all the facilities. This could be due to
political reasons as councillors and officers want to employ their relatives, but they are a burden to
the cash-strapped council.
4.3.3. A VAIL ABILITY OF MCH SERVICES.
It was noted that most facilities were holding ANC and immunisation clinics on selected days of the
week as follows.
64

Table 4.41: Number o f ANC and Immunisation services in a week.
FACILITY NO. OF CLINIC SESSIONS PER WEEKANC IMMUNIZATION
Lumumba 5 5Ober Kamoth 5 5Migosi 1 1
' Gita 1 2Lela 1 1Bandani No formal clinic 2Nyalenda 5 5Got Nyabondo No formal clinic 1 per monthMosque 5 5Chiga 2 2
Ojola No formal clinic 2
Most of the facilities which held these clinics once or twice a week indicated that they did this
because of low number of clients or lack of cold chain equipment, hence they keep their vaccine
stocks in other facilities and it would be cumbersome to go for them daily. Some facilities did not
have formal ANC clinics and could attend those who come for first visits then refer them to other
facilities. These same facilities did not have FP clinics as well. It could not be established wh> this
was so, or what criteria was applied to exclude these facilities from offering these services.
65
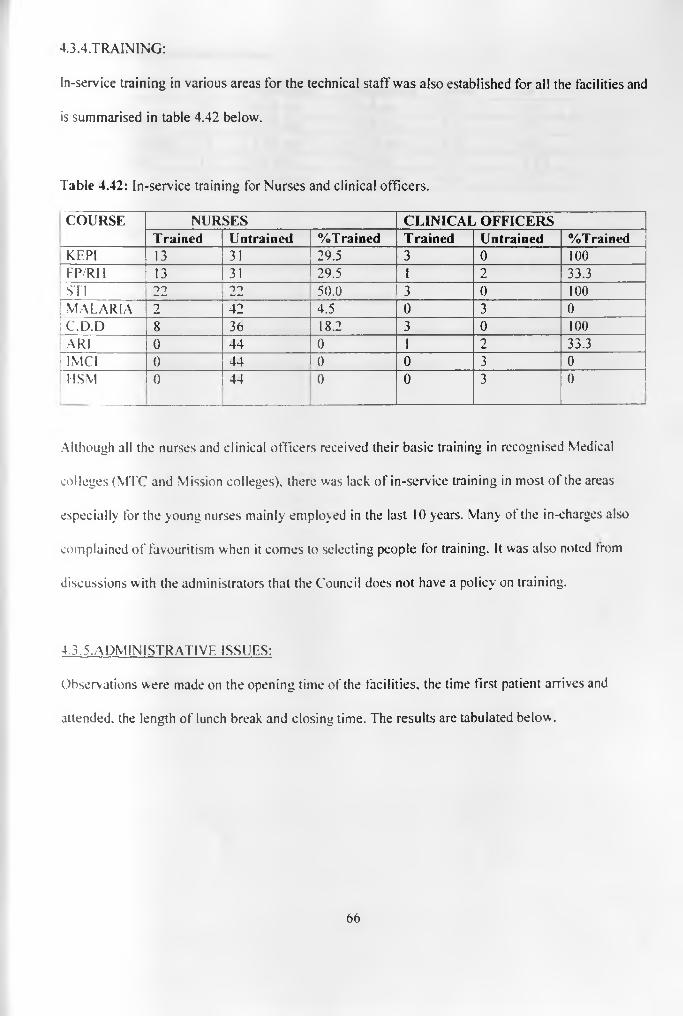
4.3.4.TRAINING:
In-service training in various areas for the technical staff was also established for all the facilities and
is summarised in table 4.42 below.
Table 4.42: In-service training for Nurses and clinical officers.
COURSE NURSES CLINICAL OFFICERSTrained Untrained %Trained Trained Untrained %Trained
KEPI 13 31 29.5 3 0 100f FP/RH 13 31 29.5 p f 2 33.3STI 22 22 50.0 3 0 100
[ m a l a r ia 2 42 4.5 I F 3 0| c 7d .d 8 36 18.2 3 0 100\AR\ 0 44 O F 1 2 33.31 IMCI 0 44 0 0 3 0
USM 0 44 0 0 3 0
Although all the nurses and clinical officers received their basic training in recognised Medical
colleges (MTC and Mission colleges), there was lack of in-service training in most of the areas
especially for the young nurses mainly employed in the last 10 years. Many of the in-charges also
complained of favouritism when it comes to selecting people for training. It was also noted trom
discussions with the administrators that the Council does not have a policy on training.
4.3.5.ADMINISTRATIVE ISSUES:
Observations were made on the opening time of the facilities, the time first patient arrives and
attended, the length of lunch break and closing time. The results are tabulated below .
66

Table 4.43: Observed service times.
TIME N Minimum Maximum Mean SDOpening 10 8 .00 am 9.14 am 8.22 0.36First pt.arrives 10 8.05 am 10.45 am 9.35 0.79First pt. attended 10 8.45 am 11.00 am 8.56 0.82Lunch break 10 60 min. 90 min. 81.0 12.87Closing 10____ 14.00 p.m. 5.00 p.m. 4.36 0.37
These are the acceptable official working hours. This was o f course supported by the finding from
household interview that majority were satisfied with the operation time during the day.
Also observed was that the facilities never had tea breaks.
These were however one day observations due to logistical inadequacies. More prolonged
observations could be recommended to get a more reliable picture.
67
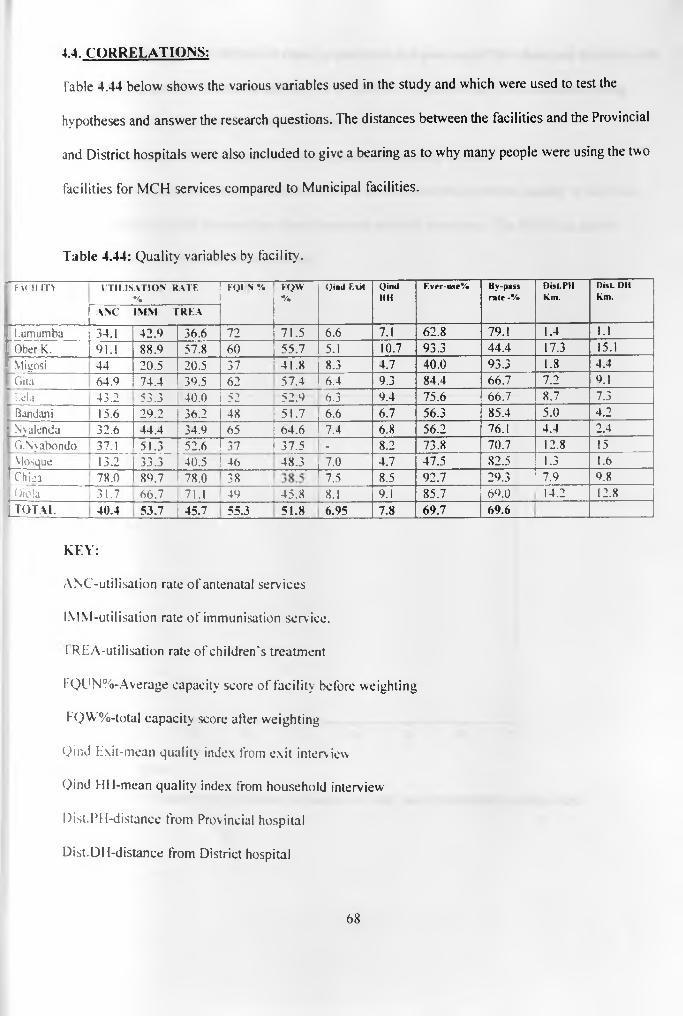
4.4. CORRELATIONS:
T a b le 4.44 below shows the various variables used in the study and which were used to test the
hypotheses and answer the research questions. The distances between the facilities and the Provincial
and District hospitals were also included to give a bearing as to why many people were using the two
facilities for MCH services compared to Municipal facilities.
Table 4.44: Quality variables by facility.
7 F x n i . m ITILISA TIO N RATE%
KOI N % FQW%
Qind Exit QindMM
Ever-uxe% By-pass rale -%
Dist.PMkm.
Disc DM Km.
A.NC IM M T R E A
1 L u m u m b a 34.1 42.9 36.6 72 71.5 6.6 7.1 62.8 79.1 1.4 1.1J O b e r K . 91.1 88.9 57.8 60 55.7 5.1 10.7 93.3 44.4 17.3 15.1I V tigosi 44 20.5 20.5 37 41.8 8.3 4.7 40.0 93.3 1.8 4.41 G ita 64.9 74.4 39.5 62 57.4 6.4 9.3 84.4 66.7 7.2 9.1| L eia 43.2 53.3 40.0 52 52.9 6.3 9.4 75.6 66.7 8.7 7.3) B an d an i 15.6 29.2 36.2 48 51.7 6.6 6.7 56.3 85.4 5.0 4.2t N y a le n d a 32.6 44.4 34.9 65 64.6 7.4 6.8 56.2 76.1 4.4 2.41 G .N y a b o n d o 37.1 51.3 52.6 37 37.5 - 8.2 73.8 70.7 12.8 15| M o sq u e 13.2 33.3 40.5 46 48.3 7.0 4.7 47.5 82.5 1.3 1.6f e n 78.0 89.7 78.0 38 fT 5 8.5 92.7 29.3 7.9 9.8j O jc la 31.7 66.7 71.1 49 45.8 8.1 9.1 85.7 69.0 14.2 12.8| T O T A L 4 0 . 4 5 3 . 7 4 5 . 7 5 5 . 3 5 1 . 8 6 . 9 5 7 . 8 6 9 . 7 6 9 . 6
KEY:
ANC-utilisation rate of antenatal services
IMM-utilisation rate of immunisation service.
1 REA-utilisation rate of children's treatment
KQUN%-Average capacity score of facility before weighting
FQW%-total capacity score after weighting
Qind Exit-mean quality index from exit interview
Qind HH-mean quality index from household interview
Dist.PH-distance from Provincial hospital
Dist.DH-distance from District hospital
6 8
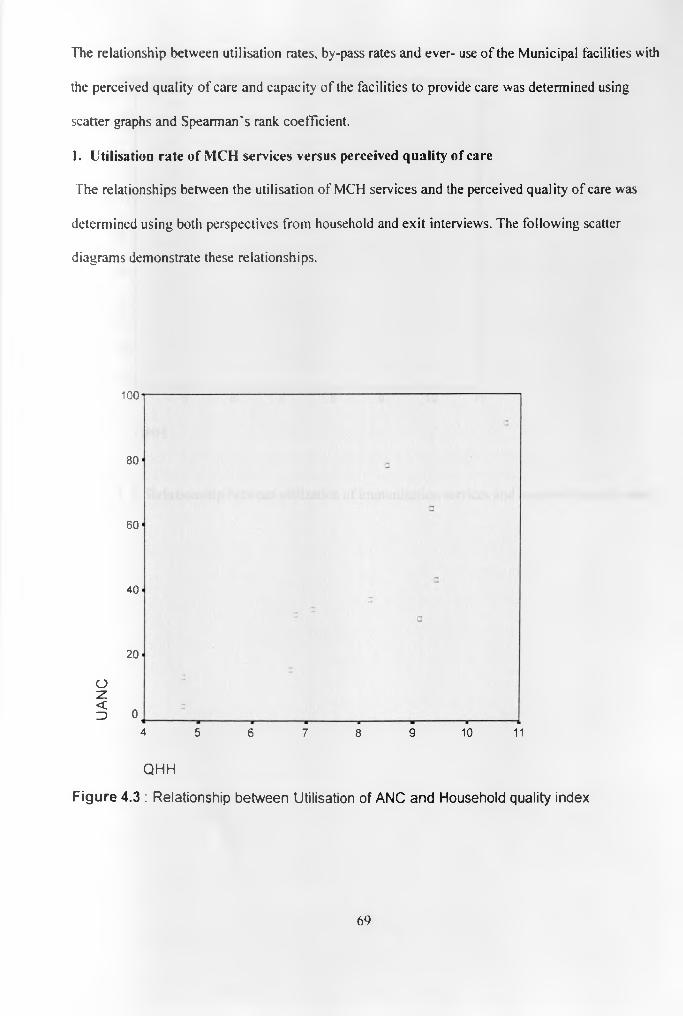
The relationship between utilisation rates, by-pass rates and ever- use of the Municipal facilities with
the perceived quality of care and capacity of the facilities to provide care was determined using
scatter graphs and Spearman's rank coefficient.
1. Utilisation rate of MCH services versus perceived quality of care
The relationships between the utilisation of MCH services and the perceived quality of care was
determined using both perspectives from household and exit interviews. The following scatter
diagrams demonstrate these relationships.
100
80
60
40
20
Oz§ 0
4 5 6 7 8 9 10 11
Q H H
F ig u r e 4 .3 : R e la t io n sh ip b e tw e e n U t ilis a t io n o f A N C a n d H o u se h o ld q u a lity in d e x
6 9
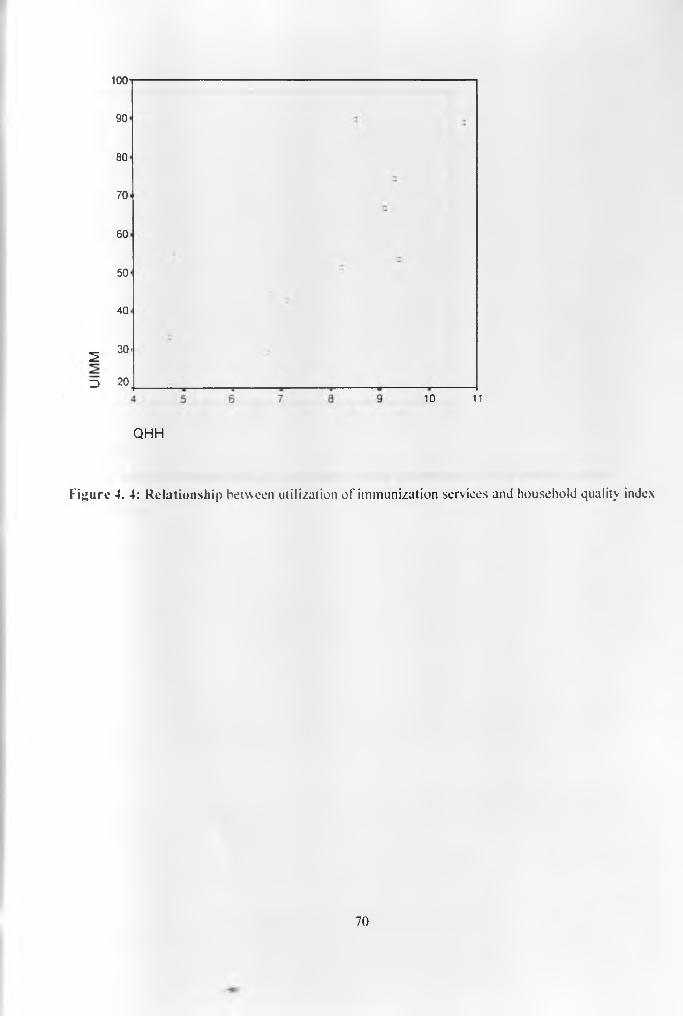
1 0 0
90
80
70
60
50
40
2 30
3 2010 11
Q H H
Figure 4. 4: Relationship between utilization of immunization services and household quality index
70
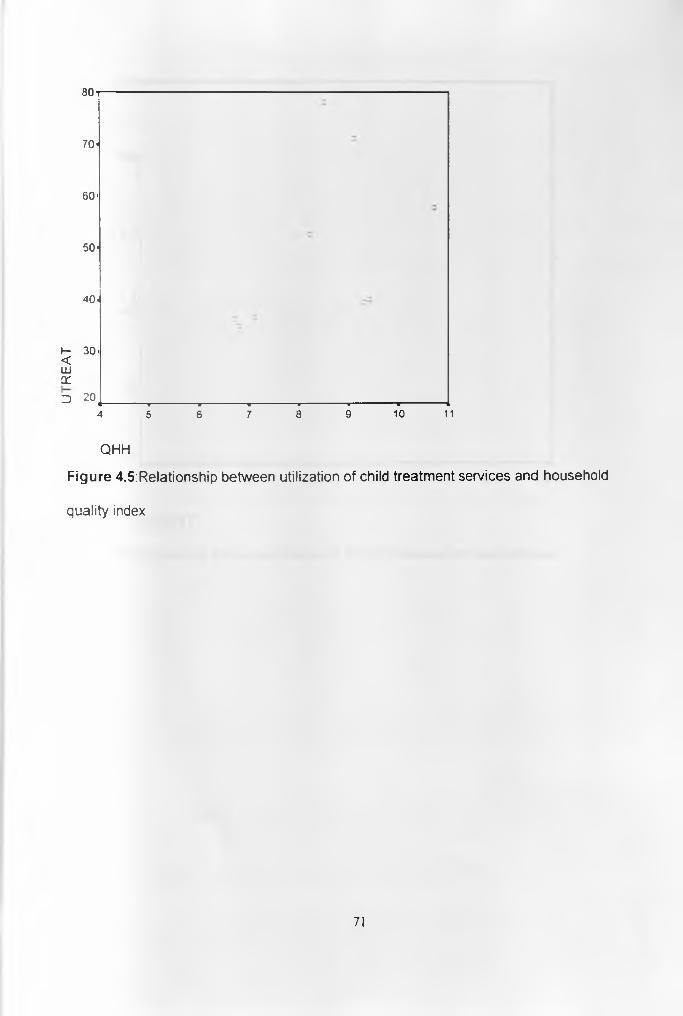
8 0
70-
60-
50-
40-
I- 30- <UJXD 20,
+ " i ----------------------------1 ■ ■ i ■ ■■■,— — ----------------- r — 4
4 5 6 7 8 9 10 11
QHH
F ig u r e 4 .5 :R e la t io n s h ip b e tw e e n u t iliz a t io n o f ch ild tre a tm e n t s e r v ic e s an d h o u se h o ld
q u a lity index
71

100*
80
60
40
20
o
<3 0[________w_______ w_______ _ _______ w_______ ________ _
5.0 5.5 6.0 6.5 7.0 7.5 8.0 8.5
QEXITFigure 4.6: Relationship between utilization of ANC services and exit quality index.
72
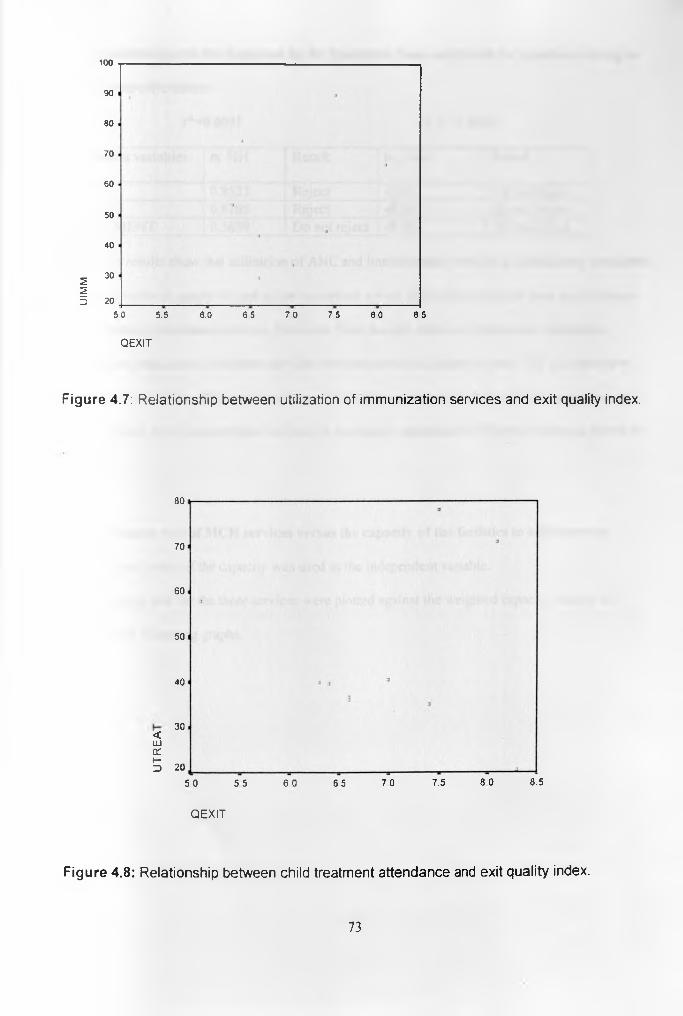
UIM
M
100
90
80
70
60
50
40
30
20
5 0 5.5 6.0 6 5 7 0 7 5 8 0 8 5
QEXIT
F ig u r e 4.7: R e la t io n s h ip b e tw e e n u t iliz a t io n o f im m u n iz a t io n s e r v ic e s an d e x it qua lity index.
<ID£Th-D
80
70
60
50
40
30
20
5 0 5 5 6 0 6 5 7 0 7.5 8 0 8.5
QEXIT
F ig u r e 4 .8 : R e la t io n s h ip b e tw e en ch ild tre a tm e n t a t te n d a n c e and e x it q u a lity index .
73
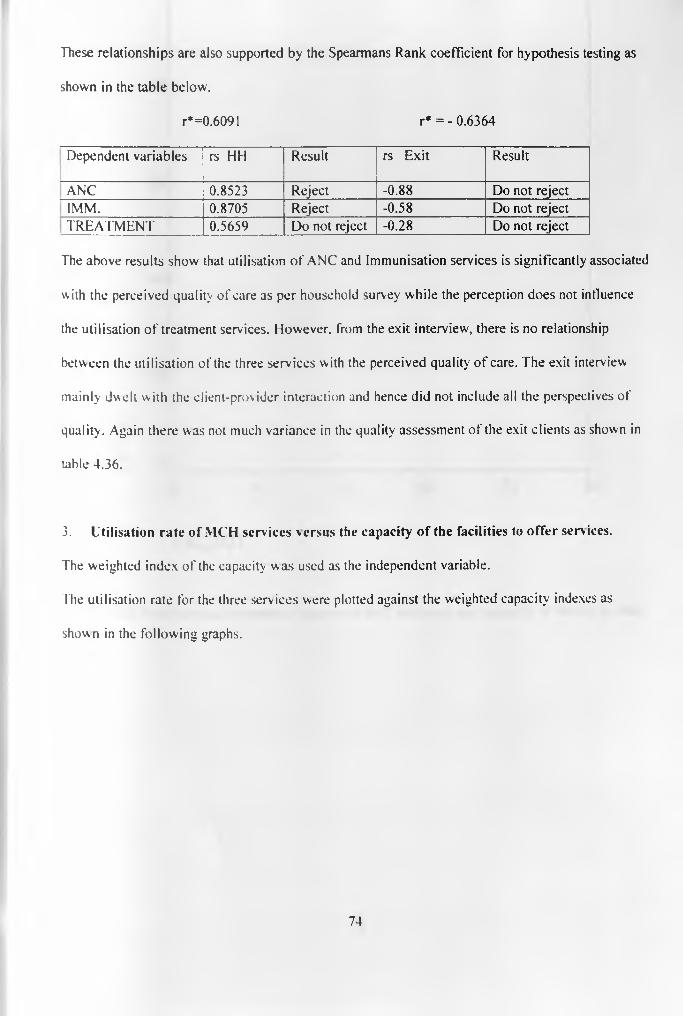
These relationships are also supported by the Spearmans Rank coefficient for hypothesis testing as
shown in the table below.
r*=0.6091 r* = - 0.6364
Dependent variables rs HH Result rs Exit Result
ANC 0.8523 Reject -0 .88 Do not rejectIMM. 0.8705 Reject -0.58 Do not reject
| TREATMENT 0.5659 Do not reject -0.28 Do not reject
The above results show that utilisation of ANC and Immunisation services is significantly associated
with the perceived quality of care as per household survey while the perception does not influence
the utilisation of treatment services. However, from the exit interview, there is no relationship
between the utilisation of the three services with the perceived quality of care. The exit interview
mainly dwelt with the client-provider interaction and hence did not include all the perspectives of
quality. Again there was not much variance in the quality assessment of the exit clients as shown in
table 4.36.
3. Utilisation rate of MCH services versus the capacity of the facilities to offer services.
The weighted index of the capacity was used as the independent variable.
The utilisation rate for the three services were plotted against the weighted capacity indexes as
shown in the following graphs.
74

UA
NC
8 0
60
40
20
0 --------------------- :------------------ ; s s m30 40 50 60 70 80
FACW T
F ig u r e 4.9 R e la t io n s h ip b e tw e e n u t iliz a t io n o f A N C s e r v ic e s and c a p a c ity o f fa c ility to o ffe r
c a re .
75

1 0 0
90-
80'
70-
60-
50-
40-
30.
~ --■------------- ■ 1 ■' ■ -̂------------30 40 50 60 70 80
F A C W T
F ig u r e 4 .10 : R e la t io n s h ip b e tw e e n u tiliza tion o f im m u n iz a t io n s e r v ic e s a n d c a p a c ity o f
fa c ility to o ffe r c a re .
76
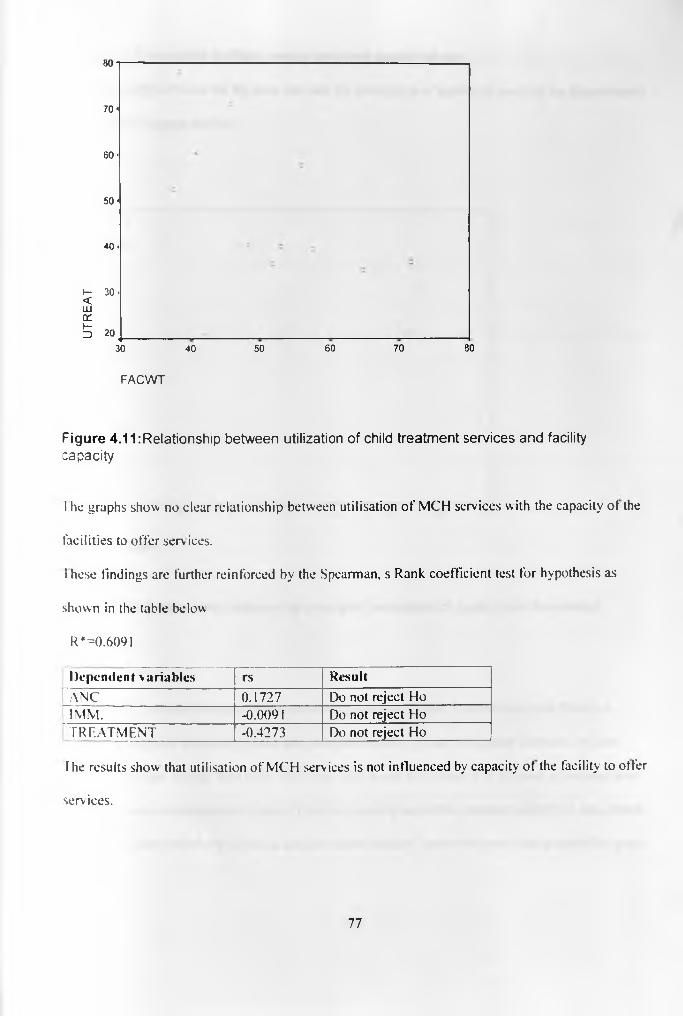
8 0
70 <
60 <
5 0 -
40 -
I -<UJtrt-D
3 0 -
20 (_________30 40
FACWT
50 60 70 80
F ig u r e 4 .1 1 :R e la t io n s h ip b e tw e e n u t iliz a t io n o f ch ild t re a tm e n t s e r v ic e s a n d fac ility
c a p a c ity
l he graphs show no clear relationship between utilisation of MCH services with the capacity ot the
facilities to offer serv ices.
I hese findings are further reinforced by the Spearman, s Rank coefficient test for hypothesis as
shown in the table below
R* = 0 .6091
Dependent variables rs ResultANC 0.1727 Do not reject HoIMM. -0.0091 Do not reject HoTREATMENT -0.4273 Do not reject Ho
The results show that utilisation of MCH services is not influenced by capacity of the facility to offer
services.
77

3. By-pass of municipal facilities versus perceived quality of care
I he relationship between the By-pass rate and the perception of quality o f care can be demonstrated
by the scatter diagram below.
QHH
F ig u r e 4.12: R e la t io n s h ip b e tw e en b y -p a s s a n d p e rc e p t io n o f q u a lity from h o u s e h o ld
su rv e y .
As the quality indexes increase the by-pass rate goes down, hence it can be seen that there is a
negative association between by-pass and perceived quality of care. As quality increase, by-pass
goes down. Chiga appears here to be an outlier. This could be because it is isolated in the rural area
with very poor communication to town. There are actually no public transport plying the area, hence
the residents have no otherwise but to use the nearest facility, hence the lower than expected by-pass.
78

Performing Spearman, s Rank coefficient test for hypothesis testing, the hypothesis was rejected as
shown below .
Quality index from household was used as the independent variable
Dependent variable -r* rs Result
By-pass -0.6091 -0.85 Reject Ho.
4. By-pass rate versus capacity of the facilities to offer services.
The relationship between the bv-pass rate and the capacity of the facility to offer care is
represented in a scatter diagram as below. The weighted index was used as the independent variable.
100
90
80
70
60
50
40
CO2 30CL
m 2030 40 50 60 70 80
FACWT
F ig u r e 4 .13 : R e la t io n s h ip b e tw e e n b y -p a s s an d c a p a c it y o f fa c ilit ie s to o f fe r c a re
79

From the diagram it can be seen that there is no relationship between the by-pass of a facility and the
capacity of the facility to offer services This is proved by the Spearman, s Rank coefficient test for
hypothesis testing as shown below.
Dependent variable -r* rs ResultBy-pass -0.6091 -0.0568 Do not reject
5. Ever-use of municipal health facilities versus perception of quality of care
Quality index from household survey was used as independent variable.
The scatter diagrams below represent the relationship between the ever-use of Municipal facilities
and the perceived quality of care.
100---------------------------------------------------------------—-------
c 090 ■
0 a
80 ■a3
70 •
60 ■30
50 ■
4 0 .CCLU
S 30 J__________________________________ _14 5 6 7 8 9 10 1
QHH
F ig u r e 4 .14 : R e la t io n s h ip b e tw e e n e v e r -u s e o f M u n ic ip a l fa c ilit ie s an d p e rc e p t io n o f qua lity
from h o u se h o ld su rvey .
80
As the quality index increase, there is a likelihood of ever-use of the municipal facilities, hence a
positive relationship.
This is further supported by Spearman, s Rank coefficient test for hypothesis testing as shown below.
Dependent variable R* rs ResultEver-use 0.6091 0.9205 Reject Ho
Hence ever-use o f municipal health facilities is influenced by the perception of quality of care.
6. From the utilisation and by-pass analysis, it was noted that most of those who by-passed
Municipal facilities either went to Provincial or District hospitals for services. The distances from the
Municipal facilities to the two MOH facilities are presented in table 4.44 above. The following
scatter diagrams show the relationship between by-pass of Municipal facilities and the distances
between the facilities and the Provincial and District hospitals.

1 00
90 -
80 - a
7 0 < 3
60 ■
50-
a40 ■
(/)55 30 - 2<CL
m 20 _____________________________0 10 20
DPGH
F ig u r e 4 .15 : R e la t io n s h ip b e tw e e n b y -p a s s a n d d is t a n c e be tw een fa c ility a n d P G H .
100
90
80
70
60
50
40
CO
^ 30CL
m 20o 2 4 6 8 10 12 14 16
DKDH
F ig u r e 4 .16: R e la t io n s h ip b e tw e e n b y -p a s s a n d d is ta n c e b e tw een fa c ility a n d K D H
82
From the two graphs, it can be noted that there is a negative relationship between by-pass and
distance between the Municipal facilities and the Provincial and District hospitals. The nearer one is
to the MOH facilities the likely it is for one to by-pass the Municipal facility. The people living in
the urban part o f the Municipality were therefore bypassing the Municipal facilities more for the
MOH facilities. The rural population on the other hand had no alternative but to use the Municipal
facilities, which were the most accessible to them. Chiga again is an outlier, not following the trend
due to its isolation and poor accessibility to town by the residents.
Performing the Spearmans Rank coefficient, leaving out Chiga, the relationship is supported as
shown below.
R* =0.6091
Dependent DPGH DKDH
rs Result Rs Result
By-pass 0.7924 Reject Ho 0.6772 Reject Ho
7. The relationship between the three measures of quality was determined by means of scatter
diagrams as shown below.
83
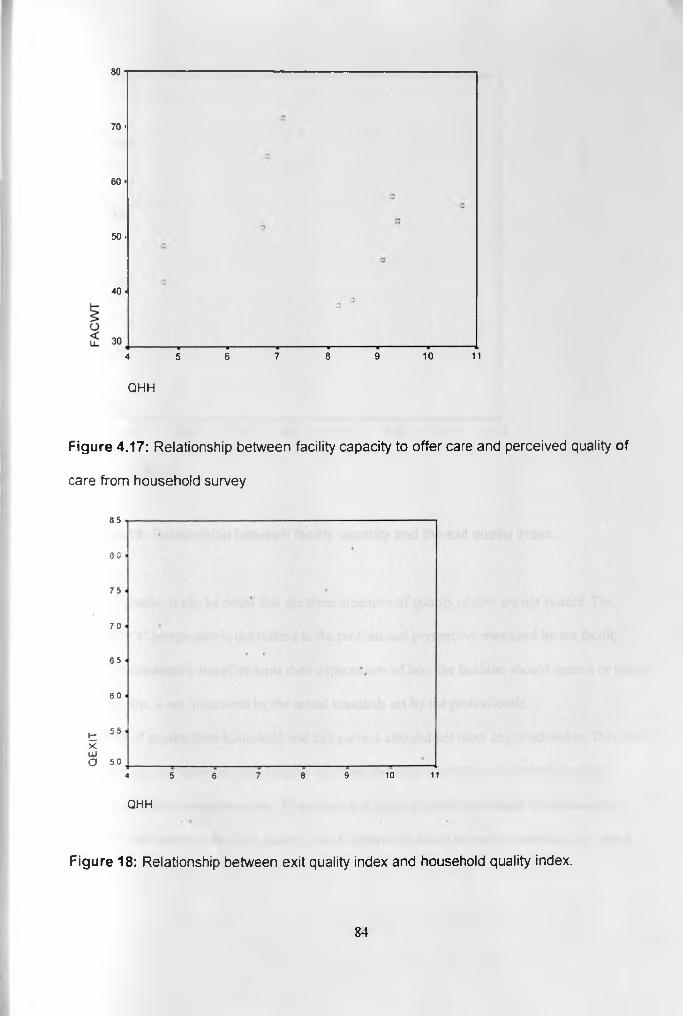
8 0
70 ■
60
50 -
40 •
4 5 6 7 8 9 10 11
QHH
Figure 4.17: R e la t io n s h ip b e tw e e n fa c ility c a p a c ity to o f fe r c a re a n d p e rc e iv e d qua lity of
c a re fro m h o u s e h o ld su rvey .
85
3 0
75
70
65
60
t 55 X LUO 50
4 5 6 7 8 9 10 11
QHH
Figure 18: R e la t io n s h ip b e tw e en e x it q u a lity in d e x a n d h o u se h o ld q u a lity in dex .
84
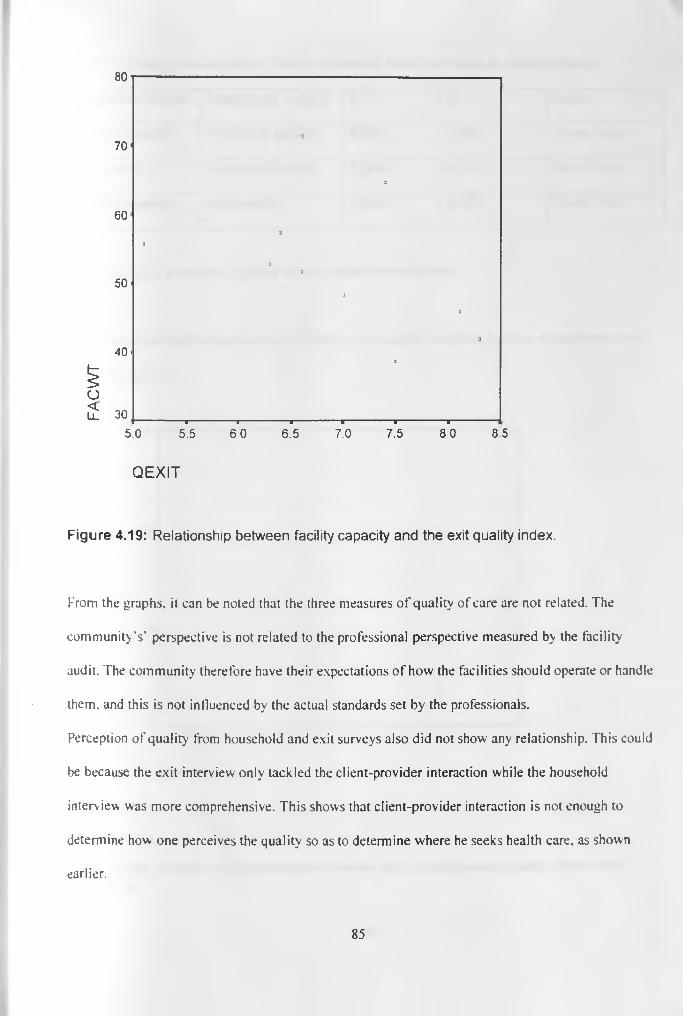
80
7 0 '
3
6 0 '
a
a
a3
5 0 '3
3
34 0 '
^ a
O2: 30
-------------------------- 1-------------------------1--------------------------a -------------------------1------------------------- 1--------------------------1------------------------
5 . 0 5 . 5 6 0 6 . 5 7 . 0 7 . 5 8 . 0 8 . 5
QEXIT
F ig u r e 4 .19 : R e la t io n s h ip b e tw e e n fa c ility c a p a c ity a n d th e ex it q u a lity in d e x .
From the graphs, it can be noted that the three measures of quality of care are not related. The
community's' perspective is not related to the professional perspective measured by the facility
audit. The community therefore have their expectations of how the facilities should operate or handle
them, and this is not influenced by the actual standards set by the professionals.
Perception of quality from household and exit surveys also did not show any relationship. This could
be because the exit interview only tackled the client-provider interaction while the household
interview was more comprehensive. This shows that client-provider interaction is not enough to
determine how one perceives the quality so as to determine where he seeks health care, as shown
earlier.
85
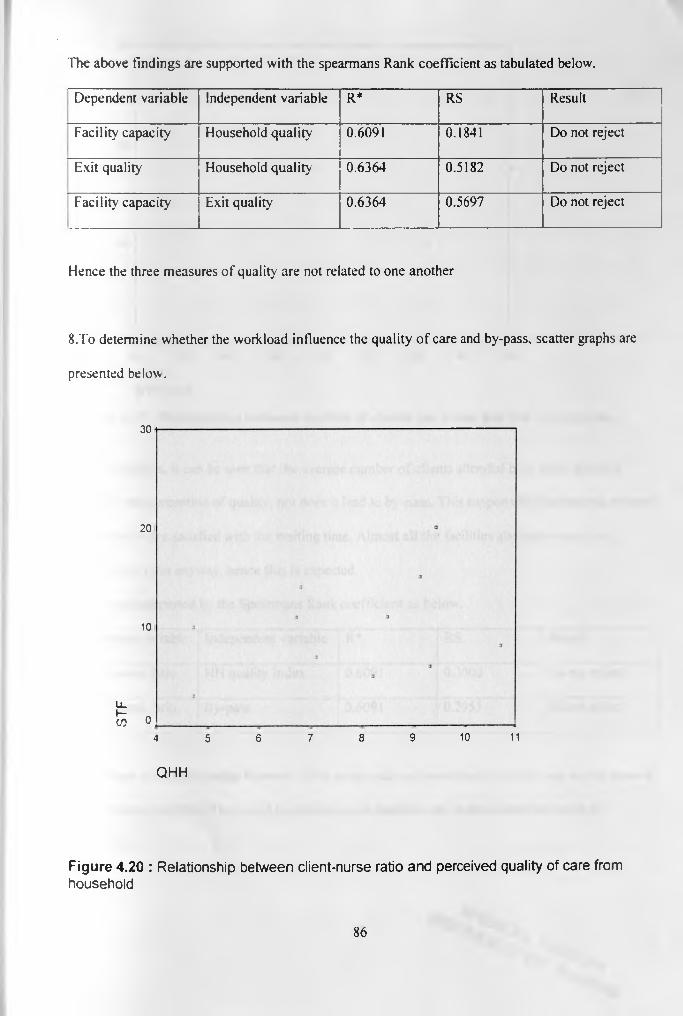
The above findings are supported with the spearmans Rank coefficient as tabulated below.
Dependent variable Independent variable R* RS Result
Facility capacity Household quality 0.6091 0.1841 Do not reject
Exit quality Household quality 0.6364 0.5182 Do not reject
Facility capacity Exit quality 0.6364 0.5697 Do not reject
Hence the three measures of quality are not related to one another
8 .To determine whether the workload influence the quality of care and by-pass, scatter graphs are
presented below.
30
20
10
Li
f e 04 5 6 7 8 9 10 11
Q H H
Figure 4.20 : R e la t io n s h ip b e tw e e n c lie n t-n u rs e ra tio a n d p e rce iv e d q u a lity o f c a re from
h o u se h o ld
86

30
2 0 *
9 a10.
9
U_I—CO o
------------------------------- 1------------------------------■-------------------------------■------------------------------- ■------------------------------ ■-------------------------------■ ■ ■ ~ ■" 1 —
20 30 40 50 60 70 80 90 100
B Y P A S S
Figure 4.21 : R e la t io n s h ip b e tw e e n n u m b e r o f c l ie n ts p e r n u rse an d th e b y -p a s s rate.
From the graphs, it can be seen that the average number o f clients attended by a nurse does not
influence the perception of quality, nor does it lead to by-pass. This supports the finding that most of
the mothers were satisfied with the waiting time. Almost all the facilities also had a very low
client-nurse ratio anyway, hence this is expected.
This is also supported by the Spearmans Rank coefficient as below.
Dependent variable Independent variable R* RS Result
Client-nurse ratio HH quality index 0.6091 0.3000 Do not reject
Client-nurse ratio By-pass 0.6091 0.2955 Do not reject;
Hence there is no relationship between client-nurse ratio and perceived quality of care and by-pass of
the Municipal facilities. This could be because most facilities are under-utilised as shown in
table 4.40.
87
5: DISCUSSION:
The results from the survey show that utilisation of Maternal and Child health at the Municipal
facilities is generally low, with only 40.4% using the ANC services, 45.7% using clinical services for
sick children, and 53.7% using the facilities for immunisation services. Except for immunisation
services, the Kisumu residents use the Municipal facilities less than the other facilities combined.
The above findings are similar to those reported in the Strategic Health Plan for Nairobi area (1992),
that although majority of the Nairobi residents (60%) use the city council facilities more than any
other category o f facility, the utilisation of MCH/FP services was low. The Nairobi Area Study
(REACH, 1988) also found under-utilisation of the physical facilities as a critical area of weakness in
the health system.
There was a by-pass of about 70% overall, meaning 70% of the respondents had by-passed
Municipal facility for at least one of the three services. This shows lack ot confidence in the
Municipal facilities, given that they are a majority within the municipal boundaries. For the
individual serv ices, the by-pass rate for ANC was 59.5%, while for treatment o f children it was
54. 3% , and 46.3% for immunisation
Migosi had the highest by-pass rate and also lowest utilization rates of the services, while Chiga had
the lowest by-pass rate and also high utilisation rates of the three services. There was a general trend
of the rural areas having low by-pass rates and high utilisation rates than the urban catchment areas, a
result explained mainly by the varying distances to the alternative facilities and variation in
education status among urban and rural populations.
The by-pass rate and ever-attendance of Municipal facilities showed a strong relationship with
education status, occupation and ty pe of dwelling. Even after using logistic regression to factor in
distance to provincial hospital and other variables, the association between by-pass and education
88
status is still strong. This suggests that those with better socio-economic status are more likely to by
pass, or to have never used Municipal facilities. This is likely to be due to their ability to pay for
services and transport costs for seeking better service.
Results of the respondents reports on the quality of care indicators as reported by the 336 mothers
who had used the Municipal health facilities for MCH services at any one time during the past three
vears demonstrate variations in the responses reported based on the elements and the indicators
studied. Majorities of the women were satisfied w ith the provider’s general attitudes and the
communication process that took place between themselves and the health care providers. This was
demonstrated both in the household and exit interviews. This is consistent with other studies done
elsewhere. A national level study done in Kenya (Obonyo et al, 1993) showed that 9.92% outpatients
in MOH hospitals rated staff attitude as excellent while 6 8 .6% gave a rating of good. Also, a study
done in Malawi, (Lule et al.2000) found that 97.2% were satisfied with the provider's general
attitude, 90.7% with communication and 69.8% with the provider's sincerity.
Of concern under the client-provider relationship was the finding that the providers did not explain to
the clients what they were doing during their physical examination. This could be due to the tact that
majority of the respondents for exit interview brought children for immunisation and the health
workers take the exercise as routine. Also, the majority of women said there was no privacy in the
serv ice rooms. This was confirmed during the facility audits, that most of the facilities were using
one room for both ANC and Immunisations, where all the weighing, examination and vaccinations
were taking place. It is apparent that the health providers do not give emphasis to privacy to these
services. This lack of privacy can also affect utilisation of facilities, as reported by Lule.
8 9

The results show a varied satisfaction o f women on indicators of providers technical competence on
handling the clients .The majority of them were satisfied with the providers understanding and
competence to handle their/their children's problem. However only 46.4% were satisfied with the
physical examination carried out by the providers. Also interesting was the finding that 37% of the
respondents could not tell whether the provider know his/her work well or not. This group came
mainly from the rural catchment areas with Ober Kamoth, Ojola and Chiga contributing 14%, 13.7%
and 11.3% respectively, while the more urban facility catchment areas like Migosi and Lumumba
only contributed 4.8% and 5.6% respectively. These people therefore, by virtue of their being unable
to access other health facilities, either financially or physically, would care less about quality of care
they receive.
Of more concern however was the finding that most of the providers were not doing some of the
basic examinations like checking the mothers blood pressure, oedema and height or the children for
fever or anaemia. These seem to have been left for the physicians who are dealing with the sick
mothers or children. Maybe blood pressure could not be taken because the facilities had no relevant
equipment, but there was no excuse in not doing the other routine examinations. This failure in
examining clients was also reported in the 1999 Kenya Service Provision Assessment Survey which
noted various areas of examination which were not being done routinely like taking blood pressure,
checking for danger signs in children like skin turgor for dehydration, e.t.c.
T his study demonstrated general satisfaction with the infrastructure including the cleanliness and
quality of the building. This is supported by the facility inventory where 73% of the facilities scored
favourably under general atmosphere and infrastructure.
Analysis of the results showed that perceived quality of care influences the utilisation of MCH
services as well as by-pass and ever-use of the Municipal facilities. This was also shown in a
90
UNICEF (1995) Bamako Initiative study which found that in one district in Pakistan, the community
saw no value in using local health facilities for necessary care due to the low quality of care there.
Only 5% of sick children were taken to the local facilities for treatment.
The results from exit interview though, did not show any relationship with these parameters. This
could be because it covered only the client-provider relationship, which is only one aspect on which
the client satisfaction depends.
The results also showed that perceived quality of care does not influence the utilisation of facilities
for clinical services. Hence there may be other factors like nature of the illness, the seriousness, the
time etc. For example, when asked where they would go for treatment if they fell sick at the time of
the interview, many mothers said that they would go to their nearest municipal facility if the sickness
is mild, but would go to either Provincial or District hospital if it is serious.
Results from facility audit showed that most of the facilities had acceptable capacity to offer
serv ices, but more improvements are needed in some areas like provision of drugs and equipment,
improvement of buildings and infrastructure, and management issues. Lumumba had the best score
followed by Nyalenda, while Got Nyabondo and Chiga had the worst scores. There was however not
much variation between the rural and urban facilities. These findings are similar to the KSPA survey
of 1999, which reported that only a third of the surveyed facilities had all the general-purpose
equipment items to offer basic health care, but that overall the facilities are well equipped to provide
routine antenatal care and childcare. However, shortages of basic supplies and drugs limit the ability
of the facilities to provide effective service. Obonyo et al (1993) in their study reported that the most
important thing patients would like improved in MOH hospitals is availability of drugs. World Bank
(1994), in a ‘Quality of care Beneficiary Assessment Study' commissioned in Zambia reported that
urban areas complained of shortage of drugs and poor staff attitudes.
91
In-service training helps to keep the health workers abreast o f the changes in the medical world and
improve their management skills. A study in Nigeria, (Kim, 1992) found that quality of care
provided by family planning workers improved significantly with short-term counselling training, as
did client compliance with follow-up appointments. Very few of the technical staff in the Municipal
facilities have gone for the basic courses like malaria, control of diarrhoeal diseases, family planning
and KEPI while non of the nurses has done IMC1 training and any management course. It is hoped
that with the implementation of IMCI by the Ministry of Health, the Municipal staff will also get a
chance of being trained. The KSPA survey of 1999 found that 40% of the health workers had never
had an in-service training course while only 40% had got any training in the past 5 years.
The Ministry of health superv ision through the PMO and DMOH offices was noted to be wanting.
Health service provision by the Municipalities is a delegated responsibility by the Ministry of health,
who are therefore expected to retain the overall supervisory role. Keeping abreast of the functions
and operations of these Municipal health facilities will make them respond appropriately to any
deficiencies, like trainings, supplementing drugs and medical supplies, and other policy issues. It is
ironical that the Ministry of health would supply vaccines, contraceptives and STI drugs to the
Municipal facilities from the Nairobi program offices and fail to supervise the use of these supplies
from the local offices. A lot o f improvement is therefore needed in this area.
Analysis showed that utilisation of MCH services and by-pass of the Municipal facilities is not
influenced by the capacity of the facilities to offer services. This shows that the community members
may not know the finer details of what should be in the facility but the way the care is eventually
given to them is what matters. Hence a facility can be very well equipped and staffed but it they do
not meet the client satisfaction tool, their utilisation will still be low.
92
The facility audit was used to provide the professional viewpoint of the quality of care, but the
results show that the community’s viewpoint is stronger in determining utilisation of health services.
For example, Lumumba health centre had the highest facility score of 71.5% while only 62.8% of the
respondents had used it, and a by-pass rate of 79.1%. Chiga dispensary on the other hand had the
lowest facility score of 38.5%, but had 92.7% of the respondents having ever used it, with a by-pass
of only 29.3%. The clients also rated Chiga higher than Lumumba for exit and household quality
assessments, with 7.5 and 8.5 respectively against 6 .6 and 7.1 for Lumumba. Health administrators
are thus caught in a situation where they have to balance both in order improve demand in the
peripheral facilities and deflect the people from the referral facilities. The balancing act may be
difficult unless the communities are incorporated in the management of their local facilities. This can
be done through setting up of Facility Health Management Boards whose membership will be drawn
from the facility catchment areas and the in-charges of the health facilities. These should be overseen
by the Municipal Health Management Board with a wider membership drawn from community
members. Municipality and the Ministry of Health. The boards will act as a link between the
communities and the service providers.
There was a consistent correlation between the socio-economic status, or “ the ability to pay"
surrogates and by-pass and ever-use of Municipal facilities. Studies have however proved that
quality is the most important factor in determining utilisation than cost of services. A study done in
Nigeria, (Denton et al, 1991) found that improvements in quality would have a larger impact on
increasing demand than lower prices. Wouters (1991) found that quality was an important decision
variable for users choosing a provider and that they were willing to pay for quality improvements.
From the foregoing it would seem that the Provincial and District hospitals provide better quality
care than the Municipal facilities, though they also charge more for their services. But the fact that
by-pass was less in the rural facilities also reflects the fact that distance plays a role in determining
93
T
where one seeks care. This was proven in this study, where those residing in the catchment areas of
the facilities closer to the two MOH facilities had a much higher by-pass rate than those living far in
the rural parts of the Municipality. Results from logistic regression also showed that the urban
population is more likely to have a higher socio-economic status than the rural population, and
therefore ability to pay for better services. Factoring in distance and still finding that education level
of the mother is significantly related to by-pass proved this social status. Mothers in the urban
catchment areas who were generally more educated and more likely to be employed or their spouse
employed still by-passed their municipal facilities for MOH facilities. For example, Migosi, which is
1.8km from the Provincial hospital, had a higher by-pass rate o f 93.3% compared to Lumumba and
Mosque, which are 1.4km and 1.3km respectively from PGH and which had by-pass of 79.1% and
82.5% respectively. Migosi is inhabited by people of a much higher socio-economic class than the
other areas. Social class clearly results in a higher demand for quality care.
(kCONCH SIONS AND RKCOMMFNDATIONS:
6.1 CONCLUSIONS:
1. There is under-utilisation of the municipal health facilities. Most of the residents (53.4%) by-pass
these facilities to seek for services elsewhere. Most of those by-passing were going to MOH facilities
(Provincial and District Hospitals). The by-pass is higher in the urban part of the municipality, where
the District and Provincial hospitals are also situated, than in the rural catchment areas.
2. The community has low opinion of the quality of care offered at the Municipal health facilities. In
the household survey, only four facilities had a mean quality index more than halt ot the maximum
possible score of 17. Again, only 19.3% of the respondents gave the overall quality a rating of
9 4

“good” in the household survey. The main areas for desired improvements are drug availability and
laboratory services.
3. Community’s perception of quality of care affects their utilisation of the facilities. Low quality
care from the consumer's perspective translates to low utilisation of the services and high by-pass
rates. In the catchment areas of facilities, which had low quality index, the utilisation rates were also
low and by-pass rates were high. Perception also tends to be influenced by the socio-economic status
and the presence of alternative facilities. Respondents from the isolated rural catchments tended to
give a higher rating to facilities than those from the more urban high-class catchments.
4. The capacity of the facilities to offer services is adequate as the majority scored more than 50% in
the facility audit. This capacity however does not influence the utilisation of these facilities. Hence a
facility may meet all the professional requirements but still have low demand for services. This
emphasises the need to consider client satisfaction parameters as well in efforts to improve coverage
of the health services.
6.2: RECOMMENDATIONS:
1. Improve on supplies, equipment, and medicines;
Health workers cannot do their work if they lack basic equipment, supplies and medicines. Several
avenues should be explored to address these problems. One such avenue is to include Municipal
facilities all over the country in the Essential Drug Program of the Ministry of Health so that they can
be getting their supplies direct .A compensation mechanism can be worked out between the two
95

ministries (Local Government and MOH). In any case the Municipal’s provision of health care is a
delegated responsibility from the Ministry of Health.
2. Establish continuous education and training for the health workers:
There is need to expose the health workers to various in-service or on-the-job training and other
informal training approaches like seminars and workshops. These approaches are important for
reinforcing health worker compliance with appropriate management procedures.
3.Set up Facility Management Boards and Municipal Health Management Board.
These will be able to over-see the running of health services in the Municipality. This will ensure
community participation in the running of the facilities and also act as a link between the
community, the Municipality and the Ministry of Health.
4.Enhance MOH supervision.
This will ensure appropriate and timely response to any shortcomings in service delivery. Regular
supervisory visits from higher-level authorities also provide facilities with incentives to maintain
high quality service.
S.Strengthen, or close down Got Nyabondo dispensary.
Got Nyabondo dispensary is currently not giving any meaningful services. A resident nurse,
preferably male, should be posted to the facility. If this is not possible, then it should be closed down,
or handed over to the Ministry of Health to run it.
96

6.Conduct further research;
There is need to conduct further research to determine the quality of care provided in the MOH
facilities and compare with the findings of this particular study. There is also need to develop a
proper weighting criteria for facility audit surveys, as what was used in this study was the according
to the judgement of the researcher out of some un-related pieces of literature. Again, the effects of
socio-economic status on quality perceptions and expectations need to be studied more
comprehensively.
97

REFERENCES
Abdul E . , 2000; Client satisfaction Tool; Paper presented at the First National congress on Quality Improvement in Health care. Medical Research and Traditional Medicine, Nairobi, Kenya
De Geyudt W. , 1995; Managing the quality of Health care in Developing countries. World Bank
technical paper number 258,Washington DC; p.2-4, 10-11,25
Denton H, Akin J., Vogel R., Wouters A, 1991; Nigeria: Health Care Costs, Financing and
Utilization; World Bank Sub-Sector Report No. 8382-UNI.
Development Solutions for Africa (DSA). 1992; A Strategic Health Plan for the Nairobi Area;
Development Solutions for Africa Ltd. Final Report; p.59-69, 70-71, 117-134.
Donabedian A., 1980; Explorations in Quality: Assessment and Monitoring, Volume I: The
Definition of Quality and Approaches to Its Assessment: Ann Arbor. MI: Health Administration
Press.
Donabedian A., 1982: Explorations in Quality: Assessment and Monitoring,Volume II; The Criteria
and Standards of Quality: Ann Arbor, Ml: Health Administration Press.
Donabedian A., 1985; Explorations in Quality: Assessment and Monitoring, Volume III: The
Methods and Findings of Quality Assessment and Monitoring: An Illustrated Analysis: Ann Arbor,
Ml: Health Administration Press.
Donabedian A., 1988; The Quality of Care: How Can It Be Assessed: The Journal of the American
Medical Association 260(12).
Fabricant S., Nevvbrander W„ 1994; Gambia: Health Facilities Cost Study: Report prepared for the
Government of Gambia and the World Bank. Boston; Management Sciences for Health.
Gamer P„ Thomason J., Donaldson D., 1990: Quality Assessment of Health Facilities in Papua New
Guinea; Health Policy and Planning 5(1); p.49-59.
98

Kisumu City Council, 2002; An indicative situation Analysis for the Lake Victoria Region
City/Municipal Development Strategies (CDS) for improved urban Environment and poverty
reduction;
Kisumu District Medical Officer of Health, 2002; Kisumu District Health Profile; Health
Information Systems
Kisumu Municipal Council, 1997; Partnership approaches to meeting needs of the urban poor: A
proposal from Stakeholders in poverty in the municipality of Kisumu to the Department for
International Development.
Lule G.S, Tugumisireize J. and Ndekha M. ,2000; Quality of care and its effects on utilisation of
maternity services at Health Centre Level, East African Medical Journal Vol. 77, No. 5 May 2000
;p.250-255
Vlaribe S.L., Maggwa B.N.. Askewo I., Miller K., 1997; Using a Rapid Assessment Approach to
evaluate the quality of care in an integrated program. The experience ol the Family Health Division,
Ministry of Health, Botswana; p. 12-27
Mboya T. and Adelhard M„ 2001; The Kenya Quality Model, in First National congress on Quality
improvement in Health Care, Medical Research and Iraditional Medicine, KCC 1 Nairobi-Kenya:
Ministry of Health, Kenya
Measure evaluation project and the monitoring and evaluation subcommittee ol the MAQ, 1999,
Qualitv of care indicators survey (QCIS); Volume 11; A user's guide tor monitoring quality of care,
P.4-6, 42-67.100-118.
Ministry of Health, Republic of Kenya. 1999; The National Health Sector Strategic Plan. 1999-2004,
Government of Kenya. Nairobi.
Ministry of Health, Republic of Kenya. ORC Macro., 1999; The Kenya Service Provision
Assessment Survey, Ministry ot Heath ot Kenya, National Council for Population and Development,
Ministry of Finance and Planning, Government ot Kenya. Nairobi
9 9
Ministry of Health, Republic of Kenya, 2002; Kenya Health Standards and Master check list for
Health services and Systems Monitoring and Evaluation; Department of Standards and Regulatory
Services: Nairobi, Kenya.
Nairobi Health services, 1994; -Draft development plan 1994-2010,The standing Committee on the
implementation of the recommendations of Kenyatta National Hospital, with special Reference to
Research, Technology and Healthcare.
Newbrander B., 2000; Quality of care and lessons, Report, Part IV; Quality of care issues in Health
Sector Reforms; Management Sciences for Health (MSH).
Ngutu B.M, 2001; Urbanisation and Health services delivery in Kenya challenges for the city of
Nairobi; Paper presented at the conference on "Building Healthy Cities: Improving the Health of
Urban Migrants and the urban poor in Africa". Kampala, Uganda July 2nd - 3rd, 2001.
Obonyo B.; 1993; Patients' perception of quality of Healthcare at MOH hospitals, first draft, Nairobi,
Kenya
UNICEF, 1995; The State of the Public Sector Primary Health Care Serv ices District, Sheikhupura.
Punjab, Pakistan: Bamako Initiative Technical Report Series No. 31.
Vanderschueren F, Wegelin E., 1996; Policy Programme options for urban poverty reduction; A
framework for Action at the Municipal Level; UNDP/UNCHS (Habitat) /World Bank, Urban
Management Programme; Washington DC. ; P.24-26.
Wasuna O. and Korir J.. 1997; Public sector efficiency in Kenya; Estimation and Policy
Implications. DP.NO. DP/007/97. Nairobi, Kenya, p.1-2.
Wouters A.. 1991; Essential National Health Research in Developing Countries: Health-Care
Financing and the Quality of Care; International Journal of Health Planning and Management 6 .
p.253-71 .
100

World Health Organization, 1992; The Role of Health Centres in the Development of Urban Health
systems; Report of a WHO study Group on Primary Health Care in Urban Areas, WHO Technical
Report series 827, Geneva.
World Health Organisation, 1994, Report of the W HO working group on Quality Assurance: Geneva
World Health Organisation, 1994; Report of the WHO Hospital Advisory group: Geneva 11-15 April
1994; p.5
Wright C. , Whittington D., 1992; Quality Assurance - An Introduction for Health Care
Professionals; Churchill Livingstone, Medical Division of Longman Group UK Limited; p.9-17,
19,38-40.
101

A.NEX 1
FACILITY INVENTORY CHECKLIST.
Name of facility............................................... Date.
Type 1.Health centre. Catchment population
2. Dispensary
r; Indicator
---------------- -score
0 1 2 Total •/.SCORE
1 General atmosphere poor fair good
a) Appearance o f building/paint
1___ I b)Cleaniines o f facility
c)Grass cut short1) d)GeneraJ mood in facilityj
TOTAL
2 Infrastructure absent present
a)Toilet for clients... — -----~
b)water source
c)Energy/power source
d)Shelter for waiting clients
e)Security/safety o f drugs/supplies
TOTAL
1
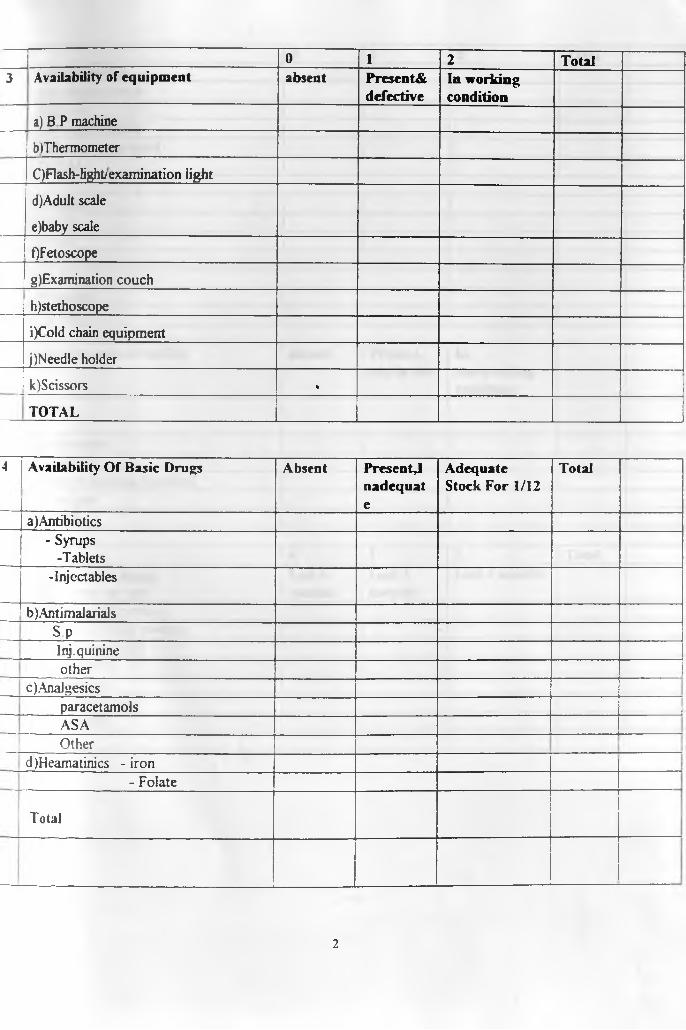
0 1 2 Total3 Availability of equipment absent Presents
defectiveIn working condition
a) B P machine
| blThermometer
C)Flash-light/examination light
d) Adult scale
e) baby scale
OFetoscope
g)Examination couch
h)stethoscope
i)Cold chain equipment
j)Needle holder
k)Scissors •
TOTAL
4 Availability Of Basic Drugs Absent Present^nadequate
Adequate Stock For 1/12
Total
a)Antibiotics- Syrups
-Tablets-Injectables
—b)Antimalarials
s PI nj. quinineother
c) Analgesics__j paracetamols 1
ASAOther
d)Heamatinics - iron- Folate
Total________
2
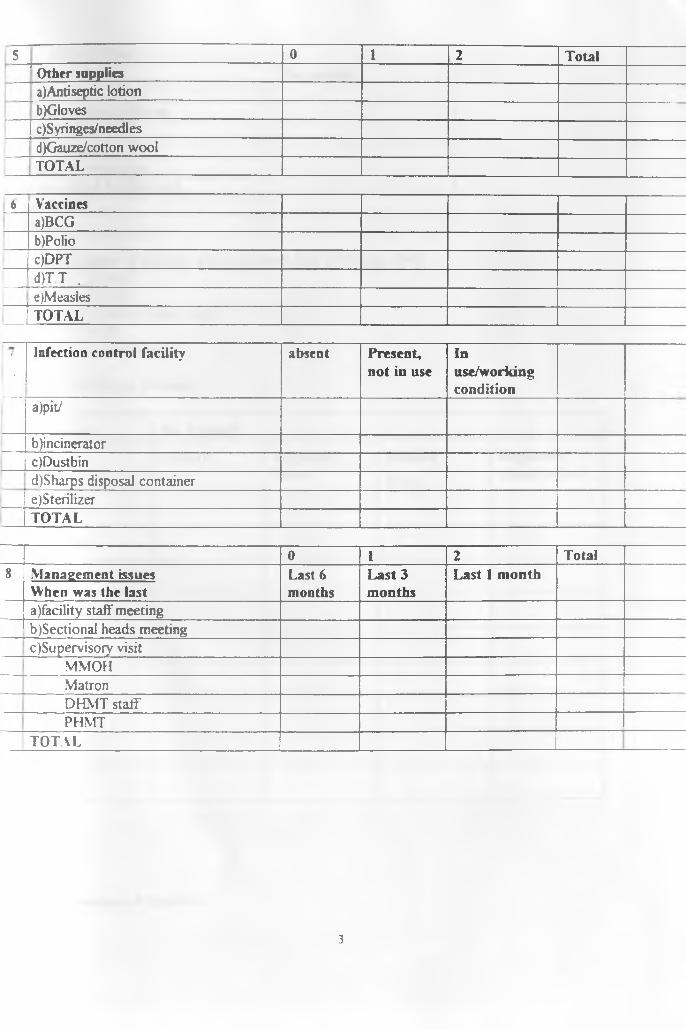
5 0 1 2 Total_̂_________________________________Other suppliesa)Antiseptic lotionb)Gloves
[ c)Syringes/needlesd)Gauze/cotton woolTOTAL
6 Vaccinesa)BCGb)Polioc)DPTd)T T .e)Measles
1 TOTAL
I' Infection control facility absent Present,
not in useInuse/workingcondition
a)pitJ
b)incinerator1c)Dustbin
d)Sharps disposal container1 e)SterilizeriTOTAL
0 I 2 Total8 Management issues
When was the lastLast 6 months
Last 3 months
Last 1 month
a)facility staff meetingb)Sectional heads meetingc)Supervisory visit
MMOHMatronDHMT staff'PHMT
TOTAL
3
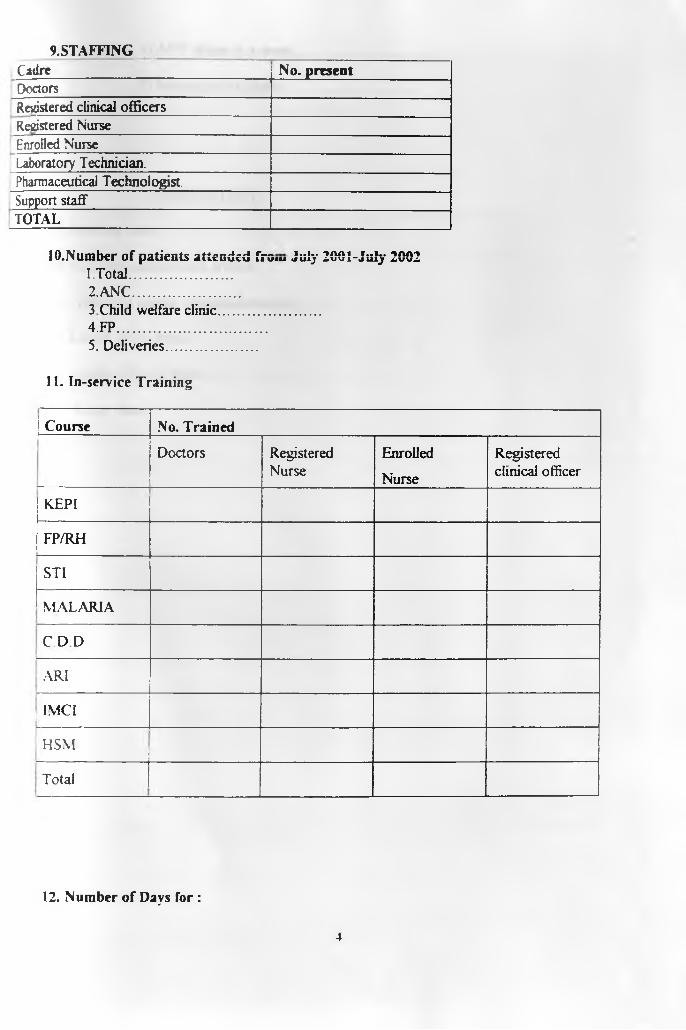
9.STAFFINGCadre No. presentDoctorsRegistered clinical officersRegistered NurseEnrolled NurseLaboratory Technician.Pharmaceutical Technologist.Support staffTOTAL
10.Number of patients attended from July 2001-JuIy 20021. Total..........................2. ANC...........................3 Child welfare clinic.............................4. FP........................................5. Deliveries..........................
11. In-service Training
Course No. Trained
Doctors RegisteredNurse
Enrolled
Nurse
Registered clinical officer
KEPI
FP/RH-
STI
MALARIA
C D D
ARI
; IMCI
HSM
Total__________________________________________
12. Number of Days for :
4

1) ANC clinics in a week
2) Immunization clinics
OBSERVATIONS
13. Opening time........................................
14. Time first patient/client arrived
15. Time first patient was seen/attended
16. Length o f tea break..............................
17. Length o f lunch break.........................
18 Closing time...........................................
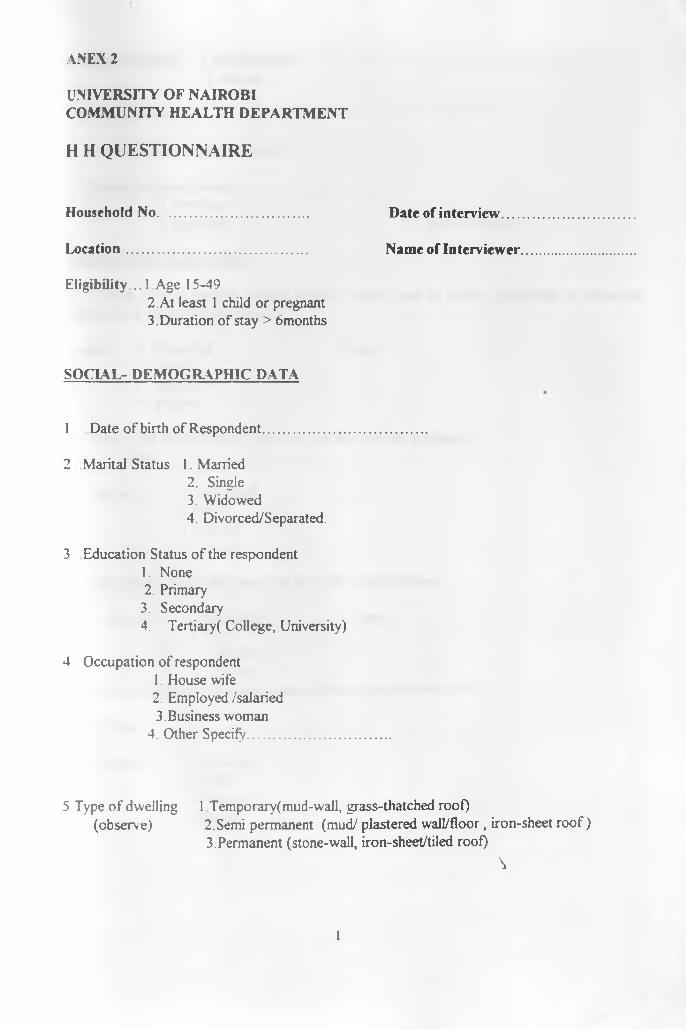
ANEX 2
UNIVERSITY OF NAIROBI COMMUNITY HEALTH DEPARTMENT
H H QUESTIONNAIRE
Household No........................................... Date of interview
Location.................................................... Name of Interviewer
Eligibility .. 1 Age 15-492. At least 1 child or pregnant3. Duration of stay > 6 months
SOCIAL- DEMOGRAPHIC DATA
1 Date o f birth of Respondent.......................
2 Marital Status 1. Married2. Single3. Widowed4. Divorced/Separated.
3 Education Status o f the respondent1. None2. Primary
3. Secondary4. Tertiary( College, University)
4 Occupation of respondent1. House wife2. Employed /salaried3. Business woman
4. Other Specify..........................
5 Type o f dwelling 1 Temporary( mud-wall, grass-thatched roof)(observe) 2 .Semi permanent (mud/ plastered wall/floor, iron-sheet roof)
3 .Permanent (stone-wall, iron-sheet/tiled roof)\
1

6 House ownership 1 Family house2. Rental
7. HousehoId size...................................
8 . No. o f Children under five years...............................
9. Current pregnancy status..............................................1. Pregnant2. Lactating 3. None o f above
FACILfTY UTILISATION
10 Which is your nearest Health Facility (Mark type of facility mentioned in terms o f organization managing it) Agency
Agency 1. Municipal Name.................................................................2. MOH
3. Mission4. private
11 . Where did/ do you attend ANC for the last/ current pregnancyName......................................................
Agency 1. Municipal2. MOH3. Mission4. Private
12. Where didJ do you take your last child for immunizations
Agency 1. Municipal Name...................................................................2. MOH3. Mission
4. Private13. Where did you seek treatment the last time your child was sick?
Nam e............................................................
Agency 1. Municipal2. MOH.3. Mission4. Private
2
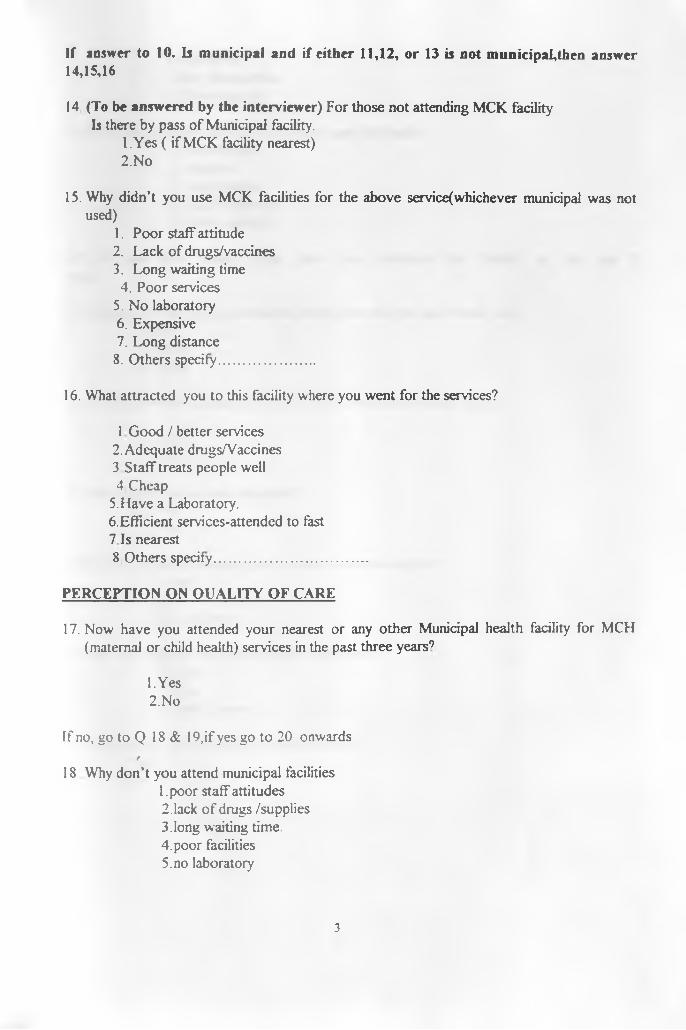
If answer to 10. Is municipal and if either 11,12, or 13 is not municipal,then answer 14,15,16
14 (To be answered by the interviewer) For those not attending MCK facility Is there by pass o f Municipal facility.
1. Yes ( if MCK facility nearest)2 . No
15. Why didn’t you use MCK facilities for the above service(whichever municipal was notused)
1. Poor staff attitude2. Lack o f drugs/vaccines3. Long waiting time4. Poor services
5. No laboratory6 . Expensive7. Long distance
8 . Others specify...........................
16. What attracted you to this facility where you went for the services?
1 Good / better services 2. Adequate drugs/Vaccines3 Staff treats people well4 Cheap
5. Have a Laboratory.6 . Efficient services-attended to fast7 Is nearest8 Others specify............................................
PERCEPTION ON QUALITY OF CARE
17. Now have you attended your nearest or any other Municipal health facility for MCH (maternal or child health) services in the past three years9
1. Yes2. No
If no, go to Q 18 & 19, if yes go to 2 0 onwards/
18 WTiy don’t you attend municipal facilities 1 .poor staff attitudes 2 .lack o f drugs /supplies 3.long waiting time.4 . poor facilities5. no laboratory
3

6. expensive 7.1ong distance/far 8. Others specify
19 How did you know this if you have not used the facility1. from friends.2. relatives3. local leaders4.1 just believe so5. Other specify.....................................
20. If yes how many times have you attended the facility in theyears....................................
21 During your last visit to municipal facility how did the staff handle you?l.Well2 Fairly
3 Poorly
22.Did the provider explain your/ your child’s problem or health status?
1. Yes2. No
23 Did you feel free to ask questions91. Yes2. No
24 Did the provider examine you/your child well/thoroughly?1. Yes2. No3. Don’t know
25. Did you think he/she knows his/her work well?1. Yes2. No
3.Don’t know
26 . Did you get all the drugs prescribed for you?1. Yes2. No
last 2
4

27. If no which drugs were missing l .For malaria2. Vaccines (including T.T)3 For anemia (Iron supplements)4 For pains / Headache5 Antibiotics6 .Others specify.......
28 How would you rate general drug availability in the facility1. Good2. Fair
3. Poor
29 .How long did you wait for services?l.Short/reasonable 2. Too long
3 Don’t know
30. Does the facility open for a reasonable time during the day?
1. Yes2. No
3. Don’t know
31 What is the quality of the building?
1. Good2. Fair3. Poor
32. How can you judge the cleanliness of the facility?1. Clean2. Fairly clean3. Dirty
33 How do you generally rate the overall quality o f service provided at the facility9
1. Good2. Fair
3. Poor
34 What would you like to see improved in the facility?
l .Drug availability 2. Staff attitude
5

3. Waiting time 4.Schedule/hours of service5. Cleanliness6. More staff
7. Laboratory services 8 Don’t know9. Maintenance10 . Others specify............................
3 5 . If you fell sick today which facility would you go to?
Name............................................................................
Agency 1. Municipal 2 GOK3. Mission4. Private
°AS t
6

ANNEX 3.
UNIVERSITY OF NAIROBI COMMUNITY HEALTH DEPARTMENT
EXIT INTERVIEW QUESTIONABLE.
Respondent No.........................
Date of interview. ........................................
Clinic.........................................
1. Date of birth of respondent..............................................
2. MantaJ status 1.Single.2. Married.3. Widowed.4. Divorced/separated
3. Education status 1. None2. Primary.3.Secondary.4. Tertiary.
4. What was the reason for your visit today1. Routine ANC visit2. Immunization for child3. For treatment4. For childs treatment5. Other specify
5 Did the provider examine you /your child welll .Yes. 2. No.
6 FOR ANC MOTHERS
Did he/she do the following examination?
1. Measure weight2. Measure blood pressure3. Examine legs for oedema4. Check eyes for anaemia5. Take height (for first ANC visits).
7 FOR MOTHERS WHO BROUGHT CHILDREN
Did the provider do the following examinations on the child

1. Take the childs temperature2. Take the child's weight3 Check the child's eyes for anemia
8 . Did the provider explain what he/she was doing? l.Yes 2.No
9 Did the provider look competent to handle vou/your chii^
l.Y es 2.No
10 Did he/she try to understand your/your child’s problem
l.Y es 2. No.
11 Did he/she discuss with you your / your child’s problem
l.Yes 2. No
12. Did you feel free to ask questions
l.Yes 2. No13 Did he/she answer your questions satisfactorily^ were you satisfied with the answers given)
l.Y es 2. No
14 Were you satisfied with the sen ice you received from the provider
l.Y es 2. No15 Was there enough privacy in the examination room?
l.Yes~ 2. No
16 Were you treated in a friendly way by the provider?
l.Y es 2.No
17. About how long did you wait between the time you first arrived and the time youwere attended by the provider..............................................
18. Did you feel this waiting was reasonable or too long
1.Reasonable 2. Too long. 3. Don't know'.
19. Obsened waiting time............................................................
20. Were vou given an appointment for follow-up visitl.Y es'' 2. No.

A*vNh\ 4:
UTILISATION OF MCH SERVICES BY FACILITY CATCHMENT AREAS:
Table 1: Utilisation of ANC services by facility catchment
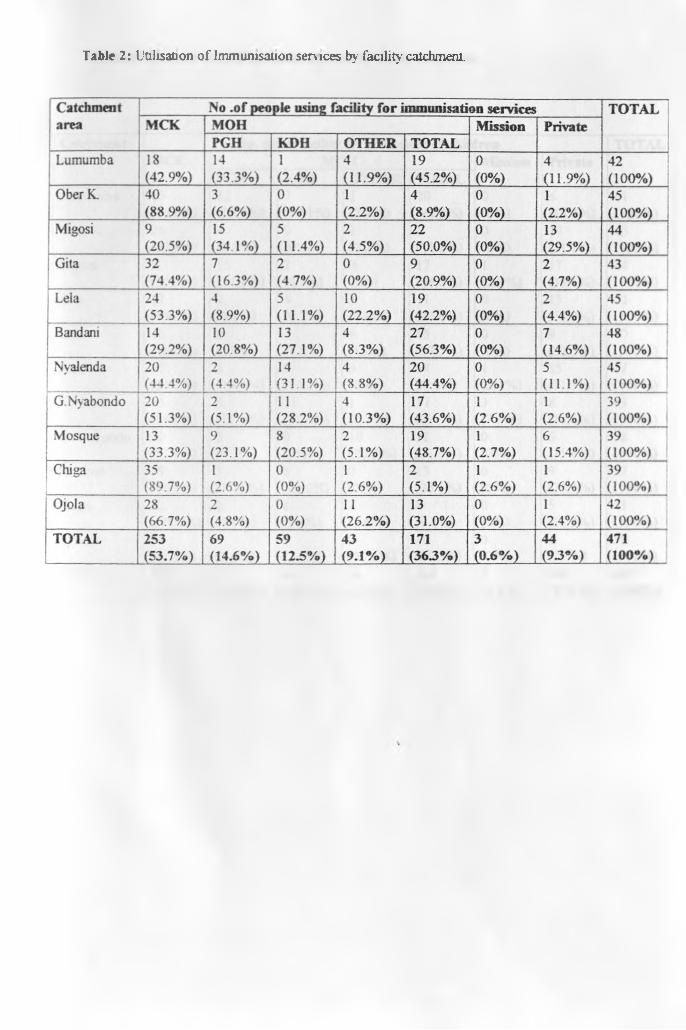
Table 2: Utilisation o f Immunisation services by facility catchment.

T abic 3: Utilisation o f child treatment serv ices by facility catchment

ANNEX 5
RESULTS FROM FACILITY INVENTORY:
GENERAL ATMOSPHERE
INDICATOR NO OF FACILITIES SCORINGPoor Fair Good
Appearance of building 6 4 1Cleanliness o f facility 0 4 7Grass cut short 2 5 4General mood 1 10 0
INFRASTRUCTURE:
INDICATOR NO OF FACILITIES SCORINGAbsent Present Present; working
Toilet for clients T ~ 0 10Water source 5 2 4Energx /p o w er so u rce 8 1 2Shelter for waiting clients 2 0 4Security/safety of drugs 2 0 9
AVAILABILITY OF EQUIPMENT:
INDICATOR NO OF FACILHflES SCORINGAbsent Present/defective Present/workmg
BP machine 8 I 2Thermometer 3 0 8Flash/examinalion light 10 0 1Adult scale 3 1 7Baby scale 1 1 9Fetoscope 0 0 11
j Examination couch 1 1 9Stethoscope 8 2 1Cold chain equip. 2 1 8Needle holder 9 I iScissors 7 0 4
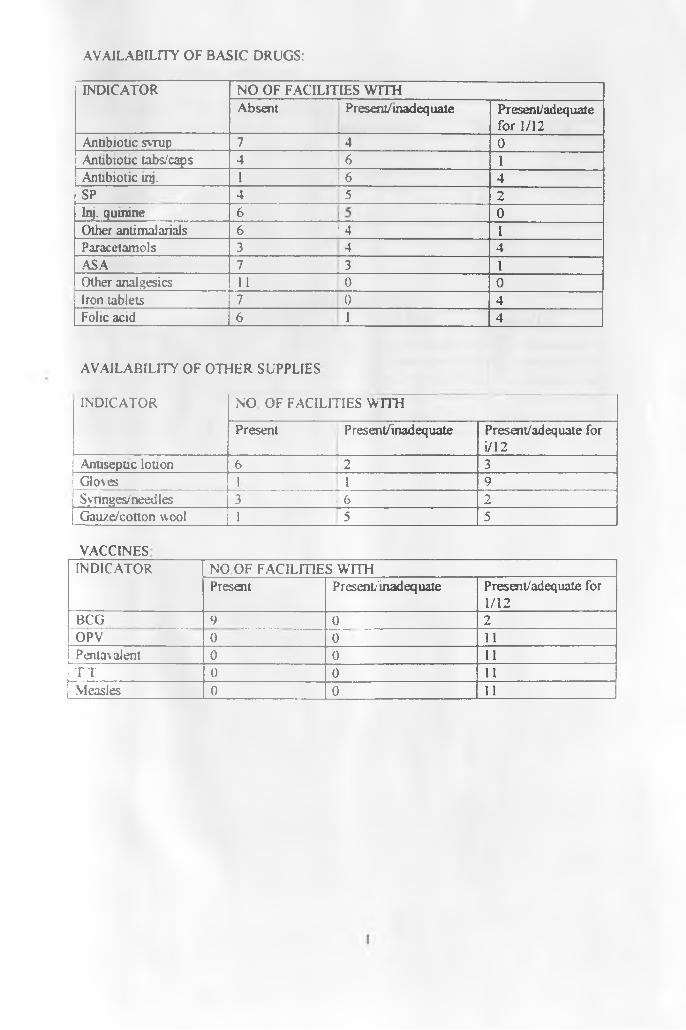
AVAILABILITY OF BASIC DRUGS:
INDICATOR NO OF FACILITIES WITHAbsent Present7 mad equate Present/ adequate
for 1/12Antibiotic syrup 7 4 0Antibiotic tabs/caps 4 6 1Antibiotic inj. 1 T 6 4SP 4 I s 2Inj. quinine 6 0Other antimalarials 6 1 4 1Paracetamols 3 4 4.ASA 7 T 3 HPOther analgesics 11 1 0 0Iron tablets 7 0 4Folic acid 6 1 4
AVAILABILITY OF OTHER SUPPLIES
INDICATOR NO OF FACILITIES WITH
Present | Present/inadequate Present/adequate for i/12
Anuseptic lotion 6 j2 3Go\es 1 HP 9Synnges/needles 3 1 6 2Gauze/cotton wool 1 5 5
VACCINESINDICATOR NO OF FACILITIES WITH
Present P r esent/inad eq uate Present/adequale for 1/12
BCG 9 0 2OPV 0 0 11Penta\alent 0 0 11T T 0 0 11Measles 0 0 11
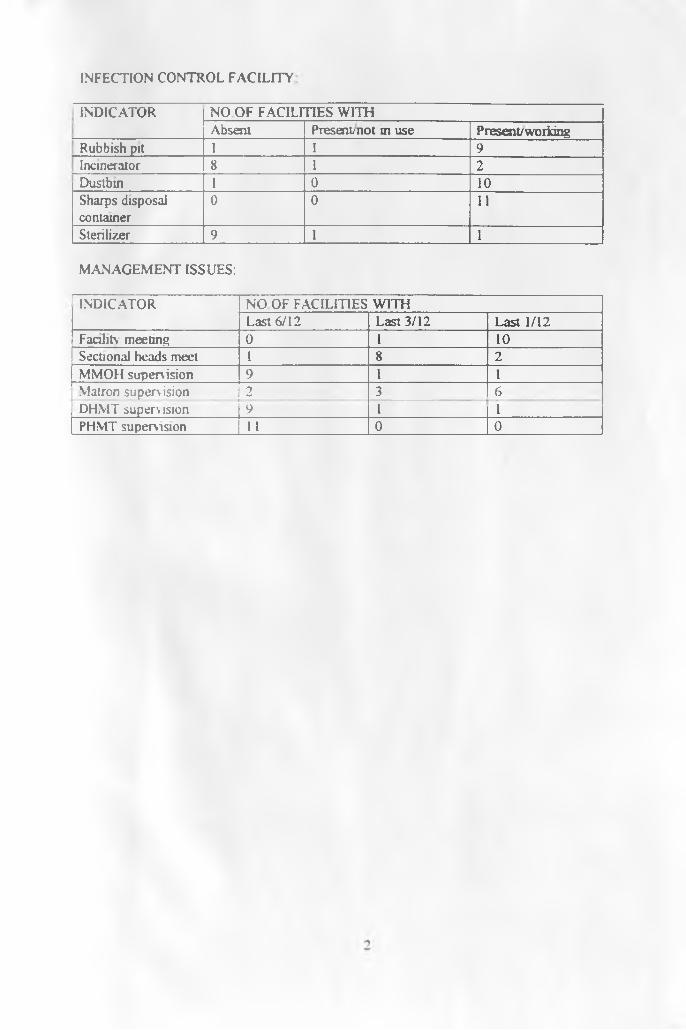
INFECTION CONTROL FACILITY
INDICATOR NO OF FACILITIES WITHAbsent Present; not in use Present/working
Rubbish pit 1 I 9Incinerator |8 1 2Dustbin ~ r 0 10Sharps disposal container
0 0 11
Sterilizer 9 1 1
MANAGEMENT ISSUES:
INDICATOR NO OF FACILITIES WITHLast 6/12 Last 3/12 Last 1/12
Facility meeting 0 1 10Sectional heads meet 1 8 2MMOH supervision 9 1 1Matron supervision 2 3 n r -DHMT supervision 9 1 iPHMT supervision 1 I 0 to -