a catchment scale evaluation of multiple stressor effects...
TRANSCRIPT
General rights Copyright and moral rights for the publications made accessible in the public portal are retained by the authors and/or other copyright owners and it is a condition of accessing publications that users recognise and abide by the legal requirements associated with these rights.
Users may download and print one copy of any publication from the public portal for the purpose of private study or research.
You may not further distribute the material or use it for any profit-making activity or commercial gain
You may freely distribute the URL identifying the publication in the public portal If you believe that this document breaches copyright please contact us providing details, and we will remove access to the work immediately and investigate your claim.
Downloaded from orbit.dtu.dk on: Mar 16, 2019
A catchment scale evaluation of multiple stressor effects in headwater streams
Rasmussen, J. J.; McKnight, Ursula S.; Loinaz, Maria Christina; Thomsen, Nanna Isbak; Olsson, MikaelEmil; Bjerg, Poul Løgstrup; Binning, Philip John; Kronvang, B.Published in:Science of the Total Environment
Link to article, DOI:10.1016/j.scitotenv.2012.10.076
Publication date:2013
Document VersionPeer reviewed version
Link back to DTU Orbit
Citation (APA):Rasmussen, J. J., McKnight, U. S., Loinaz, M. C., Thomsen, N. I., Olsson, M. E., Bjerg, P. L., ... Kronvang, B.(2013). A catchment scale evaluation of multiple stressor effects in headwater streams. Science of the TotalEnvironment, 442, 420-431. DOI: 10.1016/j.scitotenv.2012.10.076
A catchment scale evaluation of multiple stressor effects in headwater streams
Jes J. Rasmussena*, Ursula S. McKnightb, Maria C. Loinazb, Nanna I. Thomsenb, Mikael E.
Olssonb, Poul L. Bjergb, Philip J. Binningb, Brian Kronvanga
a Aarhus University, Department of Bioscience, Vejlsøvej 25, 8600 Silkeborg, Denmark
b Department of Environmental Engineering, Technical University of Denmark, Miljøvej Building 113, 2800 Kgs.
Lyngby, Denmark
*Corresponding author E-mail: [email protected]
Other author E-mail addresses: [email protected]; [email protected]; [email protected]; [email protected];
Abstract
Mitigation activities to improve water quality and quantity in streams as well as stream
management and restoration efforts are conducted in the European Union aiming to improve the
chemical, physical and ecological status of streams. Headwater streams are often characterised by
impairment of hydro-morphological, chemical, and ecological conditions due to multiple
anthropogenic impacts. However, they are generally disregarded as water bodies for mitigation
activities in the European Water Framework Directive despite their importance for supporting a
higher ecological quality in higher order streams.
We studied 11 headwater streams in the Hove catchment in the Copenhagen region. All sites had
substantial physical habitat and water quality impairments due to anthropogenic influence (intensive
agriculture, urban settlements, contaminated sites and low base-flow due to water abstraction
activities in the catchment). We aimed to identify the dominating anthropogenic stressors at the
catchment scale causing ecological impairment of benthic macroinvertebrate communities and
provide a rank-order of importance that could help prioritising mitigation activities. We identified
numerous chemical and hydromorphological impacts of which several were probably causing major
ecological impairment, but we were unable to provide a robust rank-ordering of importance
suggesting that targeted mitigation efforts on single anthropogenic stressors in the catchment are
unlikely to have substantial effects on the ecological quality in these streams.
The SPEcies At Risk (SPEAR) index explained most of the variability in the macroinvertebrate
community structure, and notably, SPEAR index scores were often very low (< 10 % SPEAR
abundance). An extensive re-sampling of a subset of the streams provided evidence that especially
insecticides were probably essential contributors to the overall ecological impairment of these
streams.
Our results suggest that headwater streams should be considered in future management and
mitigation plans. Catchment-based management is necessary because several anthropogenic
stressors exceeded problematic thresholds, suggesting that more holistic approaches should be
preferred.
Key words EU Water Framework Directive, headwater streams, macroinvertebrates, multiple stressors,
anthropogenic stress, agricultural pesticides
1. Introduction
The conversion of land to agriculture and urban settlements are global phenomena that
characterise the general intensification of land use. This intensification is considered one of the
most important drivers for the increasing rate of biodiversity loss and impairment of ecosystem
functions (Matson et al., 1997; MEA, 2005). Surface water ecosystems have been identified as
being particularly vulnerable to these changes, and direct and indirect effects of increasing land use
intensity on their physical condition, water chemistry, and aquatic biota have been extensively
discussed in the literature (e.g. Allan, 2004; Ormerod et al., 2010; Pedersen, 2009). Nevertheless,
human exploitation of water resources and the resultant impairment of freshwater ecosystems
outpace our attempts to mitigate and manage these impacts (Ormerod et al., 2010).
In the European Union (EU), the implementation of the Water Framework Directive (WFD)
obliges member states to obtain “good ecological and chemical status” of surface waters through
improved catchment scale management (River Basin Management Plans, RBMPs). However, the
WFD objectives are only applied to discrete and significant surface water bodies. Due to their small
size, headwater streams (1st and 2nd order) are often not qualified as being significant surface water
bodies and are therefore excluded from the RBMPs. The exclusion of headwater streams in the
WFD is controversial, since (i) a major part of stream networks is low order streams (Freeman et
al., 2007), (ii) due to the tight connection between land and streams in headwater systems, the
majority of diffuse source chemicals enter stream networks in the headwater sections (e.g. Dodds
and Oakes, 2008), (iii) headwater streams add important biodiversity to the overall stream system
because of high habitat diversity (Meyer et al., 2007), and (iv) headwater streams are essential for
the successful dispersal of species among stream networks due to their function as migration
corridors (Freeman et al., 2007; Meyer et al., 2007). Consequently, the management of headwater
streams is crucial for maintaining ecosystem health in higher order streams that are targeted by the
WFD aims.
The management of headwater streams almost always involves multiple and interrelated factors,
with human activities resulting in many different types of environmental impact. For example,
conventional agricultural practices often result in chemical pollution (nutrients and pesticides) and
habitat degradation of streams (channelisation, weed-cutting, dredging and mowing of riparian
vegetation). Moreover, several anthropogenic stressors may act concurrently with differing
intensity; for example chemical pollution may be constituted of agricultural pesticides, macro- and
micronutrients originating from agriculture, pesticides originating from urban area activities and
scattered settlements, petroleum hydrocarbons and chlorinated solvents discharging to streams from
contaminated sites (e.g. industrial sites, old landfills and former gasoline stations), and waste water
treatment. Each of these sources discharges compounds with differing physicochemical properties.
Moreover, the different sources act differently in time, for example diffuse source pollution with
agricultural pesticides is primarily restricted to periods with heavy rainfall during pesticide spraying
seasons, while the compounds discharging into streams from contaminated sites through
groundwater are chronic sources of pollution that are likely to act with the highest intensity during
summer low flow conditions due to a lower dilution factor. The effects of combinations of stressors
often provide unpredictable results compared to what would be expected from the single stressors
alone (Townsend et al., 2008). As a consequence, the studies of complex mixtures of anthropogenic
stressors are challenging, but essential for the improvement of mitigation efforts and management
strategies for these systems.
The need for ecological approaches to disentangle the effects of co-existing anthropogenic
stressors has been urged by several authors (e.g. Beketov and Liess, 2012; Segner, 2011; Statzner
and Bêche, 2010). Equally important is the characterisation of sum effects of stressor combinations.
Due to direct and/or indirect interactions of stressors, the knowledge of single stressor effects is
often not sufficient to provide reliable predictions of multiple stressor effects (Rasmussen et al.,
2012; Townsend et al., 2008). Applying ecological traits of macroinvertebrates has promising
potential as a tool for disentangling effects of different anthropogenic stressors (see review by
Statzner and Bêche, 2010). For example, sediment transport and diffuse source pesticide pollution
has been shown to cause trait changes that may partly overrule effects of other anthropogenic
stressors (e.g. Liess and von der Ohe, 2005; Matthaei et al., 2010; Schäfer et al, 2012a). However,
comprehensive field studies aiming to distinguish the effects of pesticides and groundwater based
contaminants (e.g. chlorinated solvents and petroleum hydrocarbons) from other anthropogenic
stressors are still scarce (but see McKnight et al., 2012; Rasmussen et al., 2012). Moreover, stream
ecosystems that are severely impacted by a multitude of anthropogenic stressors complicate the use
of ecological traits for disentangling multiple-stressor effects, because several stressors may a
priory be expected to cause similar changes in trait categories (Statzner and Bêche, 2010).
Nevertheless, this may often be the scenario that managers of headwater streams will encounter.
We studied 11 headwater streams (1st and 2nd order) in the Hove catchment west of Copenhagen,
Denmark. All streams were subject to multiple stressors of various origins, including contaminated
sites, urban discharges, pesticide pollution from agriculture and habitat degradation. The purpose of
this study was threefold: (1) to identify the main stressors at the catchment scale; (2) evaluate the
total impact on the benthic macroinvertebrate communities, and if possible rank-order the
importance of the dominating stressor types by the use of correlation analyses; (3) give guidance for
prioritising focus areas for mitigation activities in headwater streams at the catchment level. We
used a series of macroinvertebrate metrics for the interpretation of responses in the
macroinvertebrate communities including the trait based metrics: the Danish Stream Fauna Index
(DSFI; directed for organic pollution); the Lotic Invertebrate index for Flow Evaluation (LIFE;
directed for antecedent flow characteristics and substrate types); and the SPEcies At Risk index
(SPEAR; directed for the effects of pesticides).
2. Materials and methods
2.1 Study area
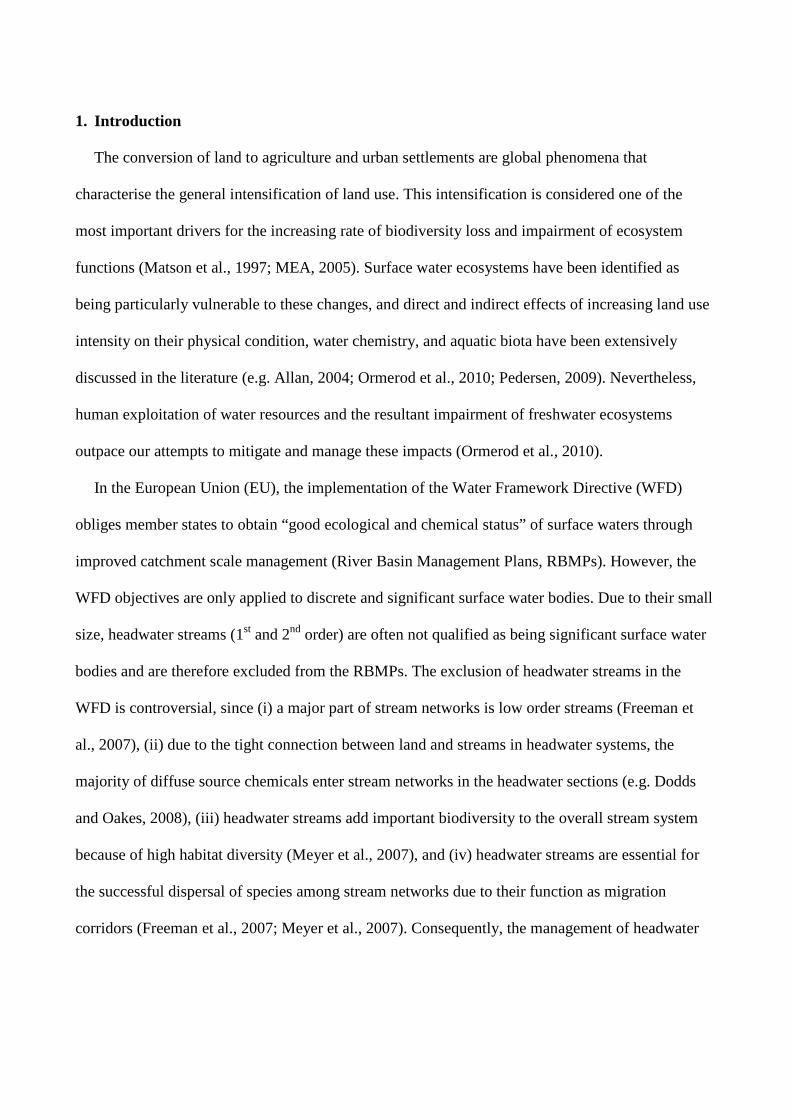
The study catchment (195 km2) is located west of Copenhagen on Sjaelland, Denmark (Fig. 1),
where the catchment is characterised by a low elevation, clayey/loamy soils, a temperate climate
and an average regional precipitation of 500 mm yr-1. The catchment contains two dominant
streams and their tributaries: the Hove stream and the Nybølle stream, the latter of which joins with
the Hove stream in the north-central part of the catchment and eventually flows into Roskilde Fjord.
Approximately 80 % of the total catchment is used for agriculture; the rest is comprised of ca. 15 %
natural area (i.e. forest and wetlands), and 5 % urban area (i.e. settlements and industry). The
dominant arable crop types are wheat and rapeseed, with large portions of the catchment used either
as grassland or left uncultivated. There is significant groundwater abstraction for drinking water
supply at the junction of Hove and Nybølle streams, i.e. along 3rd and 4th order stream sections.
The 11 study stream reaches were identified in order to represent the dominating anthropogenic
stressors in the catchment: contaminated sites, urban discharges and diffuse pollution from
agriculture. For each dominating stressor type, we selected 3-4 streams for the study. Groundwater
abstraction and waste water treatment were present only at one 1st order stream each in the
catchment, and so were not considered further. Specifically, sub-catchments for the study streams
were constructed using ESRI ArcGIS® 9.3, in order to facilitate calculations for the specific land
use percentages potentially influencing each sampling location (Table 1). The sub-catchments were
produced from a soil and groundwater topography map with a 100 m x 100 m resolution and they
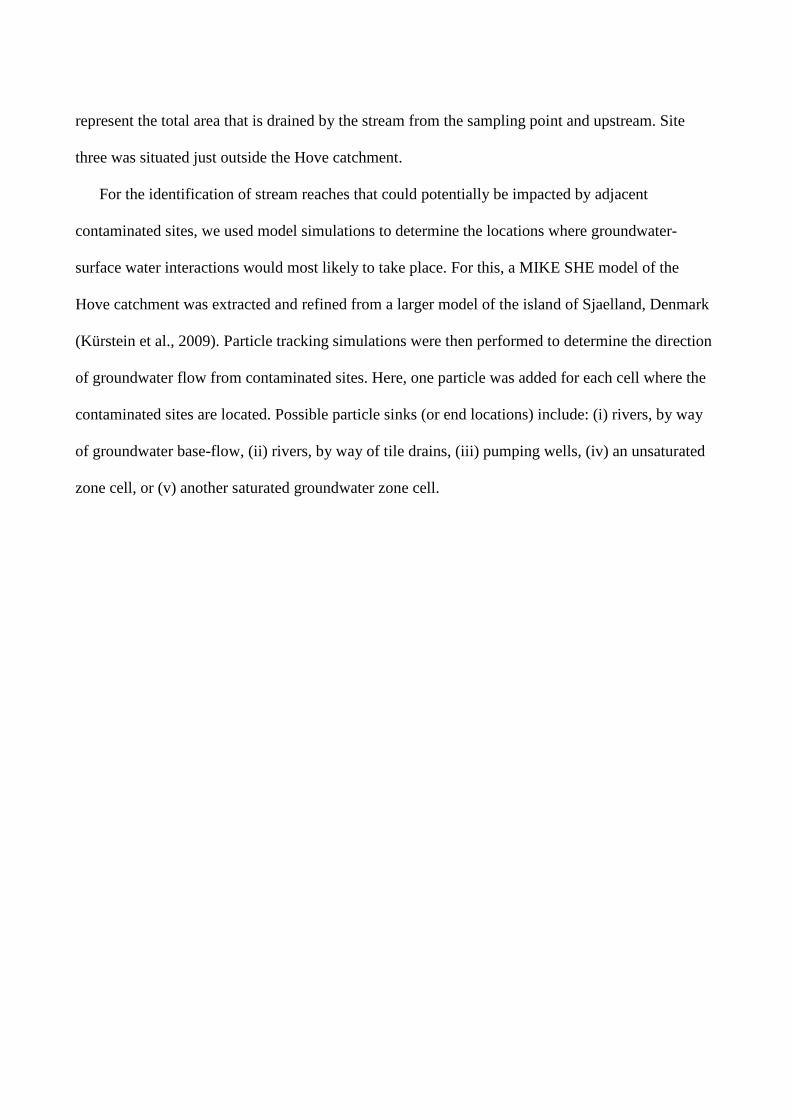
represent the total area that is drained by the stream from the sampling point and upstream. Site
three was situated just outside the Hove catchment.
For the identification of stream reaches that could potentially be impacted by adjacent
contaminated sites, we used model simulations to determine the locations where groundwater-
surface water interactions would most likely to take place. For this, a MIKE SHE model of the
Hove catchment was extracted and refined from a larger model of the island of Sjaelland, Denmark
(Kürstein et al., 2009). Particle tracking simulations were then performed to determine the direction
of groundwater flow from contaminated sites. Here, one particle was added for each cell where the
contaminated sites are located. Possible particle sinks (or end locations) include: (i) rivers, by way
of groundwater base-flow, (ii) rivers, by way of tile drains, (iii) pumping wells, (iv) an unsaturated
zone cell, or (v) another saturated groundwater zone cell.
Figure 1: Overview of the field study area on Zealand, Denmark, including sampling locations (crosses), contaminated sites (circles) and well fields. Also shown is an overview of the sub-catchments (broken lines) draining to each sampling location, as well as the urban and natural areas; areas without color represent agricultural land (including grassland).
2.1.1 Control sites
We searched for control sites with “least disturbed conditions” (Stoddard et al., 2006) in the
study catchment using data from the NOVANA program (the Danish stream monitoring program).
We were, however, unable to find suitable sites and we thus expanded the search to the Copenhagen
region. Available data (general water chemistry, hydromorphology and macroinvertebrate samples)
for the identified sites were extracted from the ODA database (https://oda.dk) (Supplementary
Material, Tables A.3 and C.4). In total, we included six NOVANA sites that qualified as having
“least disturbed conditions”, considered by McKnight et al. (2012) for a nearby catchment. Consult
McKnight et al. (2012) for selection criteria and sampling details.
2.2 Overall water sampling strategy and study set-up
In 2010, we conducted stream water chemistry sampling using different techniques and at
different times in order to capture the expected maximum concentrations of chemicals from the
identified potential anthropogenic sources in the 11 study streams (Fig. 1). Diffuse source pesticides
were sampled with event-triggered water samplers (Liess and von der Ohe, 2005) during May-June;
groundwater inflow of pesticides, chlorinated solvents and petroleum hydrocarbons were sampled
manually in August during base-flow conditions. General water chemistry parameters were
collected twice using manual grab sampling. Groundwater contaminants were one main focus area
in the 2010 field campaign, and the selected list of pesticides for analysis was therefore restricted to
water soluble compounds with long half-lives (only herbicides and degradation products of
herbicides) (Table 2). Due to the comprehensive detections of currently used pesticides and
historically low SPEAR values (see the Results section), we conducted a follow-up field campaign
in 2011. Sites that were characterised by summer drought in 2010 or dissolved oxygen
concentration < 4 mg L-1 were excluded. In 2011, we additionally sampled two of the control
streams with the same sampling program as in 2010, but using the extended list of pesticide
analyses for the event-triggered water samples. Moreover, we deployed passive in situ suspended
particle samplers (SPS) for the detection of the most lipophilic pesticides. Due to limited quantity of
sampling equipment, the SPS samplers were only deployed in the three streams with highest sum
concentrations of pesticides during storm flow. Below, the sampling methods are described in
detail.
2.2.1 General water chemistry
The biological oxygen demand (BOD5) and micro- and macro-nutrient concentrations were
measured in June and August, 2010. Conductivity, oxygen concentrations and pH were measured
before collecting water samples for water chemistry. Water samples for cation were analysed
according to the methods given in Milosevic et al. (2012). The general water chemistry is
summarised in Table 3 and is furthermore provided in full detail (i.e. per sampling location) in
Supplementary Material, Table A.2.
2.2.2 Pesticide sampling
Pesticides were sampled with two different sampling strategies in 2010; event-triggered
samplers (May and June) (Liess and von der Ohe, 2005) and grab sampling (August) to differentiate
between the compounds that are transported to streams via surface runoff and flow through tile
drains during heavy precipitation events, and the compounds that mainly originate from
groundwater inflow, respectively.
During May and June, 2010, two precipitation episodes triggered the sampling system in some
or all study streams on the 15th and the 30th of May. The precipitation depths were 17.5 mm and 13
mm, respectively.
In 2011, a subset of the streams (sites 2, 3, 5, 6 and 7) were re-sampled during May and June
using event-triggered water samplers. Additionally, we deployed event-triggered sampling systems
in two of the control streams (C1 and C2). In 2011, the sampling systems were triggered twice on
May 22nd and June 8th, where the precipitation depths were 11 mm and 12 mm, respectively.
Furthermore, we collected suspended particles samples with a suspended particle sampler in three
of the study streams (Sites 3, 6 and 7) (Laubel et al., 2001).
The selection of analysed pesticides for the 2010 field campaign was based on application
frequency and total applied amounts in 2009 (Danish EPA, 2010). This list was augmented with a
series of banned pesticides that have been previously found in groundwater monitoring surveys
(Malaguerra et al., 2012). In total, the water samples were analysed for 27 different herbicides
(Table 2). The selection of analysed pesticides for the water samples collected in 2011 was further
augmented with 4 fungicides and 4 insecticides. Moreover, the suspended sediment samples
additionally collected in 2011 were analysed for a selected list of particularly lipophilic insecticides,
fungicides and herbicides (Table 2).
Pesticide analyses for the event-triggered samplers and grab sampling were conducted by
Eurofins Miljoe A/S Laboratories, and the suspended particle samples were analysed at the Swedish
University of Agriculture (Uppsala, Sweden). Analyses of all the samples were based on solid phase
extraction, and the final extracts were analysed by GC–MS or LC–MS. The minimum detection
limit was 0.01 μg L−1 for all pesticide compounds in water samples and 1 ng g−1 for particles (dry
weight).
2.2.3 Sampling for xenobiotics
Samples for benzene, toluene, ethylbenzene, m-/p- and o-xylene (BTEX), naphthalene, and the
chlorinated solvents PCE, TCE, trans- and cis-1,2-DCE, 1,1-DCE, 1,1-DCA and 1,1,1-TCA, were
collected at all 11 sampling locations at base-flow conditions. The sampling locations at the
contaminated sites (sites 7 - 11, Fig. 1) were placed in the expected groundwater to surface water
discharge zones for the contaminated site, as determined by additional up-gradient and down-
gradient sampling (data not shown). Samples were collected in 40 mL glass vials and immediately
preserved using 4 M H2SO4 and stored at 4 °C. The analytes were separated and identified by
GC/MS using an Agilent 7980 gas chromatograph system equipped with an Agilent 5975 C
electron impact (70 eV) triple-axis mass-selective detector. Detection and quantification limits were
determined as described by Winslow et al. (2006), and are given in McKnight et al. (2012).
2.3 Hydromorphology
A habitat survey was conducted on a 50 metre reach in each of the study streams spanning the
sites for macroinvertebrate sampling and physicochemical measurements. The characterisation of
the physical stream dimensions and habitat properties was performed according to the Danish
Habitat Quality Index (DHQI) (Pedersen et al., 2006). The DHQI ranks the physical habitat quality
from -12 to 63 using a series of hydromorphological and riparian parameters, and the threshold
level for good physical conditions is 26 (Dunbar et al., 2010a). Discharge was quantified using four
current velocity measurements (using a Höentzsch µP-TAD flow-meter) across each of five
transects.
2.4 Macroinvertebrate sampling and metrics
Benthic macroinvertebrates were sampled in May 2010 in all study streams, and again in early
May and late June in 2011 in a subset of the study streams (sites 2, 3, 5, 6 and 7). Moreover,
macroinvertebrates were sampled at two control sites (C1 and C2) in early May and late June, 2011.
All macroinvertebrate sampling was conducted using a standardized kick-sampling procedure (25
cm x 25 cm net with 0.5 mm mesh size) (Skriver et al., 2000). The samples were preserved in 96%
ethanol in the field. Macroinvertebrates were identified to the species or genus level with only few
exceptions (Oigochaeta (order), Chironomidae (sub-family), Ostracoda (order), Heteroptera
(family) and Simuliidae (family)) (see Supplementary Material, Tables C1-C4, for the complete
species lists).
We used a series of macroinvertebrate community descriptors for the interpretation of response
in the macroinvertebrate communities, including total species richness, total macroinvertebrate
abundance, species richness and densities of Ephemeroptera, Plecoptera and Trichoptera (EPT) and
Simpson diversity. Moreover, we applied the Danish Stream Fauna Index (DSFI; currently the only
ecological quality assessment method for running waters in Denmark), which is directed at
detecting the effects of organic pollution (e.g. high BOD5 concentrations or high concentrations of
macro-nutrients, especially ammonia-N) (Skriver et al., 2000). The Lotic Invertebrate index for
Flow Evaluation (LIFE) was used to relate the macroinvertebrate community to antecedent flow
characteristics of each site (Extence et al., 1999). Each taxon is assigned to a flow group (ranging
from I to VI) indicating its preference for higher current velocities and clean coarse substrate types.
The LIFE score for one sample is calculated as the mean flow score for all taxa scored in the
sample. The SPEcies At Risk index was used to relate the macroinvertebrate community to the toxic
loads from pesticides. The SPEAR index aims at detecting impacts of diffuse source pesticide
pollution by applying physiological and ecological traits (Liess and von der Ohe, 2005).
2.5 Data treatment
We applied toxic units (TU) as a measure for the toxicity of xenobiotic compounds and
pesticides to benthic macroinvertebrates (using Daphnia magna as a surrogate species). The TU
was calculated for all compounds according to Tomlin (2000):
log TUD.magna = log (Ci / LC50i) (1)
where log TUD.magna is the log toxic unit for compound i, Ci is the measured concentration of
compound i and LC50i is the corresponding 48 h LC50 value for Daphnia magna exposed to
compound i. The log maximum TUD.magna (log max TUD.magna) and the log summed TUD.magna (log
sum TUD.magna) were calculated for all samples (Supplementary Material, Tables B.3-B.5). The
summation of all TUs is based on the principle of toxic additivity, i.e. an increase in the number of
mixture components has been suggested to lead to a decrease in the range of deviation from toxic
additivity (the Funnel hypothesis) (Warne and Hawker, 1995). For log max TUD.magna the suggested
threshold for effects of pesticides in the field is at least -3 (Schäfer et al., 2012b).
For interpretation of the potential toxicity of the pesticides detected in the suspended particle
sampler, the log max TUD.magna and the log sum TUD.magna were calculated. For these calculations, it
is thought to be necessary to account for the potential reduction in toxicity that is a result of the
sorption to (especially organic) micro-particles. The reduction in toxicity for pesticides that are
sorbed to particles is proposed to be within the range of 100 to 600 (e.g. Ding et al., 2011; Maund et
al., 2002; Yang et al., 2006b). We therefore calculated the log max TUD.magna and the log sum
TUD.magna using this range for safety factors (Supplementary Material, Table B.6).
We derived eight response variables from the macroinvertebrate community data; taxonomic
richness, total macroinvertebrate abundance, EPT abundance, Simpson diversity, DSFI scores,
LIFE scores and %SPEARpesticides abundance. Moreover, a Detrended Correspondence Analysis
(DCA) of the macroinvertebrate community composition abundance data was used to reduce the
species abundance matrix of the aquatic macroinvertebrate community from the 11 sites to two
orthogonal axes for use as additional response variables in later analyses. We down-weighted rare
species and removed all taxa that only occurred in one sample in order to improve the signal of the
most overall trends. We performed Pearson correlations between the DCA axis scores and the
macroinvertebrate metrics for each sample in order to evaluate the amount of variability in the
macroinvertebrate communities that was explained by the used macroinvertebrate metrics. The EPT
abundance and the LIFE scores were log transformed before analysis in order to meet assumptions
of normality. The DCA analysis was performed in PC-ORD 6.0, and the Pearson correlations were
performed in SAS Enterprise Guide 4.3.
While the sub-catchments were selected so that they each ideally contained one particular type of
anthropogenic stress (conventional agriculture, urban settlements and contaminated sites), the
results from the DCA and a cluster analysis (performed in PC-ORD 6.0, data not shown) showed
that the macroinvertebrate community structure did not group according to the type of
anthropogenic stress in the sub-catchment. In the further statistical analyses we therefore treated the
study sites as one group.
A Principal Component Analysis (PCA) was performed to reduce 30 environmental parameters
from each site to three orthogonal axes. This was done because the stream environment is a product
of all environmental parameters acting in concert, and it is therefore more meaningful to provide an
integrated measure of them all. Pairwise co-linearity (r > 0.9) was assessed prior to the analysis in
order to remove correlated parameters, and substrate characteristics were collapsed into one group
(proportion of soft substrate; consisting of sand and silt). Thus, the PCA was performed on 21
environmental variables. In order to interpret statistically significant contributions (α < 0.05) of the
different measured environmental parameters to the three PCA axes, we performed a Spearman
rank correlation on PCA axis scores and environmental variables. The Spearman rank test was
preferred since the majority of environmental data did not meet the criteria for normality, and
common data transformations (log, inverse, square root and inverse square root) did not provide
normally distributed data. The PCA analysis was performed in PC-ORD 6.0, and the subsequent
Spearman rank test was performed in SAS Enterprise Guide 4.3. Moreover, we performed a
Spearman rank correlation analysis on the macroinvertebrate metrics (including DCA axis scores
for the first two axes of the DCA) and the set of environmental variables (including PCA axis
scores for the first three axes of the PCA) in SAS Enterprise Guide 4.3.
An additional (multivariate) interpretation of the macroinvertebrate taxa and their relationship to
the measured environmental variables was conducted using a Canonical Correspondence Analysis
(CCA) in PC-ORD 6.0. The CCA analysis was chosen for analysing the combined species-
environment dataset, since we aimed to determine whether some proportion of the community
structure is more strongly related to one environmental variable than expected by chance (ter Braak
and Prentice, 1988). Since the interpretation of results from a CCA becomes increasingly dubious
when the number of environmental variables increases relative to the number of observations (here,
n = 11), we only included the axis scores for the three PCA axes as environmental variables in this
analysis. This is meaningful because the PCA axes incorporate some proportion of all measured
environmental variables. We used a Monte Carlo test (999 permutations) for the CCA to test for
linear relationships between the two matrices (α = 0.05).
We compared the relation between the log mTUD.magna for water and suspended particle samples
taken in 2011 and the %SPEARpesticides abundance with the relation obtained in a previous study in
northern Germany (for stream sites without upstream forested sections) with similar geological and
climatic conditions (Liess and von der Ohe, 2005). We performed this comparison by calculating
the differences in Euclidean distances (difference between measured and predicted %SPEARpesticides
abundance using the regression line from the study of Liess and von der Ohe, 2005 as a prediction
tool) for the log mTUs obtained from water samples and suspended particle samples. The average
Euclidean distances using water samples and suspended particle samples were subsequently
compared with a t-test (α = 0.05), and the tested data fulfilled the requirements for normality and
equal variances (α = 0.05).
The control sites were not included in any of the statistical analyses, as the control sites and the
study sites constitute two clusters of sites that have only a very limited overlap in terms of
hydromorphological properties and water chemistry. Therefore, these clusters mainly constitute the
two extremes on the summed environmental gradients and thus do not provide much information on
biotic responses in between the environmental extremes. We therefore only interpreted the more
restricted summed environmental gradients among the study sites, and the control sites were mainly
included as evidence for an existing colonisation pool of sensitive species in the region.
3. Results
3.1 Characterisation of environmental stressors
In general, the study streams were characterised by being channelised and with grass dominating
riparian vegetation, poor habitat conditions with the dominating substrate type being silt (73%) and
sand (11%) and the DHQI score showing generally bad physical conditions (average DHQI = 9.8)
(Table 3). The streams were characterised by moderate to high organic pollution (BOD5 > 2 mg L-1)
detected at least once in each of the study streams in June and August, 2010. Moreover, oxygen
concentrations were often low (< 5-6 mg L-1), and ammonium and total P concentrations were
moderate to high (Table3).
The results of the field campaigns in 2010 and 2011 disclosed a total of 21 herbicides, 5
fungicides and 2 insecticides (Table 4). Twenty of the herbicides and three fungicides were detected
in stream water, whereas two herbicides, two fungicides and two insecticides were detected in the
suspended particle samplers (n = 3). Presently banned pesticides were detected in storm-flow water
as well as base-flow water, whereas currently used pesticides were mainly detected in storm-flow
water and suspended sediment samples. In total, 7 of the 33 EU priority pollutants were detected,
including atrazine, diuron, isoproturon, simazine, hexachlorobenzene, chlorpyriphos and gamma-
hexachlorocyclohexane (lindane). The number of pesticides found per stream site ranged from 5 to
14 for storm-flow water, and from 1 to 10 for base-flow water. Notably, 4 to 5 herbicides were also
detected at the control sites, sampled in 2011.
Converting pesticide concentrations to TU (Supplementary Material, Tables B.1-3), we found
that the obtained log mTUD.magna were comparatively similar during storm-flow and base-flow in
2010 (water samples only analysed for herbicides), whereas the log mTUD.magna were several orders
of magnitude higher when the insecticide chlorpyrifos was detected in the particle sampler
(Supplementary Material, Table B.4). In fact, all log mTUD.magna values for the particle samples
were above -3, regardless of the factor value applied.
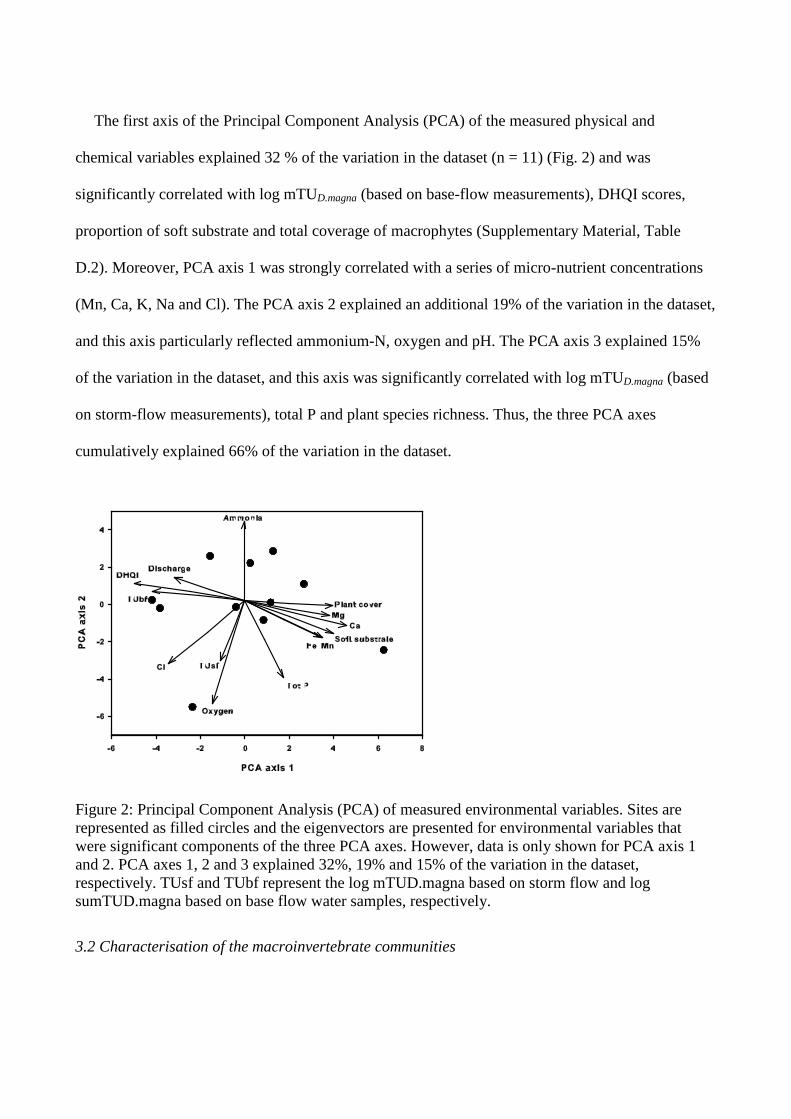
The first axis of the Principal Component Analysis (PCA) of the measured physical and
chemical variables explained 32 % of the variation in the dataset (n = 11) (Fig. 2) and was
significantly correlated with log mTUD.magna (based on base-flow measurements), DHQI scores,
proportion of soft substrate and total coverage of macrophytes (Supplementary Material, Table
D.2). Moreover, PCA axis 1 was strongly correlated with a series of micro-nutrient concentrations
(Mn, Ca, K, Na and Cl). The PCA axis 2 explained an additional 19% of the variation in the dataset,
and this axis particularly reflected ammonium-N, oxygen and pH. The PCA axis 3 explained 15%
of the variation in the dataset, and this axis was significantly correlated with log mTUD.magna (based
on storm-flow measurements), total P and plant species richness. Thus, the three PCA axes
cumulatively explained 66% of the variation in the dataset.
Figure 2: Principal Component Analysis (PCA) of measured environmental variables. Sites are represented as filled circles and the eigenvectors are presented for environmental variables that were significant components of the three PCA axes. However, data is only shown for PCA axis 1 and 2. PCA axes 1, 2 and 3 explained 32%, 19% and 15% of the variation in the dataset, respectively. TUsf and TUbf represent the log mTUD.magna based on storm flow and log sumTUD.magna based on base flow water samples, respectively.
3.2 Characterisation of the macroinvertebrate communities
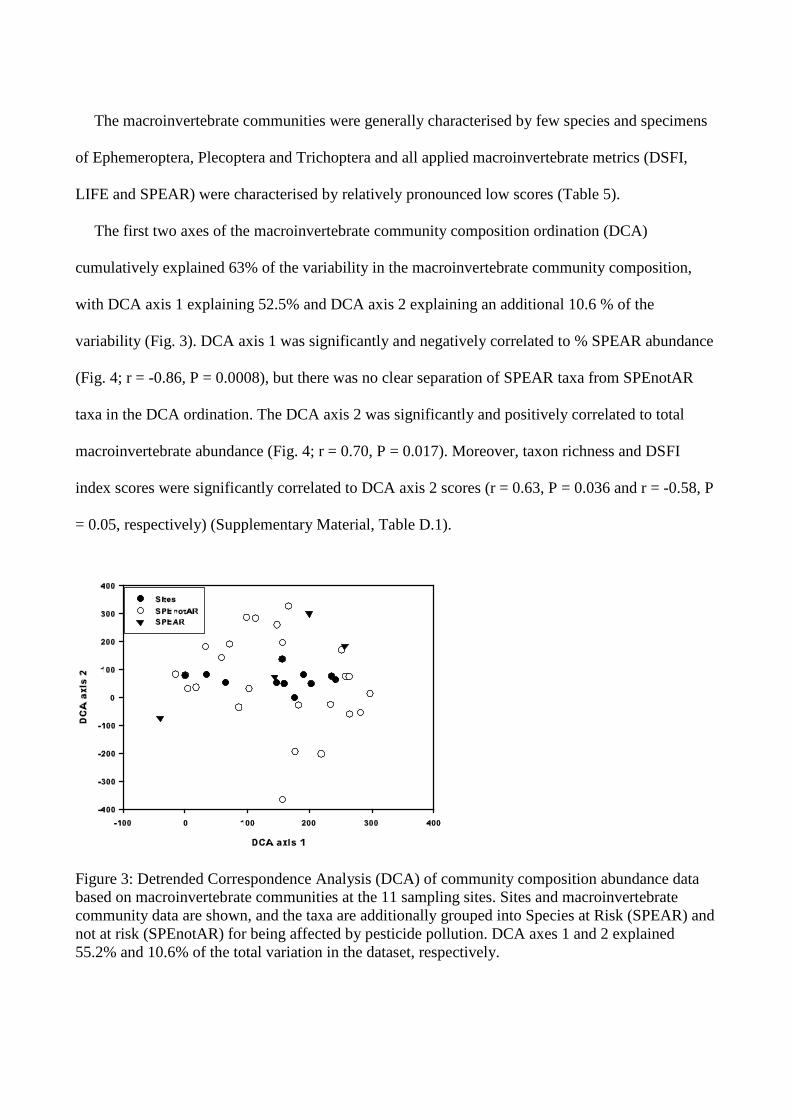
The macroinvertebrate communities were generally characterised by few species and specimens
of Ephemeroptera, Plecoptera and Trichoptera and all applied macroinvertebrate metrics (DSFI,
LIFE and SPEAR) were characterised by relatively pronounced low scores (Table 5).
The first two axes of the macroinvertebrate community composition ordination (DCA)
cumulatively explained 63% of the variability in the macroinvertebrate community composition,
with DCA axis 1 explaining 52.5% and DCA axis 2 explaining an additional 10.6 % of the
variability (Fig. 3). DCA axis 1 was significantly and negatively correlated to % SPEAR abundance
(Fig. 4; r = -0.86, P = 0.0008), but there was no clear separation of SPEAR taxa from SPEnotAR
taxa in the DCA ordination. The DCA axis 2 was significantly and positively correlated to total
macroinvertebrate abundance (Fig. 4; r = 0.70, P = 0.017). Moreover, taxon richness and DSFI
index scores were significantly correlated to DCA axis 2 scores (r = 0.63, P = 0.036 and r = -0.58, P
= 0.05, respectively) (Supplementary Material, Table D.1).
Figure 3: Detrended Correspondence Analysis (DCA) of community composition abundance data based on macroinvertebrate communities at the 11 sampling sites. Sites and macroinvertebrate community data are shown, and the taxa are additionally grouped into Species at Risk (SPEAR) and not at risk (SPEnotAR) for being affected by pesticide pollution. DCA axes 1 and 2 explained 55.2% and 10.6% of the total variation in the dataset, respectively.
3.3 Linking macroinvertebrate communities and environmental stressors
From the correlation matrix, presenting Spearman rank correlation coefficients on the correlation
strengths between macroinvertebrate metrics and environmental parameters (Supplementary
Material, Table D.3), it is seen that the flow-based LIFE index scores significantly decrease with
increasing proportions of silt and macrophytes coverage, increasing axis scores of PCA 1 (primarily
representing habitat quality with negative axis scores representing high habitat quality) and
increasing concentrations of Mn. Moreover, LIFE index scores increased with increasing log
sumTUD.magna for base-flow conditions, Nitrate-N and chloride concentrations. Increasing axis
scores for PCA axis 2 (high values represent high concentrations of ammonium-N, low pH and low
oxygen concentrations) correspond to significantly decreasing % SPEARpesticides abundance. DCA
axis 1 (primarily representing % SPEARpesticides abundance) was not significantly correlated with
any environmental variables. Axis scores for DCA axis 2 (high values indicate low DSFI score and
high abundance and taxa richness) were negatively correlated with axis scores for PCA axis 3 (high
values represent high log mTUD.magna during storm-flow, high total-P concentrations and low plant
species richness).
In the Canonical Correspondence Analysis (CCA) of the macroinvertebrate species and axis
scores of the three PCA axes representing all measured environmental variables, the total inertia
was 1.328 and the proportion of variability explained was 20.0 % for CCA axis 1 and 8.4 % for
CCA axis 2 (Fig. 5). The eigenvalue of the first axis was 0.265, and for the second axis 0.112
(Table 6). Several taxa that do not have strong requirements for well-mixed water and high current
velocities are clustered to the right of the CCA ordination. In contrast, most of the taxa in the
dataset that have specific requirements for moving and well-mixed water (Baetis rhodani,
Limoniidae (e.g. Eriopterinae and Dicranota sp.) and to some extent Gammarus pulex) are clustered
to the left of the ordination. This clustering is also reflected by eigenvectors for the strongest
environmental variables where the right part of the ordination is positively correlated with PCA axis
1 (reflecting high proportions of soft substrate and plant coverage) and PCA axis 2 (reflecting low
oxygen concentrations). We cannot, however, reject the hypothesis of no relationship between the
macroinvertebrate community matrix and the environmental variables matrix (P = 0.448; Table 6).
The two different sampling techniques for pesticides, used in 2011 (event-triggered water
sampling and suspended particle samplers), clearly provided different results in terms of estimated
toxicity to benthic macroinvertebrates (log TUD.magna) (Fig. 6). In order to determine which
sampling technique provides the better estimate for toxic impact on the benthic macroinvertebrates
(%SPEARpesticides abundance), we compared the average Euclidean distance from measured data
points to predicted data points (the relation between log mTUD.magna and %SPEARpesticides abundance
previously established for streams without upstream forested sections in northern Germany (Liess
and von der Ohe, 2005). The average Euclidean distance between predicted and measured data
points was significantly higher when using the log mTUD.magna based on event-triggered water
samplers compared to the log mTUD.magna based on suspended particle samplers (df = 6, t = 5.06, P
= 0.002). In other words, the high log mTUD.magna that was thought to cause the low
%SPEARpesticides abundance was detected only when using suspended particle samplers and not
when using event-triggered water samplers.
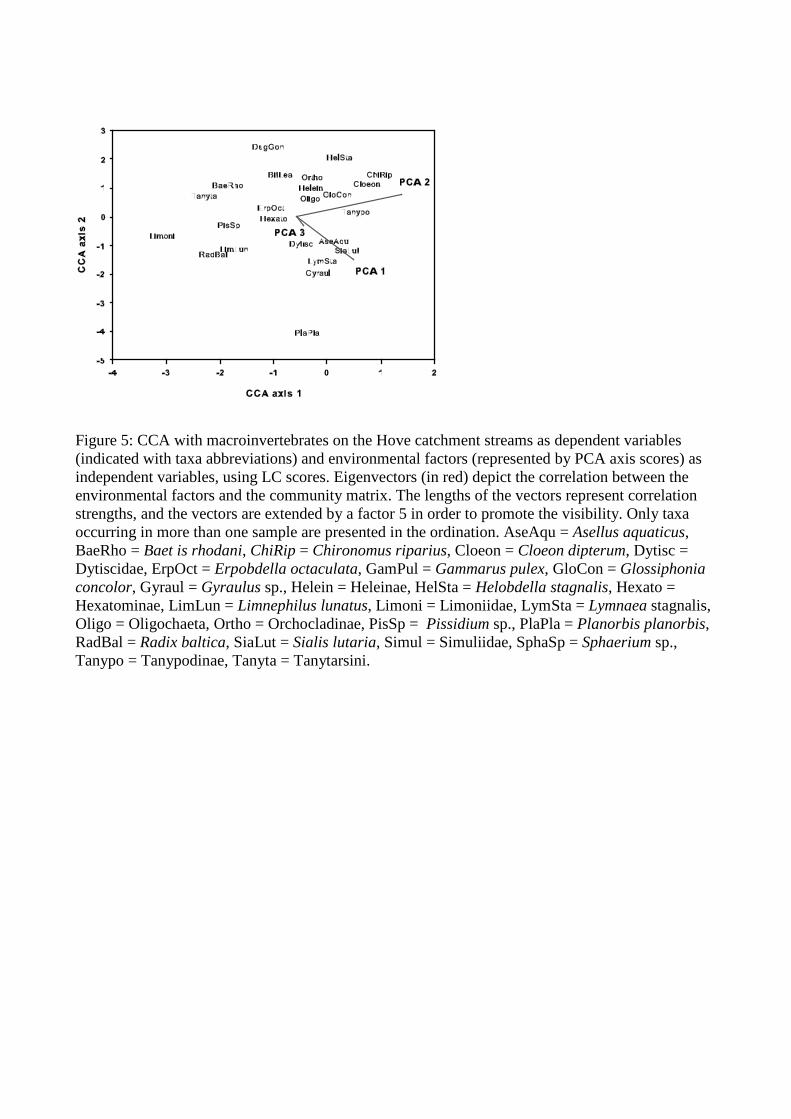
Figure 5: CCA with macroinvertebrates on the Hove catchment streams as dependent variables (indicated with taxa abbreviations) and environmental factors (represented by PCA axis scores) as independent variables, using LC scores. Eigenvectors (in red) depict the correlation between the environmental factors and the community matrix. The lengths of the vectors represent correlation strengths, and the vectors are extended by a factor 5 in order to promote the visibility. Only taxa occurring in more than one sample are presented in the ordination. AseAqu = Asellus aquaticus, BaeRho = Baet is rhodani, ChiRip = Chironomus riparius, Cloeon = Cloeon dipterum, Dytisc = Dytiscidae, ErpOct = Erpobdella octaculata, GamPul = Gammarus pulex, GloCon = Glossiphonia concolor, Gyraul = Gyraulus sp., Helein = Heleinae, HelSta = Helobdella stagnalis, Hexato = Hexatominae, LimLun = Limnephilus lunatus, Limoni = Limoniidae, LymSta = Lymnaea stagnalis, Oligo = Oligochaeta, Ortho = Orchocladinae, PisSp = Pissidium sp., PlaPla = Planorbis planorbis, RadBal = Radix baltica, SiaLut = Sialis lutaria, Simul = Simuliidae, SphaSp = Sphaerium sp., Tanypo = Tanypodinae, Tanyta = Tanytarsini.
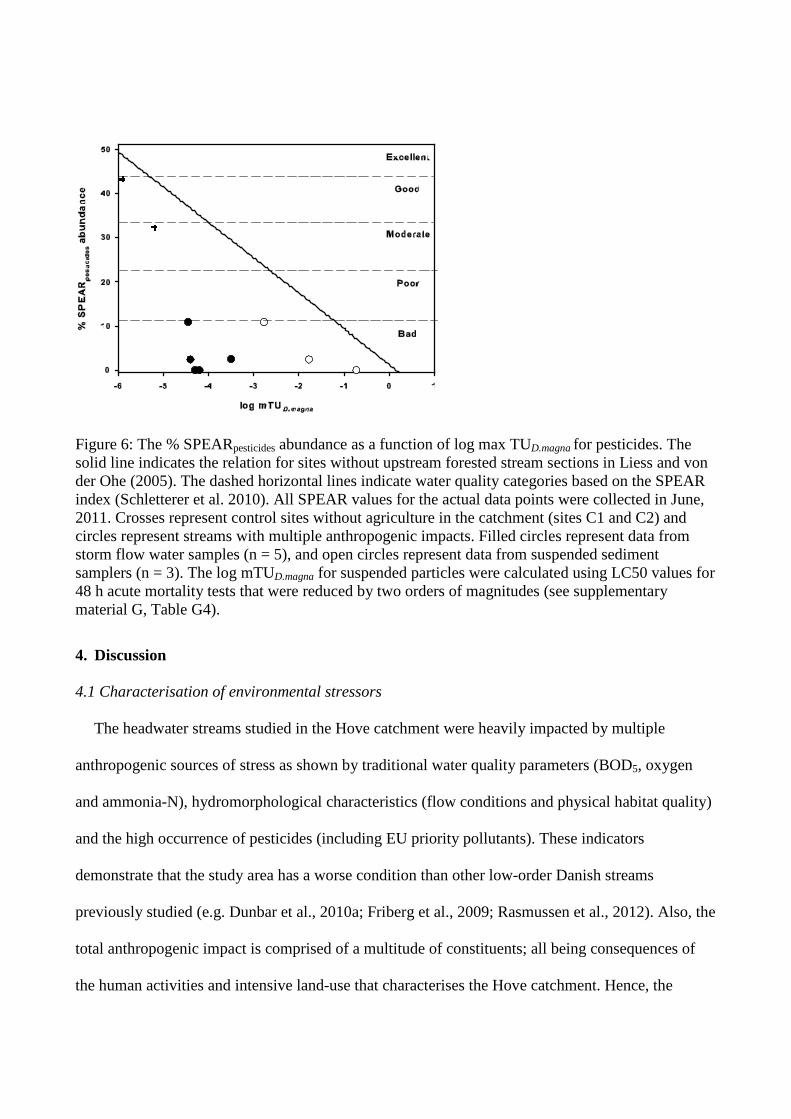
Figure 6: The % SPEARpesticides abundance as a function of log max TUD.magna for pesticides. The solid line indicates the relation for sites without upstream forested stream sections in Liess and von der Ohe (2005). The dashed horizontal lines indicate water quality categories based on the SPEAR index (Schletterer et al. 2010). All SPEAR values for the actual data points were collected in June, 2011. Crosses represent control sites without agriculture in the catchment (sites C1 and C2) and circles represent streams with multiple anthropogenic impacts. Filled circles represent data from storm flow water samples (n = 5), and open circles represent data from suspended sediment samplers (n = 3). The log mTUD.magna for suspended particles were calculated using LC50 values for 48 h acute mortality tests that were reduced by two orders of magnitudes (see supplementary material G, Table G4).
4. Discussion
4.1 Characterisation of environmental stressors
The headwater streams studied in the Hove catchment were heavily impacted by multiple
anthropogenic sources of stress as shown by traditional water quality parameters (BOD5, oxygen
and ammonia-N), hydromorphological characteristics (flow conditions and physical habitat quality)
and the high occurrence of pesticides (including EU priority pollutants). These indicators
demonstrate that the study area has a worse condition than other low-order Danish streams
previously studied (e.g. Dunbar et al., 2010a; Friberg et al., 2009; Rasmussen et al., 2012). Also, the
total anthropogenic impact is comprised of a multitude of constituents; all being consequences of
the human activities and intensive land-use that characterises the Hove catchment. Hence, the
biological communities must be interpreted in the context of the total amount of stress that is
imposed to the system.
A detailed review of the chemical data collected in the 11 study streams in May-June and
August, 2010, show that all study sites were characterised by at least one environmental parameter
exceeding threshold values where sensitive macroinvertebrate species would be expected to
disappear. In particular, BOD5 (> 2 mg L-1), oxygen concentrations (< 5-6 mg L-1) and ammonium-
N concentrations (> 0.2 mg L-1) were often measured at critical levels which are likely caused by
anthropogenic sources such as agriculture, untreated wastewater from scattered dwellings (Friberg
et al., 2010) and discharge from landfills (Milosevic et al., 2012). Moreover, nitrate-N, phosphate-P
and potassium were often found at high concentrations documenting the heavy use of agricultural
fertilisers for crops (Table 3).
Twenty-one different herbicides were detected in stream water with concentrations up to 3.4 µg
L-1 for the commonly applied MCPA (Danish EPA, 2010). Interestingly, the log sumTUD.magna for
herbicides obtained during base-flow and storm flow conditions were within one order of
magnitude of each other in all but one case (Supplementary Material, Tables B.1-3), suggesting that
chronic exposure due to the inflow of pesticide contaminated groundwater is potentially an
important stressor. However, the herbicides are probably not significantly impacting resident fauna
(as discussed below). Importantly, however, several of the detected herbicides are characterised as
EU priority pollutants e.g. atrazine, diuron, isoproturon and simazine. Toluene and TCE (pollutants
from contaminated sites) were only detected at three sites, and conversion of concentrations to toxic
units (for D. magna) suggested that sites contaminated with these compounds were probably an
unimportant stressor for the benthic fauna. This finding is in accordance with McKnight et al.
(2012), who studied a single stream in a nearby catchment on Sjaelland.
Hydro-morphological conditions were generally severely degraded and dominated by low base-
flow conditions and high proportions of soft substrate (often 100%). Several of the study streams
were heavily channelised and managed, stream profiles were often > 1 m below the soil surface and
the riparian vegetation was dominated by grass characterising frequent maintenance. These factors
translated into very low physical habitat quality scores using the Danish Habitat Quality Index
(Table 3), and are also likely to have a significant impact on the stream biota through e.g. increased
sediment transport, loss of essential habitat types, increased habitat instability and the occurrence of
low flow periods causing critically high temperatures and low oxygen concentrations.
4.2 Characterisation of macroinvertebrate communities
We found that all applied macroinvertebrate community measures indicated heavily impacted
ecological status, and the SPEAR index most clearly described the variability within the
macroinvertebrate communities which may be partly explained by the selection of biological traits
that forms the basis of the SPEAR index. The frequent occurrence of anthropogenic disturbances
favours species that have high tolerance for the respective types of disturbance and, furthermore,
short life cycles and high migration abilities (enabling high recovery potential), and since SPEAR
considers these biological traits (and other), this may be partly explain its higher explanatory power.
The %SPEARpesticides abundance attained values below 21 for all sites (Fig. 4), which categorises
them as having poor to bad ecological status according to Schletterer et al. (2010). For six of the
sites, the %SPEARpesticides abundance was even below 10 suggesting a very strong impact of
pesticides on the macroinvertebrate communities. Among the previous studies reporting SPEAR
values from 112 different streams from different locations in the world (primarily headwater
streams), less than 10% of the sites were characterised by %SPEARpesticides values below 10
(compare McKnight et al., 2012; Rasmussen et al., 2012; Schletterer et al., 2010; Schäfer et al.,
2007; 2011; von der Ohe et al., 2007). Despite much weaker correlations with the DCA axis scores,
other qualitative indicators of ecological quality (EPT abundance, DSFI and LIFE scores) all
obtained very low values indicating strong ecological impairment in the studied headwater streams.
High dispersal abilities, polyvoltinism and low specificity of habitat requirements are all essential
traits required if a species is to survive in a degraded and frequently disturbed site situated in a
degraded landscape (Doledec et al., 1999; Gerisch et al., 2012; Statzner & Bêche, 2010). The
SPEAR index considers the species physiological sensitivity to pesticide pollution, length of life
cycles, migration ability and timing of terrestrial phases in its assessment of ecological quality. The
DSFI index only uses species oxygen requirements in its characterisation of sensitive species,
whereas the LIFE index is based on species preferences for flow and habitat types. Since the traits
used in SPEAR (except the physiological sensitivity to pesticides) additionally are central for
species’ abilities to cope with high levels of recurring anthropogenic stress, this may partly explain
why SPEAR performed best in the overall characterisation of the macroinvertebrate communities in
multi-stressor environments. This may furthermore explain why there was no clear clustering of
SPEAR species in the DCA (Fig. 3).
The control streams were characterised by a macroinvertebrate community structure indicative of
higher ecological quality (Supplementary Material, Table C.4). Different measures of ecological
quality provided similar information; indicating that the control streams were characterised by a
fauna with higher ecological index scores (DSFI, LIFE and SPEAR) and abundance of EPT taxa.
Moreover, several of the EPT taxa present in the control sites are characterised by semi- or
univoltinism, such as Isoperla grammatica and all the caddis flies, indicating environmental
conditions that are characterised by much lower levels of anthropogenic disturbance (Nilsson,
2005). The control sites therefore demonstrate that the regional species pool from which new
colonisers can disperse from is relatively diverse – but may also be relatively restricted in space due
to high land-use intensity in the catchment.
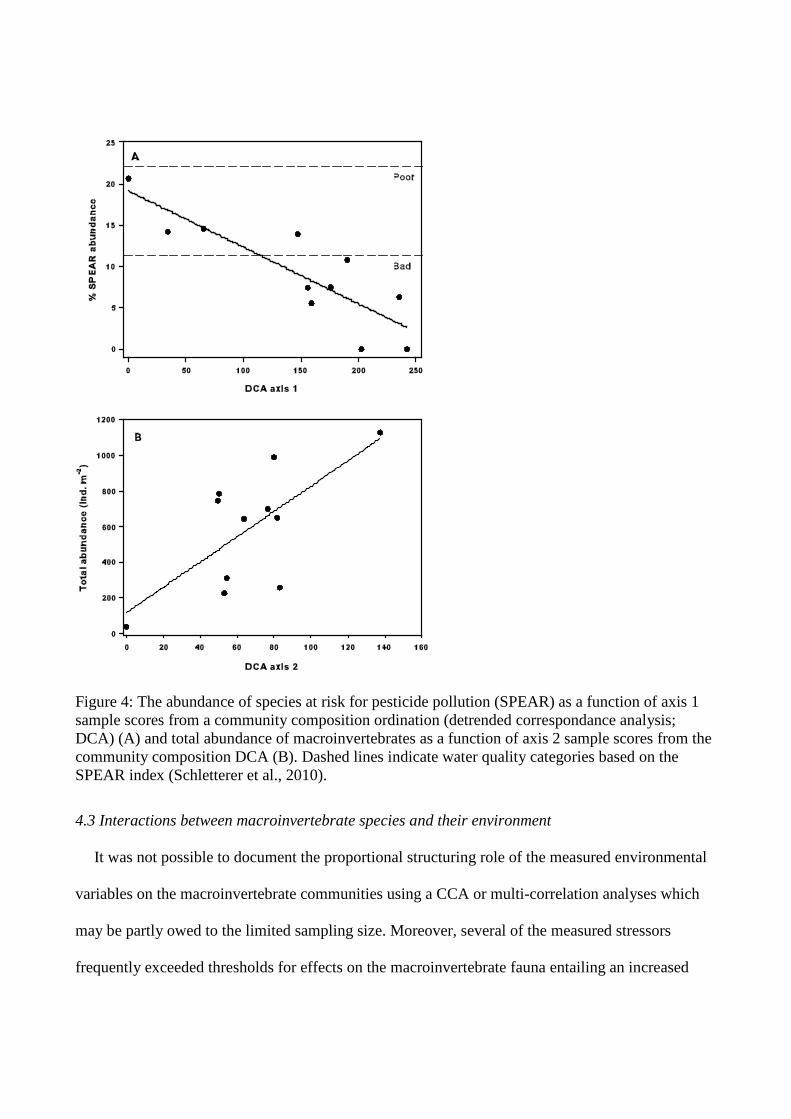
Figure 4: The abundance of species at risk for pesticide pollution (SPEAR) as a function of axis 1 sample scores from a community composition ordination (detrended correspondance analysis; DCA) (A) and total abundance of macroinvertebrates as a function of axis 2 sample scores from the community composition DCA (B). Dashed lines indicate water quality categories based on the SPEAR index (Schletterer et al., 2010).
4.3 Interactions between macroinvertebrate species and their environment
It was not possible to document the proportional structuring role of the measured environmental
variables on the macroinvertebrate communities using a CCA or multi-correlation analyses which
may be partly owed to the limited sampling size. Moreover, several of the measured stressors
frequently exceeded thresholds for effects on the macroinvertebrate fauna entailing an increased
need for a larger sample size in order to disentangle the effects of specific stressors. Targeted
mitigation efforts on single anthropogenic stressors in the catchment are therefore unlikely to have
substantial effects on the ecological quality in these streams, and more holistic approaches should
be preferred.
Another reason for the unsuccessful attempt to estimate the proportional importance of the
dominating stressors in the catchment may be that the potential impact of pesticides was
underestimated due to inadequate quality of the pesticide data, which for the 2010 field campaign
only included herbicides that are rarely found to be acutely toxic to benthic macroinvertebrates in
the field (Schulz, 2004). Since the very low % SPEARpesticides abundances that characterised the
study streams (Fig. 6) suggest that there was a significant impact of pesticides, we re-sampled a
subset of the streams in 2011 in order to provide sufficient quality of pesticide data (including
fungicides and insecticides) to further test the role of agricultural pesticides on the structure of
macroinvertebrate communities. These results are discussed in the next section.
A multi-correlation evaluation of the relations between the eight macroinvertebrate community
descriptors and the environmental variables highlighted several significant correlations, but only a
limited number of the significant correlations were intuitively meaningful. For example, the LIFE
score increased significantly with increasing toxicity of pesticides originating from groundwater
inflow, total nitrogen concentration (primarily from nitrate-N) and chloride concentration. High
LIFE scores are associated with communities that are adapted to higher current velocity and oxygen
concentrations and increasing proportions of hard and clean substrate. In general, the LIFE scores
were low compared to previous findings (e.g. Dunbar et al., 2010b), which is probably due to the
fact that discharge was low in most of the study streams and several of the streams were
characterised by low oxygen concentrations and dominated by soft substrate types, as confirmed in
the multi-correlation analysis. Since the actual gradient in the hydromorphological parameters that
govern the LIFE score outputs was strongly skewed (sites with poor hydromorphological properties
clearly dominating), we suggest that the LIFE score results should be interpreted with care, and we
therefore also suggest that the positive correlations between the LIFE scores and pesticide toxicity
(from groundwater inflow), nitrogen-N concentrations and chloride concentrations are Type II
errors.
4.4 Effects of diffuse source pesticides on macroinvertebrate communities
Our findings indicate that (i) despite a potential reduction in bioavailability and ecotoxicity for
sorbed pesticides, they may still significantly impact benthic macroinvertebrates, and (ii) suspended
particle samples (SPS) add essential information concerning the antecedent occurrence of pesticides
in the streams, which should be considered with the data from event-triggered water samples.
The second sampling campaign in 2011, conducted in a subset of the streams, revealed several
fungicides in the stream water during storm-flow. The insecticide chlorpyrifos was only detected in
the SPSs. These findings are perhaps not surprising, since chlorpyrifos has a high log Kow (4.7)
indicating that this compound is prone to be transported from fields to the adjacent streams as
sorption complexes with organic microparticles (Liess et al., 1996). Chemical toxicity is thought to
decrease when pesticides are sorbed to solid microparticles, as they become less bioavailable to
non-target organisms (e.g. Yang et al., 2006a; You et al., 2008). In the calculations of toxicities of
the SPS samples we therefore applied different adjustment factors (100 to 600) to compensate for
the potentially reduced toxicities to non-target benthic macroinvertebrates, as suggested by the
literature (see e.g. Maul et al., 2008; Maund et al., 2002).
Using the log mTUD.magna for the SPS samples (and 100 as adjustment factor), the relation
between the toxic pressure from pesticides and %SPEARpesticides abundance closely resembled
previously published relations for German streams without upstream forested sections (Liess and
von der Ohe, 2005). Notably, this relation was not seen when using the log mTUD.magna from event-
triggered water samples (Fig. 6), because chlorpyrifos (causing the high log mTUD.magna) was only
captured in the SPS samples. This clearly indicates the importance of the sampling technique used
for the evaluation of pesticide effects in the field, which we recently highlighted in another study
(McKnight et al., 2012).
The sorption of pesticides to particles often increases their half-lives, and the sedimentation and
re-suspension of particle-bound pesticides are mechanisms that keep the pesticides in the stream
ecosystems for a longer time. Moreover, organic microparticles constitute food resources and
habitats for many benthic macroinvertebrates, and the sorption of pesticides to these ensures that the
pesticides remain in close contact with the non-target benthic macroinvertebrates for longer periods
of time. In fact, several pyrethroid insecticides have been detected in the bed sediment of streams in
the United States at concentrations that are expected to impact sediment dwelling organisms
(Kuivila et al., 2012). Similar comprehensive studies have not been conducted in Europe, but Feo et
al. (2010) indicated that pyrethroid impacts may also occur in European streams.
The %SPEARpesticides abundance was again very low (< 10) for the five study streams that were
re-sampled in 2011 (Fig. 6), and the detections of chlorpyrifos in SPSs seem to offer an explanation.
Since the %SPEARpesticides abundance was low for all study streams, and since three out of three
SPS samples confirmed the presence of insecticides, we cautiously conclude that pesticide pollution
may be a major reason for the impaired ecological conditions in the headwater streams in the Hove
catchment. Nonetheless, all data points were positioned below the previously published regression
line for the %SPEARpesticides abundance as a function of log mTUD.magna (Fig. 6), indicating that the
impact may be due to more than just the direct effects of pesticides on benthic macroinvertebrates.
Rasmussen et al. (2012) showed that impaired physical habitat conditions (high proportions of soft
substrate and low habitat heterogeneity) increases the effects of pesticides (decreasing
%SPEARpesticide abundance). Rasmussen et al. (2012) argued that the majority of SPEAR species
had specific habitat preferences for hard substrate types and were characterised by long life cycles
which are traits characteristics that strongly act against presence in a highly disturbed environment.
Since soft substrate types were clearly dominating in the study streams, and in general were
severely disturbed, the very low %SPEARpesticide abundances may be partly due to the generally
impoverished habitat conditions and frequent disturbance from dredging and sediment re-
mobilisation. Our results infer that there may be a need for the development of an alternative
pesticide index for physically impaired streams dominated by soft substrate types or an improved
measure for the toxicity of pesticides adsorbed to microparticles. In contradiction to the
conventional thought that sorption reduces pesticide toxicity by several orders of magnitude (Hill,
1989), Schulz and Liess (2001a; 2001b) showed that the adsorption of pyrethroids to suspended
particles during acute exposure may not reduce the toxicity of pyrethroids to macroinvertebrates by
more than a factor 10.
Conclusions
In this study, we showed that headwater streams in the Hove catchment are strongly impacted by
numerous types of anthropogenic activities causing severe hydromorphological and chemical
impairment as well as severe impairment of the macroinvertebrate communities. However, probably
due to the strong overlap in the impairing side-effects of the many anthropogenic activities and due
to limited sample size, we were not successfully able to distinguish between effects of specific
anthropogenic stressors (i.e. contaminated sites, urban settlements and diffuse source agricultural
pollution), and neither to rank-order their specific importance for the observed ecological
impairment. This means, it is unlikely possible to gain significant positive effects of mitigation
actions directed for single stressors only in this catchment, and more holistic mitigation approaches
should be preferred. Many anthropogenic stressors at least partly forge a selection process for
similar trait characteristics within species (e.g. episodic pesticide pollution and physical impairment
(large fractions of soft substrate types) both increases selection for short life cycles and high
migration capacity). This forms an ambiguous problem in terms of disentangling the ecological
effects of individual stressors that calls for further research.
Our results show that it is important that headwater streams be considered in River Basin
Management Plans and other management and mitigation efforts conducted at the catchment level.
This is needed, since many headwater streams are impacted by numerous anthropogenic activities
causing the severe impairment documented in this study. Furthermore, headwater streams are
essential to the dispersal of species between streams and river systems, and they have the potential
to provide high biodiversity value to the systems due to their potentially unique habitat
characteristics.
Acknowledgements
The authors gratefully acknowledge the support of the Danish Research Council (RiskPoint
project) which provided funding for the study. Moreover, JJR was partly financed by a grant from
the Aarhus University Research Council (Grant no. 150359-1177). We thank three anonymous
reviewers for constructive comments and advise that helped us improve the manuscript. We would
also like to acknowledge Uffe Mensberg and Henrik Stenholt for field assistance, and Marlene
Venø Skærbæk and Morten Andreasen for assistance with chemical analyses.
References
Allan JD. Landscapes and riverscapes: The influence of land use on stream ecosystems. Annu Rev
Ecol Evol S 2004; 35: 257-284.
Beketov M, Liess M. Ecotoxicology and macroecology - Time for integration. Environ Pollut 2012;
162: 247-254.
Danish EPA. Pesticide statistics 2009 [In Danish]. Danish EPA, Ministry of Envioronment and
Energy, 2010.
Ding Y, Weston DP, You J, Rothert AK, Lydy MJ. Toxicity of Sediment-Associated Pesticides to
Chironomus dilutus and Hyalella azteca. Arc Environ Con Tox 2011; 61: 83-92.
Dodds WK, Oakes RM. Headwater influences on downstream water quality. Environ Manage 2008;
41: 367-377.
Doledec S, Statzner B, Bournard M. Species traits for future biomonitoring across ecoregions:
patterns along a human-impacted river. Freshwater Biol 1999; 42: 737-758.
Dunbar MJ, Pedersen ML, Cadman D, Extence C, Waddingham J, Chadd R, et al. River discharge
and local-scale physical habitat influence macroinvertebrate LIFE scores. Freshwater Biol
2010a; 55: 226-242.
Dunbar MJ, Warren M, Extence C, Baker L, Cadman D, Mould DJ, et al. Interaction between
macroinvertebrates, discharge and physical habitat in upland rivers. Aquatic Conserv 2010b;
20: S31-S44.
Extence CA, Balbi DM, Chadd RP. River flow indexing using British benthic macroinvertebrates:
A framework for setting hydroecological objectives. Regul River 1999; 15: 543-574.
Feo ML, Ginebreda A, Eljarrat E, Barcelo D. Presence of pyrethroid pesticides in water and
sediments of Ebro River Delta. J Hydrol 2010; 393: 156-162.
Freeman MC, Pringle CM, Jackson CR. Hydrologic connectivity and the contribution of stream
headwaters to ecological integrity at regional scales. J Am Water Resour As 2007; 43: 5-14.
Friberg N, Sandin L, Pedersen ML. Assessing the effects of hydromorphological degradation on
macroinvertebrate indicators in rivers: Examples, constraints and outlook. Integr Environ
Assess Manage 2009; 5: 86-96.
Friberg N, Skriver J, Larsen SE, Pedersen ML, Buffagni A. Stream macroninvertebrate occurrence
along gradients in organic pollution and eutrophication. Freshwater Biol 2010; 55: 1405-
1419.
Gerisch M, Agostinelli V, Henle K, Dziock F. More species, but all do the same: contrasting effects
of flood disturbance on ground beetle functional and species diversity. Oikos 2012; 121:
508-515.
Hill IR. Aquatic organisms and pyrethroids. Pestic Sci 1989; 27: 429-465.
Kuivila KM, Hladik ML, Ingersoll CG, Kemble NE, Moran PW, Calhoun DL, et al. Occurrence and
Potential Sources of Pyrethroid Insecticides in Stream Sediments from Seven U.S.
Metropolitan Areas. Environ Sci Technol 2012; 46: 4297-4303.
Kürstein J, Andersen JA, Mahrt J. The Zealand model - an integrated model tool for the
hydrological network (in Danish). Danish Hydrological Institute, 2009.
Larsen S, Ormerod SJ. Combined effects of habitat modification on trait composition and species
nestedness in river invertebrates. Biol Conserv 2010; 143: 2638-2646.
Lassaletta L, Garcia-Gomez H, Gimeno BS, Rovira JV. Headwater streams: neglected ecosystems
in the EU Water Framework Directive. Implications for nitrogen pollution control. Environ
Sci Policy 2010; 13: 423-433.
Laubel A, Kronvang B, Fjordback C. Time-integrated suspended sediment sampling from a small
lowland stream. Int Ver Theor Angew 2001; 28: 1420-1424.
Liess M, Schulz R, Neumann M. A method for monitoring pesticides bound to suspended particles
in small streams. Chemosphere 1996; 32: 1963-1969.
Liess M, von der Ohe PC. Analyzing effects of pesticides on invertebrate communities in streams.
Environ Toxicol Chem 2005; 24: 954-965.
Malaguerra F, Albrechtsen HJ, Thorling L, Binning PJ. Pesticides in water supply wells in Zealand,
Denmark: A statistical analysis. Sci Tot Environ 2012; 414: 433-444.
Matson PA, Parton WJ, Power AG, Swift MJ. Agricultural intensification and ecosystem properties.
Science 1997; 277: 504-509.
Matthaei CD, Piggott JJ, Townsend CR. Multiple stressors in agricultural streams: interactions
among sediment addition, nutrient enrichment and water abstraction. J Appl Ecol 2010; 47:
639-649.
Maul JD, Brennan AA, Harwood AD, Lydy MJ. Effect of sediment-associated pyrethroids, fipronil,
and metabolites on Chironomus tentans growthrate, body mass, condition index,
immobilization and survival. Environ Toxicol Chem 2008; 27: 2582-2590.
Maund SJ, Hamer MJ, Lane MCG, Farrelly E, Rapley JH, Goggin UM, et al. Partitioning,
bioavailability, and toxicity of the pyrethroid insecticide cypermethrin in sediments. Environ
Toxicol Chem 2002; 21: 9-15.
McKnight US, Rasmussen JJ, Kronvang B, Bjerg PL, Binning PJ. Integrated assessment of the
impact of chemical stressors on surface water ecosystems. Sci Tot Environ 2012; 427-428.
Meyer JL, Strayer DL, Wallace JB, Eggert SL, Helfman GS, Leonard NE. The contribution of
headwater streams to biodiversity in river networks. J Am Water Resour As 2007; 43: 86-
103.
Millenium Ecosystem Assessment. Ecosystems and human well-being: synthesis. Washington, DC:
Island Press, 2005.
Milosevic N, Thomsen NI, Juhler RK, Alberechtsen H-J, Bjerg PL. Identification of discharge
zones and quantification of contaminant mass discharges into a local stream from a landfill
in a heterogeneous geologic setting. J Hydrol 2012; 446-447: 13-23.
Nilsson A. Aquatic insects of Northern Europe: A taxonomic handbook: Apollo Books, 2005.
Ormerod SJ, Dobson M, Hildrew AG, Townsend CR. Multiple stressors in freshwater ecosystems.
Freshwater Biol 2010; 55: 1-4.
Pedersen ML. Effects of channelisation, riparian structure and catchment area on physical habitats
in small lowland streams. Fund Appl Limnol 2009; 174: 89-99.
Pedersen ML, Friberg N. Influence of disturbance on habitats and biological communities in
lowland streams. Fund Appl Limnol 2009; 174: 27-41.
Pedersen ML, Sode A, Kaarup P, Bundgaard P. Habitat quality in Danish streams. Testing of two
indices and development of a National Physical Habitat Quality Index. Scientific Report.
590. National Environmental Research Institute, Silkeborg, Denmark, 2006.
Rasmussen JJ, Baattrup-Pedersen A, Larsen SE, Kronvang B. Local physical habitat quality cloud
the effect of predicted pesticide runoff from agricultural land in Danish streams. J Environ
Monitor 2011; 13: 943-950.
Rasmussen JJ, Wiberg-Larsen P, Baattrup-Pedersen A, Friberg N, Kronvang B. Physical structure
of stream microhabitats influences the response of stream macroinvertebrate communities to
pesticide stress. Environ Pollut 2012; 164: 142-149.
Schletterer M, Fureder L, Kuzovlev VV, Beketov MA. Testing the coherence of several
macroinvertebrate indices and environmental factors in a large lowland river system (Volga
River, Russia). Ecol Indic 2010; 10: 1083-1092.
Schulz R. Field studies on exposure, effects, and risk mitigation of aquatic nonpoint-source
insecticide pollution: A review. J Environ Qual 2004; 33: 419-448.
Schulz R, Liess M. Acute and chronic effects of particle-associated fenvalerate on stream
macroinvertebrates: A runoff simulation study using outdoor microcosms. Arch Environ
Con Tox 2001a; 40: 481-488.
Schulz R, Liess M. Toxicity of aqueous-phase and suspended particle-associated fenvalerate:
Chronic effects after pulse-dosed exposure of Limnephilus lunatus (Trichoptera). Environ
Toxicol Chem 2001b; 20: 185-190.
Schäfer RB, Bundschuh M, Rouch DA, E. S, von der Ohe PC, Pettigrove V, et al. Effects of
pesticide toxicity, salinity and other environmental variables on selected ecosystem
functions in streams and the relevance for ecosystem services. Sci Tot Environ 2012a; 415:
69-78.
Schäfer RB, Caquet T, Siimes K, Mueller R, Lagadic L, Liess M. Effects of pesticides on
community structure and ecosystem functions in agricultural streams of three
biogeographical regions in Europe. Sci Tot Environ 2007; 382: 272-285.
Schäfer RB, Pettigrove V, Rose G, Allinson G, Wightwick A, von der Ohe PC, et al. Effects of
pesticides monitored with three sampling methods in 24 sites on macroinvertebrates and
microorganisms. Environ Sci Technol 2011; 45: 1665-1672.
Schäfer RB, von der Ohe PC, Rasmussen JJ, Kefford B, Beketov M, Schulz R, et al. Thresholds for
the effects of pesticides on invertebrate communities and leaf breakdown in stream
ecosystems. Environ Sci Technol 2012b; 46: 5134-5142.
Segner H. Moving beyond a descriptive aquatic toxicology: The value of biological process and
trait information. Aquatic Toxicol 2011; 105: 50-55.
Skriver J, Friberg N, Kirkegaard J. Biological assessment of running waters in Denmark:
introdution of the Danish Stream Fauna Index (DSFI). Ver Int Ver Limnol 2000; 27: 1822–
1830.
Statzner B, Bêche LA. Can biological invertebrate traits resolve effects of multiple stressors on
running water ecosystems? Freshwat Biol 2010; 55: 80-119.
Stoddard JL, Larsen DP, Hawkins CP, Johnson RK, Norris RH. Setting expectations for the
ecological condition of streams: The concept of reference condition. Ecol Appl 2006; 16:
1267-1276.
ter Braak CJF, Prentice IC. A theory of gradient analysis. Adv Ecol Res 1988; 18: 271-317.
Tomlin CDS. The pesticide manual, a wold compendium. Farnham, Surrey, UK: Crop Protection
Publications, 2000.
Townsend CR, Uhlmann SS, Matthaei CD. Individual and combined responses of stream
ecosystems to multiple stressors. J Appl Ecol 2008; 45: 1810-1819.
von der Ohe PC, Prub A, Schafer RB, Liess M, de Deckere E, Brack W. Water quality indices
across Europe - a comparison of the good ecological status of five river basins. J Environ
Monitor 2007; 9: 970-978.
Warne MSJ, Hawker DW. The number of components in a mixture determines whether synergistic
and antagonistic or additive toxicity predominate - the Funnel hypothesis. Ecotoxicol
Environ Saf 1995; 31: 23-28.
Winslow SD, Martin JJ, Hallberg GR, Munch DJ, Freibis CP, al. e. Statistical procedures for the
determination and verification of minimum reporting levels for drinking water methods.
Environ Sci Technol 2006; 40: 281-288.
Yang W, Gan J, Hunter W, Spurlock F. Effect of suspended solids on bioavailability of pyrethroid
insecticides. Environ Toxicol Chem 2006a; 25: 1585-1591.
Yang W, Spurlock F, Liu W, Gan J. Inhibition of aquatic toxicity of pyrethroid insecticides by
suspended sediment. Environ Toxicol Chem 2006b; 25: 1913-1919.
You J, Pehkonen S, Weston DP, Lydy MJ. Chemical availability and sediment toxicity of
pyrethroid insecticides to Hyalella azteca: Application to field sediment with unexpectedly
low toxicity. Environ Toxicol Chem 2008; 27: 2124-2130.
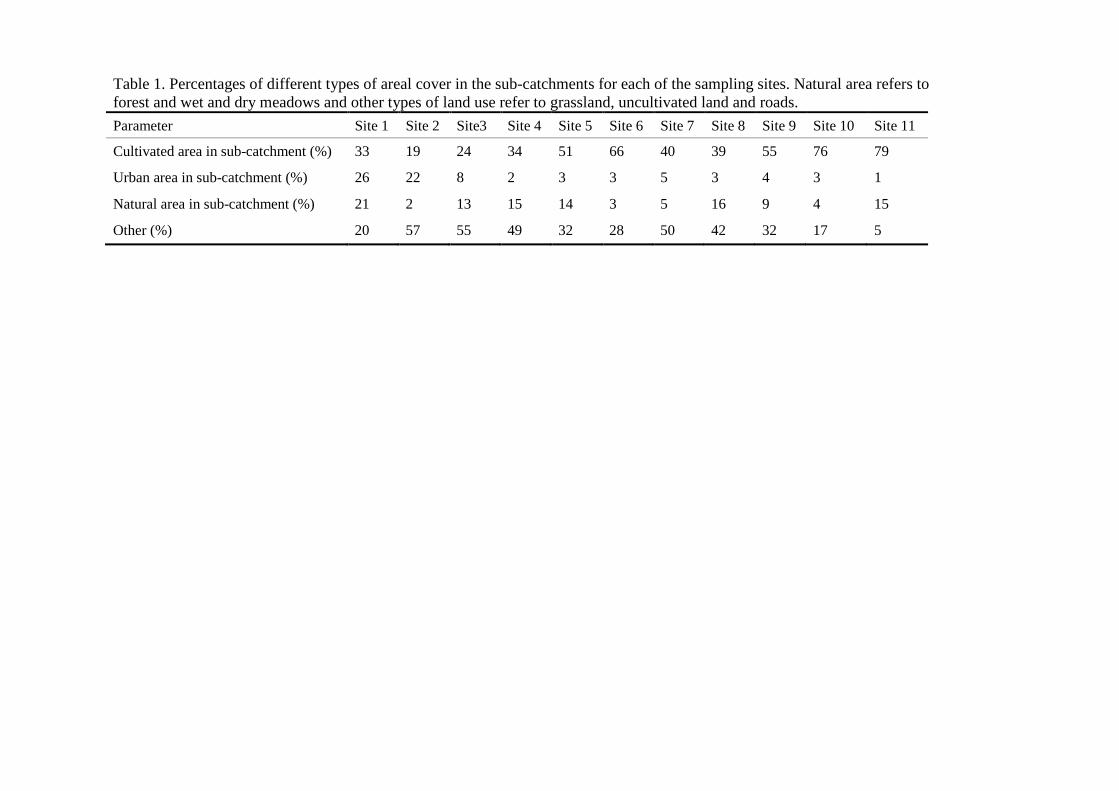
Table 1. Percentages of different types of areal cover in the sub-catchments for each of the sampling sites. Natural area refers to forest and wet and dry meadows and other types of land use refer to grassland, uncultivated land and roads. Parameter Site 1 Site 2 Site3 Site 4 Site 5 Site 6 Site 7 Site 8 Site 9 Site 10 Site 11
Cultivated area in sub-catchment (%) 33 19 24 34 51 66 40 39 55 76 79
Urban area in sub-catchment (%) 26 22 8 2 3 3 5 3 4 3 1
Natural area in sub-catchment (%) 21 2 13 15 14 3 5 16 9 4 15
Other (%) 20 57 55 49 32 28 50 42 32 17 5
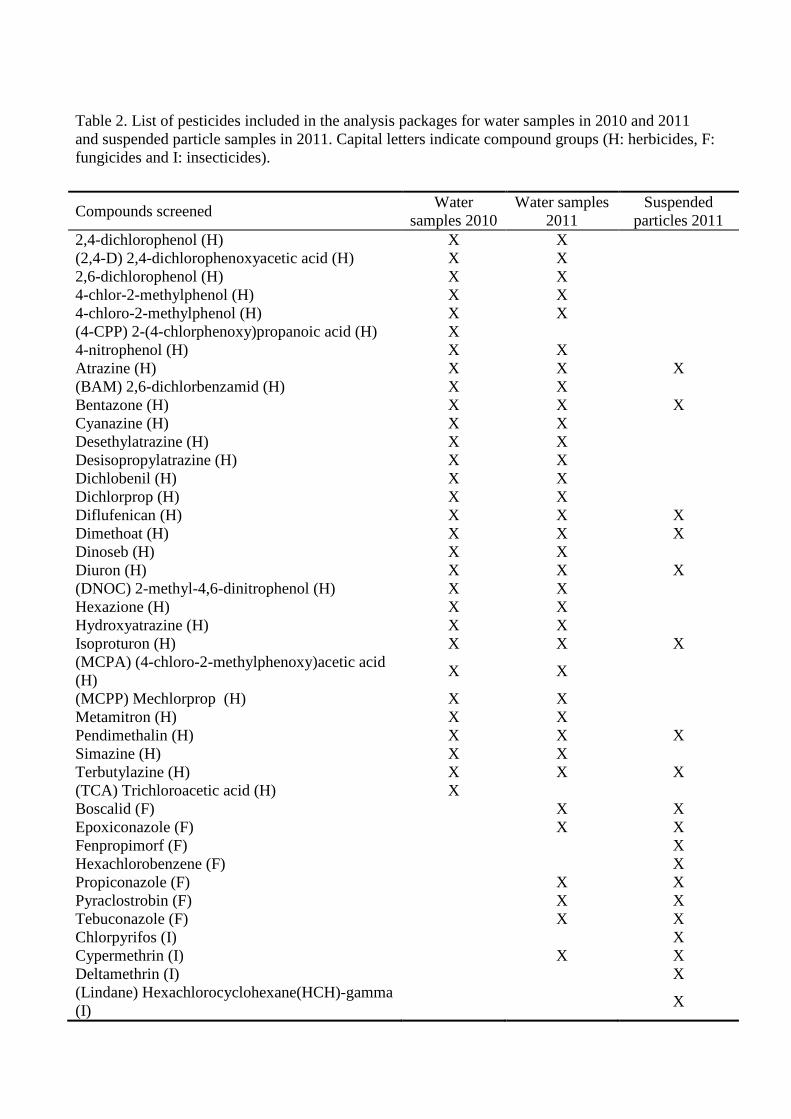
Table 2. List of pesticides included in the analysis packages for water samples in 2010 and 2011 and suspended particle samples in 2011. Capital letters indicate compound groups (H: herbicides, F: fungicides and I: insecticides).
Compounds screened Water samples 2010
Water samples 2011
Suspended particles 2011
2,4-dichlorophenol (H) X X (2,4-D) 2,4-dichlorophenoxyacetic acid (H) X X 2,6-dichlorophenol (H) X X 4-chlor-2-methylphenol (H) X X 4-chloro-2-methylphenol (H) X X (4-CPP) 2-(4-chlorphenoxy)propanoic acid (H) X 4-nitrophenol (H) X X Atrazine (H) X X X (BAM) 2,6-dichlorbenzamid (H) X X Bentazone (H) X X X Cyanazine (H) X X Desethylatrazine (H) X X Desisopropylatrazine (H) X X Dichlobenil (H) X X Dichlorprop (H) X X Diflufenican (H) X X X Dimethoat (H) X X X Dinoseb (H) X X Diuron (H) X X X (DNOC) 2-methyl-4,6-dinitrophenol (H) X X Hexazione (H) X X Hydroxyatrazine (H) X X Isoproturon (H) X X X (MCPA) (4-chloro-2-methylphenoxy)acetic acid (H) X X
(MCPP) Mechlorprop (H) X X Metamitron (H) X X Pendimethalin (H) X X X Simazine (H) X X Terbutylazine (H) X X X (TCA) Trichloroacetic acid (H) X Boscalid (F) X X Epoxiconazole (F) X X Fenpropimorf (F) X Hexachlorobenzene (F) X Propiconazole (F) X X Pyraclostrobin (F) X X Tebuconazole (F) X X Chlorpyrifos (I) X Cypermethrin (I) X X Deltamethrin (I) X (Lindane) Hexachlorocyclohexane(HCH)-gamma (I) X

Lambda-cyhalothrin (I) X Pirimicarb (I) X X Tau-fluvalinate (I) X X Thiacloprid (I) X X
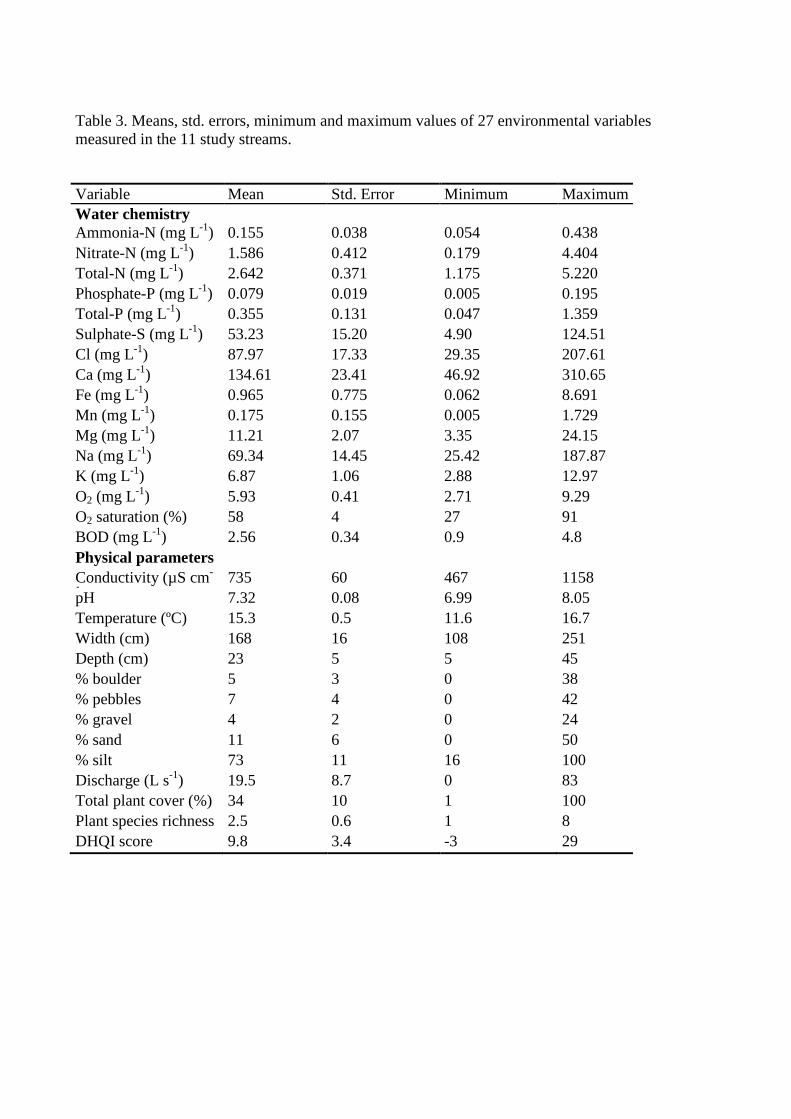
Table 3. Means, std. errors, minimum and maximum values of 27 environmental variables measured in the 11 study streams.
Variable Mean Std. Error Minimum Maximum Water chemistry Ammonia-N (mg L-1) 0.155 0.038 0.054 0.438 Nitrate-N (mg L-1) 1.586 0.412 0.179 4.404 Total-N (mg L-1) 2.642 0.371 1.175 5.220 Phosphate-P (mg L-1) 0.079 0.019 0.005 0.195 Total-P (mg L-1) 0.355 0.131 0.047 1.359 Sulphate-S (mg L-1) 53.23 15.20 4.90 124.51 Cl (mg L-1) 87.97 17.33 29.35 207.61 Ca (mg L-1) 134.61 23.41 46.92 310.65 Fe (mg L-1) 0.965 0.775 0.062 8.691 Mn (mg L-1) 0.175 0.155 0.005 1.729 Mg (mg L-1) 11.21 2.07 3.35 24.15 Na (mg L-1) 69.34 14.45 25.42 187.87 K (mg L-1) 6.87 1.06 2.88 12.97 O2 (mg L-1) 5.93 0.41 2.71 9.29 O2 saturation (%) 58 4 27 91 BOD (mg L-1) 2.56 0.34 0.9 4.8 Physical parameters Conductivity (µS cm-
1 735 60 467 1158
pH 7.32 0.08 6.99 8.05 Temperature (ºC) 15.3 0.5 11.6 16.7 Width (cm) 168 16 108 251 Depth (cm) 23 5 5 45 % boulder 5 3 0 38 % pebbles 7 4 0 42 % gravel 4 2 0 24 % sand 11 6 0 50 % silt 73 11 16 100 Discharge (L s-1) 19.5 8.7 0 83 Total plant cover (%) 34 10 1 100 Plant species richness 2.5 0.6 1 8 DHQI score 9.8 3.4 -3 29
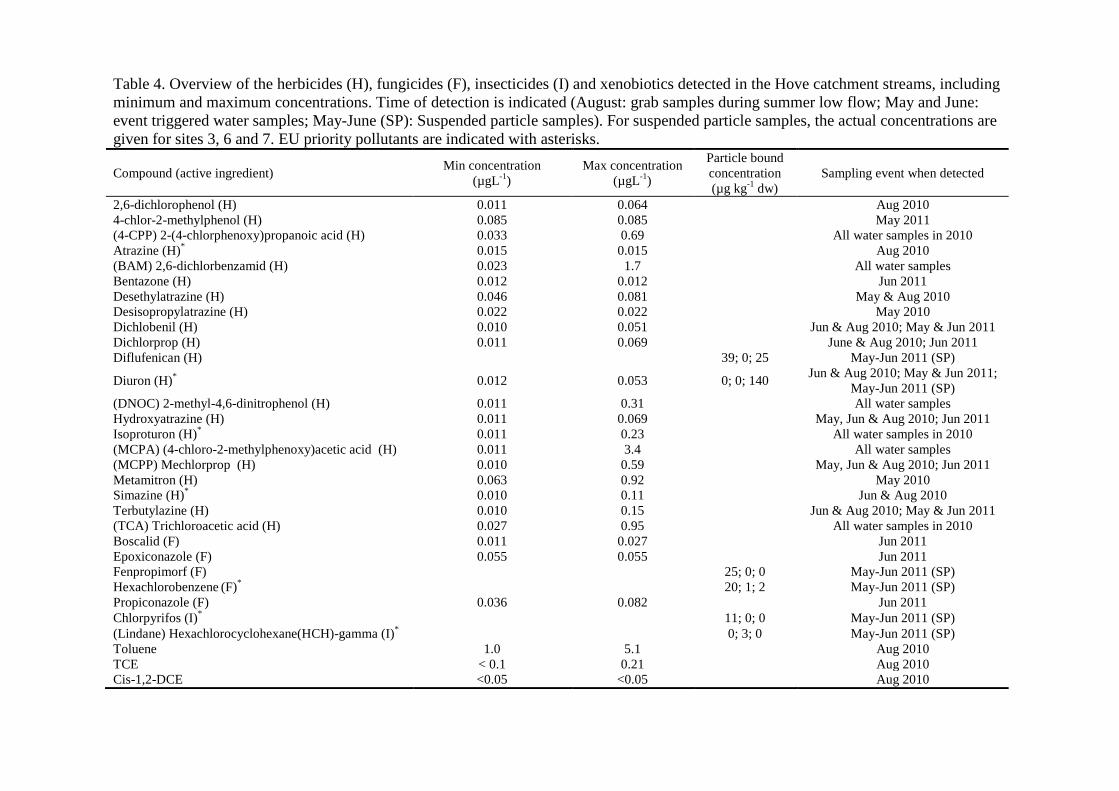
Table 4. Overview of the herbicides (H), fungicides (F), insecticides (I) and xenobiotics detected in the Hove catchment streams, including minimum and maximum concentrations. Time of detection is indicated (August: grab samples during summer low flow; May and June: event triggered water samples; May-June (SP): Suspended particle samples). For suspended particle samples, the actual concentrations are given for sites 3, 6 and 7. EU priority pollutants are indicated with asterisks.
Compound (active ingredient) Min concentration (µgL-1)
Max concentration (µgL-1)
Particle bound concentration (µg kg-1 dw)
Sampling event when detected
2,6-dichlorophenol (H) 0.011 0.064 Aug 2010 4-chlor-2-methylphenol (H) 0.085 0.085 May 2011 (4-CPP) 2-(4-chlorphenoxy)propanoic acid (H) 0.033 0.69 All water samples in 2010 Atrazine (H)* 0.015 0.015 Aug 2010 (BAM) 2,6-dichlorbenzamid (H) 0.023 1.7 All water samples Bentazone (H) 0.012 0.012 Jun 2011 Desethylatrazine (H) 0.046 0.081 May & Aug 2010 Desisopropylatrazine (H) 0.022 0.022 May 2010 Dichlobenil (H) 0.010 0.051 Jun & Aug 2010; May & Jun 2011 Dichlorprop (H) 0.011 0.069 June & Aug 2010; Jun 2011 Diflufenican (H) 39; 0; 25 May-Jun 2011 (SP)
Diuron (H)* 0.012 0.053 0; 0; 140 Jun & Aug 2010; May & Jun 2011; May-Jun 2011 (SP)
(DNOC) 2-methyl-4,6-dinitrophenol (H) 0.011 0.31 All water samples Hydroxyatrazine (H) 0.011 0.069 May, Jun & Aug 2010; Jun 2011 Isoproturon (H)* 0.011 0.23 All water samples in 2010 (MCPA) (4-chloro-2-methylphenoxy)acetic acid (H) 0.011 3.4 All water samples (MCPP) Mechlorprop (H) 0.010 0.59 May, Jun & Aug 2010; Jun 2011 Metamitron (H) 0.063 0.92 May 2010 Simazine (H)* 0.010 0.11 Jun & Aug 2010 Terbutylazine (H) 0.010 0.15 Jun & Aug 2010; May & Jun 2011 (TCA) Trichloroacetic acid (H) 0.027 0.95 All water samples in 2010 Boscalid (F) 0.011 0.027 Jun 2011 Epoxiconazole (F) 0.055 0.055 Jun 2011 Fenpropimorf (F) 25; 0; 0 May-Jun 2011 (SP) Hexachlorobenzene (F)* 20; 1; 2 May-Jun 2011 (SP) Propiconazole (F) 0.036 0.082 Jun 2011 Chlorpyrifos (I)* 11; 0; 0 May-Jun 2011 (SP) (Lindane) Hexachlorocyclohexane(HCH)-gamma (I)* 0; 3; 0 May-Jun 2011 (SP) Toluene 1.0 5.1 Aug 2010 TCE < 0.1 0.21 Aug 2010 Cis-1,2-DCE <0.05 <0.05 Aug 2010
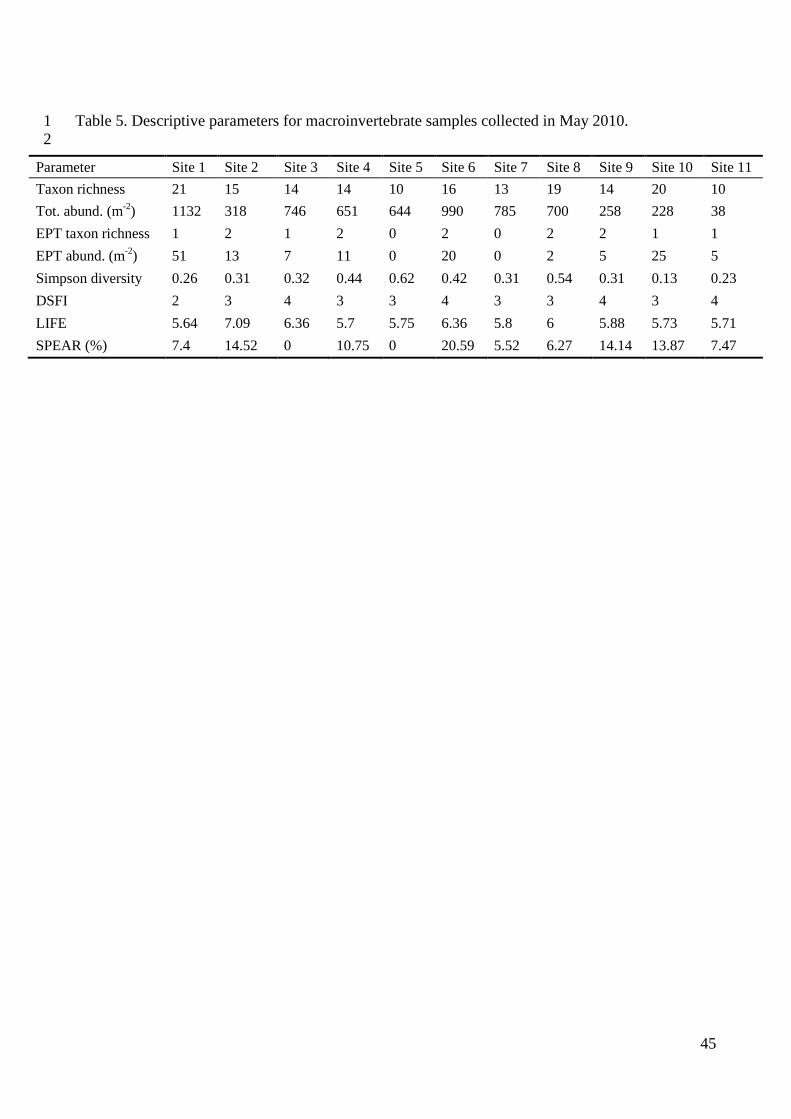
Table 5. Descriptive parameters for macroinvertebrate samples collected in May 2010. 1 2
Parameter Site 1 Site 2 Site 3 Site 4 Site 5 Site 6 Site 7 Site 8 Site 9 Site 10 Site 11 Taxon richness 21 15 14 14 10 16 13 19 14 20 10 Tot. abund. (m-2) 1132 318 746 651 644 990 785 700 258 228 38 EPT taxon richness 1 2 1 2 0 2 0 2 2 1 1 EPT abund. (m-2) 51 13 7 11 0 20 0 2 5 25 5 Simpson diversity 0.26 0.31 0.32 0.44 0.62 0.42 0.31 0.54 0.31 0.13 0.23 DSFI 2 3 4 3 3 4 3 3 4 3 4 LIFE 5.64 7.09 6.36 5.7 5.75 6.36 5.8 6 5.88 5.73 5.71 SPEAR (%) 7.4 14.52 0 10.75 0 20.59 5.52 6.27 14.14 13.87 7.47
45
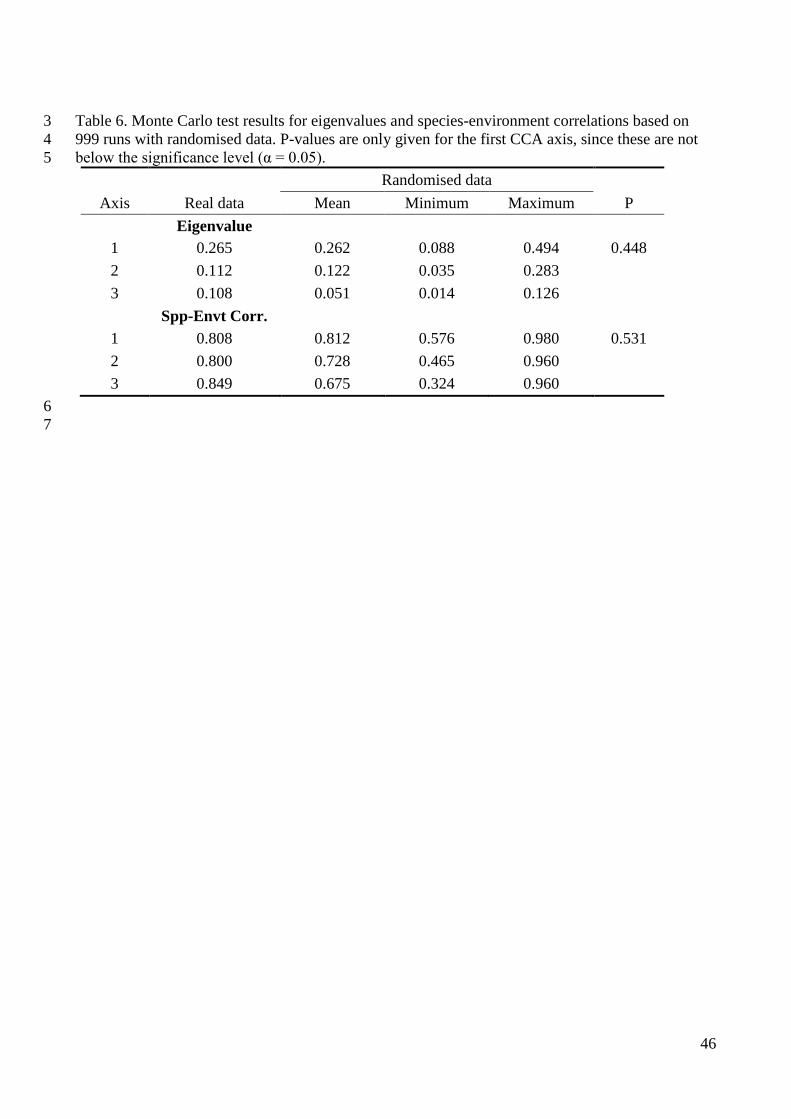
Table 6. Monte Carlo test results for eigenvalues and species-environment correlations based on 3 999 runs with randomised data. P-values are only given for the first CCA axis, since these are not 4 below the significance level (α = 0.05). 5
Randomised data Axis Real data Mean Minimum Maximum P
Eigenvalue 1 0.265 0.262 0.088 0.494 0.448 2 0.112 0.122 0.035 0.283 3 0.108 0.051 0.014 0.126 Spp-Envt Corr. 1 0.808 0.812 0.576 0.980 0.531 2 0.800 0.728 0.465 0.960 3 0.849 0.675 0.324 0.960
6 7
46