a causal model of the empowerment process: … · advent of the human relations movement ... in...
TRANSCRIPT

A Causal Model of the Empowerment Process: Exploring the Links between
Empowerment Practices, Employee Cognitions, and Behavioral Outcomes
By
Sergio Fernandez
Associate Professor
Indiana University
School of Public and Environmental Affairs
and
Tima Moldogaziev
Doctoral Candidate
Indiana University
School of Public and Environmental Affairs
Paper presented at the 11th National Public Management Research Conference,
Maxwell School, Syracuse University, Syracuse, New York, June 2-4, 2011.

2 | P a g e
The intellectual roots of employee empowerment stretch back many decades to the
advent of the Human Relations movement in organization theory (Herrenkohl, Judson, and
Heffner, 1999). From the 1940s through the 1970s, ideas regarding employee empowerment
were treated ―at best as interesting fodder for academic debates‖ (Potterfield, 1999, p. 30) or at
worst as ―socialism, democracy gone wild, or worse yet, a form of communism‖ (Lawler, 1986,
p. 9). Then beginning in the 1980s, global competition and strong pressure to continuously
improve quality led many prominent American firms to adopt employee empowerment programs
(Bowen and Lawler, 1992; 1995; Lawler, Mohrman, and Ledford, 1995; Conger and Kanungo,
1988; Thomas and Velthouse, 1990; Spreitzer, 1995, 1996; Potterfield, 1999). In the public
sector, employee empowerment figured prominently in the New Public Management reforms
undertaken in North America, Europe and the Pacific (Kettl, 2005; Peters, 1996; Wise, 2002;
Pollitt, 1990; Matheson, 2007), including in the United States where empowerment was one of
the four guiding principles of the Clinton Administration‘s National Performance Review (Gore,
1993).
A growing body of empirical evidence from the private sector indicates employee
empowerment can be used to increase employee productivity, organizational commitment, job
satisfaction, and innovativeness (Spreitzer, 1995; Lawler, Mohrman, and Ledford, 1992, 1995;
Neilsen and Pedersen, 2003; Kirkman and Rosen, 1999; Guthrie, 2001). Recent public
management studies have begun to show the efficacy of empowerment practices at raising levels
of job satisfaction and performance and encouraging innovation in the public sector (Wright and
Kim, 2004; Kim, 2002; Lee, Cayer, and Lan, 2006; Park and Rainey, 2007; Fernandez and
Moldogaziev, 2011). Despite these significant developments in the scholarly study of employee
empowerment, divergent views remain about the meaning and nature of the construct. For

3 | P a g e
scholars who approach the topic from a managerial perspective, employee empowerment is a
relational construct describing how those with power in organizations share power and authority
with those lacking it (Bowen and Lawler, 1992, 1995; Kanter, 1979). For others, empowerment
is a psychological construct akin to increased feelings of self-efficacy (Conger and Kanungo,
1988) and intrinsic task motivation (Thomas and Velthouse, 1990).
In this paper, these two views of empowerment are treated as complementary pieces of
the employee empowerment puzzle that represent qualitatively different phenomena: the
relational construct representing managerial behavior (i.e., empowerment as something managers
do) and the motivational one representing employee cognitions (i.e., empowerment as something
employees think or feel). Employee empowerment might best be understood as a process
involving a set of management practices (sharing authority, resources, information, and rewards
with employees) that directly affects work outcomes (quality, productivity, customer
satisfaction) and also indirectly affects them by influencing employee cognitions (self-efficacy,
motivation, job satisfaction). This hypothesized causal structure is tested using structural
equation modeling (SEM) techniques and data from the 2010 Federal Employee Viewpoint
Survey (FEVS), a large survey of federal government employees conducted by the U.S. Office of
Personnel Management. The results generally support the hypothesized model, showing that an
employee empowerment approach to managing employees has a direct effect on performance as
well as indirect effects through its impact on innovativeness and performance.
The Employee Empowerment Construct
The origins of the empowerment construct can be traced back to the early and middle part
of the 20th
century, when scholars began dealing with issues of power and the benefits of sharing
power with lower level employees. These early studies of power in organizations square with

4 | P a g e
the view of empowerment as a relational construct, with empowerment being something
managers do or a set of practices they engage in. Follett (1926) asserted that behavior can be
changed more effectively when a supervisor and a subordinate work together to study and
resolve a problem. As she explained, the former should not give orders to the latter, but both
should agree to take their orders from the situation. Likert (1967), in his study of what
differentiates high from low performing firms, warned that only those firms that adopt a more
democratic and participatory management style that expressed empathy for employees would be
able to stay on top of their competitors by attracting and retaining skilled and productive
workers. McGregor (1960) argued that the antidote to low employee productivity and morale
was a management approach aimed at reducing employee dependency on management by
granting them more formal authority and the opportunity to perform meaningful work. Argyris
(1957) asserted that to satisfy the psychological needs of mature adults, managers would have to
promote job enlargement and allow greater responsibility and involvement in decision making.
Kanter‘s (1979) seminal contribution to the understanding of empowerment was to
describe the array of sources of power in organizations. She argued that power comes not solely
or even primarily from formal authority, as exercised by the giving of orders. Rather, power
emerges from two individual capacities: access to resources, information, and support needed to
perform a task; and the ability to obtain the cooperation of subordinates. Her work implies
empowerment is more about enabling employees to perform a task than about granting them the
authority to act.
Bowen and Lawler‘s (1992, 1995) analysis of the burgeoning empowerment trend built
upon Kanter‘s notion of empowerment. They acknowledged that a key ingredient of
empowerment is sharing power and authority with lower level employees and allowing them to

5 | P a g e
make decisions about how services are rendered. However, sharing power is insufficient if the
benefits of empowerment—including better quality service, greater customer satisfaction, and
higher employee job satisfaction—are to be realized. In their research of employee
empowerment programs in private firms, Bowen and Lawler observed that ―many empowerment
programs fail when they focus on ‗power‘ without also redistributing information, knowledge
and rewards‖ (p. 1992, p. 32). According to them, effective use of empowerment involves
having managers share with their employees four organizational ingredients: ―(1) information
about the organization‘s performance, (2) rewards based on the organization‘s performance, (3)
knowledge that enables employees to understand and contribute to organizational performance,
and (4) power to make decisions that influence organizational direction and performance‖ (1992;
p. 32). Importantly, these four elements interact with each other, having a multiplicative rather
than additive effect on performance.
Up until the late 1980s, the treatment of employee empowerment as a relational construct
predominated in the literature. Dissatisfaction with that approach led some scholars to
emphasize the psychological aspects of empowerment. Conger and Kanungo (1988) were
critical of previous empowerment scholars for their tendency to equate empowerment solely with
practices aimed at sharing authority with lower-level employees as well as for their failure to
account for the critical role played by cognition and affect in explaining performance. Viewing
empowerment as a motivational construct, they argued that involving lower-level employees in
the decision making process and delegating authority to them does not guarantee they will feel
motivated or enabled to act. Instead, empowered employees will exert effort when they believe
such effort will result in a desired level of performance (see also Lawler, 1973). This heightened
belief in the ability to perform—defined by Bandura (1986) as the self-efficacy expectation—is

6 | P a g e
influenced as much by feedback, job enrichment, and goal setting as by managers‘ efforts to
share authority with employees.
Inspired by the work of Conger and Kanungo, Thomas and Velthouse (1990) furthered
the development of empowerment as a motivational construct by identifying four intrapersonal
cognitions that cause employees to experience a feeling of empowerment. Drawing on work
redesign theory (Hackman and Oldham, 1976) and expectancy theory (Lawler, 1973), they
defined empowerment as a heightened level of intrinsic task motivation or internalized
commitment to a task. According to their model, an employee makes personal assessments of
four aspects of a task: impact, competence, meaningfulness, and choice. To the extent that an
employee makes positive assessments of these four aspects of the task, he or she will feel a
heightened level of intrinsic task motivation and therefore be empowered (see also Petter, et al.,
2002). Similarly, Spreitzer (1995, 1996) described employee empowerment as a motivational
construct evident in four cognitions: meaning, competence, self-determination (Thomas and
Velthouse‘s ―choice‖), and impact. As she explains, ―together, these four cognitions reflect an
active, rather than a passive, orientation to a work role. By active orientation, I mean an
orientation in which an individual wishes and feels able to shape his or her work role and
context‖ (1995, p. 1444). These four elements of psychological empowerment are argued to
work additively to influence employee effectiveness and innovativeness.
Despite these disagreements over the meaning of employee empowerment as a theoretical
construct, leading empowerment scholars seem to agree that there is an empowerment process by
which managerial interventions influence employee cognitions and behavior resulting in
improved performance. Conger and Kanungo (1988), who emphasized the psychological aspects
of empowerment, view empowerment as part of a process geared towards ―enhancing feelings of

7 | P a g e
self-efficacy among organizational members through the identification of conditions that foster
powerlessness and through their removal by both formal organizational practices and informal
techniques of providing efficacy information‖ (p. 474). In a similar vein, Thomas and
Velthouse, who favor the view of empowerment as a psychological construct, acknowledge the
effects of deliberative attempts by managers to influence the cognitive assessments leading to an
empowered state of mind. Management interventions that promote intrinsic task motivation (i.e.,
empowerment) include delegation, competence-based pay, work that is meaningful, and a
charismatic supervisory style.
Central to Spreitzer‘s (1995) model of psychological empowerment are a set of
antecedents—locus of control, self-esteem, access to information, and rewards—that are said to
influence the four cognitions evincing empowerment. In proposing these antecedents, Spreitzer
has suggested that for psychological empowerment to occur, some of the ingredients from
Bowen and Lawler‘s empowerment approach—including providing information about
organizational goals and performance, granting discretion, and offering rewards based on
performance—must take place first. Essentially, she is redefining the relational construct of
empowerment as a set of practices that trigger or bring about psychological empowerment.
A Model of the Empowerment Process
A theoretical model of the employee empowerment process is described in this section.
Employee empowerment is conceived of as a set of four management practices (sharing
authority, resources, information, and rewards with employees) identified by Bowen and Lawler.
Employee empowerment should have a direct effect on performance. It should also indirectly
affect performance by influencing employee innovativeness and job satisfaction, both of which

8 | P a g e
will affect performance. Each of the links in this hypothesized causal structure is described
below (see Figure 1).
Empowerment and Performance
An employee empowerment approach—defined by Bowen and Lawler (1992, 1995) as a
set of practices aimed at sharing information, rewards, job related knowledge, and authority with
employees—should have a direct positive effect on performance. The added discretion granted
to empowered employees provides them with the flexibility to adapt to unforeseen
circumstances, to improve the quality of interactions with service recipients, and to make more
productive use of their time (Bowen and Lawler, 1992, 1995; Langbein, 2000). Discretion is
particularly important for performance as task complexity and environmental turbulence increase
(see Burns and Stalker, 1961; Landau and Stoudt, 1979), since these conditions place a premium
on the ability to adapt. Empowerment also enhances the technical knowledge and capabilities of
employees, enabling them to perform tasks more effectively (Bowen and Lawler, 1992, 1995;
Lawler, Mohrman and Ledford, 1995). Goal setting and feedback, activities emphasized in an
empowerment approach, also have a significant bearing on employee effort and performance. A
wide range of studies have shown that setting goals, especially more challenging ones, results in
increased effort and persistence in the face of setbacks (see Locke and Latham, 1990; Latham
and Locke, 1991). More specific goals also focus effort in the desired direction by
communicating priorities to employees. Performance feedback alerts employees of errors and
can include suggestions for correcting such errors.
--- Insert Figure 1 about here ---

9 | P a g e
Empowerment and Innovativeness
Empirical evidence exists of strong relationships between the empowerment practices
described by Bowen and Lawler and innovativeness, including both encouragement to innovate
and actual innovative behavior. Granting discretion to employees is particularly important for
initiation of innovation, as it provides autonomy to act in new and creative ways that depart from
standard operating procedures (Pierce and Delbecq, 1977; Kanter, 1982; Fernandez and
Mondogaziev, 2011). Training and development can serve as channels for the diffusion of
innovations, as employees learn about and introduce ideas applied successfully in other
organizations. Training and development improves an employee‘s ability to diagnose and solve
technical problems (Hurley and Hult, 1998; Damanpour, 1991; Thompson, 1965; Katz and
Tushman, 1981), thus increasing the odds that innovative proposals will be designed and
implemented successfully (McGinnis and Ackelsberg, 1983; Dewar and Dutton, 1986). Goal-
setting conveys organizational priorities and encourages achievement-oriented employees to seek
out or invent new strategies and tactics for attaining those goals. Importantly, negative feedback
indicative of failure induces search for innovative solutions to problems (Cyert and March, 1963;
Manns and March, 1978; Fernandez and Wise, 2010).
Empowerment and Job Satisfaction
Large scale longitudinal studies conducted during the 1990s showed that empowerment
and high involvement management practices are effective and increasing employee job
satisfaction (Lawler, Mohrman, and Ledford, Jr., 1992; 1995). Several studies on the use of
empowerment in public organizations indicate an employee empowerment approach is among
the strongest predictors of job satisfaction among public employees (Lee, Cayer and Lan, 2006;
Wright and Kim, 2004). Kim and Wright (2004) suggest this effect is indirect, so that

10 | P a g e
empowerment increases job satisfaction through further development and growth opportunities,
increased task significance, and increased communication and feedback. Empowerment
practices are designed to incentivize employees through the introduction of different intrinsic
(feedback, autonomy) and extrinsic rewards (merit-based pay, training opportunities). Research
based on the job characteristics model (Oldham and Hackman, 1976) has shown consistently
strong correlations between intrinsic job characteristics and job satisfaction and other employee
attitudes, particularly when subjective measures of intrinsic job characteristics are used (Fried
and Ferris, 1987; Glick, Jenkins and Gupta, 1986; Glisson and Durick, 1988). The general
argument is that jobs that are intrinsically rewarding increase employee satisfaction by enriching
their work, making it more challenging and fulfilling (Oldham and Hackman, 1976).
Intrinsic job characteristics appear to have a stronger impact on job satisfaction than
extrinsic rewards (Deci, 1972; O‘Reilly and Caldwell, 1980; Mottaz, 1985; Judge, et al., 1998).
This is not to suggest, however, that introducing extrinsic rewards such as merit based pay, a key
empowerment practice, will not improve job satisfaction. Indeed, a large body of research shows
pay and other extrinsic rewards can be used effectively to increase effort, performance and job
satisfaction (Green and Haywood, 2008; O‘Reilly and Caldwell, 1980; Mottaz, 1985; Lawler,
Mohrman, and Ledford, 1992, 1995), even among public sector employees with higher levels of
public service motivation (Rainey, 1982; Wittmer, 1991; Wright, 2007; Alonso and Lewis, 2001;
Perry, Mesch, and Paarlberg, 2006).
Innovativeness and Performance
In a dynamic external environment, more adaptable organizations capable of undergoing
changes in function and form tend to perform better and are more likely to survive. Innovation
represents a vital form of organizational learning and adaptation (Simon 1997). Product and

11 | P a g e
technological innovations continue to be key sources of performance improvement and
competitive advantage for private sector firms (Porter, 1985; Christensen, 1997; Fagerberg,
Mowery and Nelson, 2006). New Public Management reforms, especially those undertaken in
the United States, Australia and the United Kingdom, has stressed innovation as a way to
improve public sector performance (Gore, 1993; Kettl, 2005; Kamensky, 1996; Breul and
Kamensky, 2008; Bartos, 2003; O‘Flynn, 2007; Australian National Audit Office, 2009; Pollitt
and Bouckaert, 2004). The importance of innovation has prompted governments in those and
other countries to develop separate appraisal and reward systems that operate in parallel to
annual performance appraisal and merit pay systems in order to evaluate the efficacy of
innovative ideas and reward employees for developing them (Fernandez and Pitts, 2011
forthcoming). The benefits of organizational change and innovation are not always realized,
however, as many innovative ideas are poorly conceived or fail during their implementation
(Hartley, 2005). Organizational change can be very disruptive, adversely affecting performance
to the point of organizational decline and death (Amburgey, Kelly and Barnett, 1993). In short,
the impact of innovativeness on performance should be positive in the long-term but marginal or
even negative in the short-term until new processes can be learned and institutionalized
(Fernandez and Rainey, 2006).
The relationship between performance and innovativeness appears to be simultaneous,
with poor or substandard performance encouraging innovative behavior. As Cyert and March
(1963) argued, ―Failure induces search and search ordinarily results in solutions. Consequently,
we would predict that, everything else being equal, relatively unsuccessful firms would be more
likely to innovate [that is, come up with new solutions to a problem] than relatively successful
firms (p. 188).‖ Research by others supports the notion that necessity is the mother of invention

12 | P a g e
(Manns and March, 1978; Williamson, 1975; Chandler, 1977; March and Simon, 1993;
Fernandez and Wise, 2010; Borins, 2011 forthcoming). The link between poor performance and
innovativeness appears to be particularly strong among early adopters of an innovation (Bolton,
1993) and for problem-oriented innovations, which are justifiable in the short run and are linked
directly to a problem (Cyert and March, 1963).
Job Satisfaction and Performance
For many decades, job satisfaction and morale have been studied as antecedents of
individual performance. The most comprehensive meta-analyses of empirical studies of the job
satisfaction-performance relationship show that the two concepts correlate at about the r = 0.30
level, with higher correlations for more complex jobs (see Judge, et al., 2001). An earlier meta-
analysis indicated that the strength of the job satisfaction-performance relationship varies by
aspect of job, with much lower correlations for satisfaction with pay and higher correlations with
intrinsic features of the job (Iaffaldano and Muchinsky, 1985). Job satisfaction can directly
improve performance by improving levels of energy, activity and creativity and by enhancing
memory and analytical abilities (Judge, et al., 2001‘ Brief and Weiss, 2002; Isen and Baron,
1991). It can also indirectly improve performance by increasing organizational commitment and
organizational citizenship behavior and reducing turnover and absenteeism (Judge, et al., 2001;
Cooper-Hakim and Viswesvaran, 2005; Dalal, 2005; Harrison, Newman, and Roth, 2006; Meyer,
et al., 2002; LePine, Erez and Johnson, 2002).
Measurement, Data and Methods
This section provides a description of variables, data, and statistical techniques used in
the empirical analysis.
13 | P a g e
Variables
The four main variables in the analysis are empowerment, innovativeness, job
satisfaction, and performance. All four variables are treated as latent variables measured using
multiple observable indicators.
Employee empowerment is conceived of as a multi-faceted management approach
composed of four practices: providing information about goals and performance; offering
rewards based on performance; providing access to job related knowledge and skills; and
granting discretion to change work processes (Bowen and Lawler, 1992; 1995). The latent
variable empowerment is measured using four observable indicators representing the four
practices listed above. Each of these observable indicators is in the form of a summated scale
created from multiple survey items from the 2010 FEVS. The Cronbach‘s alphas for these scales
range from 0.74 for the practice of providing access to job related knowledge and skills to 0.88
for the practice of offering rewards based on performance. A previously conducted confirmatory
factor analysis of this four dimensional definition of employee empowerment showed good
levels of both convergent and discriminant validityi. All observable indicators used to measure
latent variables are shown in Appendix 1.
The latent variable innovativeness is measured using two observable indicators from the
2010 FEVS. These two indicators capture both a feeling of encouragement to innovate (see
Locke and Latham, 2004) and innovative behavior on the part of the employee.
The latent variable job satisfaction is measured using two observable indicators from the
2010 FEVS. These indicators capture overall or global perceptions of job satisfaction with work
and not satisfaction with particular aspects of work. Summated rating scales created from
indicators of satisfaction with different aspects of work (e.g., pay, benefits, promotional

14 | P a g e
opportunities) do not correlate very highly with global measures of job satisfaction (e.g., overall
satisfaction with job, work, or organization), causing some scholars to question the validity of
using such scales to measure overall satisfaction (Judge and Church, 2000).
The latent variable performance is measured using two observable indicators from the
2010 FEVS. The indicators are perceptual and internal measures of work unit performance and
agency performance in accomplishing its mission. The limitations to using such measures of
performance are discussed below.
Data
The data for the analysis are derived from the 2010 Federal Employee Viewpoint Survey
(FEVS) conducted by the U.S. Office of Personnel Management (OPM). The 2010 FEVS was
administered electronically via the Internet (with limited distribution of paper surveys to those
without Internet access) to 504,609 federal government employees at three supervisory levels:
non-supervisor/team leader, supervisor, and manager/senior executive. The government-wide
response rate was fifty-two percent (N = 263,475). Respondents worked for eighty-one cabinet-
level and smaller independent agencies representing ninety-seven percent of the executive
branch workforce. OPM used a stratified sampling technique to produce generalizable results for
each individual agency as well as the entire federal government; in some of the smaller agencies,
all employees were surveyed. Out of the 263,475 respondents to the survey, 197,466 or
approximately 75% are included in the final analysis, with the remaining observations dropped
due to missing data on one or more variables. No meaningful differences were found between
observations dropped from the analysis and those that were included.

15 | P a g e
Model
To test the theoretical model, a structural equation model with the following set of
equations is developed. The non-recursive model of the effects of empowerment on
innovativeness, job satisfaction, and performance has the following structure
Four empowerment practice equations:
(1)
(2)
(3)
(4)
Innovativeness equations:
(5)
(6)
Job satisfaction equations:
(7)
(8)
Performance equations:
(9)
Measurement models for outcomes:
(10)
(11)
(12)
In matrix notation, the set of equations is re-stated as:
(13)
(14)
(15)
Model Covariance/Correlation Matrix and the Fitting Function:ii
The implied covariance matrix in the model has the components, where:
( ) (16)
( ) ( ) ( )[( ) ] (17)
( ) ( ) (18)
16 | P a g e
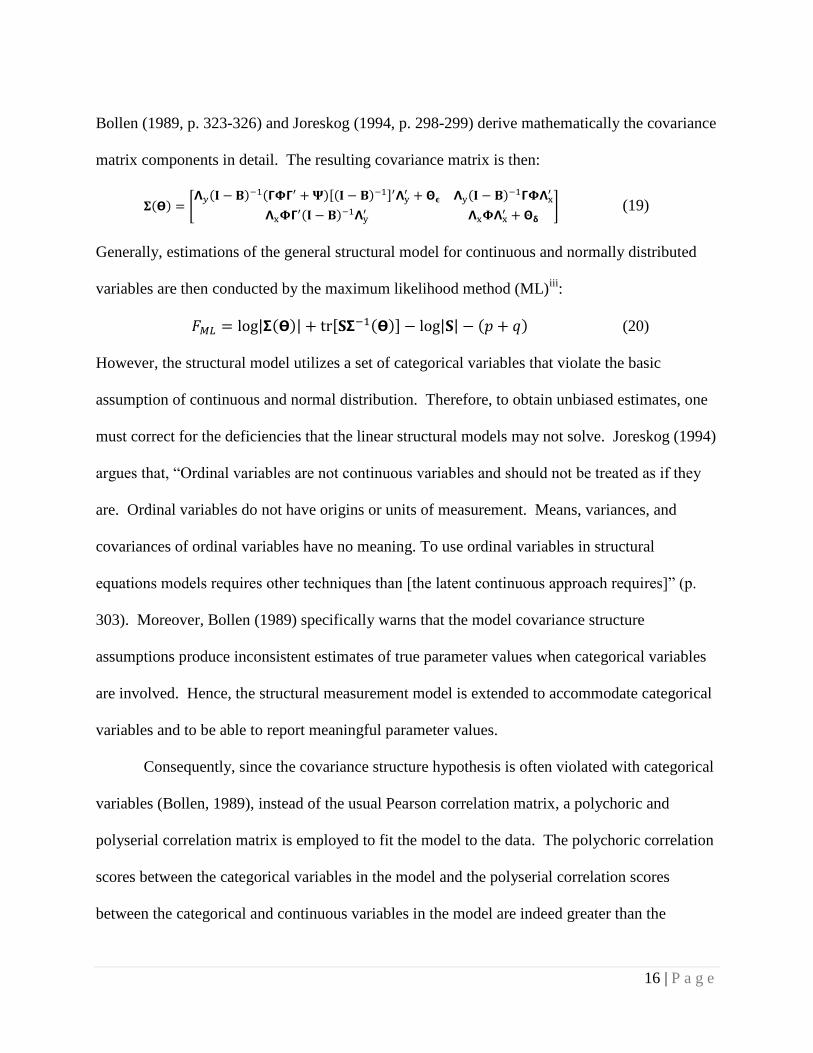
Bollen (1989, p. 323-326) and Joreskog (1994, p. 298-299) derive mathematically the covariance
matrix components in detail. The resulting covariance matrix is then:
( ) [ ( ) ( )[( ) ]
( )
( )
] (19)
Generally, estimations of the general structural model for continuous and normally distributed
variables are then conducted by the maximum likelihood method (ML)iii
:
| ( )| [ ( )] | | ( ) (20)
However, the structural model utilizes a set of categorical variables that violate the basic
assumption of continuous and normal distribution. Therefore, to obtain unbiased estimates, one
must correct for the deficiencies that the linear structural models may not solve. Joreskog (1994)
argues that, ―Ordinal variables are not continuous variables and should not be treated as if they
are. Ordinal variables do not have origins or units of measurement. Means, variances, and
covariances of ordinal variables have no meaning. To use ordinal variables in structural
equations models requires other techniques than [the latent continuous approach requires]‖ (p.
303). Moreover, Bollen (1989) specifically warns that the model covariance structure
assumptions produce inconsistent estimates of true parameter values when categorical variables
are involved. Hence, the structural measurement model is extended to accommodate categorical
variables and to be able to report meaningful parameter values.
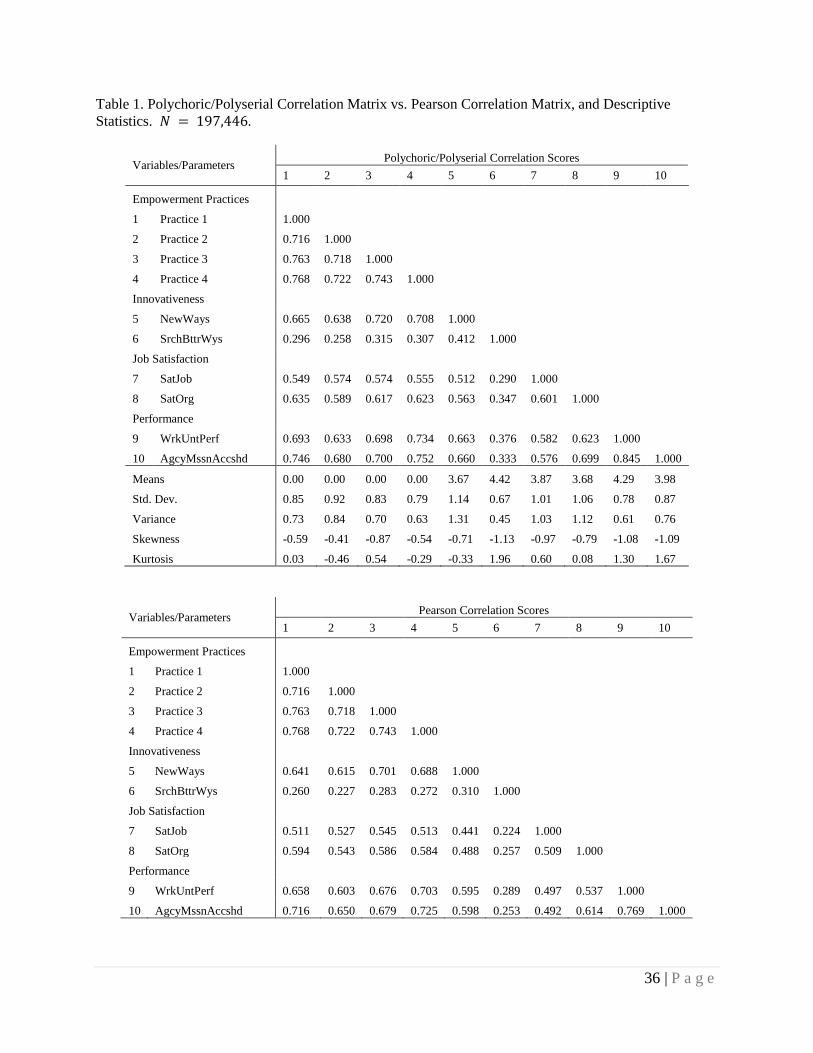
Consequently, since the covariance structure hypothesis is often violated with categorical
variables (Bollen, 1989), instead of the usual Pearson correlation matrix, a polychoric and
polyserial correlation matrix is employed to fit the model to the data. The polychoric correlation
scores between the categorical variables in the model and the polyserial correlation scores
between the categorical and continuous variables in the model are indeed greater than the

17 | P a g e
Pearson counterparts, as statistical theory predicts. Table 1 provides these correlation scores for
all the observed variables in the model. In every instance where a categorical variable is
involved, we observe attenuation in Pearson correlation scores. Thus, there is some indication
that the covariance structure hypothesis may be violated in the data. Furthermore, categorical
variables are more likely to be accompanied by skewness and kurtosis in distribution. Byrne
(2009), Muthen and Kaplan (1985), and Bollen (1989) suggest that skewness and kurtosis greater
than the absolute value of unity tend to distort the results produced by , which is the
traditional method utilized for the continuous and normally distributed variables. Skewness and
kurtosis greater than +/- 1 are indeed present in some of the categorical variables in the model.
These descriptive statistics for the variables in the model are also provided in Tables 1 and 2.
--- Insert Table 1 about here ---
A two-step procedure is followed to fit the non-recursive structural model of the effects
of empowerment on innovativeness, job satisfaction, and performance as discussed in Muthen
and Kaplan (1985), Bollen (1989), Joreskog (1994), Byrne (2009), and Kline (2011). The first
step involves estimating a polychoric/polyserial correlation matrix. This corrected matrix
(correction is from the default Pearson scores) is then used in the weighted least squares
estimation of the model fit in the second step. Finney and DiStefano (2006) labeled this two-step
process the categorical variable methodology (CVM). According to these authors, CVM is then
an asymptotically distribution free (ADF) estimator using a WLS approach. The usual caveat,
however, is that the CVM must be employed with large sample data; which is not a problem in
this study given a sample size of nearly 200,000 observations (see Kline, 2011; Finney and
DiStefano, 2006).

18 | P a g e
Since there are six categorical variables (observable indicators) in the model that are
measured on a five-point scale, the thresholds corresponding to the categorical distribution of
these variables are also estimated (Joreskog, 1994; Bollen, 1989)iv
. These thresholds produce a
non-linear function that relates the categorical variables to the latent implied variables. Hence,
for the y variables the non-linear function is:
{
(21)
With this function in place and the polychoric/polyserial correlation matrix computed, a
structural model can be fitted to the data. This can most easily be achieved by the weighted least
squares (WLS) methodv:
[ ̂] [ ̂] (22)
Results
The results of the non-recursive structural measurement model indicate that the data has a
very strong fit to the theoretical framework proposed in this papervi
. Most of the hypothesized
relationships are supported and are statistically significant. Empowerment has a sizable and
highly significant association with all three variables of interest – innovativeness, job satisfaction,
and performance. When empowerment goes up by one standard deviation, the measure of job
satisfaction goes up by 0.894 standard deviations, ceteris paribus ( ).
Similarly, a one standard deviation increase in empowerment is associated with a 0.762 standard
deviation increase in innovativeness, all else constant ( ). The association
between empowerment and performance is the third largest in terms of magnitude of the effect,
yet still rather sizable. One standard deviation increase in empowerment is found to have a 0.552

19 | P a g e
standard deviation increase effect on the measure of performance, all held constant (
).
--- Insert Table 2 about here ---
The results of the analysis also suggest that there is a significant and positive association
between job satisfaction and performance. When job satisfaction goes up by one standard
deviation, performance appears to go up by 0.438 standard deviations, all else equal (
). Innovativeness and performance are found to have statistically significant
but substantively small reciprocal effects. A one standard deviation increase in innovativeness is
associated with a 0.078 standard deviations drop in performance, ceteris paribus (
). At the same time, the effect of performance on innovativeness appears to
be positive, albeit still not very sizable. The results suggest that when performance goes up by
one standard deviation, innovativeness increases by 0.089 standard deviations, all else constant
( ) Consequently, it may be concluded that innovativeness (performance)
has a negative (positive) (dis-) attenuating effect on performance (innovativeness).
--- Insert Table 3 about here ---
The correlation residual and standardized residual matrices are examined next to assess
whether the model explains the corresponding sample correlation sufficiently well. Table 4
contains these estimated scores for the variables in the model. None of the unstandardized
covariance residuals (absolute values of fitted residuals) are greater than the widely excepted
threshold level of 0.10vii
. Thus, the model implied correlation matrix explains sufficiently well
the sample correlation matrix. The choice of utilizing a polychoric/ polyserial correlation matrix
(for ordered-ordered/ordered-continuous variables) is well justified.

20 | P a g e
The various fit statistics for the non-recursive structural model of the effects of
empowerment on innovativeness, job satisfaction, and performance indicate a fairly solid model.
The Joreskog-Sorbom goodness of fit index (GFI) and the adjusted GFI are greater than the
conventional 0.90 threshold, suggesting a strong model fit. Similarly, the Bentler comparative fit
index (CFI), the Bentler-Bonner normalized fit index (NFI), and the Tucker-Lewis index (TLI)
all achieve the required values of significance greater than 0.90 (See Maruyama, 1998;
Schumacker and Lomax, 2004; Kline, 2011). Furthermore, the value of the root mean square
residuals is equal to 0.077, which comfortably passes the 0.10 cut-off point for large-sample data
sets (see Kline, 2011; Jaccard and Wan, 1996). The standardized root mean square residual
index is 0.023, which is also indicative of a strong model fit. Other fit scalars such as the Chi-
square statistic or BIC are highly significant, thus suggestive of model misfit (33,807 and 33,453
respectively). However, both of these values are a function of sample size. Given the extremely
large sample size of almost 200,000 observations used in this study, these last two scalars should
not diminish the fit of the model.
--- Insert Table 4 about here ---
The non-recursive structural model was selected from the two other competing
(theoretically) recursive models. The first one was a recursive model, similar to the main model,
without the feedback loop to innovativeness from performance. The second one was a recursive
model that had innovativeness, job satisfaction, and performance as outcomes of empowerment,
where the outcomes were assumed to have no causal associations among themselves. Likelihood
ratio tests were performed to evaluate these competing modelsviii
. The results indicate the non-
recursive structural model is the preferred specification. In addition to likelihood ratio tests, the
Bayesian Information Criterions (BIC) for these models suggest very strongly that the recursive

21 | P a g e
specifications are inferior to the non-recursive model (see Burnham and Anderson, 2004 or
Long, 1997 for BIC criterion decisions). The absolute value of difference of BIC measures
between the non-recursive model and the other two scenarios is significant at , thus
offering support in favor of a non-recursive model of the effects of empowerment on
innovativeness, job satisfaction, and performance.
Discussion and Conclusion
Previous research on employee empowerment in the public sector has examined the link
between empowerment practices and various work-related attitudes and performance. These
important contributions to the literature have helped to shed light on pieces of the complex
puzzle that is employee empowerment. This is the first study, however, to develop and test a
model of the employee empowerment process in the public sector, one that accounts for the
direct effect of an employee empowerment approach on performance as well as for its indirect
effects on performance through employee job satisfaction and innovativeness. The empirical
results generally support the theoretical model of the employee empowerment process proposed
in this study.
An employee empowerment approach composed of various practices aimed at sharing
information, resources, rewards and authority with employees has a direct and sizeable positive
effect on performance as perceived by employees. This finding is in line with previous research
from the private (Bowen and Lawler, 1992; 1995; Lawler, Mohrman and Ledford, 1992; 1995)
and public sectors (Fernandez and Moldogaziev, 2011) that offers evidence of the beneficial
effects of empowerment practices on performance. As proposed, it is also found that an
employee empowerment approach indirectly affects performance through its influence on job
satisfaction and innovativeness. The effect of employee empowerment on job satisfaction is

22 | P a g e
positive and even stronger than empowerment‘s direct effect on performance. Job satisfaction,
in turn has a positive effect on performance of a magnitude similar to that shown in previous
meta-analyses of the relationship between job satisfaction and performance (see Judge, et al.,
2001). It appears, then, that by increasing job satisfaction, the use of employee empowerment
practices can also result in improved performance, in addition to these practices‘ direct influence
on performance.
The empirical results also show that an employee empowerment approach has a positive
and sizeable effect on innovativeness, as was hypothesized. This effect is larger than an
employee empowerment‘s direct effect on performance. Innovativeness in turn has a small
negative effect on performance. This is not surprising, given that performance as perceived by
employees is measured at the same point in time as innovativeness. As literature on change and
innovation indicates, innovativeness can have a negative near term effects on performance, given
the start up costs involved in adopting and implementing innovations and the disruptions such
changes can cause (see Fernandez and Rainey, 2006). Over the course of time, however,
innovativeness‘ small near term effect might turn into a positive one, as innovation enables an
organization to better adapt to the demands and challenges imposed by the external environment.
The current study is unable to test for this long term effect, given the limitations posed by cross
sectional data. Additional research is needed to explore this relationship longitudinally. In short,
this finding suggests that the use of empowerment practices to stimulate innovation will not
result in immediate gains in performance, and that managers adopting such an approach must be
patient for the creativity sparked by empowerment to bear fruit in the form of performance
improvements.

23 | P a g e
The model was developed to include a simultaneous relationship between innovativeness
and performance. Surprisingly, performance has a small positive effect on innovativeness. This
suggests that it is success rather than failure that encourages one to become even more
innovative. There are several possible explanations for this unexpected finding. It is important
to note that nearly 70% of the survey respondents were federal employees low on the
organizational hierarchy (i.e., non-supervisors and team leaders). At senior management levels,
failure may indeed induce search for solutions, as Cyert and March argued. At the frontlines,
however, a mere sign of declining performance may not be enough to induce search, as
employees wait for directives from above before undertaking meaningful changes. Also,
performance problems may need to be acute before innovation is encouraged. The measures of
performance used in this study, however, do not allow one to gauge the seriousness of problems
perceived by employees. Finally, the indicators used to measure performance capture work unit
and organizational performance and not individual performance. For employees to feel the urge
to innovate, their own performance may have to be inadequate and not just that of others around
them.
Several limitations to the study point to the need for additional research on employee
empowerment in the public sector. As indicated previously, additional research is needed to
analyze the effects of empowerment and innovativeness on performance at various points in
time, and not just in the near term. Moreover, the model tested here, although it represents an
attempt to model the process by which empowerment practices influence cognition and
ultimately performance, is a simplified model that leaves out other key cognitions that may be
linked to both empowerment practices and performance. Particularly promising would be
analyses that estimate the effects of empowerment practices on self-efficacy, organizational

24 | P a g e
commitment, and public service motivation, three cognitions that have been found to be
positively related to performance in the public sector.
Another limitation of the study is the limited number of observable indicators used to
measure some of the latent constructs. While most of the conventional fit statistics point to a
good model fit, they also suggest room for improvement. In particular, the measurement model
could be improved by using additional indicators to measure innovativeness and performance.
One potential limitation is the use of self-reported data gathered from a single survey, a
situation that may lead to common method bias. Common method bias is generally believed to
produce artificially inflated correlations (Crampton & Wagner, 1994), although in some cases the
bias can also deflate correlations (Cote & Buckley, 1988; Podsakoff, MacKenzie, Lee, &
Podsakoff, 2003). The fit statistics indicate a good model fit for the causal model, and a previous
confirmatory factor analysis of the empowerment measure indicated an adequate level of
discriminant validity. In addition, a simple Harman test of all the indicators in the study results
in a multiple factor solution. These results, although not refuting the presence of common
method bias, fail to produce convincing evidence that it indeed exists. Crampton and Wagner
(1994) concluded that although researchers need to be aware of possible common method biases,
overall this problem appears to enjoy an undue level of attention. These authors find that on
average the common method bias ―is neither dominant nor absent‖ (Crampton & Wagner, 1994,
p. 73). In any event, care should be taken in interpreting the results of this analysis.
Finally, the particular type of measure of performance used in this study—a perceptual
and internal measure of performance—raises the question of how closely correlated this type of
measure is with other ones, such as more objective measures of performance based on archival
records and others that rely on external perceptions or observations. Meta-analyses of the

25 | P a g e
relationship between perceptual and objective measures of performance show results ranging
from a weak correlation between the two types of measures (r = .27, not statistically significant,
Heneman, 1986) to higher but still modest correlations (r = .30, Bommer, et al., 1995). In
regards to the distinction between internal and external measures of performance, Qalker and
Boyne (2006) observed that ―a range of evidence demonstrates that there are positive statistically
significant correlations between external and internal measures of overall performance, some in
the region of r = 0.8‖ (p. 378). They note, however, that those findings are only achieved when
measures of the same dimension of performance are used. Thus, the measure of performance
used in this study can serve as a reasonable proxy for other types of measures but is not a
substitute for them. Additional research is needed using a variety of measures of performance,
including more objective and external ones, as well as measures of performance that capture the
different dimensions of performance, like efficiency, effectiveness, and timeliness, which often
present public managers with difficult but interesting tradeoffs.

26 | P a g e
References
Alonso, P. and Lewis, G. B. 2001. ―Public Service Motivation and Job Performance: Evidence
from the Federal Sector.‖ American Review of Public Administration, 31: 363-380.
Amburgey, T. L., Kelly, D. and Barnett, W. P. 1993 ―Resetting the Clock: The Dynamics of
Organizational Change and Failure.‖ Administrative Science Quarterly, 38: 51-73.
Argyris, C. 1957. Personality and Organization. New York: Harper Collins.
Australian National Audit Office. 2009. Innovation in the Public Sector: Enabling Better
Performance, Driving New Direction. Better Practice Guide. Canberra, Australian
Capital Territory: Australian National Audit Office.
Bandura, A. 1986. Social Foundations of Thought and Action: A Social Cognitive Theory.
Englewood Cliffs, NJ: Prentice-Hall.
Bartos, S. 2003. ―Creating and Sustaining Innovation.‖ Australian Journal of Public
Administration, 62: 9-14.
Bollen, K. A. 1989. Structural Equations with Latent Variables. New York: John Wiley &
Sons.
Bolton, M. K. 1993. ―Organizational Innovation and Substandard Performance: When Is
Necessity the Mother of Innovation?‖ Organization Science, 4: 57-75.
Borins, S. F. 2011, forthcoming. ―Making Narrative Count: A Narratological Approach to
Public Management Innovation.‖ Journal of Public Administration Research and Theory.
Bowen, D. E. and Lawler, E. E. 1992. "The Empowerment of Service Workers: What, Why,
How, and When." Sloan Management Review, 33: 31-39.
Bowen, D. E. and Lawler, E. E. 1995. ―Empowering Service Employees.‖ Sloan Management
Review, 36:73-84.
Breul, J. D. and Kamensky, J. M. 2008. ―Federal Government Reforms: Lessons from Clinton‘s
‗Reinventing Government‘ and Bush‘s ‗Management Agenda‘ Initiatives.‖ Public
Administration Review, 68: 1009-1026.
Brief, A. P. and Weiss, H. M. 2002. ―Organizational Behavior: Affect in the Workplace.‖
Annual Review of Psychology, 53: 279–307.
Burnham, K. P. and Anderson, D. R. 2004. ―Multi-Model Inference: Understanding AIC and
BIC in Model Selection.‖ Sociological Methods and Research, 33: 261-304.
Burns, T. and Stalker, G. M. 1961. The Management of Innovation. London: Tavistock.

27 | P a g e
Byrne, B. M. 2010. Structural Equation Models with AMOS: Basic Concepts, Applications, and
Programming. Second Edition. New York: Taylor and Francis Group, LLC.
Chandler, A. D. 1977. The Visible Hand: The Managerial Revolution in American Business.
Cambridge, Massachusetts: MIT Press.
Christensen, C. M. 1997. The Innovator's Dilemma: When New Technologies Cause Great
Firms to Fail. Cambridge, Massachusetts: Harvard Business Press.
Cooper-Hakim, A. and Viswesvaran, C. 2005. ―The Construct of Work Commitment: Testing
an Integrative Framework.‖ Psychological Bulletin, 131: 241–259.
Conger, J.A. and Kanungo, R.N. 1988. ―The Empowerment Process: Integrating Theory and
Practice.‖ Academy of Management Review, 13: 471-482.
Cyert, R. M. & March, J. G. 1963. A behavioural Theory of the Firm. Upper Saddle River, New
Jersey: Prentice Hall.
Dalal, R. S. 2005. ―A Meta-Analysis of the Relationship between Organizational Citizenship
Behavior and Counterproductive Work Behavior,‖ Journal of Applied Psychology, 90:
1241–1255.
Damanpour, F. 1991. ―Organizational Innovation: A Meta-analysis of Effects of Determinants
and Moderators.‖ Academy of Management Journal, 34: 555-590.
Deci, E. L. 1972. ―The Effects of Contingent and Noncontingent Rewards and Controls on
Intrinsic Motivation.‖ Organizational Performance and Behavior, 8: 217-229.
Dewar, R. and Dutton, J. 1986. ―The Adoption of Radical and Incremental Innovation: An
Empirical Analysis.‖ Management Science, 32: 14-31.
Fagerberg, J., Mowery, D. C. and Nelson, R. R. (Eds.). 2006. The Oxford Handbook of
Innovation . Oxford, UK: Oxford University Press.
Fernandez, S. and Moldogaziev, T. 2011. ―Empowering Public Sector Employees to Improve
Performance: Does it Work?‖ American Review of Public Administration, 41: 23-47.
Fernandez, S. and Pitts, D. W. 2011 forthcoming. ―Understanding Employee Motivation to
Innovate: Evidence from Front Line Employees in U.S. Federal Agencies.‖ Australian
Journal of Public Administration.
Fernandez, S. and Rainey, H. G. 2006. ―Managing Successful Organizational Change in the
Public Sector: An Agenda for Research and Practice.‖ Public Administration Review, 66:
168-176.

28 | P a g e
Fernandez, S. and Wise, L. R. 2010. ―An Exploration of Why Public Organizations ‗Ingest‘
Innovations.‖ Public Administration, 88: 979-998.
Finney, S. J. and DiStefano, C. 2006. ―Non-Normal and Categorical Data in Structural Equation
Modeling.‖ In Hancock, G. R. and Mueller, R. O. (Eds.). Structural Equation Modeling.
A Second Course. Charlotte, NC: Information Age Publishing, Inc.
Follett, M. P. 1926. "Giving of Orders." In Metcalf, H. C. (Ed.). Scientific Foundations of
Business Administration. Baltimore, Maryland: Williams and Wilkins Company.
Fornell, C. and Larcker, D. F. 1981. ―Evaluating Structural Equation Models with
Unobservable Variables and Measurement Error.‖ Journal of Marketing Research, 18:
39-50.
Fornell, C. and Larcker, D. F. 1981. ―Structural Equation Models with Unobservable Variables
and Measurement Error: Algebra and Statistics.‖ Journal of Marketing Research, 18:
382-388.
Fox, J. 2009. ―Structural Equation Modeling with SEM Package in R.‖ Structural Equation
Modeling, 13: 465-486.
Fried, Y. and Ferris, G. R. 1987. ―The Validity of the Job Characteristics Model: A Review and
Meta-Analysis.‖ Personnel Psychology, 40: 287-322.
Glick, W. H., Jenkins, J. D. and Gupta, N. 1986. ―Model versus Substance: How Strong Are
Underlying Relationships between Job Characteristics and Attitudinal Outcomes?‖ The
Academy of Management Journal, 29: 441-464.
Glisson, C. and Durick, M. 1988. ―Predictors of Job Satisfaction and Organizational
Commitment in Human Service Organizations.‖ Administrative Science Quarterly, 33:
61-81.
Gore, A. 1993. From Red Tape to Results: Creating a Government That Works Better and
Costs Less. Report of the National Performance Review. Washington, D.C.
Greene, C. and Haywood, J. S. 2008. ―Does Performance Pay Increase Job Satisfaction?‖
Economica, 75: 710-728.
Guthrie, J. 2001. ―High-Involvement Work Practices, Turnover, and Productivity: Evidence
from New Zealand.‖ Academy of Management Journal, 44: 180-192.
Hackman, J.R. and Oldham, G.R. 1976. ―Motivation Through the Design of Work: Test of A
Theory.‖ Organizational Behavior and Human Performance, 16: 250-279.

29 | P a g e
Harrison, D. A., Newman, D. A. and Roth, P. L. 2006. ―How Important are Job Attitudes?
Meta-Analytic Comparisons of Integrative Behavioral Outcomes and Time Sequences.‖
Academy of Management Journal, 49: 305–325.
Hartley, J. 2005. ―Innovation in Governance and Public Services: Past and Present.‖ Public
Money, 25: 27-34.
Herrenkohl, R.C., Judson, G.T. and Heffner, J.A. 1999. ―Defining and Measuring Employee
Empowerment.‖ Journal of Applied Behavioral Science, 35: 373-389.
Hipp, J. R. and Bollen, K. A. 2003. ―Model Fit in Structural Equation Models with Censored,
Ordinal, and Dichotomous Variables: Testing Vanishing Tetrads.‖ Sociological
Methodology, 33: 267-305.
Hurley, R. F. and Hult, G. T. M. 1998. ―Innovation, Market Orientation, and Organizational
Learning: An Integration and Empirical Examination.‖ Journal of Marketing: 62: 42-54.
Iaffaldano, M. T. and Muchinsky, P. M. 1985. ―Job Satisfaction and Job Performance: A Meta-
Analysis.‖ Psychological Bulletin, 97: 251-273.
Isen, A. M. and Baron, R. A. 1991. ―Positive Affect as a Factor in Organizational Behavior.‖
Research in Organizational Behavior, 13: 1–53.
Jaccard, J. and Wan, C. K. 1996. LISREL Approaches to Interaction Effects in Multiple
Regression. Thousand Oaks, California: Sage.
Joreskog, K. G. 1994. ―Structural Equation Modeling with Ordinal Variables.‖ IMS Lecture
Notes-Monograph Series, 24: 297-310.
Judge, T. A. and Church, A. H. 2000. ―Job Satisfaction: Research and Practice.‖ In Cooper, C.
L. and Locke, E. A. (Eds.) Industrial and Organizational Psychology. Oxford:
Blackwell.
Judge, T. A., Locke, E. A., Durham, C. C. and Kluger, A. N. 1998. ―Dispositional Effects on
Job and Life Satisfaction: The Role of Core Evaluations.‖ Journal of Applied Psychology,
83: 17-34.
Judge, T. A., Thoreson, C. J., Bono, J. E. and Patton, G. K. 2001. ―The Job Satisfaction–Job
Performance Relationship: A Qualitative and Quantitative Review.‖ Psychological
Bulletin, 127: 376–407.
Kamensky, J. 1996. ―Role of ‗Reinventing Government Movement‘ in Federal Management
Reform.‖ Public Administration Review, 56: 247-255.
Kanter, R. M. 1979. ―Power Failures in Management Circuits. ‖ Harvard Business Review, 57:
65-75.

30 | P a g e
Kanter, R. M. 1982. ―The Middle Manager as Innovator.‖ Harvard Business Review,
July/August: 95-105.
Katz, R. and Tushman, M. 1981. ―An Investigation into the Managerial Roles and Career Paths
of Gate Keepers and Project Supervisors in a Major R&D Facility.‖ R&D Management,
11: 103-110.
Kettl, D.F. 2005. The Global Public Management Revolution: A Report on the Transformation
of Governance. Second Edition. Washington, DC: Brookings Institution Press.
Kim, S. 2002. ―Participative Management and Job Satisfaction: Lessons for Management
Leadership.‖ Public Administration Review, 62: 231-241.
Kirkman, B.L. and Rosen, B. 1999. ―Beyond Self-Management: Antecedents and
Consequences of Team Empowerment.‖ Academy of Management Journal. 42: 58-74.
Kline, R. B. 2011. Principles and Practice of Structural Equation Modeling. Third Edition.
New York: Guilford Press.
Landau, M. and Stout, R. 1979. "To Manage Is Not to Control or the Folly of Type II Errors,"
Public Administration Review, 39: 148-156.
Langbein, L. 2000. ―Ownership, Empowerment and Productivity: Some Empirical Evidence on
the Causes and Consequences of Employee Discretion.‖ Journal of Policy Analysis and
Management, 19: 427-449.
Latham, G. P. and Locke, E. A. 1991. ―Self Regulation through Goal Setting.‖ Organizational
Behavior and Human Decision Processes, 50: 212-247.
Lawler, E.E. 1973. Motivation in Work Organizations. Monterey: Goodyear.
Lawler, E. E. 1986. High-Involvement Management: Participative Strategies for Improving
Organizational Performance. San Francisco: Jossey-Bass.
Lawler, E. E., Mohrman, S. A. and Ledford, G. E. 1992. Employee Involvement and Total
Quality Management: Practices and Results in Fortune 1000 Companies. San Francisco:
Jossey-Bass.
Lawler, E.E. III., Mohrman, S.A. and Ledford, G.E. 1995. Creating High Performance
Organizations: Impact of Employee Involvement and Total Quality Management. San
Francisco: Jossey-Bass.
Lee, H., Cayer, N.J. and Lan, G.Z. 2006. ―Changing Federal Government Employee Attitudes
Since the Civil Service Reform Act of 1978.‖ Review of Public Personnel
Administration, 26: 21-51.

31 | P a g e
LePine, J. A., Erez, A. and Johnson, D. E. 2002. ―The Nature and Dimensionality of
Organizational Citizenship Behavior: A Critical Review and Meta-Analysis.‖ Journal of
Applied Psychology, 87: 52–65.
Likert, R. 1967. The Human Organization. New York: McGraw-Hill.
Locke, E. A. and Latham, G. P. 1990. A Theory of Goal Setting and Task Performance.‖
Englewood Cliffs, New Jersey, Prentice-Hall.
Locke, E. A. and Latham, G. P. 2004. ―What Should We Do about Motivation Theory? Six
Recommendations for the Twenty-First Century.‖ Academy of Management Review, 29:
388-403.
Manns, C. L. and March, J. G. 1978. ―Financial Adversity, Internal Competition, and
Curriculum Change in a University.‖ Administrative Science Quarterly, 23: 541-552.
March, J. and Simon, H. 1993. Organizations. Second Edition. Cambridge, Massachusetts:
Blackwell Publishers.
Maruyama, G. M. 1998. Basics of Structural Equation Modeling. Thousand Oaks, California:
SAGE.
Matheson, C. 2007. ―In Praise of Bureaucracy? A Dissent from Australia.‖ Administration and
Society, 39: 233-261.
McGregor, D. 1960. The Human Side of Enterprise. New York: McGraw-Hill.
McGinnis, M. A. and Ackelsberg, M. R. 1983. ―Effective Innovation Management: Missing
Link in Strategic Planning?‖ Journal of Business Strategy, 4: 59-66.
Meyer, J. P., Stanley, D. J., Herscovitch, L. and Topolnytsky, L. 2002. ―Affective, Continuance,
and Normative Commitment to the Organization: A Meta-Analysis of Antecedents,
Correlates, and Consequences.‖ Journal of Vocational Behavior, 61: 20–52.
Mottaz, C. J. 1985. ―The Relative Importance of Intrinsic and Extrinsic Rewards as
Determinants of Work Satisfaction.‖ Sociological Quarterly, 26: 365-385.
Muthen, B. O. and Kaplan, D. 1985. ―A Comparison of Some Methodologies for the Factor
Analysis of Non-Normal Likert Variables.‖ British Journal of Mathematical and
Statistical Psychology, 38: 171-189.
Nielsen, J. F. and Pedersen, C. P. 2003. ―The Consequences and Limits of Empowerment in
Financial Services.‖ Scandinavian Journal of Management, 19: 63-83.
O‘Flynn, J. 2007. ―From New Public Management to Public Value: Paradigmatic Change and
Managerial Implications.‖ Australian Journal of Public Administration, 66: 353-366.

32 | P a g e
O‘Reilly, C. A. and Caldwell, D. F. 1980. ―Job Choice: The Impact of Intrinsic and Extrinsic
Factors on Subsequent Satisfaction and Commitment.‖ Journal of Applied Psychology,
65: 559-565.
Park, S.M. and Rainey, H.G. 2007. ―Antecedents, Mediators, and Consequences of Affective,
Normative, and Continuance Commitment: Empirical Tests of Commitment Effects in
Federal Agencies.‖ Review of Public Personnel Administration, 27: 197-226.
Perry, J.L., Mesch, D. and Paarlberg, L. 2006. ―Motivating Employees in a New Governance
Era: The Performance Paradigm Revisited.‖ Public Administration Review, 66: 505-514.
Pierce, J. L. and Delbecq, A. L. 1977. ―Organization Structure, Individual Attitudes and
Innovation.‖ Academy of Management Review, 2: 27-37.
Peters, B. G. 1996. The Future of Governing: Four Emerging Models. Lawrence: University
Press of Kansas.
Pollitt, C. 1990. Managerialism and the Public Services. Oxford: Blackwell.
Pollitt, C. and Bouckaert, G. 2004. Public Management Reform. Second Edition. Oxford:
Oxford University Press.
Porter, M. E. 1985. Competitive Advantage. New York: Free Press.
Potterfield, T. A. 1999. The Business of Employee Empowerment: Democracy and Ideology in
the Workplace. Westport, Connecticut: Quorum Books.
Revelle, W. 2007. ―SEM in R and in LISREL.‖ In Book SEM in R and in LISREL. Available
at: http://personality-project.org/r/sem.chap4.pdf.
Schumacker, R. E. and Lomax, R. G. 2004. A Beginner’s Guide to Structural Equation
Modeling. Mahwah, New York: Erlbaum.
Simon, H. A. 1997. Administrative Behavior. Fourth Edition. New York: The Free Press.
Spreitzer, G.M. 1995. ―Psychological Empowerment in the Workplace: Dimensions,
Measurement, and Validation.‖ Academy of Management Journal, 38: 1442-1465.
Spreitzer, G. M. 1996. ―Social Structural Characteristics of Psychological Empowerment.‖
Academy of Management Journal, 39: 483-504.
Thomas, K.W. and Velthouse, B.A. 1990. ―Cognitive Elements of Empowerment: An
‗Interpretive‘ Model of Intrinsic Task Motivation.‖ The Academy of Management Review,
15: 666-681.

33 | P a g e
Thompson, V. A. 1965. ―Bureaucracy and Innovation.‖ Administrative Science Quarterly, 10:
1-20.
Walker, R. M., Damanpour, F. and Devece, C. A. 2011. ―Management Innovation and
Organizational Performance: The Mediating Effect of Performance Management.‖
Journal of Public Administration Research and Theory, 21: 367-386.
Williamson, O. E. 1975. Markets and Hierarchies: Analysis and Antitrust Implications.
New York: Free Press.
Wise, L. R. 2002. ―Public Management Reform: Competing Drivers of Change.‖ Public
Administration Review, 62: 543-554.
Wittmer, D. 1991. ―Serving the People or Serving for Pay: Reward Preferences among
Government, Hybrid Sector, and Business Managers.‖ Public Productivity and
Management Review, 14, 369-383.
Wright, B. E. 2007. ―Public Service and Motivation: Does Mission Matter?‖ Public
Administration Review, 67: 54-64.
Wright, B. E. and Kim, S. 2004. ―Participation‘s Influence on Job Satisfaction: The Importance
of Job Characteristics.‖ Review of Public Personnel Administration, 24: 18-40.

34 | P a g e
Figure 1. Causal Model of the Employee Empowerment Process
Employee
Empowerment
Job
Satisfaction
Innovativeness
Performance

35 | P a g e
Figure 2. Non-Recursive Structural Model of the Effects of Empowerment on Innovativeness, Job Satisfaction, and Performance; Standardized
Coefficients. ADF/WLS Estimation Method using Polychoric/Polyserial Correlation Matrix to Fit the Model to Data. .
36 | P a g e
Table 1. Polychoric/Polyserial Correlation Matrix vs. Pearson Correlation Matrix, and Descriptive
Statistics. .
Variables/Parameters Polychoric/Polyserial Correlation Scores
1 2 3 4 5 6 7 8 9 10
Empowerment Practices
1 Practice 1 1.000
2 Practice 2 0.716 1.000
3 Practice 3 0.763 0.718 1.000
4 Practice 4 0.768 0.722 0.743 1.000
Innovativeness
5 NewWays 0.665 0.638 0.720 0.708 1.000
6 SrchBttrWys 0.296 0.258 0.315 0.307 0.412 1.000
Job Satisfaction
7 SatJob 0.549 0.574 0.574 0.555 0.512 0.290 1.000
8 SatOrg 0.635 0.589 0.617 0.623 0.563 0.347 0.601 1.000
Performance
9 WrkUntPerf 0.693 0.633 0.698 0.734 0.663 0.376 0.582 0.623 1.000
10 AgcyMssnAccshd 0.746 0.680 0.700 0.752 0.660 0.333 0.576 0.699 0.845 1.000
Means 0.00 0.00 0.00 0.00 3.67 4.42 3.87 3.68 4.29 3.98
Std. Dev. 0.85 0.92 0.83 0.79 1.14 0.67 1.01 1.06 0.78 0.87
Variance 0.73 0.84 0.70 0.63 1.31 0.45 1.03 1.12 0.61 0.76
Skewness -0.59 -0.41 -0.87 -0.54 -0.71 -1.13 -0.97 -0.79 -1.08 -1.09
Kurtosis 0.03 -0.46 0.54 -0.29 -0.33 1.96 0.60 0.08 1.30 1.67
Variables/Parameters Pearson Correlation Scores
1 2 3 4 5 6 7 8 9 10
Empowerment Practices
1 Practice 1 1.000
2 Practice 2 0.716 1.000
3 Practice 3 0.763 0.718 1.000
4 Practice 4 0.768 0.722 0.743 1.000
Innovativeness
5 NewWays 0.641 0.615 0.701 0.688 1.000
6 SrchBttrWys 0.260 0.227 0.283 0.272 0.310 1.000
Job Satisfaction
7 SatJob 0.511 0.527 0.545 0.513 0.441 0.224 1.000
8 SatOrg 0.594 0.543 0.586 0.584 0.488 0.257 0.509 1.000
Performance
9 WrkUntPerf 0.658 0.603 0.676 0.703 0.595 0.289 0.497 0.537 1.000
10 AgcyMssnAccshd 0.716 0.650 0.679 0.725 0.598 0.253 0.492 0.614 0.769 1.000

37
Table 2. CVM (ADF/WLS) Estimates and Disturbance Variances for a Non-Recursive Model of the
Effects of Empowerment on Innovativeness, Job Satisfaction, and Performance. .
Parameter Unstandardized
Coefficient S.D. C.R. P
Standardized
Coefficient
Regression weights
Practice 1<--Empowerment 1.064 0.002 474.150 *** 0.871
Practice 2<--Empowerment 1.000
0.819
Practice 3<--Empowerment 1.058 0.002 470.087 *** 0.866
Practice 4<--Empowerment 1.074 0.002 480.689 *** 0.879
NewWays<--Innovate 1.000
0.946
SrchBttrWys<--Innovate 0.460 0.003 170.860 *** 0.436
SatJob<--JobSat 0.958 0.001 643.278 *** 0.900
SatOrg<--JobSat 1.000
0.939
WrkUntPerf<--Performance 0.886 0.003 335.591 *** 0.730
AgcyMssnAccshd<--
Performance 1.000
0.823
Innovate<--Empowerment 0.880 0.012 76.249 *** 0.762
JobSat<--Empowerment 1.026 0.002 444.499 *** 0.894
Performance<--Empowerment 0.555 0.008 66.385 *** 0.552
Performance<--Innovate -0.068 0.007 -9.743 *** -0.078
Performance<--JobSat 0.384 0.004 86.744 *** 0.438
Innovate<--Performance 0.102 0.012 8.188 *** 0.089
Disturbance Variances
Empowerment 0.670 0.003 218.884 *** 1.000
Practice 1 0.241 0.001 251.703 *** 0.241
Practice 2 0.330 0.001 274.541 *** 0.330
Practice 3 0.250 0.001 254.866 *** 0.250
Practice 4 0.227 0.001 247.494 *** 0.227
NewWays 0.105 0.003 30.650 *** 0.105
SrchBttrWys 0.810 0.003 302.445 *** 0.810
Innovativeness 0.265 0.004 75.414 *** 0.296
SatJob 0.191 0.001 209.031 *** 0.191
SatOrg 0.118 0.001 141.627 *** 0.118
Job Satisfaction 0.177 0.001 162.299 *** 0.201
WrkUntPerf 0.467 0.002 253.851 *** 0.467
AgcyMssnAccshd 0.322 0.002 187.286 *** 0.322
Performance 0.130 0.001 88.080 *** 0.191

38
Table 3. CVM (ADF/WLS) Residual Covariance Matrix for a Non-Recursive Model of the Effects of
Empowerment on Innovativeness, Job Satisfaction, and Performance. .
Variables Unstandardized Covariance Residuals
1 2 3 4 5 6 7 8 9 10
Empowerment Practices
1 Practice 1 0.000
2 Practice 2 0.003 0.000
3 Practice 3 0.008 0.009 0.000
4 Practice 4 0.002 0.002 -0.019 0.000
Innovativeness
5 NewWays -0.027 -0.013 0.032 0.009 0.000
6 SrchBttrWys -0.023 -0.042 -0.002 -0.015 0.000 0.000
Job Satisfaction
7 SatJob -0.008 -0.026 0.001 0.027 0.017 0.079 0.000
8 SatOrg 0.014 -0.008 -0.027 0.013 -0.014 0.023 0.000 0.000
Performance
9 WrkUntPerf -0.010 0.049 0.019 -0.009 0.004 0.056 0.009 -0.022 0.000
10 AgcyMssnAccshd 0.005 -0.003 -0.009 -0.013 -0.010 0.083 -0.023 0.024 0.000 0.000
Variables Standardized Covariance Residuals
1 2 3 4 5 6 7 8 9 10
Empowerment Practices
1 Practice 1 0.000
2 Practice 2 0.940 0.000
3 Practice 3 3.011 3.241 0.000
4 Practice 4 0.620 0.691 -6.569 0.000
Innovativeness
5 NewWays -10.009 -4.725 11.647 3.320 0.000
6 SrchBttrWys -9.659 -17.712 -0.794 -6.261 0.000 0.000
Job Satisfaction
7 SatJob -2.851 -9.506 0.522 9.650 6.410 33.491 0.000
8 SatOrg 5.122 -2.796 -9.798 4.800 -5.264 9.559 0.000 0.000
Performance
9 WrkUntPerf -3.694 19.329 7.334 -3.389 1.728 24.343 3.487 -8.467 0.000
10 AgcyMssnAccshd 1.841 -1.202 -3.490 -4.877 -3.740 35.793 -8.728 8.888 0.000 0.000

39
Table 4. CVM (ADF/WLS) Model Fit Statistics for a Non-Recursive Model of the Effects of
Empowerment on Innovativeness, Job Satisfaction, and Performance.
Fit Scalar Index Value
χ² 33,807
df 29
p 0.0001
χ²/df 1,165.76
BIC 33,453
RMSEA (Root Mean Square Error of Approximation) 0.077
SRMR (Standardized Root Mean Square Residuals) 0.023
GFI (Joreskog and Sorbom Goodness-of-Fit Index) 0.967
AGFI (Adjusted GFI) 0.938
CFI (Bentler Comparative Fit Index) 0.978
NFI (Bentler-Bonnettt Normed Fit Index) 0.978
TLI (Tucker-Lewis Index) 0.966

40
Appendix 1. Variables and Measures
Employee empowerment
Practice 1 (information about goals and performance). Measured using a summated rating scale created from
the following three ordinal survey items: Managers review and evaluate the organization's progress
toward meeting its goals and objectives (1 = strongly disagree through 5 = strongly agree);
Supervisors/team leaders provide employees with constructive suggestions to improve their job
performance (1 = strongly disagree through 5 = strongly agree); and How satisfied are you with the
information you receive from management on what's going on in your organization (1 = very dissatisfied
through 5 = very satisfied)?
Practice 2 (rewards based on performance). Measured using a summated rating scale created from the
following four ordinal survey items: Promotions in my work unit are based on merit (1 = strongly
disagree through 5 = strongly agree); Employees are rewarded for providing high quality products and
services to customers (1 = strongly disagree through 5 = strongly agree); Pay raises depend on how well
employees perform their jobs (1 = strongly disagree through 5 = strongly agree); and Awards in my
work unit depend on how well employees perform their jobs (1 = strongly disagree through 5 = strongly
agree).
Practice 3 (access to job related knowledge and skills). Measured using a summated rating scale created from
the following three ordinal survey items: I am given a real opportunity to improve my skills in my
organization (1 = strongly disagree through 5 = strongly agree); The workforce has the job-relevant
knowledge and skills necessary to accomplish organizational goals (1 = strongly disagree through 5 =
strongly agree); and Supervisors/team leaders in my work unit support employee development (1 =
strongly disagree through 5 = strongly agree).
Practice 4 (discretion to change work processes. Measured using a summated rating scale created from the
following ordinal survey items: Employees have a feeling of personal empowerment with respect to
work processes (1 = strongly disagree through 5 = strongly agree); and How satisfied are you with your
involvement in decisions that affect your work (1 = very dissatisfied through 5 = very satisfied)?
Innovativeness
NewWays (encouragement to innovate). Measured using the following ordinal survey item: I feel encouraged to
come up with new and better ways of doing things (1 = strongly disagree through 5 = strongly agree).
SrchBttrWys (innovative behavior). Measured using the following ordinal survey item: I am constantly looking
for ways to do my job better (1 = strongly disagree through 5 = strongly agree).
Job satisfaction
SatJob (satisfaction with organization). Measured using the following ordinal survey items: Considering
everything, how satisfied are you with your organization (1 = very dissatisfied through 5 = very
satisfied)?
SatOrg (satisfaction with job). Measured using the following ordinal survey item: Considering everything, how
satisfied are you with your job (1 = very dissatisfied through 5 = very satisfied)?
Performance
WrkUntPerf (work unit performance). Measured using the following ordinal survey item: How would you rate
the overall quality of work done by your work unit ( 1 = very poor through 5 = very good)?
AgcyMssnAccshd (agency performance). Measured using the following ordinal survey item: My agency is
successful at accomplishing its mission (1 = strongly disagree through 5 = strongly agree).

41
Notes
i A higher-order confirmatory factor analysis (CFA) was performed to assess the measurement of Bowen and
Lawler‘s four-dimensional empowerment construct. Multiple ordinal survey items shown in Appendix 1 were used
to measure the four empowerment practices. In the four-factor model, each of the survey items loaded strongly and
in the anticipated direction with the corresponding factor (i.e., empowerment practice) (p < 0.001). Those four
factors, in turn, have very strong positive correlations with a second-order factor representing the underlying
construct of employee empowerment (p < 0.001). The statistics for several goodness-of-fit indices support the four-
factor model of empowerment. The statistics for the comparative fit index (CFI), which is minimally affected by
sample size, is 0.94, indicating a good fit for the four-factor model (Fan, Thompson, and Wang, 1999). The
Joreskog and Sorbom goodness-of-fit index of 0.93 also suggests a good model fit. The normed fit index (NFI)
statistic of 0.94 and the root mean square error of approximation (RMSEA) of 0.09 both point to an acceptable fit
for the four-factor model (Schumacker and Lomax, 2004). Complex models are more likely to generate better fit
statistics than parsimonious ones. It is recommended, therefore, that models be subjected to goodness of fit
measures that penalize for lack of parsimony. The model with a four-factor structure has parsimony ratio (PRATIO)
and parsimony normed fit index (PNFI) statistics of 0.76 and 0.71, respectively, both of which are indicative of a
reasonably parsimonious fit. It should be noted that the chi square test results reject the four-factor model (67,091, n
= 154,793, 50 degrees of freedom) at the p < 0.01 level. Large sample sizes like the one used in this CFA are much
more likely to result in Type II errors. Garson (2009) suggests, therefore, discounting the chi square results if other
fit statistics support a model with such a large sample size. In contrast to the evidence favoring a four-factor model
of employee empowerment, the higher-order CFA results reject a model with a one-factor structure. The CFI and
NFI statistics for a one-factor model fail to reach the 0.90 cutoff point; both are only 0.89. And the RMSEA statistic
(0.12) is above the conventional cutoff for even an adequate model fit (Schumacker and Lomax, 2004). In addition,
a comparison of the four-factor and one-factor models, in terms of their Akaike information criterion (AIC) statistics,
favors the former over the latter. The lower AIC statistic for the four-factor model (67,147.25) is considerably lower
than the AIC statistic for the one-factor model (125,414.95), indicating a significantly better model fit (Burnham and
Anderson, 2004; Long, 1997). Finally, the absolute value of the difference in chi-squares between the four-factor
model (chi-square = 67,091, n = 154,793, 50 degrees of freedom) and one-factor model (chi-square = 125,367, n =
154,793, 54 degrees of freedom) is 58,276. This is indicative of a statistically significant difference (p < 0.001) in
support of the four-factor model. According to Fornell and Larcker (1981), average variance explained (AVE)
statistics greater than 0.50 are indicative of convergent validity. The four empowerment practices have AVEs
between 0.74 and 0.96. Discriminant validity is assessed by comparing the square root of the AVE of an
empowerment practice to the correlations between that practice and the remaining practices. A square root of an
AVE greater than the correlations between an empowerment practice and the remaining practices is indicative of
divergent validity. The results show that the square root of AVE is greater than all the relevant correlations for all
four empowerment practices, with differences ranging from 0.24 to 0.12. ii Bollen (1989) states the model must meet the t-rule for identification. The t-rule,
( )( ), is the
necessary but not sufficient condition for identification. As further described by Bollen (1989) and Kline (2011) a
two-step rule is employed in fitting the model. In the first step, the model is treated as a confirmatory factor analysis
to establish that all parameters are identified. In the second step, the latent variable structures are assessed using a
polychoric/polyserial matrix by a weighted least squares (WLS) method. If both steps show model parameter
identification, than the sufficient condition that the entire model is identified is met. iii
Alternatively, for continuous and normally distributed variables, a GLS method may be employed where:
(
) ([ ( ) ] ). However, it is generally said that the ML method is more efficient than the GLS
approach with producing the estimates of standard errors. iv These thresholds are easily set/estimated by every SEM program given the distribution and characteristics in the
data. [R] estimates the thresholds and the polychoric correlations jointly from the bivariate marginal distribution.
Joreskog (1994) argues this is the most often used practice. v Bollen (1989) and Finney and DiStefano (2006) caution that the CVM has unbiased parameter estimates but the
standard errors tend to be low. Consequently, we estimate bootstrapped standard errors that correct the standard
errors upwards (sem boot program by Fox, 2009). vi All SEM analyses are conducted in [R]. See Fox (2009) and Revelle (2007) for a discussion of the software and
applications. Similar estimation methods with polychoric/polyserial corrected correlation scores that are fit with
WLS are present in LISRELand M-plus. Model fit statistics are discussed in the Results section.

42
vii
Please note that in Table 3 the standardized residual covariance matrix contains a few significant scores (ratios of
covariance residuals over standard errors). Kline (2011, p. 171) argues that these results are quite normal for very
large data sets. Thus, we only concentrate on the unstandardized fitted values. viii
For reasons of brevity, these model fit results are omitted from the paper but are available from the authors upon
request.