a-cdm impact assessment 2016
TRANSCRIPT

© March 2016 - European Organisation for the Safety of Air Navigation (EUROCONTROL)
This document is published by EUROCONTROL for information purposes. It may be copied
in whole or in part, provided that EUROCONTROL is mentioned as the source and it is not
used for commercial purposes (i.e. for financial gain). The information in this document may
not be modified without prior written permission from EUROCONTROL.
www.eurocontrol.int
EUROCONTROL
EUROCONTROL
A-CDM Impact Assessment
A-C
DM
Impact A
ssessment Fin
al Report
Final Report
March 2016
March
2016
Covers_A-CDM Assessment.indd 1 11/04/16 08:52

Background information
This report presents an up-to-date evaluation of the impact of A-CDM implementation at local/airport level as well as at network level considering 17 fully implemented CDM airports.
This evaluation was commissioned by EUROCONTROL to the Company Atlas Chase as part of its contribution to SESAR Operational Focus Area (OFA) 05.01.01 entitled ‘Airport Operations Management’, in relation to the development of the AirPort Operations Centre (APOC) concept.
The project has been steered by a joint EUROCONTROL team from the Airport Research Unit and the Airport Unit of the Network Manager (represented by Denis HUET and Dave BOOTH) and developed by Atlas Chase (Simon PICKUP).
For any questions on the content of this report, please contact us at:
[email protected] [email protected] [email protected]
Covers_A-CDM Assessment.indd 2 11/04/16 08:52

i | P a g e
Executive Summary
The Airport Collaborative Decision Making (A-CDM) is a EUROCONTROL concept which has now
been implemented at 18 European airports. Over 34% of ECAC departures now originate from a
CDM airport and transmit improved pre-departure take-off time estimations to NMOC via Departure
Planning Information (DPI) messages. CDM airports realise significant local operational benefits
through the adoption of A-CDM processes, not to mention a dramatic improvement in levels of take-
off predictability. This improved predictability is an enabler for a safer and more efficient European
ATM network.
The objectives of this study have been to collect evidence from 17 CDM airports so that:
1. The local benefits enjoyed by CDM airports could be collated and communicated within
airport specific A-CDM factsheets.
2. The outcomes of the previous EUROCONTROL A-CDM network study [Ref-1] could be
refined.
From a local perspective, the partnership with each CDM airport has allowed the local A-CDM
impact assessment to be focused on generating credible operational benefits of each implementation.
This included data analysis of airport and NMOC flight data as well as operational review meetings in
which qualitative and quantitative benefits were relayed by airports and A-CDM stakeholders.
A-CDM supports strong taxi-out time and ATFM delay reductions. The following infographic describes
the total savings generated across 17 CDM airports, based on taxi-out and ATFM delay
improvements.
The impact of A-CDM on local ATFM delay should not be underestimated. CDM airports have shown
a much stronger tendency for generating more favourable slots for its customers, resulting in

ii | P a g e
significant ground delay savings. Several CDM airports showed tactical delay cost savings amounting
to near €1 million in 2015, including some of the lesser constrained CDM airports such as Prague,
Venice and Milan Malpensa.
Local benefits that have been confirmed as part of the study (but not necessarily existing at each
CDM airport) include:
Average taxi-out time savings between 0.25 and 3 minutes per departure.
Average schedule adherence improvements between 0.5 and 2 minutes per flight.
Reduction in push-back delays after start-up approval.
Increased ATFM slot adherence despite increased traffic demand and ATFM regulation
volumes.
Improved ground handling resource utilisation.
Reduction in the number of late stand and gate changes.
Improved management of and recovery from periods of adverse conditions.
Reduction in Flight Activation Monitoring suspensions.
Increased peak departure rates at the runway.
Dramatically improved take-off time predictability – typically by as much as 85% during
adverse conditions.
The realisation of local benefits depends on the characteristics of the airport and the extent to which
A-CDM procedures are adopted. However, this study has shown that even the lesser constrained
airports stand to benefit significantly from A-CDM, particularly during periods of adverse conditions.
Assuming a full implementation cost of €2.5 million and annual maintenance costs of €150,000 - this
study has shown that on average, A-CDM provides a return on investment after 18 months, and a
cost benefit ratio (CBR) of 7 over 10 years. This considers the tactical cost savings to airline
operators only and not the financial benefits enjoyed by other partners – which are more difficult to
verify. Clearly, a full cost avoidance analysis that includes the benefits enjoyed by ANSP, ground
handlers and the airport operator would generate a significantly higher CBR.
From a network perspective, this study investigated how the continued implementation of A-CDM
would impact the European ATM network in terms of safety, enroute capacity and ATFM delay. It
concludes that:
The standard deviation of take-off accuracy from CDM airports has reduced from an average
of 14 minutes to around 7 and 5 minutes at the sequencing and off-block milestones
respectively.
Around 60% of flights from a CDM or Advanced ATC Tower airport would be required through
an operational sector to generate a reliable and consistent reduction in over-deliveries;

iii | P a g e
Based on the A-CDM implementation progress in January 2016, a 2% increase in ECAC wide
enroute capacity could be enabled after the integration of 2 or 3 more medium sized airports;
This benefit would peak at a 3.5% enroute sector capacity increase after Europe’s 50 busiest
airports become network integrated.
If the average take-off predictability of currently connected airports was able to increase to the
current best in class value, then an additional 2% gain in enroute capacity could be realised
with the same number of airport integrations.
Around 80% of the available enroute capacity benefit will be realised when the top 30
European airports are integrated (or 57% of ECAC departures are transmitting DPI).
A historical analysis of CDM airport ATFM delay performance has shown that:
A-CDM is already facilitating a reduction in average ATFM delay of 3 minutes per regulation
in restrictions in which 30% or more of the flights are originating from CDM airports. This
benefit increases as the proportion of flights originating from CDM airports increases through
the sector.
On average, the proportion of A-CDM flights through a flow restriction needs to reach
between 10% and 15% before reductions in ATFM delay are experienced.
The trends in historical ATFM delay suggest that 40 CDM airports could yield reductions in
average ATFM delay of between 20% and 25%. This is compared to flow restrictions in which
there are no regulated flights originating from a CDM airport. These results are consistent
with the findings generated in the previous EUROCONTROL impact study [Ref-1].
Departures from CDM airports receive less ATFM delay than non A-CDM flights through the
same restriction - by an average of a 1 minute per flight.
For a flow restriction with 40% A-CDM flight participation, the probability of receiving a 40
minute delay reduces from 22% to 4% for A-CDM flights and 7% for non A-CDM flights (when
compared to the same flow restriction through which no A-CDM flights are routed).
Atlas Chase and EUROCONTROL would like to thank all participating CDM airports for their time and
assistance in developing this report. It is hoped that the information presented herein will support
other airports in their road towards A-CDM implementation and that the achievements of current CDM
airports have been communicated objectively.

iv | P a g e
Table of Contents
Executive Summary ................................................................................................................................. i
Table of Contents ................................................................................................................................... iv
Abbreviations & Acronyms ..................................................................................................................... vi
1 Introduction ..................................................................................................................................... 1
1.1 Scope .................................................................................................................................................... 1
1.2 Intended Audience ................................................................................................................................ 2
1.3 Objectives.............................................................................................................................................. 3
1.4 Structure of Work .................................................................................................................................. 3
1.5 References ............................................................................................................................................ 4
2 Local Benefits ................................................................................................................................. 5
2.1 Approach ............................................................................................................................................... 5
2.2 A-CDM Benefit Mechanisms ................................................................................................................. 6
2.3 Arrival Predictability Benefits ................................................................................................................. 7
2.4 Off-Block Predictability Benefits .......................................................................................................... 14
2.5 Take-Off Predictability Benefits ........................................................................................................... 28
3 Network Impact Assessment ........................................................................................................ 33
3.1 Objectives............................................................................................................................................ 33
3.2 Methodology Overview ........................................................................................................................ 34
3.3 Initial Results ....................................................................................................................................... 37
3.4 Sector Stream Saturation Analysis ...................................................................................................... 39
3.5 Current ACC Saturations ..................................................................................................................... 43
3.6 ECAC Wide Conclusions ..................................................................................................................... 44
4 ATFM Delay .................................................................................................................................. 46
4.1 Improvement Mechanisms .................................................................................................................. 46
4.2 Historical Results ................................................................................................................................. 49
5 A-CDM Implementation Challenges ............................................................................................. 57
5.1 Harmonisation ..................................................................................................................................... 57
5.2 Equity of TSAT Delay .......................................................................................................................... 64
5.3 TOBT Update Culture .......................................................................................................................... 65
5.4 TSAT Adherence ................................................................................................................................. 66
5.5 Flight Planning Control ........................................................................................................................ 67
5.6 Expectation of Reduced Slots ............................................................................................................. 67
5.7 Cost Benefit ......................................................................................................................................... 68
6 Conclusions .................................................................................................................................. 71
6.1 Further Work ....................................................................................................................................... 72

v | P a g e
Appendix A – Airport Network Integration ............................................................................................ 74
A.1 Enhanced Tactical Flow Management System (ETFMS) .................................................................... 74
A.2 Impact of Poor Take-Off Predictability ................................................................................................. 75
A.3 Managing Poor Traffic Predictability .................................................................................................... 76
Appendix B – A-CDM Factsheets......................................................................................................... 79

vi | P a g e
Abbreviations & Acronyms
ACARS Aircraft Communications, Addressing and
Reporting System
CDF Cumulative Probability Distribution
Function
A-CDM Airport-Collaborative Decision Making CDG Paris Charles De Gaulle (IATA
designator)
ACZT Actual Commencement De-Icing CHG Change Message
AIR Airborne (A-CDM acronym) CTFM Calculated Tactical Flight Model
AIXM Aeronautical Information Exchange Model CTOT Calculated Take Off Time
ALDT Actual Landing Time DCL Digital Clearance (Datalink)
ALDT Actual Landing Time DDR2 Demand Data Repository 2
ANSP Air Navigation Service Provider DLA Delay Message
AO Aircraft Operator DMAN Departure Manager
AOBT Actual Off Block Time DPI Departure Planning Information
AOCC Airline Operations Control Centre ECZT Estimated Commencement De-Icing
AODB Airport Operational Database EDIT Estimated De-Icing Time (duration)
AOP Airport Operations Plan EEZT Estimated End De-Icing Time
APOC Airport Operations Centre (SESAR
Concept)
EFD ETFMS Flight Data Message
ARR Landed (A-CDM acronym) EFPS Electronic Flight Progress Strips
ASMA Arrival Sequencing Metering Area EIBT Estimated In Block Time
ASRT Actual Start-up Request Time ELDT Estimated Landing Time
ATC Air Traffic Control ENAV Italian Air Navigation Service Provider
ATFM Air Traffic Flow Management EOBT Estimated Off Block Time
ATM Air Traffic Management ETA Estimated Time of Arrival
ATO Actual Time Over ETD Estimated Time of Departure
ATOT Actual Take Off Time ETFMS Enhanced Tactical Flow Management
System
ATS Air Traffic Services ETO Estimated Time Over
AXIT Actual Taxi In Time ETOT Estimated Take Off Time
AXOT Actual Taxi Out Time EXIT Estimated Taxi In Time
BPBS Best Planned Best Served EXOT Estimated Taxi-Out Time

vii | P a g e
CASA Computer Assisted Slot Allocation FAM Flight Activation Monitoring
FIDS Flight Information Display System FCFS First Called First Served
FMP Flow Management Position PRC Performance Review Commission
FSA First System Activation PRU Performance Review Unit
FSFS First Scheduled First Served REA Ready Message
FPL Flight Plan Message RFP Replacement Flight Plan
FTFM Filed Tactical Flight Model RP2 Reference Period 2 (2015 - 2019)
FUM Flight Update Message RT Radio Transmission
GH Ground Handler RTFM Regulated Tactical Flow Model
IBK In-Block (A-CDM acronym) RTS Return To Stand (A-CDM acronym)
IFPS Integrated Flight Plan Processing System RTTT Reduced Typical Turnaround Time
IFR Instrument Flight Rules RWY Runway
IP1 Implementation Phase 1 (SESAR) SAM Slot Allocation Message
KPA Key Performance Area SEGS Stand Entry Guidance System
KPI Key Performance Indicator SES Single European Sky
LHR London Heathrow (IATA Designator) SESAR Single European Sky ATM Research
MTTT Minimum Turnaround Time SIBT Scheduled In-Block Time
MUAC Maastricht Upper Area Control SID Standard Instrument Departure
MVT IATA Aircraft Movement Message SOBT Scheduled Off-Block Time
NEST Network Strategy Tool (EUROCONTROL) SRM Slot Revision Message
NMOC Network Manager Operations Centre STW Slot Tolerance Window
OBK Off-Block (A-CDM acronym) TOBT Target Off Block Time
OCC Operational Control Centre TOT Take Off Time
OTA On Time Arrival TSAT Target Start-up Approval Time
OTD On Time Departure TTOT Target Take Off Time
OTP On Time Performance TWR Airport Tower
PDF Probability Distribution Function VDGS Visual Docking Guidance System
PDS Pre-Departure Sequence (Sequencer) WVC Wake Vortex Category

1 | P a g e
1 Introduction
1.1 Scope
This document presents the results of a 12-month study into the local and network impacts of the
Airport – Collaborative Decision Making (A-CDM) concept.
This study was commissioned by EUROCONTROL to ‘Atlas Chase’ as part of its contribution to
SESAR Operational Focus Area (OFA) 05.01.01 entitled ‘Airport Operations Management’, in relation
to the development of the AirPort Operations Centre (APOC) concept. It was developed in close
cooperation with the Network Manager in order to better understand the network influence of a-CDM.
Since its birth in the early 2000’s, 18 airports have become fully A-CDM implemented, with a notable
surge in adoption since 2013. As of January 2016, 34% of ECAC departures are transmitting
Departure Planning Information (DPI) messages to NMOC from CDM airports, as illustrated in
Figure 1-1.
Figure 1-1 Progress of fully networked A-CDM implementations since July 2007
The breadth of different airports in which A-CDM now operates has enabled a review of the different
ways that A-CDM has been implemented. This has supported a deeper understanding of the
operational constraints and implementation characteristics that result in the realisation of local
benefits.
At the network level, this study has strived to define the impact of increased A-CDM adoption on
enroute sector traffic predictability. This mechanism is an enabler for enroute capacity buffer and
ATFM delay reductions and was initially quantified at the ECAC level by a previous EUROCONTROL
study [Ref-1].

2 | P a g e
Figure 1-2 Proportion of flights from CDM airports entering ACC on the 5th November 2015
On the 5th November 2015, the proportion of transiting flights that had originated from an A-CDM
airport exceeded 40% for many enroute ACCs - as illustrated in Figure 1-2. Increased data availability
has enabled the more precise modelling of CDM airport take-off predictability performance. This has
led to an investigation into the impact of A-CDM flight saturations on the potential for sector over-
delivery reductions, as well as the refinement of the conclusions made within the previous A-CDM
network impact assessment [Ref-1].
1.2 Intended Audience
This document has been written for all members of the A-CDM community past, present and future.
The study has been initiated to both support the development of A-CDM and to support the
development of the SESAR APOC concept.Any person or company that is interested in A-CDM as
either a concept or as a pillar of the SESAR Airport Operations Centre (APOC) concept might also be
interested in the findings presented herein.
Please note that this document does assume that the reader has some familiarity with the A-CDM
concept and will only elaborate on low level concept principles when it is appropriate for
communicating relevant operational impacts. For those new to the concept, there is a dedicated A-
CDM website [Ref-8] from which concept material, implementation guidance and specific airport
project material may be accessed.

3 | P a g e
1.3 Objectives
The objectives of this study have been as follows:
1. Update the results of the EUROCONTROL A-CDM impact assessment published in March
2010 [Ref-1].
2. Generate a list of verified local A-CDM benefits, as reported by participating CDM airports.
3. Provide an opportunity for stakeholders to voice both the achievements and challenges of
their respective A-CDM implementations.
4. Describe the operational enablers that tend to lead to the realisation of local A-CDM benefits.
5. Communicate the findings to the A-CDM community.
1.4 Structure of Work
The study has been divided into 2 main activities. The first consisted of a local benefit assessment
which was driven by both quantitative and qualitative feedback from 17 European CDM airports. The
strongest benefits and airport specific examples are described in Chapter 2.
The network impact analysis was the second main area of work and is presented in Chapter 3. This
section includes the results of an ECAC-wide enroute capacity assessment using the
EUROCONTROL NEST tool. Also included are the results of a fast time simulation which was built to
understand how the proportion of network integrated airports along sector entry streams affects the
probability of sector over-delivery.
Chapter 4 is dedicated to the matter of ATFM delay. It describes the mechanisms by which A-CDM
departures benefit from improved slot allocation when compared to non A-CDM airports. This section
also presents quantitative results which serve to validate the very positive impact that A-CDM has
delivered so far.
Topics of A-CDM that have featured heavily within partner discussions over the 12 month study have
been summarised in Chapter 5. This information could be useful for a reader to understand the wider
issues and challenges of current A-CDM projects.
Appendix B of this study contains 17 A-CDM factsheets. For each airport, the factsheet provides an
operational overview, the main A-CDM processes and a set of realised operational benefits. The
approach taken for generating a robust list of validated benefits for each airport is presented in
Chapter 2.

4 | P a g e
1.5 References
ID Document Title Author
1 Airport CDM Network Impact Assessment, March 2010 EUROCONTROL
2 Performance Review Report 2014 PRC
3 Standard Inputs for Cost Benefit Analysis - edition 6.0 EUROCONTROL
4 DPI Implementation Guide – edition 1.8 EUROCONTROL
5 A-CDM Implementation Manual – version 4 EUROCONTROL
6 Analysis of Unused ATFM Slots - EEC Note No. 9/2000 EUROCONTROL
7 Aviation World 1/2014 “Operational efficiency improved at
Frankfurt Airport”
Aviation World
8 European Airport CDM website (www.euro-cdm.org) &
http://www.eurocontrol.int/services/acdm
EUROCONTROL
9 European airline delay cost reference values – version 3.2 PRU / University of Westminster
10 Airport CDM Cost Benefit Analysis EUROCONTROL

5 | P a g e
2 Local Benefits
2.1 Approach
Seventeen fully networked A-CDM airports (as of January 2016) have provided qualitative and
quantitative information to support this study. In most cases, the approach followed with participating
airports was per the following steps:
Operational Review: The local A-CDM project leader invited the study team to describe the
operational characteristics of the airport as well the specifics of the A-CDM implementation
itself. In many cases, this meeting would include representatives from the local ANSP and
major airlines. The benefits experienced since the A-CDM implemented were presented by
the airport.
Post Implementation Data Analysis: The task of generating robust benefits included the
analysis of data provided from the local airport database, Performance Review Unit (PRU)
and NMOC flight data archives. This activity was to support some of the discussions relating
to the impact of A-CDM locally and to provide additional support to any quantitative benefit
claims made.
Airport CDM Factsheet Generation: A 3 or 4 page document was generated to describe the
operational context, A-CDM process fundamentals and verified operational benefits
developed from the previous 2 steps.
A-CDM Factsheet Review: The final meeting with each participating airport was to agree the
A-CDM factsheet content and to provide another opportunity for the airport to provide their
views on the concept as a whole.
The resulting per-airport factsheets are all presented within Appendix B of this report.
Figure 2-1 A-CDM factsheets available as in Appendix B of this report

6 | P a g e
2.2 A-CDM Benefit Mechanisms
All tangible benefits attributable to A-CDM are realised due to the improvement in one or more of the
following benefit mechanisms:
Arrival Predictability;
Off-Block Predictability;
Take-Off Predictability.
As Figure 2-2 illustrates, these mechanisms are supported by both technical and procedural enablers.
Take-off predictability improvements are barely possible without improvements to the off-block
predictability, whilst the arrival predictability supports, but is not crucial to, improvements in off-block
predictability.
Figure 2-2 A-CDM benefit mechanisms and example enablers
The enablers described in Figure 2-2 are indicative only. For example, arrival predictability may be
supported by a procedure to refine the estimated landing time (ELDT) based on the aircraft position in
the arrival sequence or holding stack. Some of the ‘procedural’ enablers may be implemented
systematically. However, without some degree of information sharing and procedural adherence
across the stakeholders, it is clear that off-block and take-off predictability improvements may never
be generated.
The tangible benefits realised from each benefit mechanism depends largely on the characteristics of
the airport and the ‘opportunity’ for improvement across the overall operation. Acting like a ‘filter’ –
local constraints (or lack of) can supress the full potential for performance gains where other
operational priorities take precedence.
Figure 2-3 Operational characteristics acting as a filter to the performance improvement potential

7 | P a g e
2.3 Arrival Predictability Benefits
A-CDM focuses on the principle that a departing flight is fundamentally a continuation and re-
identification of an arrival flight that transitions through a ‘ground trajectory’ phase. The receipt of
Flight Update Messages (FUM) provides a more accurate estimated landing time (ELDT) as early as
3 hours from touchdown. This information provides airport stakeholders with the information they
need to best allocate resources should the ELDT of an arrival flight shift significantly.
FUM are distributed via the EUROCONTROL B2B web service or ATFM Fixed Telecommunications
Network (AFTN). The distribution of reliable arrival updates between airport partners has
demonstrated improvements in the following areas:
Stand planning
Ground handling resource allocation
Fleet planning
Departure punctuality
2.3.1 Stand Planning
The Estimated in-block time (EIBT) is automatically generated from ELDT and estimated taxi-in time
(EXIT) and has been shown to support improved stand utilisation - resulting in fewer instances of
stand congestion or late stand changes. This benefit applies particularly to airports where stand
capacity is a constraint or where the traffic and fleet mix restricts full use of all stand assets during
operational peaks. 11 of the 17 participating CDM airports reported a significant benefit in this area.
In the first year after A-CDM implementation, Oslo (ENGM) recorded
750 fewer stand changes for flights that had passed the final approach
fix. This has resulted in an improved passenger experience and fewer
instances of outbound delay due to late passengers at the gate.
Madrid Barajas (LEMD) has integrated the ELDT within
automated stand planning software. This has enabled a reduction
in stand scheduling buffers. Stand congestion has also reduced
notably.
Venice airport (LIPZ) has published improved arrival time information
to the airport Flight Information Display Systems (FIDS) Venice is
also able to provide gate information sooner based on the improved
outbound departure time estimate.
Frankfurt airport showed notable improvements in stand stability
immediately after the update of their taxi-in time estimates in
2015. Stand stability is defined by the percentage of flights where
the stand did not change after the final approach fix. The results
shown in Figure 2-4 illustrate the importance of taxi-in time
accuracy as an enabler of arrival predictability (as well as the

8 | P a g e
improved ELDT from the most appropriate source).
Figure 2-4 Impact of refining EXIT tables on stand stability at Frankfurt airport in 2015 (Source – Fraport)
2.3.2 Ground Handling Resource Allocation & Prioritisation
Ground handlers (GH) are bound by service level agreements (SLA) to meet departure punctuality
targets – often with strong financial incentives attached. On time performance (OTP) is their priority
yet this needs to be achieved with limited resources. Arrival time predictability is helping ground
handlers to plan their operation based on evolving tactical information rather than largely inaccurate
schedules.
During severe ground delay, arrival time predictability is enabling the prioritisation of flights
and an improved dialog between the Airline Operational Control Centre (OCC) and ground
handler representatives.
There are fewer instances where flights are not met on-stand by personnel waiting to rotate
the aircraft. Coupled with improved stand allocation robustness, improved arrival predictability
enables resources to be positioned on the right stand at the right time.
Resource idle time is reduced and utilisation is increased. Should an inbound flight be
delayed then that presents an opportunity for the GH to reallocate resources to protect the
OTP of other flights.
The evidence that has been collated to support the benefits of arrival predictability on the ground
handler function is entirely qualitative. The project has not been close enough to ground handling
agencies to generate firm quantitative results. However, anecdotal evidence and personal accounts
support that the ELDT information presented to ground handlers as early as 3 hours in advance has
direct benefits to their own operations.

9 | P a g e
Daniele D’Addetta, Operations Manager
Acciona Airport Services [Ref-7]
Alf Haugland, Oslo ATC TWR Supervisor
2.3.3 Fleet Planning
Airline OCC also benefit from improved arrival time predictability. An aircraft that is planned to fly
several sectors over the course of the day can be proactively re-planned (or cancelled) based on
delay notifications received during earlier legs.
Figure 2-5 illustrates how the arrival time predictability of a flight is affected by A-CDM at both the
departure and destination airports. In the following example, London Heathrow (LHR) and Paris
Charles De Gaulle (CDG) represent the departure and destination airport respectively. The numbers
annotated on Figure 2-5 represent different phases of the trajectory during which the in-block time
accuracy of the returning flight could improve.
Figure 2-5 Impact of A-CDM on arrival time predictability
“…we have a fundamentally improved
decision-making basis and can
coordinate our resources better and
more efficiently.”
“Since A-CDM, we experience fewer late
gate changes and better working
relations with the ground handlers and
gate-allocators”

10 | P a g e
CASE 1: NON A-CDM AT BOTH AIRPORTS
At the off-block, a movement (MVT) or ACARS message might be received by the airline
to denote that the flight has pushed back. The accuracy of these messages is
inconsistent (and often questionable), especially when these signal timestamps are often
used to determine punctuality. At this point, the ETA generated by NMOC is comprised of
default taxi time values and an estimated elapsed time (EET).
The rotational impact of any off-block delay suffered by the flight is not yet considered at
the destination airport.
Once airborne, the First System Activation message (FSA) is generated upon first radar
contact. This enables a more precise landing time estimation at the destination to be
generated by NMOC. Any taxi-out delay at LHR can now be reflected in a potential arrival
delay at CDG. Both ATC and the OCC could be aware of the late arrival at CDG, but the
impact on the rotation performance and return departure time is still unclear to NMOC
and the ground handling agent back at LHR.
NMOC updates the ETA at CDG based on Correlated Position Reports (CPR); however
the estimated in-block time accuracy is still subject to the taxi-in time variability. The
NMOC default taxi-in time does not consider the planned arrival runway and stand at the
destination. The amount of local holding is also a source of arrival time inaccuracy at
CDG.
Once in-block at CDG, the EOBT of the return leg to LHR should be updated by a delay
(DLA) or change (CHG) message. This is the first notification received by NMOC of the
delay to the return leg to LHR. The ETA of this flight is updated (by NMOC) based on the
new EOBT; however, this ETA still relies on the mostly inaccurate default taxi-out time
values and an off-block tolerance of 15 minutes. (The airline is not required to file a DLA
or CHG message to NMOC if the flight can depart within 15 minutes of the new EOBT).
The OCC might now be aware of the size of delay to the return leg - to start planning a
return to schedule.
The arrival predictability of the return leg to LHR continues to improve as the flight
transitions through the off-block and take-off milestones.
Although the flight has landed back at LHR, ground handlers are still unaware of exactly
when and where the flight will arrive for rotation. The late arrival has resulted in a stand
change due to the exceedance of the schedule buffers on the original stand. Eventually,
the agents arrive at the correct stand however a reactionary delay is incurred on the turn
and the schedule is never recovered.

11 | P a g e
CASE 2: DEPARTURE AIRPORT (LHR) IS A-CDM IMPLEMENTED
The Target Off Block Time (TOBT) procedure at LHR generates off-block estimates to an
accuracy of 5 minutes at 40 minutes before push. NMOC regenerates flight profiles and
the ETA (at CDG) based on the Target Take Off Time (TTOT) – which also accounts for
local constraints and ground congestion.
The anticipated delay at CDG is known much earlier. The time available to plan a
response to recover the flight to schedule at CDG is widened.
Once airborne, the Flight Activation message is sent and NMOC adjusts the flight profile
(and ETA at CDG) in the same manner as for case 1.
The CDM airport generates more accurate in-block times based on the variable taxi-in
times and is refined on every ELDT update from the most prioritised information source at
that time.
CASE 3: DEPARTURE AND DESTINATION ARE A-CDM IMPLEMENTED
CDG receives ELDT updates via flight update (FUM) or ETFMS Flight Data (EFD)
messages and uses them to calculate an estimated in-block time (EIBT). This happens as
the inbound flight from LHR is delayed on the ground. CDG uses this EIBT to produce
TTOT estimates for the return leg based on the minimum turnaround time (MTTT) and
estimated taxi-out time (EXOT). The TTOT is published to NMOC via DPI and is used to
re-calculate the 4D trajectory and to issue ELDT updates to LHR via FUM.
The first FUM will be received 3 hours before the estimated landing time of the return leg
to LHR, irrespective of the flight status. In this example, LHR will generate an EIBT based
on the ELDT of the return flight from CDG just after the flight becomes airborne on the
outbound leg.
The same level of arrival predictability was not possible in the other scenarios until
nearing the end of the turnaround phase at CDG.
The arrival flight predictability continues to improve as the TOBT is refined at CDG based
on inbound flight progress and local constraints in the turn and the taxi-out phase. Once
airborne, this case assumes the same level of arrival predictability as case 2.
The above example suggests that the TOBT at the destination airport could be
calculated based on an ELDT of the inbound leg. Exactly when this happens is
a local implementation decision which must consider the point at which the
ELDT timestamp is accurate enough to generate stable off-block estimates.
Levels of situational awareness at a CDM airport improve as more of the airports which it serves
become A-CDM implemented also. An airport that has links to many airports which process FUM or
EFD to drive off-block predictability will serve to improve the demand picture for both for the network

12 | P a g e
and their own resources and infrastructure. Hub airlines would also be able to anticipate and mitigate
delay slippage more easily as the number of A-CDM connections increases.
As an example, Avinor is currently implementing
A-CDM at 3 of the busiest routes from Oslo –
which are short haul domestic flights to
Stavanger, Trondheim and Bergen. Oslo airport
already benefits greatly from accurate ELDT
information provided by the FUM and Arrival
Manager (AMAN) information that is distributed
by the A-CDM platform.
The incorporation of these airports into their
A-CDM network will further improve the traffic
predictability across Norway and the ATM
network – especially during periods of notable
ground delay at any one or more of the
connected sites.
2.3.4 Reactionary Delay & Turnaround Performance
The late departure of the outbound leg is caused by one or more of the following:
1. Late arrival of the inbound leg.
2. Failure to turn the aircraft (ground trajectory phase) within the required time.
3. ATFM delay (CTOT) allocated to the departure.
4. Local ATC or airport infrastructure constraints that may prevent an immediate start-up and
taxi clearance.
Figure 2-6 illustrates that historically, the largest sources of schedule delay are reactionary delays
(45.9%) and turnaround performance (36.1%) – which are represented by items 1 and 2 in the list
above. Enroute ATFM delay (IATA 81 & 82) and ANS delay at the airport (IATA 83) made up 5.1%
and 7.7% of total departure delay respectively in 2015.
The IATA delay code is seldom a reliable indicator of the root delay cause.
Reactionary delay is all too commonly cited as the reason for delay even when
a successful rotation (within normal limits) would have realised an on-time
departure (OTD). Certainly, for flights with no delay to the inbound (or morning
wave traffic), the most significant delay component is a failure within one or
more of the turnaround processes. This includes instances where the tow
vehicle is late to push the aircraft after receiving push back clearance from ATC.

13 | P a g e
Figure 2-6 Historical breakdown of European departure delay by cause in 2015 [Ref-2]
Reactionary delay (IATA code 93) is logged when a delay is caused by the late arrival of the inbound
flight. A-CDM is thought to support reactionary delay reductions through improved arrival predictability
which better enables ground handlers to manage their resources to facilitate a return to schedule. The
same mechanism contributes to an improvement in turnaround performance.
There is no suggestion that the receipt of FUM or EFD messages alone would
lead to performance improvements at an airport. Common situational
awareness across the site is a pre-requisite for ensuring that arrival flight
information can help steer effective decision making - which is based on a
shared and singular view of operational information.
The reactionary delay trends of 12 CDM airports were analysed. Of these, 5 airports have shown
notable reductions in the average reactionary delay, 2 of which were experiencing increasing traffic
demand over the analysis period (see Figure 2-7). For other airports, some could not show
improvements due to ground handling resource constraints and significant ATFM delay volumes
experience in 2014 and 2015.
Ground handlers benefit from improvements in both the arrival and departure predictability. It is not
known to what extent the performance at some of the CDM airports shown in Figure 2-7 were
influenced by the enhanced arrival predictability component. A lack of ground handling
representation within the study has limited the amount of quantitative and qualitative evidence
available to understand this in greater depth.

14 | P a g e
Figure 2-7 Number of CDM airports exhibiting different response to levels of reactionary delay (Source –
PRU Data Analysis)
2.4 Off-Block Predictability Benefits
2.4.1 TSAT Procedure
The Target Off-Block Time (TOBT) and Target Start-Up Approval Time (TSAT) are the most important
data elements within the A-CDM process.
The TOBT is defined as the time at which the aircraft operator or ground handler estimates that an
aircraft will be ready, all doors closed, boarding bridge removed, push vehicle available and ready to
start up / push back immediately upon reception of ATC clearance. The TOBT must be accurate to
within 5 minutes of the actual off-block time (AOBT).
The TSAT procedure is the mechanism for transparent and flexible pre-departure planning. The TSAT
is owned by ATC and typically generated by a pre-departure sequencer (PDS) or departure manager
(DMAN). The TSAT is time that ATC is expected to clear the aircraft for engine start and push. The
TSAT can never be earlier than the TOBT and must take into account local ATC and airport
infrastructure constraints such as ground congestion, stand contention, runway demand and ATFM
slots. The TSAT reflects the balance of infrastructure and airspace capacity to the demand picture
generated from the TOBT.

15 | P a g e
Figure 2-8 Factors affecting the TSAT value and examples of publication methods
Improvements in off-block predictability are driven by TOBT stability, sequence stability and TSAT
adherence. Should TOBT updates be late or inaccurate – then it is unreasonable to expect either an
optimal or stable pre-departure sequence. It is also vital that ATC are able to facilitate a start-up
clearance close to the assigned TSAT.
The TSAT procedure introduces the following operational advantages to a CDM airport:
1. A metering point for measuring and monitoring start-up approval and push-back delay.
2. A transparent and equitable means for absorbing taxi-delay on stand (‘green delay’).
3. Optimisation of the runway departure sequence to maximise runway throughput (assuming
that a DMAN or PDS was not available prior to the implementation of A-CDM).
4. A reference for improved resource and asset planning which is more reliable than the flight
plan EOBT or airport schedules.
5. A pre-departure sequence consisting of flights that will call for start-up clearance more
predictably. Instances of ghost flights and schedule busts should also be significantly reduced
if the initial flight plan correlation procedure (CDM milestone 1) is followed.
6. Reduction of Flow Management Position (FMP) issued departure regulations. Applied flow
rates may be managed directly within the pre-departure sequence.
The following examples are supported by data analysis where possible.
However, in the absence of data the study has relied on the qualitative
feedback from operational leaders or those at the forefront of the A-CDM
implementation. Since the study team were unable to interview all stakeholders
across 17 CDM airports, it is not thought that this list is exhaustive.
16 | P a g e
2.4.2 ATCO Workload
2.4.2.1 Clearance Delivery Position
Some ATC stakeholders have described that A-CDM has helped to reduce the task loading of the
clearance delivery position. This is driven mainly by improved off-block predictability from the TSAT,
resulting in less radio transmissions (RT) and planning workload – particularly in periods of high traffic
demand. At Oslo (ENGM), the integration of the TSAT within the electronic flight progress strips
(EFPS) system has helped to reduce ATC workload and mange operational peaks more efficiently.
For others, the TSAT has promoted heightened levels of situational awareness and provided a pre-
departure sequence that consists mainly of flights that have:
A corresponding airport slot (for coordinated airports).
Fewer EOBT, registration and aircraft type discrepancies.
CTOT compliant push-back times.
The items in the above list are particularly relevant in periods of adverse conditions where demand
severely outweighs capacity and where increased ATFM regulation makes the task of CTOT
compliance more demanding for clearance delivery. Phantom start-up delay reduction is also thought
to support reduced controller workload for some CDM airports and is described in Section 2.4.3.
A-CDM has led to a significant change in the role of the clearance delivery controller. In the first come
first served (FCFS) approach to start-up clearance, start-up approval would normally be awarded as
long as the flight had ATC clearance and there were no short term flow measures or local ground
interactions to manage.
At CDM airports, this position has an active role in developing the runway sequence and managing
the levels of ground movement and local airspace congestion. The TSAT window provides this
position with the flexibility to delay start-up approval to reduce congestion at the runway and remote
de-icing pads. Furthermore, this position might also be required to refuse start-up clearance should
certain A-CDM milestones not have been achieved. This might result in some additional ‘helpdesk’
related communication workload to inform the flight crew of the corrective action they need to take.
Workload is a subjective indicator which is often subject to personal bias, training and experiences.
Despite this, there was no feedback from ATC to suggest that the overall workload had increased for
the clearance delivery position. In peak periods, or during adverse conditions the A-CDM procedures
are thought to assist in facilitating an improved departure flow with workload levels that are the same
or less.
2.4.2.2 Apron & Ground Position
Generally, the TSAT procedure results in less ground congestion and a smoother departure flow. For
apron and ground controllers, this means less aircraft on frequency and fewer traffic interactions to
manage. For regulated flights, the PDS generates a TSAT which considers both runway capacity

17 | P a g e
(runway slot availability) and ground congestion levels (in the EXOT). As a result, the slot tolerance
window (STW) is much easier to facilitate – with less disruption caused for other flights in the process.
At almost all CDM airports interviewed, ATCO feedback was that the workload of the apron and / or
ground controller did reduce after the implementation of A-CDM. There were some exceptions. Four
of the TWR representatives suggested that there was negligible impact on their workload since the
complexity of the apron layout and the amount of interaction it created required larger reductions in
ground movements to produce a workload reduction for these positions. Düsseldorf airport (EDDL)
was one such example.
Figure 2-9 Düsseldorf apron layout which can contribute to high amount of traffic interaction
Figure 2-9 illustrates how the cul-de-sacs, limited apron area and large number of remote stands
contributes to workload levels that the TSAT procedure could not reduce notably.
2.4.3 Phantom Start-up Delay
Phantom Start-up Delay is a term coined by the A-CDM team at London Heathrow to describe delay
that is caused by flights that are ‘in the departure sequence’ – yet will never be able to consume the
slot they have been allocated.
In the ‘First Come First Served’ (FCFS) approach to clearance delivery, aircrew could anticipate
levels of ground congestion delay (based on information delivered over RT) and then call for start-up
clearance long before the flight was actually ready to push. This was done with the expectation that
the aircraft would be ready to depart when they eventually received their start-up clearance. When
flights are then unable to push (because ATC calls back earlier than expected), the resources
allocated to that flight (both handling and runway departure slot) are extremely difficult to allocate to
other flights. Subsequently, clearance delivery would work down a list of ‘ready’ aircraft to ensure
continuous runway pressure is maintained and ground resources are released. Should more aircraft
be unable to push then this quickly creates a chaotic situation of misplaced ground resources, runway
underutilisation and poor predictability of stand availability.

18 | P a g e
The workload levels of the clearance delivery position (and supporting roles) also peak in such
situations. In adverse conditions, this scenario can quickly lead to degraded airside performance that
leads to additional delay for all airlines.
The TSAT procedure helps to prevent this type of delay. For runway constrained airports, flights that
are unable to push within 5 minutes of receiving start-up clearance are typically re-sequenced to a
runway slot with more delay than would have been incurred if flight was ready at the true start-up
request time.
Crews can no longer call in advance to secure an earlier slot (since this is futile) and the TOBT
procedure provides the mechanism for the AO/GH to communicate the earliest ready time of the flight
based on resource constraints and inbound flight progress.
Most CDM airports suggested that the early start-up request behaviour was most common during
general de-icing conditions. The more heavily constrained operations such as London Heathrow and
Frankfurt supported that this practise had been all but eliminated – particularly when a ready check is
performed by the start-up clearance position.
All Italian CDM airports have adopted an ‘Aircraft Ready’ procedure
which prevents any flight communicating with the TWR until the flight
has been declared as ready for push by the airport operator. A visual
check is performed to ensure that a flight has a push vehicle in place,
with doors closed and pier bridge retracted. At TOBT + 5’, the TOBT
and TSAT are deleted and flights are removed from the sequence to
protect the utilisation of available capacity.
2.4.4 Asset Location Optimisation
The TSAT enables push vehicle operators to manage the location of their fleet to a more precise
picture of future demand. This is not only a benefit for the airlines they serve, but facilitates real cost
avoidance for the vehicle operators by:
Mitigating missed punctuality costs by prioritising vehicle location based on the turnaround
progress of all the flights under their contract.
Providing a reliable timestamp which enables the optimisation of asset location on the airfield.
Reducing fuel costs and the operational buffers required to provide the same level of service.
Improving asset utilisation to negate the need for additional assets as contract demands
increase.
The benefits above apply also to on-stand de-icing providers. Recognising this, Helsinki airport has
introduced an additional time-stamp called TOBTde-ice, which denotes when the aircraft will be ready
for on-stand de-icing. This timestamp enables the on-stand de-icing contractors to plan their
resources against the completion of the ground handling operations. During periods of heavy snow,
this provides additional flexibility for the de-icing providers to maximise the use of their trucks.

19 | P a g e
2.4.5 Push Delay
The number of instances where the push delay recorded was 5 minutes or more has reduced notably
for many of the CDM airports. Helsinki airport is such an example, whose month on month results
since January 2013 shows a trending decline and is illustrated in Figure 2-10 below.
Figure 2-10 Improvement in proportion of off-block delay instances greater than 5 minutes at Helsinki
A-CDM supports reductions in push delay by way of the following:
1. The improved off-block predictability and transparency of the TSAT timestamp provides
ground handling agents better information (when compared to schedules) to plan the location
of the push vehicles.
2. The TSAT procedure enables a reduction in ground movement congestion and push
contention - either of which could result in delay in pushing off-block.
2.4.6 Departure Rate
Some CDM airports have demonstrated an increase in their peak departure rate since becoming A-
CDM implemented. It is thought that the A-CDM process better supports an operation to realise a
more optimal runway departure sequence through the adoption of the TOBT and TSAT procedures
(as illustrated in Figure 2-11).

20 | P a g e
Figure 2-11 Factors contributing to the realisation of an optimal departure sequence at the runway
Specifically, the A-CDM procedures enable the following:
The PDS / DMAN contains fewer flights (within the sequencing calculation) that will be unable
to push on or near the TSAT window (see Phantom Flight Delay in Section 2.4.3).
Reductions in controller task loading provides spare capacity to facilitate an optimal departure
sequence at the runway (see ATCO Workload in Section 2.4.2).
RT activity is more distributed in accordance with TSAT, which causes a notable reduction in
controller workload and RT congestion, especially for the first departing wave and during a
recovery from a period of adverse conditions.
Instances of push delay are reduced which further protects the stability of the sequencing
calculation and predictability of the departure flow to the runway (see Push Delay in Section
2.4.5).
Figure 2-12 illustrates how the distribution of departure rates at both Madrid (LEMD) and London
Heathrow (EGLL) were impacted by the implementation of A-CDM. The analysis done to create the
plots was careful to extract periods of significant difference in demand over the comparison periods –
which consisted of many months of departing flight data. Both airports have seen an increase in the
peak and modal departure rates since adoption. This has been achieved without any increase in
runway pressure, but rather by ensuring a more optimal mix of aircraft at the runway holding point.

21 | P a g e
Figure 2-12 Departure rate distribution at LEMD and EGLL for pre and post A-CDM operations
At London Heathrow, it is thought that the departure rate increase has supported the recovery from
periods of disruption. Figure 2-13 illustrates how A-CDM supports a speedier recovery to normal
operations at London Heathrow. In A-CDM operations, 60 departures will take-off an average of 20
minutes sooner than prior to implementation. This results in significant reductions to knock-on delay,
flight cancellations and usage of the restricted noise and Night Jet Movement (NJM) quota.
Figure 2-13 Average time to achieve number of departures after a period of reduced capacity at LHR
(Source - data analysis of Heathrow Airport flight data)
Düsseldorf has also demonstrated record rates of recovery
from disruption. For example, after a 60 minute runway
closure on 2nd
November 2015, the airport had recovered
completely (every delayed flight departed) in just 45
minutes.

22 | P a g e
At Madrid, the peak departure rate increase has been most
noticeable in helping to clear the morning departure wave –
resulting also in the reduction of runway holding times at the start
and end of the wave.
Analysis of operational data from Gatwick Airport Limited
has confirmed that Gatwick is recovering more quickly
from periods of reduced departure capacity. The total
duration to depart 60 aircraft has reduced by almost 10%.
2.4.7 Apron Movements
The TSAT procedure supports a reduction in ground movement congestion and runway queue
reductions by retaining flights on stand until capacity in the ATM system is available to accept the
flight. Aptly coined green delay, this is a more fuel efficient and environmentally responsible means of
balancing capacity and demand. For A-CDM stakeholders, green delay results in the following
benefits:
Aircraft operators spend less time taxiing to and from the runway – resulting in very
significant fuel savings.
Fuel consumption and brake wear savings are particularly significant where runway holding
duration (and stop-start instances) are reduced.
Airports are able to claim the emission and noise reductions as part of their own
environmental targets.
ATC are working fewer aircraft on the apron, resulting in improved levels of safety and
service efficiency.
2.4.7.1 Taxi-Time Benefits
The reduction of taxi time is usually the main reported benefit of A-CDM implementations – being
cited as the main financial incentive for airlines to become engaged in the programme. In close co-
operation with each participating airport, this study has adopted a rigorous and data centric approach
to help discover or verify taxi-time performance improvements. The study has shown a taxi-time
improvement average in the range of 0.25 to 3 minutes per departure – as illustrated in Figure 2-14.
Lesser runway constrained airports such as Prague, Oslo, Venice, Stuttgart and Berlin Schönefeld
were still able to generate fuel and emission savings. For these airports, a more significant benefit is
realised during operational peaks (e.g. 3-5 minute saving per flight) – however an overall average of
less than 1 minute per flight is generated when considering the average of over the entire day.

23 | P a g e
Figure 2-14 Histogram of average taxi-out time improvements for CDM airports
The infographic below summarises the annual consolidated savings generated from 13 of the 17
CDM airports that have demonstrated tangible taxi-time performance improvements. The emissions
and fuel cost savings of Figure 2-15 have been calculated based on the parameters within the
EUROCONTROL Standard Inputs for Cost Benefit Analysis [Ref-3].
Figure 2-15 Infographic of consolidated annual taxi-time related savings for 17 CDM airports (estimated)1
1 Total relative savings across the 17 CDM airports in 2015 when compared to pre-ACDM performance.

24 | P a g e
2.4.7.2 Taxi-Time Improvement Factors
Taxi-time reductions could not been shown for all CDM airports – mainly as a result of the operational
constraints and/or characteristics of those airports. The following list describes some of the most
common reasons why taxi-time improvements might be either limited or non-existent at a CDM
airport:
Poor TSAT Stability - if the pre-departure sequencer is unable to produce a stable and
achievable departure sequence, then controllers are unable to build a smooth departure flow.
TSAT adherence – ATC are often pressured to release flights as early as possible to
maximise utilisation of assets and protect OTP. With years of operational experience behind
them, TSAT sequences could be contrary to controller intuition and it may take months for
ATC to have full confidence in the generated sequence.
Acceptable levels of delay – the political and commercial landscape at an airport often
strangles the full saving potential of TSAT procedure due to incompatible IATA punctuality
targets.
Re-sequencing flexibility – apron and taxiway layouts can determine the flexibility for
controllers to re-sequence aircraft within the departing flow. So too does the amount of
runway buffer applied in the system. For airports with a high amount of flexibility and runway
buffer, the TSATs generated might release flights earlier than airports with less flexibility
(where the runway buffer becomes less relevant). See Section 5.1.6.1 for more on this topic.
Traffic demand – for highly constrained runways and SIDs, throughput targets demands an
aircraft buffer at the holding point. Reducing the buffer requires very high levels of departing
and arrival flow predictability. The potential for buffer reductions (facilitated by the TSAT)
should grow as the overall predictability of operation improves.
Remote de-icing capacity – during winter operations, the de-icing pads often forms the
bottleneck of the departing flow. The integration of remote de-icing progress into the TSAT
calculation generates significant taxi-time saving opportunities, especially for airports with
limited remote de-icing capacity.
Work in progress – some airports have maintained constant taxi-time performance despite
longer standard taxi-routings that have resulted from airside works. The actual saving realised
in these cases is more difficult to quantify, but should still be credited to the airport as a
general taxi-time reduction.
Stand capacity – usually, an arriving aircraft will not be made to hold for a flight that is waiting
for start-up within the TSAT window. ATFM regulation is particularly damaging to taxi-out time
performance when a departing aircraft must push and hold to vacate the stand.
Rome Fiumicino (LIRF) is example of an airport whose local conditions supressed the scale of the
potential taxi-time improvements. During the local implementation, taxi-times reduced by almost 3
minutes per flight. In the subsequent year after network connection, the taxi-time returned to pre-CDM
levels. However, this occurred during periods of runway re-surfacing, increased traffic demand and
emerging stand capacity constraints. Although it is difficult to verify the exact impact of these factors

25 | P a g e
(within the scope of the taxi increase) – it is clear that A-CDM is helping to mitigate an increase of
taxi-times to beyond pre-implementation levels.
2.4.8 Off-Block Delay
At some CDM airports, the TSAT procedure has contributed to an increase in logged ‘89 codes’
where aircraft are held on-stand to absorb delay. Small amounts of ATC pre-departure delay at the
end of the rotation process means that flights are often allocated with a code 89 even though the
majority of the delay was incurred during the turnaround or inherited from the inbound leg. For
example, a 5 minute start-up and push delay could result in a code 89 even though the crew called for
start-up clearance over 11 minutes after the scheduled time of departure. Missed OTP due to TSAT
delay is one of the biggest political challenges faced by A-CDM programme leaders.
There is a clear incompatibility between the TSAT procedure and on-time
performance. However, the TSAT will not affect the time the aircraft leaves the
runway. Delay is simply transferred from the taxi-phase to the stand.
The perception that the TSAT procedure results in a general reduction in punctuality is not
substantiated. Seven of the 17 CDM airports showed improvements in the average levels of off-block
delay after implementation.
Figure 2-16 Average schedule delay by departure rate at Oslo (Source – PRU data analysis)
At some CDM airports, the average schedule delay (measured as the difference between the actual
and schedule off-block times) improves most prominently at medium levels of congestion –
represented herein by airport departure rates. Figure 2-16 illustrates the impact of the A-CDM
implementation on schedule delay at Oslo airport. As congestion levels increase, the TSAT delay
grows and the difference between the pre and post A-CDM case decreases. This effect is observed
across several CDM airports and the average benefit is within the range of 0.5 to 2.0 minutes per

26 | P a g e
departure. Reduced off-block delay performance results from (and is counterbalanced by) an
improvement in one or more the following delay components:
Phantom Start-Up Delay (see Section 2.4.3)
Push delay (see Section 2.4.5)
Reactionary delay (see Section 2.3.4)
ATFM Delay (see Chapter 4)
Figure 2-17 Average improvements in schedule adherence observed at CDM airports (Source – PRU &
Airport provided data analysis)2
Figure 2-17 describes the average schedule adherence improvements across all participating CDM
airports. Clearly, reductions in off-block delay results in improved OTP, as a larger proportion of flights
depart within the 15 minute schedule tolerance. For example, OTP at Munich airport improved by
4.5% between 2 directly comparable years of traffic either side of the A-CDM implementation date.
Ten CDM airports were unable to show a benefit in this area. However, it is important to note that the
CDM airports were subject to very high volumes of regulation in 2014 and 2015. Some airports were
more susceptible to the operational impact of high ATFM delay levels than others. For example,
Gatwick airport was hit particularly hard due to several waves of traffic being delayed by the same
airspace restrictions on both the outbound and inbound legs. The accumulation of delay over 3 or 4
waves (EasyJet is the main carrier) was too large to be absorbed within schedule buffers. It is likely
that more widespread improvements to off-block delay performance would have been realised should
CTOT volumes have been more like those experienced in the summers of 2012 and 2013.
2 This analysis only considered flights that departed after the scheduled off-block time. Early departures (where AOBT – SOBT
is negative) had an off-block value of 0.

27 | P a g e
Regulated flights that are departing from CDM airports do realise less ATFM
delay than flights from non CDM airports. However, the reduction of ATFM
delay volume is reliant on widespread A-CDM implementation across the ECAC
zone. These mechanisms are discussed in greater depth in Chapter 4.
2.4.9 Winter Operational Resilience
During periods of winter conditions, poor predictability can quickly lead to operational chaos –
particularly when the demand for snow & ice removal equipment outweighs supply.
A-CDM has enabled the progress of de-icing and runway snow removal to ensure that a more precise
picture of runway and de-icing capacity is always available at all time. This leads to shorter aircraft
buffers at the runway and remote de-icing pads. It also
results in less fuel burn and fewer holdover violations
without compromising the utilisation of the runway.
Compliance with the slot tolerance window is more
achievable, as the issued slot is consistent with the
evolving situation on the airfield. Factors that are integrated into the TSATs include the increased
taxi-out times, de-icing time durations and scheduled runway snow removal (if applicable).
At Helsinki, winter operations are considered ‘normal operations’ and the
TSAT procedure has helped to reduce the average taxi-out time by 0.7
minutes. Also, this has been achieved over a period where the airport has
increased the proportion of remote de-icing from 30% to 70%.
Zurich airport noted that de-icing process was once an
“operational black hole” and that the integration of accurate de-
icing time estimates and progress milestones has had a big
impact on improving resource and asset utilisation during winter
operations.
Munich recorded a 5% reduction in flight cancellations between 2005
and 2009, resulting in an operating cost avoidance of €2 million across
stakeholders. The integration of de-icing milestones into the A-CDM
process is thought to have contributed heavily to this improvement.
Paris CDG has implemented an A-CDM cell which serves to bring
key stakeholders together during periods of severe disruption.The
A-CDM dashboard presents relevant information sources that
enables joint analysis and improved tactical decision making.

28 | P a g e
Figure 2-18 The A-CDM cell (left) and participating stakeholders (right) at Paris CDG
2.5 Take-Off Predictability Benefits
Take-off predictability is defined by both the mean take-off accuracy and the standard deviation of
that accuracy. Improved take-off predictably is the key enabler of network benefits which includes
improved levels of safety and potential enroute capacity buffer reductions. Chapter 3 presents the
results of a study into the impact of A-CDM and Advanced ATC Tower airports on levels of traffic
predictability across the network.
2.5.1 Take-Off Accuracy
Take off accuracy is defined as the difference between the actual take-off time (ATOT) and the time
that ETFMS expects the flight to become airborne. The ETOT from the flight plan serves as the
ETFMS take off reference for non-CDM airports. Once connected, the reference becomes the TTOT
that is sent within the DPI message payload.
NON INTEGRATED NETWORK INTEGRATED
ATOT - ETOT ATOT - TTOT
All CDM airports (and Advanced ATC Towers) have demonstrated significant improvements in take-
off predictability which is observed as:
The convergence of the mean take-off accuracy towards zero.
A significant reduction in the standard deviation of the take-off accuracy.
Figure 2-19 illustrates the improvement in take-off predictability of CDM airports at both the T-DPI-s
(left) and A-DPI (right) milestones when compared to the flight plan ETOT. All the A-CDM plotted
values are based on actual flight data from AIRAC cycle 1507 (June & July 2015).

29 | P a g e
Figure 2-19 Evolution of the mean and standard deviation of take-off accuracy for 16 CDM airports
(Source - DDR2 data analysis)
Flights from non-CDM airports tend to depart much later than ETFMS expects – this is largely driven
by the requirement for EOBT updates (via the CHG or DLA message) only when a delay exceeds 15
minutes. For flights transmitting T-DPI-s and A-DPI messages, the standard deviation of take-off
accuracy has reduced from an average of 14 minutes to around 7 and 5 minutes respectively
(depending on the time of year).
The analysis that generated Figure 2-19 considered the TTOT values from the
last DPI update sent to ETFMS and cannot therefore verify the stability of the
TTOT sent between the sequencing and take-off events.
The local implementation of A-CDM has also shown to have had some impact on the levels of take-off
predictability within ETFMS. The TOBT procedure and the controls in place to ensure its consistency
with the flight plan EOBT has been reflected in small take-off predictability improvements at some of
the CDM airports. Figure 2-20 illustrates the variation in take-off accuracy throughout the day at
Düsseldorf airport during pre-CDM (AIRAC 1107), local-CDM (AIRAC 1207) and network-CDM
(AIRAC 1507) operations.

30 | P a g e
Figure 2-20 Hourly take-off accuracy at Düsseldorf (EDDL) by CDM implementation state (Source – DDR2
data analysis)
Local benefits of improved take-off predictability include:
Reduced levels of ATFM delay which result from enroute or destination airport flow
restrictions.
Reduced flight activation monitoring (FAM) suspensions.
Improved ATFM slot adherence.
Enabler of single engine taxi (SET) procedures.
2.5.2 ATFM Delay
In the main, flights from CDM airports receive less ATFM delay than those from non-CDM airports.
This study has generated a significant amount of analysis to verify this result and is presented in
Chapter 4.
2.5.3 FAM Suspensions
If a flight is not reported as airborne 30 minutes after the ETOT / TTOT, NMOC will automatically
suspend the flight and release the ATFM slot occupied by the flight.
The TTOTs sent within the DPI message payload have helped to all but eliminate FAM suspensions
from CDM airports. Prior to A-CDM, Skyguide noted that FAM suspensions were a particular
nuisance at Zurich airport, mainly due to the sudden onset of weather related capacity reductions. For
flights already taxiing, this could result in additional workload for ATC in negotiating the release of the
flight (with NMOC) without blocking other flights in the sequence.
As a focus area of the German Harmonization initiative (see Section 5.1.1), all German CDM airports
now send an A-DPI to NMOC when flights enter the de-icing bays (if the TTOT changes by more than

31 | P a g e
5 minutes). This updated TTOT has reduced the number of FAM suspensions generated by
unexpected de-icing delays or holdover time violations that might require an aircraft to be treated
twice.
Some airport feedback has suggested that FAM suspensions had become more frequent after A-
CDM implementation – mainly in instances of severe disruption where many flights have an unknown
TOBT. In such instances, the A-CDM procedure is for the TWR to send a C-DPI to NMOC which will
suspend the flight and stop the FAM timer. The reluctance for ATC to send C-DPI for many flights that
are ready and waiting for start-up clearance is appreciated, given the potential backlash from the
airlines and the uncertainty in the time in which departure capacity would be recovered. This is an
example of when an A-CDM actor is subject to ‘blame culture’ which could dissuade them from
following the procedure that is designed for the benefit of the whole community. Indeed, the
relevance of FAM to CDM airports has been raised on more than one occasion, given the core aims
of the concept in providing a refined take-off estimate to NMOC up until the point of departure.
2.5.4 ATFM Slot Adherence
ATFM slots generated for flights departing from CDM airports are better suited to the operational
constraints of the airport at the time. As a result, ATC are better able to ensure take-off clearance
within the slot tolerance window (STW), whilst minimising the disruption to other flights in the
departure flow.
A more achievable CTOT is made possible through the improved accuracy of the TTOT (and the
EXOT) that is published within DPI messages.
For Europe’s top 30 airports, the proportion of ATFM regulated departures rose from 8.2% in 2013 to
9.1% in 2014. Despite this, the share of flights outside of the STW decreased from 11.3% in 2013 to
10.4% in 2014 [Ref-2]. CDM airports have had a positive influence on this improving performance
trend.
For most CDM airports, 2014 and 2015 saw an increase in the both traffic demand and the volume of
regulation. However, no CDM airport experienced a reduction in their average ATFM slot adherence
performance over this time. Some CDM airports continued to increase slot adherence performance
even with a pre-implementation values that exceeded 90%.
Figure 2-21 shows the range of slot adherence improvements attributed to CDM airports between
2013 and 2014. Zurich and Stuttgart airport showed the biggest increase of 4% and 5% respectively.
Madrid airport showed no increase; however performance was already at 96% for both 2013 and
2014 – leaving very little room for further improvement.

32 | P a g e
Figure 2-21 Increase in average ATFM slot adherence for CDM airports between 2013 and 2014 (Source –
PRU Data Analysis)
2.5.5 Single Engine Taxi Procedures
London Heathrow has reported that British Airways (and other airlines) are using the TTOT to support
single engine taxi procedures. The TTOT is transmitted to the flight deck via ACARS and supports the
crew in planning the spool-up time of the second engine.
ACARS is not a strict requirement for airlines to practise single engine taxi in this way. However the
TTOT at pushback should be stable and the procedures in place with ATC to alert controllers if the
taxiing aircraft might not be ready to depart - should the ground movement situation change.
Single engine taxi has positive implications for the noise and emissions footprint of the airport – not to
mention the resulting fuel and engine life benefits for the aircraft operators.

33 | P a g e
3 Network Impact Assessment
From the perspective of the ATM network, flights departing from CDM or Advanced ATC Tower
airports do so more predictably than those from airports that do not send DPI messages. Figure 3-1
illustrates the difference in off-block take-off accuracy for all DPI connected airports during AIRAC
1507 (June & July 2015).
Figure 3-1 Take-off predictability of non DPI and DPI connected airports during AIRAC 1507(Source –
DDR2 Data)
Appendix A provides some high level information into the function of ETFMS and the operational
impact of poor traffic predictability on both the safety and efficiency of enroute ATC sectors.
3.1 Objectives
A study published by EUROCONTROL [Ref-1] demonstrated quantitatively that improved take-off
predictability reduced the potential for sector over-delivery which in turn, could result in the reduction
of enroute sector buffers without compromising levels of safety. The study was based on the take-off
predictability performance of Munich airport in 2007.
Given that 18 CDM airports (as of January 2016) have now come online, an objective of this work
was to use historical ETFMS data to refine the model parameters to more accurately reflect
operational reality. Another objective was to explore the mechanism for sector-delivery in more detail
in order to better determine the potential for declared enroute capacity increases at the state and
ANSP level.

34 | P a g e
3.2 Methodology Overview
EUROCONTROL’s NEST software tool was used extensively for this study. NEST is capable of
generating trajectories for all ECAC departures that comply with the route availability document (RAD)
and regulation plan for any operational day that is modelled. These trajectories may then be ‘shifted’
backwards or forwards in time to reflect the take-off uncertainty at the departure airport at that time of
day. Figure 3-2 illustrates just some of the generated trajectories through a particular sector over
Germany during a single hour of a day.
Figure 3-2 Modelling trajectories through a single control sector in NEST over one hour
By modifying the take-off predictability at different airports, it is possible to quantify the impact of
increasing airport-network integrations on individual sector over-delivery counts (like the sector
illustrated in Figure 3-2 above) – which are also calculated by NEST.
The instances of a sector over-delivery may then be aggregated to the ANSP and ECAC level to
approximate the enroute capacity buffer reduction that is enabled by the number of CDM or Advanced
ATC Tower airports in the model.
When assessing take-off predictability, there is no distinction made between an
Advanced ATC Tower and a CDM airport, since this scope of this study is
limited to the improved take-off accuracy at the off-block event. The impact of T-
DPI-t and T-DPI-s messages on the network is something that could not be in
scope of this study but constitutes the main recommendation for any future
extensions to this work.

35 | P a g e
3.2.1 Model Refinements
This activity has adopted a very similar approach to that taken in the previous network impact study
[Ref-1]. NEST was used to simulate ECAC wide trajectories and develop sector saturation statistics
for all operational sectors within the modelled area – as illustrated in Figure 3-3.
This study has adopted refinements to the previous work to help improve the reliability of the
generated results; these refinements are described in the sub-sections below.
Figure 3-3 ACCs modelled in NEST
3.2.1.1 Take-Off Time Predictability by Airport and Hour
The previous study considered the take-off predictability performance of Munich airport and applied
that for all CDM airports. As data analysis has shown, this can vary significantly for different airports
over the course of the operational day. Therefore, the new model incorporates hour specific take-off
time predictabilities for each CDM airport that is based on real operational data.
Figure 3-4 The PDF of take-off accuracy at LEMD between the hours of 07:00 and 08:00 (Source DDR2
data analysis)

36 | P a g e
Figure 3-11 above illustrates the difference in take-off predictability at Madrid airport between 07:00
and 08:00 for pre A-CDM (AIRAC 1207) and post A-CDM operations (AIRAC 1407). This level of
performance granularity has been factored into the working model.
3.2.1.2 Number of Scenarios
8 scenarios were generated that increased the number of CDM airports incrementally from 0 to 70.
Each scenario differs only by the number of CDM / Advanced ATC airports modelled. The order in
which airports were integrated into the network was by virtue of their ranked IFR traffic movements as
recorded in 2015. Figure 3-5 illustrates the percentage of ECAC departures that are publishing DPI
for each operational scenario – which ranges from 28% to 83% between 10 and 70 airports
respectively.
Figure 3-5 Number of airports and corresponding CDM departures that are modelled in each operational
scenario
3.2.1.3 Number of Simulations
The previous study [Ref-1] generated conclusions based on the simulation of 3 days of operational
data within AIRAC 0707. In this study, 15 operational days were simulated over the 5 busiest days of
AIRACs 1207, 1307 and 1407. These simulations were repeated for each of the operational
scenarios above – resulting in a total of 120 days of traffic simulations conducted in NEST.
3.2.2 Saturation Analysis
For each simulation, NEST calculates the saturation of each operational sector every 20 minutes –
where saturation is the number of aircraft in the sector as a percentage of the declared capacity. Any
saturation over 100% counts an over-delivery. Each saturation calculation across each simulation is
then aggregated up to both the ECAC and ANSP level so that:

37 | P a g e
1. The exact number of sector over-deliveries can be calculated at the ANSP and ECAC level
for each operational scenario.
2. A saturation probability distribution function (PDF) can be developed to enable the estimation
of enroute sector capacity increases at the ANSP and ECAC level for increasing number of
network integrated airports.
For brevity, a detailed explanation of how saturation analysis yields estimations of enroute capacity
increases is not described here. If interested, the reader can refer to Section 5.2.3 of the original
EUROCONTROL study [Ref-1].
3.3 Initial Results
Saturation analysis revealed that at the ECAC level, increasing the number of connected airports
results in a general reduction in the potential for sector over-deliveries – as illustrated below in
Figure 3-6.
Figure 3-6 ECAC wide over delivery count by number of CDM airports
However, at the ANSP level, the results do not always follow this pattern. For some ANSPs, the
likelihood of an over-delivery could first increase before showing a decline. Other ANSPs showed little
positive impacts when the results are aggregated at this level.
Figure 3-7 illustrates the percentage reduction in sector over-deliveries by ANSPs when 30 CDM or
Advanced ATC Tower airports are integrated into the network. The most optimistic results are shown
for NATS and Maastricht Upper Area Control (MUAC) – with an almost 20% reduction in over-
deliveries.

38 | P a g e
Figure 3-7 Percentage reductions in over-deliveries by ANSP for 30 integrated airports
Figure 3-7 describes how same indicator varies with the number of airport integrations for the ANSPs
NATS, Maastricht and ENAV. The responses illustrated in Figure 3-7 are typical for many ANSPs
within the ECAC zone for their instability and erratic nature. A common characteristic of each of the
ANSPs results is that there appears to be some point in which an increase in the number of
integrated airports can actually result in a temporary increase in over-delivery potential.
Figure 3-8 Evolution of sector over-delivery percentage reduction by number of integrated airports

39 | P a g e
3.4 Sector Stream Saturation Analysis
The results presented above suggest that there exists a mechanism which is responsible for driving
unstable (and unpredictable) sector over-delivery reductions as the number of connected airports
increases. To better understand this, a numerical model was built to simulate the arrival of flights into
a single sector with varying levels of precision – as determined by the take-off accuracy at the
departure aerodrome. Simulation variables of this sector model included:
1. The number of sector entry streams – 2, 3, 4 and 5 streams were evaluated.
2. The proportion of flights on a sector stream sending DPI messages – evaluated in 10%
increments from 0% to 100%.
3. The take-off predictability of flights departing from connected and non-connected airports –
the study assumed a standard deviation of 14 minutes for non-connected airports and 3,5
and 7 minutes were evaluated for airports transmitting DPI. These values are consistent with
the range of performance exhibited by current CDM and Advanced ATC Tower airports as
illustrated Figure 3-1.
A computer simulation was developed to run thousands of iterations of a stochastic numerical model
in which 2 different modes of increasing DPI flight saturation within the sector was increased.
In the first mode, the proportion of ‘DPI flights’ within the sector opening window is increased ‘by
stream’. This means that each arrival stream would be fully saturated with DPI flights before the next
stream is permitted to increase. In the second mode called ‘uniform’, each stream increases the
saturation of DPI flights by 10% in turn until all the streams are fully saturated with DPI flights.
Figure 3-9 The 2 modes of increasing the saturation of DPI flights along a sector arrival stream
In reality, the saturation of DPI flights (over time) into a sector will be comprised of a mixture of these
2 modes. However, the simulation of these modes provides insight into the boundary level responses

40 | P a g e
of sectors that might operate close to one of these 2 modes and subsequently, could be affecting the
aggregated results of the sector over-delivery results presented in Section 3.3.
3.4.1 Sector Stream Analysis Results
Figure 3-10 illustrates the results on sector over-delivery potential for the ‘by stream’ (top) and
‘uniform’ modes (bottom) of increasing DPI flight saturation between 0 and 100%. Figure 3-10 shows
the results of the 3 stream simulation.
In the ‘by stream’ mode, consistent reductions in over-delivery potential are realised at around 30%
DPI flight saturation – which corresponds to the first stream becoming fully saturated. The subsequent
rate of improvement is then highly dependent on the arrival predictability of the flights into the sector.
A standard deviation of 3 minutes generates more significant improvements than the 5 and 7 minute
scenarios – with a peak over-delivery reduction of 50% estimated when the sector is fully saturated
with flights transmitting DPI messages.
Results of the ‘uniform’ mode are quite different. Before 70% DPI flight saturation, the sector will most
probably show an increase in the potential for an over-delivery. The severity of the increase is
determined by the take-off predictability of the flights entering the sector. Paradoxically, the more
predictable the traffic, the worse the situation could become. The results show an arrival predictability
standard deviation of 3 minutes could increase the over-delivery potential by 20% and a standard
deviation of 7 minutes will result in little or no increase in over-deliveries. After 70% DPI flight
saturation, the sector then starts to show dramatic reductions in over-delivery potential with fully
saturated values that are equivalent to the ‘by stream’ mode (50% reduction).

41 | P a g e
Figure 3-10 Results of 3 stream sector over-delivery simulation by stream (top) and uniform (bottom)
modes of increasing DPI flight saturation
3.4.2 Reduced Flexibility
The results of the ‘uniform’ mode that are illustrated in Figure 3-9 (bottom) go a long way to describe
the erratic response of the NEST saturation analysis at the ANSP level – as presented in Section 3.3.
It is thought the increasing predictability of flights entering a sector could reduce the overall flexibility
of a sector in handling the poor arrival time accuracy of other flights. Effectively, the sector becomes
more ‘brittle’ until the proportion of DPI flights within the sector exceeds a critical point. This critical
point – which analysis suggests being around 70%, is the point at which the probability of a flight
whose arrival inaccuracy will result in an over-delivery situation reduces significantly.
The conclusion to be made from this numerical analysis is that the potential for
over-delivery reductions within a single sector depends on the geographic
location of the sector, the number of arrival streams feeding the sector and the
average predictability of traffic along each stream.
3.4.3 Combined Mode Results
Both modes were randomly combined and the same sector parameters were simulated over
thousands of runs to support more general conclusions regarding the impact of increased A-CDM and
Advanced ATC Tower implementation across the ECAC zone. This analysis will also support local
(ANSP and FMP) safety analysis teams in understanding when safety buffers within their operational
sectors could likely be reduced based on the location and performance of network connected airports
that are feeding their enroute sectors.

42 | P a g e
Figure 3-11 shows the results of this simulation in which 2, 3 and 4 arrival streams are modelled. The
left and right graphs differ only by the arrival predictability performance of DPI flights (standard
deviation of take-off accuracy) of 3 and 5 minutes respectively.
Figure 3-11 Combine mode simulation results using a standard deviation of take-off accuracy of 3 (left)
and 5 minutes (right)
The results from this analysis support the following conclusions about the response of an individual
sector to increasing DPI flight saturation (between 0 and 100%):
Below 30% DPI flight saturation, the response of a control sector to improved traffic
predictability could be to increase the likelihood of sector over-deliveries.
Between 30% and 60% DPI flight saturation, the risk of over-delivery tends to reduce but
might not provide enough of an improvement at current levels of take-off predictability (5
minutes) to support a reduction in safety buffers.
60% DPI flight saturation is required to generate strong and reliable over-delivery reductions.
A sector with 3 arrival streams shows the most aggressive improvements after 60% DPI flight
saturation – but is more susceptible to increased over-deliveries at low DPI flight saturations (
30% or less).
With a take-off predictability of 5 minutes (shown by DPI flights within the sector), the
maximum reduction in over-delivery potential that could be achieved is around 20%. The 3
minute take-off predictability case generates maximum reductions in over-delivery of between
35% and 50%. However, very few CDM or Advanced ATC Tower airports are currently
providing this level of take-off predictability at the off-block milestone.
Figure 3-12 illustrates general conclusions on the potential for over-delivery reductions based on all
the possible modes by which the saturation of DPI flights could increase between 0 and 100%.

43 | P a g e
Figure 3-12 Relationship between the percentage of DPI flights feeding a sector and over-delivery
reduction potential
3.5 Current ACC Saturations
Figure 3-13 shows the proportion of flights transiting through different ACCs that originated from a
CDM airport. This graphic is generated from an hour of traffic between 0900 and 1000 on November
5th 2015.
Figure 3-13 Proportion of flights originating from CDM airports by ACC for 1 hour on 5th
November 2015
% of CDM Flights (5 Nov 2015)
< 8%
8% - 17%
17% - 29%
29% - 37%
37% - 47%

44 | P a g e
This graphic shows that 18 CDM airports are now generating A-CDM flight saturations (at the ACC
level) of between 30% and 50%, for a large proportion of the ‘core’ ECAC zone. Linking back to the
stream analysis of Section 3.4, this would suggest that many of the operational sectors within the core
zone are now close to experiencing levels of traffic predictability that will significantly (and reliably)
reduce the potential for enroute sector over-deliveries (which is thought to occur at around 60%
saturation).
3.6 ECAC Wide Conclusions
Results from the NEST simulation (Section 3.3) and sector stream analysis (Section 3.4) has
supported the refinement of the enroute capacity improvement projections within the ECAC core area
– as was originally proposed within the previous EUROCONTROL study [Ref-1]. Figure 3-14 shows
the new estimations – which include both a high and low response of the network to increasing DPI
flight saturation.
The high response is generated when the standard deviation of take-off accuracy within ETFMS is 3
minutes, which is the current best in class value. The low response is generated based on the 5
minute standard deviation of take-off accuracy, which represents the current average of all Advanced
ATC Tower and CDM airports.
Figure 3-14 Estimated enroute capacity increase potential within core ECAC core area depending on
standard deviation (SD) of take-off accuracy
To remain consistent with the previous study, the implementation ordering that generated the curves
in Figure 3-14 was by 2015 IFR traffic ranking. However, the actual order of implementation to date
has been quite different and has not included some of the larger airports (i.e. EHAM, LOWW &
EPWA) that were simulated to have implemented DPI earlier than some of the smaller airports (i.e.
LKPR, UKBB and LIPZ).

45 | P a g e
As of January 2016, 42% of ECAC departures originate from a total of 36 CDM and Advanced ATC
Tower airports. The top 18 airports of 2015 would have generated the same proportion of departures
transmitting DPI messages to NMOC.
This study has resulted in the following high level conclusions regarding the impact of increased DPI
flight saturation across the network:
Enroute capacity improvements will commence later and will not be as significant as those
suggested by the previous study.
The results suggest that 45% of flights transmitting DPI is required to achieve a 2%
improvement in enroute capacity. Based on the implementation progress in January 2016,
this could be achieved after the integration of 2 or 3 more medium sized airports (assuming
these airports feed a large proportion of departures into the core ECAC area).
Based on current levels of DPI saturation in the network, we are almost halfway (as of
January 2016) to being able to achieve the full enroute capacity improvement potential at the
current average levels of take-off predictability (standard deviation of 5).
Around 80% of the available enroute capacity benefit will be realised when the top 30 airports
are integrated (or 57% of ECAC departures are transmitting DPI).
Based on current levels of take-off predictability (standard deviation of 5 minutes), enroute
capacity gains will peak at around 3.5% when the top 50 airports become network integrated
(or 73% of ECAC departures are transmitting DPI).
When more airports are able to show best in class levels of take-off predictability (standard
deviation of 3 minutes), the benefits to enroute sector capacity could continue to increase to
around 5.5%.

46 | P a g e
4 ATFM Delay
4.1 Improvement Mechanisms
CDM airports have been shown to generate better ATFM slots with less average ATFM delay per
regulation than prior to full A-CDM operations.
The Enhanced Traffic Flow Management System (ETFMS) is a NMOC subsystem that is responsible
for managing the balance of traffic capacity and demand, which includes the generation and
publication of ATFM slots. ETFMS calculates 4D trajectory profiles based on flight progress message
updates received of both planned and active flights. DPI messages enable the refinement of these
profiles for A-CDM departures based on the real time progress of the arrival and ground trajectory
phase – as reflected in the TOBT, TSAT and TTOT.
A CDM airport is able to better mitigate ATFM delay due the manner in which A-CDM flights are
prioritised by ETFMS and the mechanism that is in place for automatically improving on an issued
slot.
4.1.1 Slot Allocation
When building the original sequence of flights entering the restricted flow area, ETFMS will allocate all
slots based on the arrival ordering at the entry of the restricted flow, as determined by the estimated
time over (ETO) the flow entry point and the current flight status.
For a non-CDM departure, the new EOBT of a DLA message is not only used to calculate a new
CTOT, but is also used as the new reference time of the flight. For CDM departures, the airport slot
time (sent by CDM airports in the E-DPI message payload) is retained as the flight reference, despite
the new EOBT sent within the DLA message or delays due to TOBT updates. In case the CDM airport
is not coordinated, it sends the schedule off-block time that comes from the airport system. As a
result, CDM flights will not be subject to additional penalisation as ETFMS attempts to optimise the
slot allocations and distribute delay.
4.1.2 Slot Smoothing
The initial slot list is likely to change significantly. Take-off time unpredictability results in traffic
bunching in which one or more of the slots become oversubscribed. If possible, ETFMS will re-
allocate slots to flights on the ground to both maximise the use of airspace capacity and prevent over-
deliveries into the flow restriction – as illustrated in Figure 4-1.

47 | P a g e
Figure 4-1 Illustration of how traffic unpredictability necessitates slot smoothing by ETFMS
The impact of improved take-off predictability into a regulation is to reduce the
amount of traffic clustering that ETFMS needs to resolve. This results in
improved slot utilisation, increased CTOT stability and a reduction in overall
ATFM delay issued as part of each flow restriction. A study performed by
EUROCONTROL [Ref-6] suggested that 21% of all ATFM delay and 5% of slots
are due to unused slots that are formed as a result of poor departure
predictability.
4.1.3 Automatic Slot Improvements
For A-CDM flights that send an ‘optimal TTOT’ within a T-DPI-s message, ETFMS will attempt to
improve a slot to a point that is no earlier than this ‘no slot before’ time. Depending on the
transmission time of the T-DPI-s, this improvement can happen as early as 40 minutes before the
TOBT of the flight. A-CDM flights are assigned ‘REA’ status before they are ready to push due to the
increased confidence in the take-off time (TTOT) provided to NMOC.
Details of the T-DPI-s message requirements necessary to facilitate for automatic slot improvements
can be found within the EUROCONTROL DPI Implementation Guide [Ref-4].
The mechanism to achieve the same result for non A-CDM airports is via the REA message. REA is
sent by ATC to confirm that a flight is ready to depart and that it may accept any CTOT improvement
(depending on the line-up time) from the time at which an advance is issued.
DPI messaging enables flights to establish REA status much earlier than for
non-CDM airports. ETFMS has significantly more time to find an available
CTOT improvement for the CDM flight.
4.1.4 Early Delay Notification
The potential for flights to be awarded an earlier CTOT is improved if NMOC is notified earlier of the
delay via T-DPI messages.

48 | P a g e
Slots are first published at the Slot Issue Time (SIT) of EOBT – 2hrs. After this time, the T-DPI-t and
T-DPI-s updates might result in the recalculation of the 4D trajectory within ETFMS. Generally, there
exists a reluctance to file a delay to the EOBT until it is absolutely clear that the flight will not be able
to push within the tolerance window of EOBT + 15’. This is due to a fear that a disproportional amount
of CTOT delay may be issued in response to the DLA / CHG message.
Consider the following scenario for a flight receiving an ATFM slot with a 30 minute delay. The flight
will not meet its EOBT due to the late arrival of the inbound leg. The ECAC zone is subject to heavy
weather and capacity related restrictions.
4.1.4.1 Non A-CDM Scenario
Although the inbound flight is late by 30 minutes, it is hoped that the turnaround could be expedited
so that flight is able to call for start-up within 15 minutes of the EOBT. Additionally, local procedures
give the flight additional flexibility to be ready within ‘x’ minutes of the CTOT – such that the EOBT re-
file is not mandatory (for start-up clearance) as long as the slot tolerance window (STW) can still be
achieved.
In this scenario, the slot is missed and the flight is forced to file a DLA/CHG message. Several flights
around the ECAC zone are competing for the same slot entry time which corresponds to the revised
EOBT. As a result, the flight receives a new ATFM slot with a delay that was significantly longer than
the delay to the original EOBT.
4.1.4.2 A-CDM Scenario
In the A-CDM scenario – the ELDT of the late inbound is used to drive the TOBT update of the
departure flight (directly or via manual input that is in response to a CDM alert). A more accurate
TOBT and TTOT is known and submitted to NMOC via a T-DPI-t. This does result in a later CTOT;
however it is not a disproportional increase in CTOT as there is a slot available due to the delay being
filed at this earlier time. Submitting delay earlier has enabled the flight to take advantage of a slot
which would subsequently have been filled if the delay had been filed later (nearer to the new EOBT).
Other A-CDM flights that are delayed by the same restriction might now be advanced to the slot
created by this delay (as long as a ‘no slot before’ time for the other flight is set within ETFMS which
is earlier than the current CTOT).
This mechanism is particularly powerful in ensuring that A-CDM flights receive the most suitable slots
during restrictions due to weather and ATC equipment failure. If a restriction is activated after the
EOBT – 2hr milestone, then a flight that has sent a T-DPI-t with an accurate delay will incur less
ATFM delay than a flight that ignores its own late-departure in hope that the restriction will be lifted.
Delay notifications via the T-DPI-t significantly reduces the risk of ‘bad’ ATFM
slots and releases other slots for other flights to utilise earlier. These could be
flights from the same operator at the same CDM airport, or elsewhere in the
network.

49 | P a g e
4.2 Historical Results
Regulation data between January 2012 and December 2015 has been analysed to understand the
operational impact of A-CDM on the amount of ATFM regulation across the network.
4.2.1 Average ATFM Delay per Regulation
The average ATFM delay per flight reduces as the proportion of A-CDM flights within a regulation
increases. On average, A-CDM flights also incur less ATFM delay than those departing from non
CDM airports. Figure 4-2 illustrates that A-CDM has so far contributed to a 3 minute reduction in
average ATFM delay for arrival restrictions (top) and a 2 minute reduction for enroute restrictions
(bottom).
Figure 4-2 Average ATFM Delay by proportion of A-CDM flights within a regulation
10
10

50 | P a g e
The results in Figure 4-2 suggest that:
1. The proportion of A-CDM flights through a flow restriction needs to reach between 10 and 15
percent before reductions in the average ATFM delay become significant.
2. A-CDM departures perform consistently better than flights from non A-CDM airports – by an
average of 1 minute.
3. The downward trend suggests an average ATFM delay of 12-14 minutes could be realised
when the saturation of A-CDM flights through a flow restriction reaches 50% It was 18
minutes in average in 2015.
4. The trends in historical ATFM delay suggest that 40 CDM airports could yield reductions in
average ATFM delay of between 20% and 25%. This is compared to flow restrictions in which
no CDM airports participate and is consistent with the findings generated in the previous
study [Ref-1].
4.2.2 Delay Probability
An average reduction of 2 or 3 minutes in ATFM delay is difficult to express as a tangible operational
benefit to aircraft operators. A stronger case is to show how A-CDM flight saturation within a
regulation affects the probability of receiving a specific amount of delay.
Table 4-1 shows how the probability of receiving 20 and 40 minutes of ATFM delay is influenced by
whether a flight is departing from a CDM airport and the proportion of CDM flights that are feeding the
flow restriction. Values in this table are generated from the cumulative probability distributions of all
regulations issued in the ECAC zone between January 2012 and December 2015.
For a flow restriction with no participating A-CDM flights, the probability of receiving a delay of 20 and
40 minutes is 53% and 22% respectively (as indicated in red in Table 4-1). As the proportion of CDM
flights moves above 10%, the probability of receiving the same delay reduces notably. For a
restriction with 40% A-CDM flight participation, the probability of receiving a 40 minute delay reduces
to 4% for CDM flights and 7% for non CDM flights – almost 4 times less (as indicated in green in
Table 4-1).
Delay (mins) / Airport CDM State
% CDM Flights in Regulation 20 / CDM 20 / NON-CDM 40 / CDM 40 / NON-CDM
0 53% 22%
10 50% (-2%) 52% (-1%) 20% (-2%) 21% (-1%)
20 45% (-8%) 50% (-3%) 10% (-12%) 14% (-8%)
30 42% (-11%) 47% (-6%) 7% (-15%) 11% (-11%)
40 39% (-14%) 45% (-8%) 4% (-18%) 7% (-15%)
Table 4-1 Probability of receiving at least 20 and 40 minutes of ATFM Delay by CDM state

51 | P a g e
4.2.3 ATFM Delay Share Index
The ‘ATFM Delay Share Index’ has been proposed to help quantify the competitiveness of a CDM
airport in generating more favourable slots for its customers.
For any one flow restriction, this index is defined as the ratio of the proportion of total ATFM delay
attributed to that airport across the whole restriction, to the proportion of total slots allocated to the
airport. So, if an airport feeds 50% of flights through a flow restriction and receives 50% of the delay -
then this ratio is 1. If the airport feeds 50% of flights but only receives 25% of the total delay - then
this ratio is 0.5.
If this ratio is greater than 1, then the airport is receiving a disproportional level of delay based on the
total number of slots allocated. Lower than 1 suggests the airport generates less delay for the number
of slots allocated.
ATFM Delay Share Index = Proportion of DelayProportion of Slots
Analysis of regulation data since AIRAC 1201 (January 2012) has shown some clear and dramatic
improvements in the average ATFM Delay Share Index for a CDM airport. This is realised almost
immediately upon connecting to the network – as illustrated in Figure 4-3 for Rome (LIRF), Oslo
(ENGM) and Düsseldorf (EDDL). All three airports shown in Figure 4-3 have realised an average
ATFM Delay Share Index of between 0.8 and 0.9 after connection. Of all the CDM airports, Venice
(LIPZ) has shown the best improvement since connection, with the Delay Share Index falling from
0.97 to 0.72.
Figure 4-3 Average ATFM Delay Share Index Evolution for EDDL, ENGM and LIRF

52 | P a g e
4.2.3.1 ATFM Delay Share Index by State
An analysis was performed to evaluate the average ATFM Delay Share Index for each country within
the ECAC zone. The ranked assessment for AIRAC 1207 (August 2012) and 1507 (August 2015) is
presented in Figure 4-4 and Figure 4-5 respectively.
During AIRAC 1207, it is clear that the worst ATFM delay share index performance is concentrated
around the core of the ECAC zone – particularly for German, Austrian and Norwegian airports. These
countries were ranked in the bottom 10% of all ECAC member states – as is illustrated in Figure 4-4.
In AIRAC 1207, only 4 airports where connected to the network (EDDM, LFPG, EDDF and EBBR) –
which constituted less than 7% of all ECAC zone departures. ATFM delay probability analysis (see
Figure 4-2) has shown that it requires between 10% and 15% A-CDM flight saturation through a flow
restriction to make a notable improvement on the amount of delay (and subsequent delay share)
experienced by flights. Therefore, it is probable that in August 2012, there were insufficient A-CDM
flights participating in flow restrictions to generate a better ATFM Delay Share Index result for
Germany.
Figure 4-4 Delay Share Index ranked groupings by ECAC state for AIRAC 1207
In AIRAC 1507 (see Figure 4-5), the situation is quite different. With the exception of France, all
states that have 1 or more NMOC connected CDM airports have improved their ATFM Delay Share
Index ranking. Germany has moved from the bottom 10% to the top 50%. Spain, Italy and Switzerland
have all moved up at least one grouping whilst Finland featured in the top 10%. UK’s performance

53 | P a g e
has remained within bottom 50%, but has moved up from 35th to 31
st out of 50 states. France’s
performance has declined, moving from 37th to 42
nd within the rankings.
The worst ATFM Delay Share Index performance in AIRAC 1507 was shown by Turkey and the
Ukraine. Given the current and forecasted traffic growth from Turkish airports, this ranking
demonstrates the importance that Ataturk (LTBA) and Antalya (LTAI) become networked CDM
airports as soon as practically possible.
Figure 4-5 Delay Share Index ranked groupings by ECAC state for AIRAC 1507
4.2.4 ATFM Delay Distributions
Better ATFM slots translates directly into reduced levels of ATFM delay. An analysis was performed
to approximate how many delay minutes were saved by CDM airports in 2015 based on the
improvements to the ATFM Delay Share Index at each site.
The pre and post A-CDM ATFM delay distribution was generated for each airport. These distributions
were generated from historical regulation data (NMOC archives) between January 2012 and
December 2015. Each distribution was grouped by the tactical delay bands described in Table 4-2.
Almost all CDM airports showed a notable reduction in the proportion of flights that suffered an ATFM
delay of between 20 and 40 minutes. Figure 4-6 illustrates the change in the ATFM delay distribution
at Prague. Thirteen of the 17 CDM airports showed similar improvements and only 3 airports did not
show strong improvements in this area.

54 | P a g e
Figure 4-6 Distribution of ATFM Delay at Prague Airport (LKPR)
The significance of the ATFM delay reductions enjoyed by CDM airports should not be
underestimated. The analysis of Prague (Figure 4-6 above) and other CDM airport data has shown
that even though the overall ATFM delay situation was particularly difficult in 2015, this situation
would have been worse if the airport was not fully A-CDM implemented. Figure 4-7 illustrates the
relative saving in ATFM delay minutes across the 17 CDM airports based on 2015 ATFM regulation
volumes.
Figure 4-7 Number of CDM airports demonstrating different levels of ATFM Delay minute savings in 2015
(Source - NMOC data analysis)

55 | P a g e
ATFM delay reductions are not realised until a CDM airport connects to NMOC
via the DPI mechanism. The extent of the benefits has also been shown to vary
across the ECAC zone. The geographic location of the airport, as well as the
main departure flow directions (with reference to the most heavily regulated
ACC sectors) are thought to strongly influence the potential for ATFM delay
reductions. Three of the 17 CDM airports did not show an improvement in their
ATFM delay distribution since becoming connected.
4.2.4.1 Costs of ATFM Delay
The change in the ATFM delay profile at each CDM airport was used to generate an estimation of the
on-gate, tactical delay cost savings for airlines. This study adopts a version of a model as developed
by the most comprehensive work on airline delay costs to-date, conducted jointly by the University of
Westminster and the PRU [Ref-9]. The cost of delay to airlines is split into 3 areas:
1. Strategic costs
2. Tactical costs
3. Reactionary costs
Strategic costs include adding schedule buffer or additional aircraft that help to reduce tactical delay
costs. Tactical delay costs are those incurred on the day of operations, and not accounted for in
advance. Reactionary costs are those incurred as result of a delay to another aircraft (non-rotational
reactionary delay), or the additional delay incurred due to the late inbound of the same aircraft
(rotational reactionary delay).
Since no CDM airport has reported that airline schedule buffers have been reduced, the impact of
CDM on strategic costs was ignored. The ‘opportunistic’ revenue impact of delay for airport retail
outlets is not considered here.
Table 4-2 Estimated Tactical Cost of Delay by Delay Band and Aircraft Cost Category
Table 4-2 shows the estimated tactical cost of on-gate delay for different aircraft cost categories. This
table is an estimation of costs that is based on reference values by aircraft type (see Table 4-3) that
were generated jointly by the PRU and the University of Westminster [Ref-9].
Cost Category 2 < X < 7 8 < X < 12 13 < X < 17 18 < X < 22 23 < X < 27 28 < X < 32 33 < X < 37 38 < X < 42 43 < X < 47 48 < X < 52 53 < X < 57 58 < X < 62
L 35 103 170 313 457 600 917 1,233 1,550 1,867 2,183 2,500
M 65 233 400 733 1,067 1,400 2,250 3,100 3,950 4,800 5,650 6,500
H 180 590 1,000 1,833 2,667 3,500 5,917 8,333 10,750 13,167 15,583 18,000
VH 253 832 1,410 2,640 3,870 5,100 8,217 11,333 14,450 17,567 20,683 23,800
Tactical Cost of Delay Range (Total per Aircraft - Euros)

56 | P a g e
Table 4-3 At-gate tactical delay costs per aircraft type (University of Westminster) [Ref-9]
The delay distribution for each airport was then combined with the approximate traffic mix in each
‘aircraft cost category’ to generate an approximation for the total tactical cost of ATFM delay based on
the number of slots experienced by each airport in 2015. The total estimated cost saving in Europe
was over €15 million. This estimation considers the ‘double counting’ of benefits between strong city
pairs as well the fact that a significant proportion of ATFM delay is incurred off-stand with engines hot.
Figure 4-8 Total estimated ATFM delay savings in Europe in 2015 as generated by 17 CDM airports3
3 Total relative savings across the 17 CDM airports in 2015 when compared to pre-ACDM performance.

57 | P a g e
5 A-CDM Implementation Challenges
This section discusses some of the fundamental choices and challenges faced by A-CDM
implementations today.
5.1 Harmonisation
Seventeen CDM airports have participated in this study by describing their operational benefits and
their rationale behind some of their implementation decisions. What has become very clear is that the
implementation of A-CDM must respect the commercial, political and technical constraints at each
airport. However, dominant carriers and their operational preferences will always play a large part in
the implementation choices. As will the strength (and stakeholder representation) of the management
team that is formed to spearhead the change programme and educate stakeholders towards
supporting difficult implementation decisions.
Complete harmonisation of all A-CDM procedures is not yet possible. The
EUROCONTROL A-CDM Implementation Manual [Ref-5] suggests optional or
locally variable A-CDM procedures which reflect the differences in equipage,
infrastructure and traffic demand / mix across airports.
5.1.1 German Harmonisation Initiative
The German A-CDM harmonisation group was founded in 2010 by Munich
Airport (FMG) and the German ANSP (DFS). The group currently consists
of 5 fully implemented CDM airports and one other ongoing
implementation project (Hamburg). The objectives of this initiative are:
The exchange of information and best practises between German CDM airports at all stages
of their implementation.
To achieve a common understanding of Airport CDM in Germany and to represent this
understanding to the European A-CDM process.
To harmonise the use and consequences of several aspects of the A-CDM process for the
operational convenience of the customer (AOs).
To provide a single face and point of contact to the customer.
Examples of harmonized elements across the German A-CDM community include:
Start-up and push-back procedures
Implemented A-CDM alerts
Pilot reference cards
EOBT and TOBT compliance procedure
Reported key performance indicators
TOBT update limit after sequencing

58 | P a g e
This initiative continues to implement standardisation of processes and to share the experiences and
results with EUROCONTROL, the A-CDM Harmonisation Task Force (HTF) and the wider
community.
The following sub-sections describe some A-CDM processes that could be better harmonised across
Europe as a whole – with supporting rationale to explain some of the differences where they occur.
5.1.2 EOBT vs TOBT Compliance
Most of the CDM airports enforce that the EOBT and TOBT should be consistent to within 15 minutes.
For some CDM airports, this would prevent a TSAT being generated whilst for others, it is checked by
the clearance delivery position prior to start-up clearance being given.
For regulated flights, AOs are generally reluctant to update the EOBT in the fear that this will result in
a much later ATFM slot. If the EOBT is updated to match the TOBT, then the updated EOBT should
not cause ETFMS to re-calculate the trajectory and risk a later ATFM slot. However, based on
feedback received over these 12 months, it is accepted that this sometimes can and does happen.
The necessity of the EOBT alignment procedure has been raised by many of the CDM airports
interviewed and is a subject of ongoing debate across the community.
The German A-CDM harmonisation group has implemented the CDM08 (EOBT vs TOBT
inconsistency) alert to notify the AO that the EOBT should be updated, however they do not take any
action to block the A-CDM process in the event that the EOBT and TOBT differs by more than 15
minutes. In contrast, the Italian CDM airports will not award start-up clearance if a discrepancy exists
and London Gatwick has implemented a function to automatically update the EOBT of the flight based
on manual TOBT updates from the ground handler.
5.1.3 A-CDM Alerting and Publication
The A-CDM concept recommends a series of alerts which are generated in response to automatic
checks that are triggered from 3 hours before the EOBT. These alerts are adopted fairly consistently
across the CDM airports. Technical and operational limitations prevent the implementation of some.
The Italian CDM airports have been able to implement an alert based on the aircraft not being ready
at TOBT + 5’ (CDM 11) – this is through the implementation of a manual ‘ready’ check that is
performed by the airport operator. The ‘Boarding Not Started’ alert (CDM 09) is not implemented at
some airports as this is not thought to be a reliable indication of delay for their operation – or this
timestamp is difficult to acquire in real time.
Other alerts that are implemented less consistently are those relating to the automatic generation of
the TOBT in response to inbound flight progress. Only 60% of the CDM airports generate alerts that
rely on the matching of inbound and outbound legs.
Figure 5-1 illustrates the A-CDM milestones and the corresponding alerts (numbered 1-16) along the
process. The 5 least implemented alerts are highlighted in red with accompanying rationale.

59 | P a g e
Figure 5-1 CDM process alerts and the 5 least implemented highlighted in red
The delivery of alerts to GHs and OCCs is also implemented differently across the sites. This study
has shown that airports offer one or more of the following options for communicating the A-CDM alert
status of a departing flight:
A-CDM Portal (a web based client is the most popular)
Read-only client access to Airport AODB
Web Services
Email or SITA Messaging
Although some inconsistency exists across the ECAC zone, there is no
evidence that OCCs which interact with one or more CDM airports are not able
to manage the subtle differences between the local implementations. Ground
handers that are based locally are not affected by differences across other
sites. Clearly, aircrew are most affected by the differences in the start-up and
push-back procedures – and are discussed in Section 5.1.5.
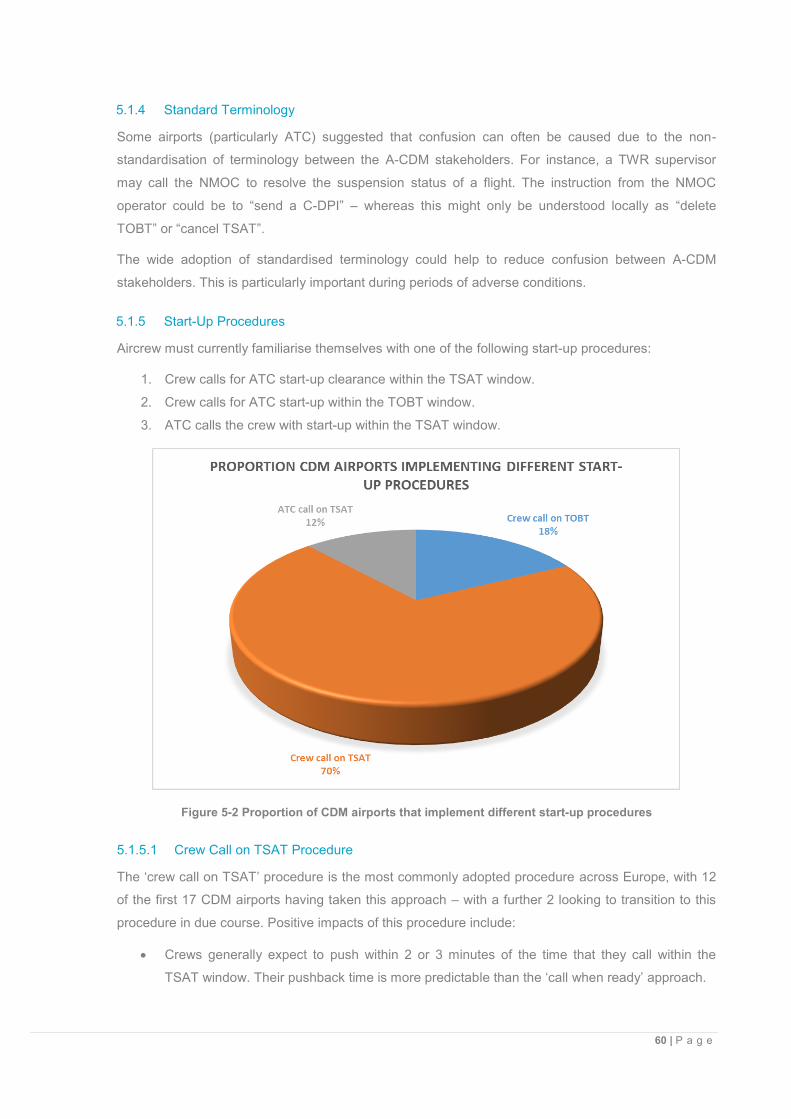
60 | P a g e
5.1.4 Standard Terminology
Some airports (particularly ATC) suggested that confusion can often be caused due to the non-
standardisation of terminology between the A-CDM stakeholders. For instance, a TWR supervisor
may call the NMOC to resolve the suspension status of a flight. The instruction from the NMOC
operator could be to “send a C-DPI” – whereas this might only be understood locally as “delete
TOBT” or “cancel TSAT”.
The wide adoption of standardised terminology could help to reduce confusion between A-CDM
stakeholders. This is particularly important during periods of adverse conditions.
5.1.5 Start-Up Procedures
Aircrew must currently familiarise themselves with one of the following start-up procedures:
1. Crew calls for ATC start-up clearance within the TSAT window.
2. Crew calls for ATC start-up within the TOBT window.
3. ATC calls the crew with start-up within the TSAT window.
Figure 5-2 Proportion of CDM airports that implement different start-up procedures
5.1.5.1 Crew Call on TSAT Procedure
The ‘crew call on TSAT’ procedure is the most commonly adopted procedure across Europe, with 12
of the first 17 CDM airports having taken this approach – with a further 2 looking to transition to this
procedure in due course. Positive impacts of this procedure include:
Crews generally expect to push within 2 or 3 minutes of the time that they call within the
TSAT window. Their pushback time is more predictable than the ‘call when ready’ approach.

61 | P a g e
Only in rarer cases (such as nearby traffic / personnel) would a start-up request made within
the TSAT window not result in an immediate engine start-up approval. The TSAT + 5’ limit is
intended to provide the flexibility to ATC to delay start-up clearance to minimise holding point
congestion and manage traffic interactions.
ATC receives start-up requests in a more predictable manner. Typically, most flights will call
at TSAT – 5’ unless the entered TOBT was overly optimistic (or deliberately early). These
flights do risk losing their departure slot should they fail to make a start-up request by
TSAT + 5’.
5.1.5.2 Crew Call on TOBT Procedure
Three CDM airports have adopted the procedure where the start-up process is initiated by the crew at
the TOBT. The main advantage of this procedure is that start-up readiness can be assured prior to
the TSAT milestone. London Heathrow has adopted this procedure to drive TOBT quality, prevent
sub-optimal runway sequences and misplaced resources that are caused by flights that would call for
start-up whilst still in their rotation (or before!).
At London Gatwick, this start-up procedure was adopted to provide the most reliable indication of turn
success as calculated by the difference between the Actual Start-up Request Time (ASRT) and the
Actual In-Block Time (AIBT) of the inbound flight.
Both Gatwick and Heathrow require that the push-vehicle must be in place and the boarding bridge
retracted for an aircraft to be declared ready. This procedure ensures that the aircraft is always able
to react to TSAT improvements - however can also mean that ground resources are idling longer than
if they were planned against the TSAT.
For most of a normal operational day at Oslo, the TOBT is the same as TSAT and so flights are
advised of delay over the frequency if they are unable to grant immediate start-up approval.
5.1.5.3 ATC call at TSAT Procedure
In theory, a procedure where start-up clearance is initiated by ATC is the most efficient from an R/T
task loading perspective, particularly when ATC clearance is provided via datalink. However, this
procedure would place a very strong spotlight on TOBT accuracy. Cases of flights that are not ready
when called would result in an additional R/T exchange that this procedure was helping to prevent.
As a result, no CDM airport has yet to adopt this procedure without a readiness step from the aircrew.
For instance, at Rome Fiumicino, the crew must first declare aircraft ready on an airport frequency
(who verifies the aircraft readiness) before monitoring an ATC frequency for their start-up clearance.
Flights departing from Zurich will be contacted by apron control within the TSAT window, but only
after the flight has received ATC clearance through an R/T exchange with the delivery position.
5.1.6 TOBT Update Limits
As per the recommended EUROCONTROL procedure, some airports have implemented TOBT
update limits after the flight has been allocated a TSAT. This procedure is to encourage ‘considered’

62 | P a g e
TOBT updates rather than ‘incremental’ 5 minute delay updates whilst the flight is within the critical
sequencing window (within 40 mins from off-block). Other airports have not imposed a limit. Both
London Heathrow’s and Madrid’s TOBT stability is thought to self-regulate due to the penalty incurred
by flights for repeatedly updating the TOBT – this is a design element of the PDS/DMAN behaviour
which is intended to optimise runway capacity during constrained periods.
Nine of the 17 CDM airports have implemented some control over the TOBT updates after TSAT
issue. For those that have not imposed a limit, some have been able to support that this has not
reduced the conscientiousness of TOBT update behaviour. In fact, without this limit in place, it was
suggested that handlers will commit to an earlier TOBT update since there is no fear of changing the
value and exceeding the update limit should the situation change.
Figure 5-3 Proportion of CDM airports that implement TOBT update limits
Whether or not a constraint on the number of TOBT updates serves to improve off-block predictability
is very much a local consideration. Only half of the CDM airports interviewed think this limit is
necessary. However, it is still widely accepted that TOBT stability is crucial for ensuring a stable pre-
departure sequence.
Consequences of poor TOBT stability could be:
Additional runway buffer may be required to ensure sufficient departure pressure is
maintained when gaps in the sequence do emerge.
Ground handling agents are less able (and willing) to plan resources in accordance to an
unstable TSAT.
The likelihood of both stand congestion and push contention will increase.

63 | P a g e
ATFM slot adherence becomes more challenging as the runway demand forecast shifts
erratically.
Take-off time predictability suffers and the potential for ATFM slot wastage increases
(resulting in additional CTOT delay throughout the network).
5.1.6.1 Sequencing Flexibility
The impact of TOBT instability on each operation differs significantly. At some airports, the PDS (or
DMAN) is able to accommodate late TOBT updates without disproportional amount of TSAT delay. At
others, the sequence is particularly brittle and less forgiving of TOBT updates that are later than the
allocated TSAT. The differentiator is often a combination of factors that includes runway and SID
saturation and the extent to which the take-off sequence is determined at push-back.
At Zurich airport, the off-block sequence largely determines the departure sequence at the runway.
There are single runway entry points (at the most usable take-off distances), few parallel taxiways
and a congested apron area which presents limited opportunities for resequencing aircraft. During
periods of high demand, TOBT instability can compromise throughput rates since SID separations
(which are constrained) are built into the pre-departure sequence. It is very likely that TOBT instability
would result in a sub-optimal departure sequence given the lack of opportunity on the apron and
taxiways to correct sub-optimal aircraft sequences.
Figure 5-4 Limited re-sequencing opportunity for RWY 28 departures at Zurich airport
At London Heathrow, the main runways (27L/R) are served by parallel taxiways and multiple entry
points. This provides the controller with the flexibility needed to maintain high runway throughput.
With demand at LHR as high as it is, the provision of runway departure pressure with the right traffic
‘mix’ is crucial. TOBT instability at LHR will still degrade off-block predictability and effective resource
allocation – however the flexibility afforded by the apron and taxiway layout can better mitigate the
effects of TOBT instability through the application of a runway buffer.

64 | P a g e
Figure 5-5 Multiple approach taxiway and entry points for RWY 27R departures at London Heathrow
The example above is intended to demonstrate how differences in airport
layouts can affect the challenges faced by the airport in facilitating an optimum
departure sequence. It does not suggest that TOBT instability at ZRH is
managed less favourably than at LHR.
All CDM airports in Germany have adopted a limit of 3 TOBT updates after the flight has been
sequenced. So too have the Italian CDM airports. Exactly how the flight will be re-sequenced in the
event of a TOBT update limit exceedance depends on the logic of the sequencer. However, in the
main, most airports will award the first available runway slot (TTOT) in accordance to a newly entered
TOBT – which must be at least 5 minutes from the current time.
5.2 Equity of TSAT Delay
Common situational awareness across all stakeholders can come at a cost for the airport operator.
The transparency of operational timestamps can lead to stakeholders forming their own conclusions
about the equitability of TSAT delay. To best manage this risk, communications from the A-CDM
project team may be required to convince stakeholders that:
1. No single carrier is favoured in the generation of the pre-departure sequence.
2. That on-block TSAT delay does not delay the actual take-off time.
3. That TSAT delay has resulted in the trending reduction in average taxi-out times for all (if
applicable).
Several airports have reported particular challenges in this area - requiring a significant ongoing
investment in stakeholder engagement and query resolution to prevent damaging false perceptions of
pre-departure sequencing rules.
The German Harmonisation Group has chosen not to allow AOs to see to the A-CDM timestamps of
other airlines at Germany’s CDM airports. It is thought that this would encourage a poor TOBT update
culture and a forensic insight into the TSAT behaviour that might encourage misuse of the system.

65 | P a g e
5.3 TOBT Update Culture
The ‘TOBT Updater’ is at the very heart of the A-CDM process. High levels of local and network
predictability cannot be achieved unless a culture of early and accurate TOBT updates is embedded
at the CDM airport. Promoting and sustaining good TOBT update behaviour is a constant effort for the
A-CDM project team.
However, it should be recognised that the ground handler is serving the Aircraft Operator whom
would sometimes prefer that a TOBT update was not made when a delay becomes apparent -
especially when the flight has a regulation. This puts the ground handlers in the unenviable position
where they are unable to fully adhere to the A-CDM procedures due to a ‘blame culture’ that results
from any local or ATFM delay that may result from a more precise TOBT entry.
Ground handlers may be reluctant to provide early TOBT updates because:
1. A flight that is not currently subject to a regulation (based on the EOBT) could become
subject to ATFM delay upon the TOBT update.
2. Additional TSAT delay maybe incurred by moving the flight into a period of higher departure
demand.
3. The flight is within the sequencing window and the handler does not want to be responsible
for the flight being re-ordered in the sequence due to the exceedance of the TOBT update
limit.
4. The handlers are given explicit instructions not to update the TOBT in certain delay situations.
For example, the OCC may have the flexibility to perform a tail swap and does not want to
risk an applied regulation when changing an aircraft will keep the flight to its original flight
plan.
It is accepted that TOBT updates could result in a flight being pushed towards a regulation, however
the earlier that delay is communicated to NMOC the better the availability of slots within the restricted
traffic flow. If the delay is inevitable and will not be recovered, then a TTOT update to NMOC (via the
DPI) serves to improve the chances that the flight will receive the best possible slot – before they are
filled by other flights. The advantage of flights departing from CDM airports in receiving better ATFM
slots is discussed in Chapter 4. It should also be mentioned that a TOBT update could result in a
regulated flight being pushed out of the regulation and therefore having its CTOT cancelled.
5.3.1 Early TOBT Updates & Aircraft Ready Check
At some CDM airports, ‘early’ or overly optimistic TOBT updates are still practised by some airlines to
force a better position in the pre-departure sequence. This practise demonstrates that some
stakeholders are yet to subscribe to ‘collaborative’ element of the process and are willing to
compromise the predictability of an overall operation for their own short term gain. The A-CDM
processes are designed to block and deter such behaviour through measures such as:
Aircraft Ready Check - performed by Italian CDM airports prior to start-up request.

66 | P a g e
Start-up on TOBT procedure – where possible, airports currently implement a ready check
when the crew requests start-up within the TOBT +/ 5’ window.
TSAT Adherence – flights that are not actually ready within the TSAT window are suspended
and should provide a new TOBT (that is greater than now + 5’) before resequencing.
The TSAT adherence check is the last line of defence for preventing inaccurate TOBT entries that
result in a successful start-up clearance. However, for airports that implement a ‘Call on TSAT’
procedure with no ‘ready’ check on or prior to TOBT, this procedure is still very much open to abuse.
Flights that declare a TOBT that is before the real TOBT do so to receive a favourable TSAT in high
delay situations. If this TSAT is greater than the real TOBT update of the flight, then the flight will
have managed to exploit the process if no ready check is in place at the airport. However, should the
TSAT be earlier than the real TOBT, the gamble will result in additional delay for all – as described by
the Phantom Flight Delay phenomena in Section 2.4.3.
5.4 TSAT Adherence
The start-up process for A-CDM airports is more efficient than the pre-implementation case. In all
cases where it was possible to asses, TSAT adherence (the proportion of flights with a start-up
approval within the TSAT +/- 5’ window) has shown a trending increase from as little as 40% to a
typical ‘resting’ value of 90% or more. Figure 5-6 below illustrates the improvement in TSAT
adherence at London Heathrow since the implementation and is typical of most CDM airports for
which data was made available for analysis.
Figure 5-6 TSAT compliance trend at London Heathrow since October 2012 (Source - data analysis of
Heathrow Airport flight data)

67 | P a g e
The role of ATC in ensuring TSAT window adherence is the last critical link in the process chain. The
A-CDM milestone process is engineered to provide predictable start-up operations to drive the take-
off predictability required by downstream ATC sectors.
Factors that drive the improvement in TSAT adherence includes:
Increased compliance with the pre-departure sequence as suggested by the DMAN / PDS.
Increased adoption of start-up request / authorisation over data-link.
Improved departure sequence stability - it is difficult for ATC to facilitate an unstable
departure sequence, especially on heavily congested aprons. Departure sequence stability is
promoted by increased TOBT stability and the elimination of ghost flight plans from the
runway demand forecast.
Perhaps the largest barrier to achieving consistent TSAT adherence is the level of trust in the PDS
and/or DMAN systems, especially in large delay situations in which TSAT delay can cause additional
R/T workload for clearance delivery to explain the start-up delay to the flight crews.
5.5 Flight Planning Control
Moving from EOBT to the TOBT is necessary to drive the levels of predictability that would enable a
safer and more efficient ATM network for airspace users. It is appreciated that the TOBT procedure
has resulted in some AOs feeling like they are losing direct control over their flights. TOBTs are
updated based on the ground handler’s best estimate – however this may be contrary to the strategic
intent of the OCC in keeping a flight out of a regulation or conforming to an available route.
A few of the CDM airports have stated that some of the most prominent carriers feel that A-CDM has
impacted their operation in this way. However, other large carriers that were participant to the
discussions were happy to relinquish control of the TOBT with the appropriate Service Level
Agreements (SLA) in place with the handlers. Also, the TOBT enables a 10 minute improvement
potential without the need to cancel and refile the original flight plan.
A TOBT that is delayed by 10 minutes which then moves into a restriction does
so as a matter of safety. The earlier that the delay is notified to NMOC, the
earlier the slot is likely to be. Delays that are filed at or near start-up request are
more likely to incur disproportional levels of delay. Early delay notification also
gives ETFMS the opportunity to advance slots so that the realised level of delay
becomes less disruptive.
5.6 Expectation of Reduced Slots
The reduction in ATFM slots has been the main anticipated benefit for many CDM airports. As this
study has shown (in Chapter 4), the average ATFM delay incurred by almost all CDM airports has
reduced - particularly the number of ‘bad slots’.

68 | P a g e
Despite this, not one of the airports could declare that they had noticed a reduction in the number of
slots issued. The summer season of 2014 and 2015 has been a particularly difficult across Europe,
with large amounts of capacity and weather related regulation – not to mention the closure of Ukraine
airspace after the MH17 incident in July 2014. These difficult periods has led to the perception that A-
CDM is not fulfilling its promise to reduce the amount of ATFM slots at the CDM airport.
Figure 5-7 Number of ATFM slots by AIRAC cycle since January 2013
The ECAC wide adoption of A-CDM has the potential to reduce regulation volume through enroute
buffer capacity reductions – this mechanism is discussed in Appendix A. In the shorter term, A-CDM
is helping to fully utilise regulation capacity such that delays are minimised for all flights and prioritised
for A-CDM departures where possible. Despite the increased volume of slots experienced over the
last 2 years, most CDM airports were much better off (in delay terms) for having been connected to
NMOC. The positive impact that CDM has had on the ATFM delay distributions of the CDM airports is
detailed in Section 4.2.4.
Reduced ATFM regulations via enroute capacity buffer reductions will be
possible when A-CDM flight saturation exceeds 60% through operational
sectors. More information on the analysis performed to generate these results
can be found in Section 3.4.
5.7 Cost Benefit
This study has shown significant cost savings for airlines operating from a CDM airport – mainly in the
in the reductions in taxi-out time and ATFM delay. Smaller, less constrained airports have also shown
considerable savings for the airlines that are thought to more than exceed the expense of the
implementation.
However, as is well known, the majority of the benefit lies with the airlines and the vast majority of the
cost is borne by the airport and ANSP stakeholders.

69 | P a g e
It has not been possible to calculate a cost benefit for the ground handler, ANSP and airport operator
in this study. Typically, the main cost benefit for these stakeholders is in the optimisation of resources
and improved asset utilisation – resulting in less capital expenditure to meet growing demand. For a
de-icing company, this might mean more aircraft can be processed with less de-icing equipment. For
the airport, it could mean a more efficient service that results in reduced overtime costs. For an ANSP
it could mean better CTOT compliance and improved peak service rates at the runway – both of
which could stem future investment in more expensive efficiency programmes. A-CDM is helping the
airport maximise infrastructure utilisation, but measuring this requires a dedicated set of performance
indicators that are implemented and monitored over several years, across several A-CDM partners.
Although this study has not been privy to information on firm A-CDM implementation costs, it has
been able to generate credible cost savings (for airlines) based on historical operational results. By
estimating three levels of implementation and recurring maintenance costs, a regional cost benefit
ratio (CBR) was calculated for all CDM airports based on these three cost scenarios.
Implementation cost scenarios that have been considered include:
LOW: €750,000 implementation plus €50,000 annual costs
MEDIUM: €2.5 million implementation plus €150,000 annual costs
HIGH: €5.0 million implementation plus €500,000 annual costs
Against these implementation costs, the average cost benefit ratio and time for return on investment
when considering airline cost benefit only is described in Table 5-1 below. These values do not
include savings due to airport punctuality improvements or flight cancellation reductions.
LOW MEDIUM HIGH
Payback Period < 15 months < 18 months < 24 months
5 Year CBR 9.37 2.92 1.18
10 Year CBR 21.1 6.57 2.66
15 Year CBR 32.8 10.23 4.24
Table 5-1 Payback period and CBR of A-CDM across Europe considering airline cost savings only
Assuming a Medium implementation cost scenario, Table 5-1 shows that on average, A-CDM
provides a return on investment after 18 months, and a cost benefit ratio (CBR) of 7 over 10 years.
Airport-CDM is about much more than generating fuel and delay savings for airlines. However, the
realised savings to-date more than justify the cost of expenditure across the ECAC zone. Smaller
airports could generate CBR values nearing 10 over 5 years – this is particularly important for those
lesser constrained airports that are less likely to generate real savings from future operating cost
avoidance.

70 | P a g e
More heavily constrained airports are likely to generate more significant savings owing to tactical and
strategic cost avoidance. However, since no views on these values were generated from the study,
they have been omitted from the estimated CBR in Table 5-1. For those wishing to understand more
about the potential financial reward of A-CDM across all stakeholders, please refer to the Airport-
CDM Cost Benefit Analysis [Ref-10].

71 | P a g e
6 Conclusions
With the participation and support of 17 CDM airports, this study has explored both the local and
network impacts of A-CDM implementations. This study has also aimed to extract and document
some of the challenges in facilitating a successful A-CDM programme.
From a local viewpoint, this report has presented the strongest operational benefits that were
generated with the co-operation of the participant airports and their stakeholders, which include:
Average taxi-out time savings between 0.25 and 3 minutes per departure.
Average schedule adherence improvements between 0.5 and 2 minutes per flight.
Reduction in push-back delays after start-up approval.
Increased ATFM slot adherence despite increased traffic demand and ATFM regulation
volumes.
Improved ground handling resource utilisation.
Reduction in the number of late stand and gate changes.
Improved management of and recovery from periods of adverse conditions.
Reduction in Flight Activation Monitoring suspensions.
Increased peak departure rates at the runway.
Dramatically improved take-off time predictability – typically by as much as 85% during
adverse conditions.
From the network perspective, the improved take-off predictability is the essential output of the A-
CDM process. Analysis of NMOC archive data has shown that the standard deviation of take-off
accuracy from CDM airports has reduced from an average of 14 minutes to around 7 and 5 minutes
at the sequencing and off-block milestones respectively.
This study has verified that that the proliferation of A-CDM across Europe will continue to reduce the
potential for sector over-deliveries and support the reduction in enroute sector safety buffers.
However, this can only be done reliably in areas where the proportion of flights arriving to a control
sector from either an A-CDM or Advanced ATC Tower airport is 60% or more. Other results
generated from the network impact phase of the study include:
Based on the implementation progress in January 2016, a 2% increase in ECAC wide
enroute capacity could be enabled after the integration of 2 or 3 more medium sized airports.
This benefit would peak at a 3.5% enroute sector capacity increase after Europe’s top 50
airports become network integrated.
If the average take-off predictability of currently connected airports was able to increase to the
current best in class value, then an additional 2% gain in enroute capacity could be realised
with the same number of airport integrations.
Around 80% of the available enroute capacity benefit will be realised when Europe’s top 30
airports are integrated (or 57% of ECAC departures are transmitting DPI).

72 | P a g e
On average, the proportion of A-CDM flights through a flow restriction needs to reach
between 10% and 15% before reductions in ATFM delay are experienced.
A-CDM is already facilitating a reduction in average ATFM delay of 3 minutes per regulation
in restrictions in which 30% or more of the flights are originating from CDM airports. This
benefit increases as the proportion of flights originating from CDM airports increases through
the sector.
The trends in historical ATFM delay suggest that 40 CDM airports could yield reductions in
average ATFM delay of between 20% and 25%. This is compared to flow restrictions in which
there are no regulated flights originating from a CDM airport. These results are consistent
with the findings generated in the previous EUROCONTROL impact study [Ref-1].
Departures from CDM airports receive less ATFM delay than non A-CDM flights through the
same restriction - by an average of a 1 minute per flight.
For a flow restriction with 40% A-CDM flight participation, the probability of receiving a 40
minute delay reduces from 22% to 4% for A-CDM flights and 7% for non A-CDM flights (when
compared to the same flow restriction through which no A-CDM flights are routed).
A-CDM is providing the mechanism to reduce the potential for over-deliveries within the most
saturated of enroute sectors. The realisation of additional movements or the reduction in ATFM delay
(or both) is subject to the observations and safety assessments conducted by ANSPs in support of
capacity buffer reductions.
6.1 Further Work
6.1.1 Local Benefit Assessment
The local impact assessment adopted a rigorous approach for generating credible and validated
operational benefits at each site. This included operational data analysis of airport and NMOC flight
data. It has resulted in firm quantitative results in areas like taxi-time and ATFM delay reductions.
However there were areas in which more evidence could have been collated to support qualitative
benefits.
Ground handler organisations were largely under-represented. As a result, there was little evidence to
verify the impact of A-CDM on turnaround performance and longer term cost avoidance that is
supported through improved asset utilisation. The financial impact on handlers from the perspective of
improved punctuality was also not quantified.
Operational resilience is a core benefit that A-CDM is able to offer across any airport, irrespective of
capacity constraints. Not all participating airports were able to provide flight data that would enable
the quantification of the improved response and recovery of a CDM airport to operational disruption.
More work could be done in this area to provide a stronger business case for airports with fewer
capacity constraints but who face a real susceptibility to adverse conditions.
This study has shown that CDM airports are more competitive than non-CDM airports when it comes
to ATFM slot allocation. However, the significance of this competiveness differs between the CDM

73 | P a g e
airports. Some airports see a significant and dramatic reduction in their ATFM Delay Share Index (see
Section 4.2.3) whereas other airports respond much less notably. An interesting (and useful from an
airport perspective) extension to the ATFM delay results presented herein would be to evaluate how
factors such as airport location, TMA interaction and DPI timings all contribute to the extent that an
airport benefits from their DPI connection to NMOC.
The estimated in-block time is a critical timestamp which enables some of the benefits generated from
improved arrival time predictability. The quality of the EIBT lies by essence in the quality of the EXIT -
which depends intrinsically on the generation strategy of this value. Airport-level EXIT is certainly
less precise than point-to-point and density-sensitive EXIT assessment. The quality of EXIT
generation methodologies could be further investigated at CDM airports.
It was not within the scope of this study to perform a full cost-benefit analysis of A-CDM. This study
has verified strong financial benefits to the aircraft operator, however the Return of Investment (ROI)
of the implementation for the airports, ANSP and ground handlers was not investigated. Examples of
where A-CDM may have reduced operating or strategic investment costs due to increased resource
and asset utilisation would be of particular interest in this area.
6.1.2 Network Impact Assessment
The network impact assessment has confirmed the benefit of improved take-off accuracy (when
compared to the flight plan) on reducing the potential for sector over-deliveries. However, this project
was unable to explore the timeliness effect of pre-departure information on reducing the amount
ATFM delay across the network.
The Network Manager Validation Platform (NMVP) provides a prototyping and validation environment
which can replicate the function of the Network Manager in shadow and fast time modes. The NMVP
could be used to simulate the impact of the TTOT predictability (via DPI exchange) on the sector load
predictions and subsequent slot allocation (via CASA) to a higher degree of certainty. NMVP is
mentioned here as a powerful tool that might be used by in future to work to quantify declared
capacity and / or ATFM delay improvements generated from increased A-CDM adoption across
Europe.

74 | P a g e
Appendix A – Airport Network Integration
This section describes how A-CDM can contribute to the realisation of network level benefits through
the publication of improved take-off time estimations to ETFMS.
A.1 Enhanced Tactical Flow Management System (ETFMS)
ETFMS is a crucially important NMOC subsystem that is responsible for managing the balance of
traffic demand and capacity. The system takes validated flight plan information from IFPS and merges
real time tactical inputs such as Correlated Position Reports (CPR) and DPI messages to generate an
accurate, real time 4D trajectory for each flight. ETFMS also implements the Computer Assisted Slot
Allocation (CASA) algorithm to generate ATFM slots when a Flow Management Position (FMP)
decides to enforce a regulation plan. Figure A-1 describes the main data and organisational interfaces
to the ETFMS subsystem.
Figure A-1 Main ETFMS Interfacing Systems (DPI highlighted)
A.1.1 DPI Messages
CDM airports provide DPI messages to ETFMS from 3 hours before the EOBT. Advanced ATC Tower
airports will provide DPIs when the aircraft pushes off-block. Each DPI contains a Target Take-Off
Time (TTOT) and the latest estimated taxi-out time (EXOT) that is used by ETFMS to update the Filed
Traffic Flow Model (FTFM) and the Current Traffic Flow Model (CTFM).
The TTOT published within the DPI is significantly more accurate than the Estimated Take-Off Time
(ETOT) that is generated from the flight plan. A-CDM airports are required to re-publish the TTOT to

75 | P a g e
ETFMS if this value deviates by more than 5 minutes, whereas flights operating from non-CDM
airports will typically only update the flight plan EOBT if a delay of 15 minutes or more is incurred.
Furthermore, the standard taxi time value that is stored within the NMOC subsystems is often not
reflective of the actual taxi time of the flight. This additional inaccuracy in the derived ETOT from the
flight plan further reduces the predictability of flight departures from non CDM airports.
A.2 Impact of Poor Take-Off Predictability
ETFMS monitors the current and planned route availability that is derived from both radar and flight
plan information. For each flight, the FTFM is updated with flight plan updates which results in an
estimated time-over (ETO) for all the points along the filed route. The accuracy of the ETO depends
largely on the accuracy of the starting point of the 4D trajectory – the take-off time. The variability in
the ETO at each route point contributes to uncertainty in the evolution of sector entry counts within
each controlled area.
As an example, Figure A-2 illustrates a ‘planned’ case where 4 different flights are to arrive at their
respective sector entry points at the planned time (ETO). In this case, flights enter the sector at a
predictable time and sequence. However, Figure 2-3 does not reflect operational reality. Rarely do
flights actually arrive at the sector entry point at the same time as the FTFM predicted prior to
departure.
Figure A-2 Planned flight arrival sequence into the control sector
Figure A-3 describes the ‘actual’ (CTFM) view of how flights arrive at the sector boundary, due partly
to the variability in the ETOT. BAW123 and EZY789 departed 20 and 10 minutes after the ETOT
respectively, whilst AFR456 departed 5 minutes before. RYR1011 departed at the ETOT.

76 | P a g e
Figure A-3 Actual arrival sequence into the control sector
ETOT inaccuracy has 3 significant consequences which are illustrated (and numbered) in Figure A-3
above.
Complexity Uncertainty – the change in arrival times of both the EZY and AFR flights
changed the nature of the interactions within the sector. The AFR and EZY flight paths will
now interact and shall consume some controller workload to ensure that separation is
maintained.
Capacity Under-utilisation – there is now a significant gap within the sector entry
sequence which results in a loss of potential sector capacity.
Traffic Bunching – the RYR and BAW flights are in trail and although separation will be
assured, they will enter the sector much closer together than was previously planned. In
this situation, the impact on the sector will be negligible; however for large sectors with
many flows and entry / exit points, traffic bunching can pose a safety risk that needs to be
mitigated through the use of capacity buffers.
A.3 Managing Poor Traffic Predictability
A.3.1 Declared Capacity Buffers
In order to manage the variability in the time that flights arrive in the sector, ATC introduce ‘buffer’
capacities which ensures that any peak in either complexity or entry rate can be safely managed by
controllers. These buffer capacities, as well as the traffic bunching they are designed to protect
against, both result in a significant under-utilisation of a piece of airspace. If every flight departed at

77 | P a g e
the ETOT, there would be little need for such buffer capacities (although there will always be a need
for some safety buffer).
A.3.2 ATFM Regulation
ETFMS distributes tactical trajectories to all ANSP via the ETFMS Flight Data (EFD) messages.
These trajectories are used by the respective FMP to assess how the traffic demand varies over the
operational day. Where traffic demand is higher than the ATFM capacity, the FMP can implement a
regulation to manage the rate of traffic inbound to a particular network flow, or airport.
ATFM regulation is a second layer of protection against over demand. An increase in declared
capacity within sectors should therefore have the effect of reducing the amount of regulations. Figure
A-4 illustrates how an FMP interprets the NMOC output to develop a load chart for each sector in
time. When the traffic demand repeatedly exceeds the declared capacity (depending on local
preferences), the FMP might issue a regulation to manage the flow of traffic over that period of
excess.
Traffic demand into a control area consists of 2 portions – planned and active. When the traffic
demand consists of a large amount of planned flights, the accuracy of the demand picture for a
particular window is reduced (partly due to the inaccuracy of the ETOT).
Figure A-4 Determining ATFM from ETFMS Trajectory Updates
A.3.3 Consequence of Improved Take-Off Predictability
Flights departing from CDM and Advanced ATC Tower airports contribute towards a more predictable
network flow due to:
1. Improved take-off predictability resulting in more accurate ETOs within the calculated 4D
trajectory.
2. Earlier transition in the load charts from ‘planned’ to ‘active’.

78 | P a g e
These two consequences of airport-network integration mean that the future traffic demand picture
improves dramatically as the proportion of connected ECAC departures increases. A more reliable
picture of evolving traffic demand means that:
1. Sector over-delivery and traffic complexity spikes are far less likely.
2. FMP may increase declared capacities to be closer to theoretical capacity as the predictability
of the demand picture improves.
3. Enroute delay is reduced as short term traffic bunching is mitigated at the pre-departure
stage.
4. Instances of ATFM delay are reduced as the forward traffic plan is both more reliable (due to
more ‘activated’ flights within the demand picture). Clearly, a reduction in buffer capacity
would also reduce the amount of ATFM regulation – as illustrated in Figure A-5.
Figure A-5 Reduction in buffer capacities reducing ATFM Regulation

79 | P a g e
Appendix B – A-CDM Factsheets
This appendix contains 17 A-CDM factsheets which are sorted in alphabetical order as described in
the table below.
Page Airport Name IATA ICAO DPI Integrated
80 Berlin - Schönefeld SXF EDDB 01/05/2014
84 Brussels BRU EDDB 29/06/2010
88 Düsseldorf DUS EDDL 24/04/2013
94 Frankfurt FRA EDDF 01/02/2011
100 Helsinki HEL EFHK 22/01/2013
104 London - Gatwick LGW EGKK 07/11/2014
108 London - Heathrow LHR EGLL 27/06/2013
114 Madrid - Barajas MAD LEMD 17/07/2014
120 Milan - Malpensa MXP LIMC 07/10/2014
126 Munich MUC EDDM 07/07/2007
132 Oslo - Gardermoen OSL ENGM 29/01/2014
138 Paris - Charles De Gaulle CDG LFPG 16/11/2010
142 Prague PRG LKPR 02/09/2015
146 Rome - Fiumicino FCO LIRF 03/03/2014
152 Stuttgart STR EDDS 06/10/2014
156 Venice – Marco Polo VCE LIPZ 20/01/2015
162 Zurich ZRH LSZH 19/08/2013
All quantitative benefits stated within the factsheets were generated from the analysis of data
provided from the Performance Review Unit (PRU), NMOC (DDR2 archives) or the airports
themselves. Alternatively, some airports have declared some of the outcomes of their own internal
studies into local A-CDM benefits.
Airport-CDM Be efits Fa tsheet
Berli -S hö efeld EDDB / SXF
80 | Page

Berlin-Schönefeld
Operatio al O er ie
Berlin-Schönefeld (SXF) is urre tly Berli ’s second busiest airport with 76,153 movements and 8.5
million passengers processed in 2015, mainly from the low cost operators of Easyjet and Ryanair. The
airport at Berlin-Schönefeld ill e o e Berli ’s ai airport a d Ger a y’s rd busiest once the new
Berlin Brandenburg airport (BER) is opened and all flight operations from Berlin Tegel (TXL) are
transferred. The airport operator of both airports is Flughafen Berlin Brandenburg GmbH and tower
ATC services are provided by DFS. Operational characteristics of SXF includes:
> A single runway operation which is operating well below the peak operational capacity (45 mvts /
hour).
> SXF is terminal constrained and is adding capacity to manage an increase in demand to 10 million by
2017.
> SXF has 30 remote positions and 3 contact stands on the north apron. 4 remote de-icing positions are
located to the east and west of the north apron.
> Stand and apron congestion is beginning to emerge as an operational constraint as traffic demand
increases.
> Night curfews for noisy aircraft (up to chapter 3) are in place, but this largely does not impact the
carriers at SXF whom mainly operate low noise category aircraft.
> A significant GA terminal generates about 40-50 movements per day, which includes some test flights.
> Approximately 80% of traffic is from low cost carriers that fly A319/A320 and B737 aircraft types.
Flights of ICAO class D and above are rare. The rest consists of charter and some cargo operations.
> At the CAT I runway holding point, departures on RWY07 will block the ILS profile and forces large gaps
in the arrival sequence (15 miles). Use of localiser only arrivals (weather permitting) and alternative
taxi-out routes (that cross the runway) can help to reduce the impact on departures to the east.
81 | Page

Berlin-Schönefeld
Airport CDM Pro ess
The Airport CDM project at Berlin Schönefeld was originally intended for the new Berlin Brandenburg
airport (BER). Airport CDM was made ready for the airport opening in 2012 and was then made
available to SXF following the announcement of the delay to the new airport. As a member of the
German Harmonisation Group, many of the A-CDM procedures are harmonised. Notable elements of
the A-CDM process at SXF include:
> The working position of the A-CDM operations co-ordinator is located within the Airport Control Centre.
It is from here that airport and flight plan inconsistencies are managed.
> Automatic TOBTs are first generated 30 minutes before ELDT of the linked inbound or 90 minutes
before the EOBT, whichever is later (unless a manual TOBT has been entered 100 min before EOBT).
> A combined clearance delivery and ground position manages both ATC, start-up and pushback
clearances based on the TSAT window. An apron control position manages the taxi and ground vehicle
movements.
> 75% of flights request ATC and start-up clearance over datalink (DCL) prior to the TSAT. For those flights,
the ASAT is automatically set to TSAT - 5’. TSAT improvements are not published via datalink.
> Start-up clearance via RT must be requested within TSAT -/+ 5´. Certain business charter flights are
given additional flexibility and no action will be taken if the flight calls for push / taxi clearance at ASAT +
’.
> Unlimited TOBT updates are permitted until the flight is sequenced at TOBT – ’, after hi h o ly updates are permitted before the TOBT has to be deleted and the flight is removed from the sequence.
> As with all German CDM airports, the actual beginning of the taxi time will trigger a new A-DPI
publication to NMOC should the TTOT change my more than 5 minutes. The same is true for flights
receiving remote de-icing at actual de-icing begin time.
> Both the in-block and off-block events are automatically detected using A-SMGCS.
82 | Page

Berlin-Schönefeld
Operatio al Be efits
Berlin Schönefeld was the 11th
European airport to fully implement Airport CDM on May 1st 2015. Local
procedures were adopted in March of the same year. Although 100% causality cannot be guaranteed, it
is thought that A-CDM has contributed to the following operational benefits:
> Taxi-out times have reduced by an average of 45 seconds per flight between 2013 and 2014.1
> ATFM slot adherence of 97% and 94% was achieved in 2014 and 2015 – an increase of 7% and 4% on
the 2013 average. This is despite heavier regulation and traffic demand when compared to 2013.1
> Take-off time accuracy has reduced from an average of 11 minutes to 1 minute per flight in 2015. 2
> Take-off time predictability (standard deviation of take-off accuracy) has reduced from 14.5 minutes to
4.6 minutes and 3.5 minutes per flight from the T-DPI-s and A-DPI TTOT respectively.2
> The average ATFM Delay Share Index at SXF decreased from 1.0 to 0.9 resulting in estimated saving of
2,000 ATFM delay minutes in 2015. However, due to the slight increase in the proportion of longer
ATFM delay (to Turkey and Greece), this has not resulted a net reduction of tactical ATFM delay costs.3
The performance improvements at Berlin Schönefeld have been estimated to generate the following
annual savings based on 2014 traffic levels.
1 Derived from PRU data analysis.
2 Derived from analysis of NMOC data comparing ETOT vs ATOT (pre A-CDM) and TTOT vs ATOT (post-CDM).
3 The ATFM Delay Share Index is the ratio of the proportion of total delay to the proportion of slots allocated to the airport for any one flow
restriction. A ratio of 1 indicates a fair proportion of delay for the number of slots allocated. This indicator has been generated using historical
ATFM delay from NMOC.
83 | Page

Airport-CDM Be efits Factsheet
Brussels EBB‘ / B‘U
84 | Page

Brussels
Operatio al O er ie
Brussels airport (BRU) is currently the 17th
busiest airport in Europe, generating 225,000 IFR
movements and serving almost 22 million passengers in 2014 - an increase of 8% and 15% respectively
compared to 2013. Tower and local approach services are provided by Belgocontrol. The airport is an
operational hub for Brussels Airlines, Jetairfly, Thomas Cook Belgium and the cargo operations of,
amongst others both Singapore, DHL and Saudi Airlines. Other operational characteristics include:
> 3 runways which are most commonly operated in segregated mode. Most typically, runway 25R is
used for departures and both 25L and 25R are for arrivals. All runways are available during night
operations.
> IFR traffic consists mostly of narrow body aircraft. Approximately 10% of IFR movements are twin aisle
aircraft (in passenger configuration).
> Traffic demand is highest in September and is lowest in January – with approximately 25% less
demand.
> A significant military (logistical) operation is present at BRU, which can comprise a significant
proportion of the traffic mix at certain times.
> BRU provides both on-stand and remote de-icing services, which are provided by Aviapartner and
Swissport.
> 70% of flights are de-iced on-stand. During severe winter operations, this can make it challenging to
meet holdover times and the avoidance of subsequent delays.
> Ope ed i March 20 5, the airport oasts a e Co ector facility that li ks oth departure piers A and B and centralises the border control to a 25 lane security screening platform – Europe s largest at opening.
85 | Page

Brussels
Airport CDM Process
B‘U had i itially i ple e ted TOBT procedures i 2005, making it one of the airports to pioneer the
concept of integrating the turnaround and flight planning process. Local adoption of refined A-CDM
procedures was implemented in June 2010, with the DPI connection established operationally on June
29th
2010. BRU further developed their systems and procedures to include de-icing milestones in
November 2013.
> BRU adopts a procedure where the i itial EOBT IOBT = TOBT. This is used to generate the E-DPI
after flight plan / schedule consistency checks have been performed.
> All EOBT updates (CHG/DLA) after the flight plan validation check are reflected in the TOBT when the
new EOBT is later than the TOBT.
> TOBT updates are provided by GHs through ETD updates (and system to system interfaces) via their
current planning systems.
> Alerts such as EOBT / TOBT discrepancy are sent to the airlines via e-mail. These alerts are graded in
se erity fro Pri ary to Ad isory . Pri ary alerts ill stop the A-CDM process and prevent start-up
clearance.
> The arrival flight progress is not dynamically linked with the outbound TOBT. It is the responsibility of
GHs to respond to a delay on receipt of a MVT message (or any earlier indication that the inbound
flight is delayed).
> At TOBT – 25 , the TSAT is calculated by the ATC Departure
Manager (DMAN). BRU permits unlimited TOBT updates after
sequencing.
> The TOBT is shown on the Docking Guidance System from EOBT -
20 . At TOBT – 5 , the TOBT is replaced y the TSAT. For re ote stands, the TSAT is communicated when calling for en-route
clearance from EOBT – 0 o ards, or prior if a specific re uest is made by the crew.
> If calling for start-up after TSAT + 5 minutes, the crew is transferred back to the GH to have the TOBT
and/or flight plan EOBT updated. The flight is then sequenced based on the updated estimate.
> A-DPI are transmitted at BRU in response to the start-up clearance event. This is currently the most
reliable approach for generating consistently accurate off-block estimations.
86 | Page

Brussels
Operatio al Be efits
A-CDM at BRU has evolved with the development of the concept in the early 2000s. The airport has
experienced both the benefits and challenges of an A-CDM implementation for longer than most. It is
thought that A-CDM has contributed to the following performance improvements at Brussels:
> There is no longer a need for departure restrictions at BRU. A-CDM is a permanent solution for
eliminating departure regulations through the flexible streaming of aircraft to the threshold.
> Pilots have improved awareness of their expected start-up resulting in little or no requirement for
further discussion with ATC.
> Turnaround performance is improving, particularly in periods of adverse conditions where limited
resources are allocated in accordance to the TSAT.
> The accuracy of take-off times within ETFMS has improved by almost 70% during peak times.
> The average reduction in taxi-out time was calculated as 3 minutes per departure.1
> The average ATFM Delay Share Index at Brussels is now 0.85, resulting in an estimated 28,500 less
ATFM delay minutes with a tactical delay saving of €2.6 million for aircraft operators in 2015.2
The performance improvements at Brussels have been estimated to generate the following annual
savings based on 2014 traffic levels.
1 A study by Belgocontrol showed an average reduction in taxi-out ti e of 2’ ” i 200 co pared to 200 .
2 The ATFM Delay Share Index is the ratio of the proportion of total delay to the proportion of slots allocated to the airport for any one flow
restriction. This indicator has been generated using historical ATFM delay from NMOC.
87 | Page

Airport-CDM Be efits Fa tsheet
Düsseldorf EDDL / DUS
88 | Page

Düsseldorf
Operatio al O er ie
Düsseldorf Airport (DUS) is urre tly Ger a y’s rd a d Europe’s th
busiest airport – generating
210,000 movements and moving 22.4 million passengers in 2015. DUS serves as an operational hub
for Air Berlin, Germanwings and Eurowings. The airport operator is Flughafen Düsseldorf GmbH (FDG)
and tower ATC services are provided by Deutsche Flugsicherung GmbH (DFS). Operational
characteristics include:
> DUS is restricted by a curfew that restricts arrivals between 11pm (12pm for base carriers) and 6am
as well as departures between 10pm and 6am.
> Although 2 parallel runways are available, the northerly runway (RWY 23R / 05L) is usable for 56
hours a week only. The times of operation must be notified to local authorities the week prior.
> In peak hours, the runways are also constrained by MDI applied to departures on various departure
routes.
> DUS provides 2 remote de-icing areas on parking positions on either side of the apron.
> Should the met office forecast a cold / snowy night, then 13 parking stands are unable to be used for
overnight parking as the de-icing location (determined by runway) is not determined until the
morning. De-icing Area East blocks 9 parking stands and De-icing Area West blocks 4 parking stands
and 1 taxi lane.
> The apron area is very limited in size. Single lane cul-de-sacs and a large number of remote stands (61
positions) makes the job of the ground controller particularly challenging during peak waves.
> The aircraft type mix is varied, including business jets, ATR72 and A380. 65% are ICAO Class C aircraft
types.
> The majority of departures are operating on short turnaround times of 30-40 minutes.
> Ground handling services are provided by FDGHG (subsidiary of FDG) and Aviapartner.
89 | Page

Düsseldorf
Airport CDM Pro ess
The local implementation of A-CDM at DUS coincided with the opening of the Airport Control Centre
(ACC) in October 2012. The ACC was deployed to provide a centre for common situational awareness
and collaborative working. It includes an A-CDM process monitoring position, as well as the main
operational stakeholders and authorities. As part of the German Harmonisation Group, many of the A-
CDM pro esses a d ATC i terfa es are har o ised a ross all of Ger a y’s CDM airports. Nota le elements of the A-CDM implementation at DUS include:
> The TOBT is automatically generated when the correlated inbound flight is at 10 miles final. For flights
not subject to a direct turnaround, the TOBT is generated automatically at EOBT – ’.
> For stands equipped with a visual docking guidance system, the TOBT timestamp is shown from TOBT -
’.
> Unlimited TOBT updates are permitted until the flight is sequenced at TOBT – ’, after hi h o ly updates are permitted. Prior to a fourth update, the TOBT has to be deleted and the flight is removed
from the sequence.
> TSATs are generated at TOBT – ’ a d o u i ated ia the o o situational awareness tool
(Web-DUPLO). Flight crews may also receive the TSAT when receiving ATC clearance via datalink (DCL).
Subsequent updates to the TSAT after clearance are not published and will be relayed to the crew by
the TOBT responsible person. TSAT are also made available via an SMS-Service.
> In case of a long delay, the TOBT responsible person can approach the TOBT to the TSAT to allow a
later boarding of passengers.
> Ground handlers call the TOBT responsible person or the A-CDM position within the ACC to confirm
that the flight is ready for departure. This position enters the ARDT into Web-DUPLO. A missing ARDT
i put at TOBT + ’ does not result in a TOBT deletion. The ARDT timestamp is not currently available at
the clearance delivery position for ready confirmation purposes.
> The PDS calculates the sequence 3 hours ahead, providing ATC with a better predictability of
oncoming SID saturation, TSAT delay and the number of regulated flights to expect.
> Flights from DUS are not permitted to push off-block after 21:49 (local) without specific permission
because of the night curfew. DUS has implemented custom warnings CDM15 and CDM16 to alert the
AO that the TOBT is later than 21:49 (local) or the TSAT respectively is later than 21:54 (local).
90 | Page

Düsseldorf
Qualitati e Be efits
Düsseldorf was the 6th
European airport to fully implement Airport CDM on April 24th
2013. The
following operational benefits of A-CDM were reported by Flughafen Düsseldorf GmbH:
> The predictability of landing and off-block (departure) times is now very high. This enables a more
efficient use of airport infrastructure (e.g. Stand & Gate Positioning, De-icing pads).
> A closer collaboration is evident with DFS (both in the TWR and in Langen HQ) and NMOC.
> Speed and clarity of information exchange (across all partners) have resulted in both better handling
and faster recovery from adverse conditions.
> The integration of the de-icing function into the PDS has provided unprecedented levels of
operational resilience and de-icing throughput capability combined with reduced congestion and
confusion on the apron.
> The ground handlers reported that the TSAT enables more efficient resource planning but this does
depend on the stability of the pre-departure sequence.
The following operational benefits were declared by DFS, the TWR operator:
> Workload of the clearance delivery position has reduced due to less RT task loading (pilots do not call
to know their position in the sequence). It also requires less workload to avoid traffic bunching on the
apron.
> The PDS has provided controllers with data that highlights the strengths and weaknesses of the
departure flow.
> RWY closures and de-icing are much easier to handle, with a significantly reduced recovery period to
normal operations.
91 | Page
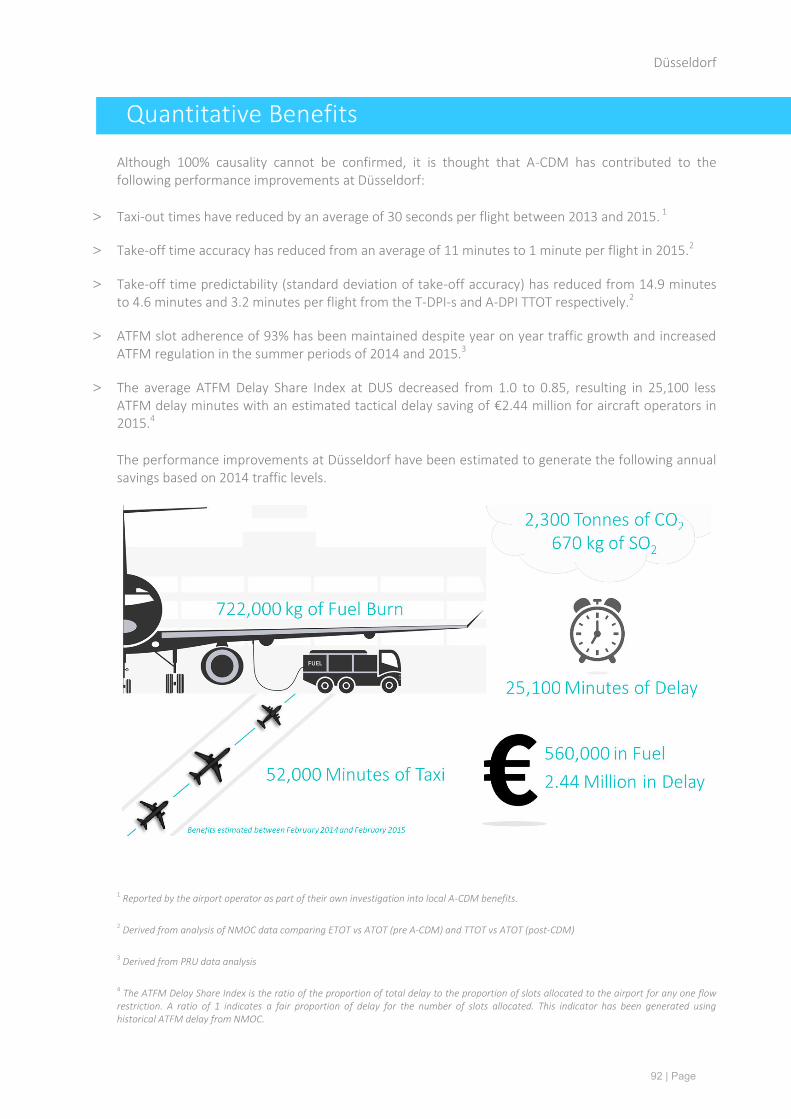
Düsseldorf
Qua titati e Be efits
Although 100% causality cannot be confirmed, it is thought that A-CDM has contributed to the
following performance improvements at Düsseldorf:
> Taxi-out times have reduced by an average of 30 seconds per flight between 2013 and 2015. 1
> Take-off time accuracy has reduced from an average of 11 minutes to 1 minute per flight in 2015.2
> Take-off time predictability (standard deviation of take-off accuracy) has reduced from 14.9 minutes
to 4.6 minutes and 3.2 minutes per flight from the T-DPI-s and A-DPI TTOT respectively.2
> ATFM slot adherence of 93% has been maintained despite year on year traffic growth and increased
ATFM regulation in the summer periods of 2014 and 2015.3
> The average ATFM Delay Share Index at DUS decreased from 1.0 to 0.85, resulting in 25,100 less
ATFM delay minutes with an estimated tactical delay saving of €2.44 million for aircraft operators in
2015.4
The performance improvements at Düsseldorf have been estimated to generate the following annual
savings based on 2014 traffic levels.
1 Reported by the airport operator as part of their own investigation into local A-CDM benefits.
2 Derived from analysis of NMOC data comparing ETOT vs ATOT (pre A-CDM) and TTOT vs ATOT (post-CDM)
3 Derived from PRU data analysis
4 The ATFM Delay Share Index is the ratio of the proportion of total delay to the proportion of slots allocated to the airport for any one flow
restriction. A ratio of 1 indicates a fair proportion of delay for the number of slots allocated. This indicator has been generated using
historical ATFM delay from NMOC.
92 | Page

93 | Page

Airport-CDM Be efits Factsheet
Fra kfurt EDDF / F‘A
94 | Page

Frankfurt
Operatio al O er ie
In 2014, Frankfurt airport (FRA) generated 469,000 movements and processed 59.6 million passengers.
Frankfurt is curre tly Europe s rd busiest airport by movements and the largest cargo operation with
over 2 million tonnes of freight handled in 2014, a 1.8% increase on the previous year. FRA serves as
the main hub for Lufthansa, Condor and Aerologic. The airport is operated by Fraport AG and Tower
ATC services are provided by DFS. Other operational characteristics of FRA include:
> 4 runways which allow for independent parallel approaches – however the northerly runway (25R/07L)
is for arrivals only – and may not be used for A380, MD11 or B747 aircraft types (due to noise
abatement).
> Noise abatement procedures forces departures from 25C to make a left hand turn to avoid overflying a
residential area. This causes a conflict with the go-around track of westerly inbounds (on 25L) and
potential overflying of RWY18 – which is used for departures to the south only. This left turn is limiting
the operating capacity of the airport for the most frequently adopted runway configuration (used for
75% of the time).
> Departures on RWY18 will not take place if tailwinds are greater than 15kts. Stand constraints can
result in arrival regulations when departure capacity is limited.
> FRA is restricted by a curfew that restricts movements (from the runway) between 11pm and 5am local
time.
> De-icing is performed ca. 60% on-stand. FRA has 5 remote de-icing pads.
> 77% of flights are conducted by narrow body jets. The remainder is ICAO Class D type or above. Less
than 1% of movements are from general or business aviation jets.
> 5 major ground handling companies and a single de-icing contractor (N*ICE) currently operate at
Frankfurt.
95 | Page

Frankfurt
Airport CDM Process
The Airport-CDM project at Frankfurt was first initiated in 2008 by Fraport AG and DFS. Their A-CDM
certificate was achieved on February 23rd
2011 after a 3 month trial period that included both local
procedures and DPI integration phases. Notable elements of the A-CDM implementation at FRA
include:
> The TOBT are automatically generated (if not manual input is already available) when the correlated
inbound flight is 30 minutes from touchdown, but will not be published until EOBT – 90 at the earliest.
> TOBT may be entered via the common situational awareness (CSA) tool, via an interface with AO/GH
systems and SITA messaging. The Fraport traffic operations centre also receives updates by telephone.
> TSATs are distributed (after TOBT – 40 via the CSA Tool, DCL (to the flight deck) and an SMS service.
They are also shown on the stand docking guidance systems at TOBT – 7 minutes. TOBT and TSAT are
also provided via DPI messages to EUROCONTROL/NMOC.
> The boarding started time-stamp is generated from the Digital Gate Announcement System (DGA),
which drives the CDM09 Boardi g ot Started alert.
> On-stand de-icing resources are planned based on the TOBT and pre-departure sequence. Alert
(CDM40) will be generated if the de-icing crew is ready for de-icing and cannot begin the process at
time ECZT plus 5 minutes (aircraft not ready).
> The ARDT is automatically generated based on the time of pier bridge retraction (for connected stands)
and the last passenger to disembark the boarding bus (for remote stands). Due to fragmentary
availability of Aircraft Ready , this timestamp is not used as a means of policing start-up clearance.
> Due to cul-de-sacs in the northern terminal ramp area, the off-block time does not always give the best
estimate of the TTOT. Therefore, an additional A-DPI may be published at the actual taxi begin time.
> As well as providing an A-CDM timestamp and alert status for all flights (for which the GH/AO is
authorised) the CSA Tool provides airport wide indicators in order to improve situational awareness,
such as TSAT delay and stability, runway configuration, TOBT quality, off-block adherence and de-icing
demand / flow.
96 | Page

Frankfurt
Qualitati e Be efits
Frankfurt was the 4th
European airport to fully implement Airport-CDM. The following operational
benefits of the A-CDM implementation were reported by Fraport, DFS and other A-CDM stakeholders:
> Before A-CDM, significant demands were placed on the clearance position for communicating delay
which was hard to predict due to the complex runway constraints. The TSAT has reduced this workload
element significantly.
> ATC previously had no visibility on how start-up clearances would impact de-icing bay congestion and
runway throughput – eventually resulting in the cessation of start-up clearances as congestion grew.
The TSAT enables the automatic throttling of start-up clearances based on current de-icing demand.
> N*ICE (the de-icing contractor) has provided feedback to suggest that the TSAT has revolutionised the
efficiency of their resource planning. They are alerted when a flight is not likely to be ready for on-
stand de-icing and can proactively reallocate de-icing vehicles to maximise utilisation.
> Reactionary delay is reducing as notification of inbound delay is known earlier to both GH and
positioning.
> A representative of Acciona, a major handling agent at Frankfurt has stated that A-CDM fundamentally
improved the basis for decision-making and that they can now coordinate resources better and more
efficiently.
> The TTOT and a particular CDM alert (CDM17) results in fewer night curfew violations made by aircraft
that leave the stand prior to curfew, but are not in position to depart before the curfew takes effect at
11pm.
> The improved predictability during periods of adverse conditions results in a smoother and faster
return to regular operations. This is particularly important for Frankfurt where a northerly wind of
greater than 15 knots (preventing use of RWY18) can significantly reduce the operational capacity of
the airport.
> Outbound punctuality (disregarding regulated flights) is improving despite the gree delay of the TSAT – this is thought to be due to the impact that TOBT quality has had on the predictability of the ground
operation.
97 | Page

Frankfurt
Qua titati e Be efits
The implementation of A-CDM occurred during the same year that the new ATC tower and RWY
25R/07L became operational. This invalidated quantitative pre and post A-CDM comparisons of taxi-
time performance due to the change of standard taxi-routings. Although 100% causality cannot be
confirmed, other performance gains generated from the Frankfurt A-CDM implementation include:
> Take-off time accuracy is 3.8 minutes and 0.8 minutes per flight from the T-DPI-s and A-DPI TTOT
respectively. The average pre-implementation take-off accuracy is 7.5 minutes.1
> Take-off time predictability (standard deviation of take-off accuracy) is now 6.1 minutes and 4.4
minutes per flight from the T-DPI-s and A-DPI TTOT respectively.1
> ATFM slot adherence has increased to an average of 91% despite both large regulation volumes in the
summer of 2014 and 2015 and the complex operational constraints and interdependencies.2
> Stand stability (defined by the percentage of flights where the stand did not change after the final
approach fix) has continued to improve. Since the refinement of the EXIT tables in early 2015, the stand
stability has not dropped below 95%.3
> The average ATFM Delay Share Index at Frankfurt is now 0.87. Prior to DPI integration, this value is
typically between 1.05 and 1.1 (for both locally implemented and non A-CDM airports).4
> Based on 2015 ATFM regulation volumes, it is estimated that DPI integration has saved approximately
34,800 minutes of ATFM delay, with an estimated tactical delay cost saving of € .6 illio for aircraft
operators.
1 Derived from the analysis of NMOC data comparing ETOT vs ATOT (pre A-CDM) and TTOT vs ATOT (post-CDM)
2 Derived from PRU data analysis
3 Generated by Fraport as part of local performance monitoring
4 The ATFM Delay Share Index is the ratio of the proportion of total delay to the proportion of slots allocated to the airport for any one flow
restriction. A ratio of 1 indicates a fair proportion of delay for the number of slots allocated. This indicator has been generated using historical
ATFM delay from NMOC.
98 | Page

99 | Page

Airport-CDM Be efits Factsheet
Helsi ki EFHK / HEL
100 | Page
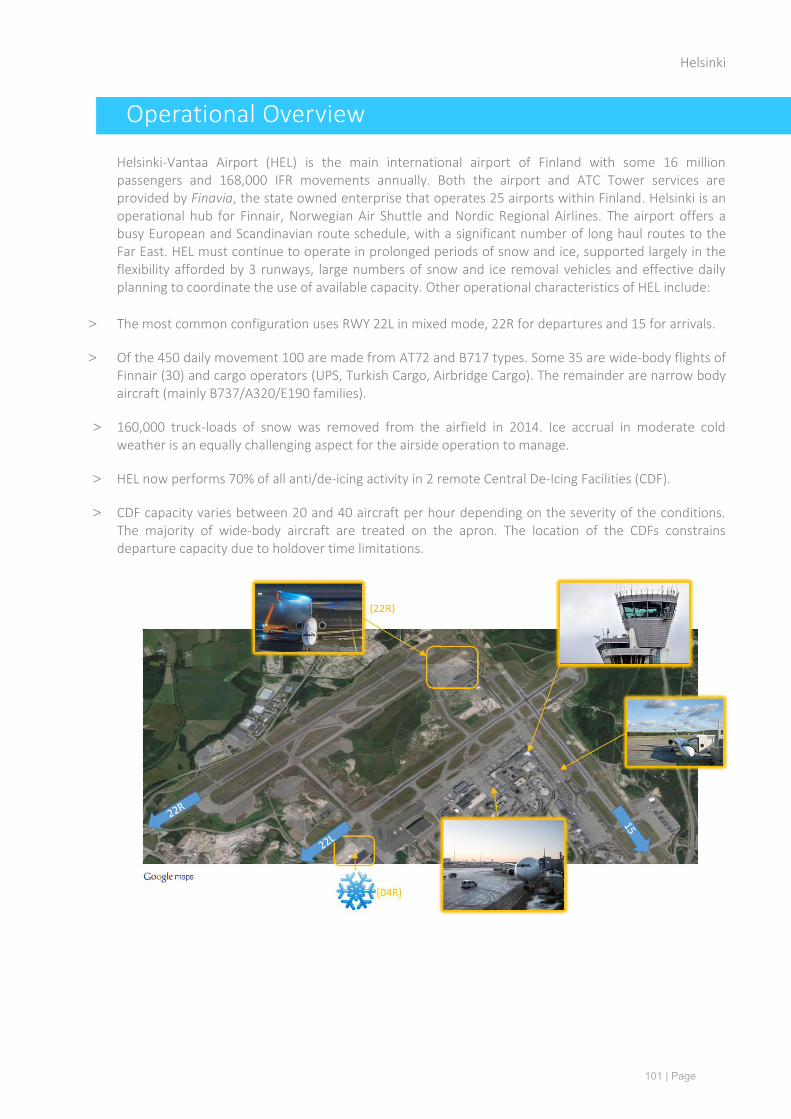
Helsinki
Operatio al O er ie
Helsinki-Vantaa Airport (HEL) is the main international airport of Finland with some 16 million
passengers and 168,000 IFR movements annually. Both the airport and ATC Tower services are
provided by Finavia, the state owned enterprise that operates 25 airports within Finland. Helsinki is an
operational hub for Finnair, Norwegian Air Shuttle and Nordic Regional Airlines. The airport offers a
busy European and Scandinavian route schedule, with a significant number of long haul routes to the
Far East. HEL must continue to operate in prolonged periods of snow and ice, supported largely in the
flexibility afforded by 3 runways, large numbers of snow and ice removal vehicles and effective daily
planning to coordinate the use of available capacity. Other operational characteristics of HEL include:
> The most common configuration uses RWY 22L in mixed mode, 22R for departures and 15 for arrivals.
> Of the 450 daily movement 100 are made from AT72 and B717 types. Some 35 are wide-body flights of
Finnair (30) and cargo operators (UPS, Turkish Cargo, Airbridge Cargo). The remainder are narrow body
aircraft (mainly B737/A320/E190 families).
> 160,000 truck-loads of snow was removed from the airfield in 2014. Ice accrual in moderate cold
weather is an equally challenging aspect for the airside operation to manage.
> HEL now performs 70% of all anti/de-icing activity in 2 remote Central De-Icing Facilities (CDF).
> CDF capacity varies between 20 and 40 aircraft per hour depending on the severity of the conditions.
The majority of wide-body aircraft are treated on the apron. The location of the CDFs constrains
departure capacity due to holdover time limitations.
101 | Page

Helsinki
Airport CDM Process
Helsinki was the 5th
airport to fully implement A-CDM in January 2013. The CDM tools and processes
have been tailored to suit the demands of winter operations as well as large fluctuations in daily traffic
demand.
> Arrival flight progress is monitored and used to update the Estimated In-Block Time based on ATC e-
strip information and VTT tables.
> The automatic generation of TOBTs based on arrival flight progress is not currently implemented at HEL.
> At HEL, the TOBT always marks the end of the ground handling process. TOBT DE-ICE is a parameter that is
used to track the end of the on-stand de-icing process.
> The 3 de-icing companies are able to modify the ECZT or EDIT depending on the progress of each flight
and current de-icing capacity – which subsequently updates the TOBT DE-ICE.
> TSATs are first generated by the CDM system at TOBT – 40 and made available in the TW‘ e-strips system.
> TSATs are generated based on both runway and CDF slot availability (during adverse weather
conditions).
> TSATs are first delivered to crew as part of en-route clearance (voice or datalink) and APIS equipment
where available. Crew can access the A-CDM web portal via their cockpit devices or receive updates via
their GH.
> A TSAT freeze fu ctio e a les airli es to pre e t future TSAT i pro e e ts ithi the TSAT – 20 window. This helps avoid cases where late TSAT changes may not be communicated to the flight crew.
> Only 3 updates to the TOBT (or TOBT DE-ICE) are permitted. After this, the GH must call the CDM
Management Centre (CMC) to u lock the flight to allow a new TOBT and TSAT to be generated. This
procedure is to promote the considered updates of TOBT, ECZT and EDIT parameters.
> ATC will not provide start up clearance unless the pilot calls within TSAT +/- 5 minutes.
Local suspension and C-DPI publication is slightly delayed to allow airlines to respond
with a new TOBT.
> Duri g periods of se ere delay, airli es are a le to s ap TSATs to prioritise their o departures. This function is subject to tight controls (i.e. regulated flights are in-eligible).
> HEL has implemented Electronic Message Boards (EMB) to maintain levels of safety and
traffic awareness in the CDF areas. These boards are part of the same information flow
as the A-CDM system.
102 | Page

Helsinki
Operatio al Be efits
Although 100% causality cannot be confirmed, it is thought that A-CDM has contributed to the
following performance improvements at Helsinki:
> Operational resilience has improved owing to the integration of the TOBT into the de-icing process.
> A-CDM has contributed to the increased utilisation of available de-icing and runway capacity.
> The average time between the off-block event and start-up request has reduced notably since 2013.
> Off block delay has reduced by an average of 1 minute to reach 9 minutes per departure.1
> Taxi-out time has reduced by an average of 0.7 minutes to reach 8.2 minutes per departure. This is
despite an increase in the proportion of flights that are de-iced remotely.1
> Take-off time accuracy has reduced from an average of 9.8 minutes to 2 minutes per flight in 2015.2
> Take-off time predictability (standard deviation of take-off accuracy) has reduced from of 14.0 minutes
to 3.9 minutes per flight in 2015.2
> The average ATFM Delay Share Index at HEL decreased from 1.05 to 0.9, resulting in 8,400 less ATFM
delay minutes with an estimated tactical delay saving of €0.9 million for aircraft operators in 2015.3
The performance improvements at Helsinki have been estimated to generate following annual savings
based on 2014 traffic levels.
1 Derived from an analysis of PRU data
2 Derived from analysis of NMOC data comparing ETOT vs ATOT (pre A-CDM) and TTOT vs ATOT (post-CDM)
3 The ATFM Delay Share Index is the ratio of the proportion of total delay to the proportion of slots allocated to the airport for any one flow
restriction.
103 | Page

Airport-CDM Be efits Factsheet
Lo do Gat ick EGKK / LGW
104 | Page

London Gatwick
Operatio al O er ie
In 2015, London Gatwick (LGW) generated 267,776 IFR movements and served more than 40.2 million
passengers, making it the UK s 2nd a d Europe s 10
th busiest airport by traffic. In August 2015, LGW
handled 934 traffic movements in a single day - a world record for a single-runway airport. LGW is a
base for airlines across the three main airline business models to include EasyJet (43%), British Airways
(16%) and Norwegian (8%). LGW is operated by Gatwick Airport Limited (GAL) and ATC services are
currently provided by NATS Ltd, but will be assumed by Air Navigation Services Ltd on March 1st 2016.
> Gatwick has two runways but operates the northerly runway as a contingency only – with no ILS
capability. Almost 70% of departures take off to the West on runway 26L.
> LGW stand planning is constrained by a requirement to alight 95% of passengers directly into the
terminal.
> LGW has a push and hold procedure to free-up stands for arriving flights in case of ground delay. ATC
ay also facilitate a slo ta i to reduce the a ou t of static holdi g a d protect On-Time Departure
(OTD).
> Aircraft type mix is 90% narrow body (B737 / A319 / A320) and 8% wide body (B777 / B747 / B787 /
A380).
> SID separation is more of constraint to runway throughput than wake vortex separation minima.
> LGW is vulnerable to LVP, especially in the months of April / May and September to November.
> Night Jet Movements are subject to restrictions from 23:30 until 06:00 local time.
> Most aircraft de-icing is performed on stands, however remote de-icing is made available on taxiway
Sierra.
> Five ground handling companies operate at LGW. Turnaround performance is one of the key
performance areas targeted by GAL in maximising both OTD performance and the utilisation of airport
capacity.
105 | Page

London Gatwick
Airport CDM Process
LGW became locally implemented with the TSAT procedure in May 2014 and connected to NMOC in
October of the same year. A-CDM at LGW is part of a wider airside programme (A-CDM55) to increase
runway throughput, improve turnaround and OTD performance. Other characteristics of the A-CDM
implementation at LGW include:
> Automatic TOBTs ( a ed TOBT1 ) are first generated around 40 minutes prior to the ELDT of the
inbound flight. This is based on the Estimated Arrival Time (EAT) generated from NATS approach
systems.
> TOBTs are shown on the Stand Entry Guidance Systems (SEGS) as a countdown.
> Flights are first sequenced at TOBT – 40 minutes. The TSAT is available via the A-CDM web portal,
however it is not currently displayed on the SEGS.
> TTOTs and TSATs will also be shown on the SEGS from May 2016 to support single engine taxi
operations.
> After TOBT + 5 minutes, a missing start-up re uest ill result i Aircraft Not ‘eady alert. At TOBT + 10
minutes the flight is suspended pending the new TOBT entry from the ground handler.
> The pushback tugs should be allocated to the aircraft based on the TOBT - unless the difference
between the TSAT a d TOBT is greater tha 0 . In such cases, the ground staff can reallocate the tug
to another aircraft.
> The A-CDM system will flag regulated flights that are eligible for a push and hold procedure. This
procedure helps free up stands and ground handling resources.
> LGW implemented a function to automatically update the EOBT based on TOBT updates from the
Ground Handler, significantly reducing the number of flights that are removed from sequence.
> More than 60% of flights currently receive ATC pre-departure clearance via DCL; however all crews must
call the TWR for their start-up clearance irrespective of the TSAT delay (TSAT is not shown on the SEGS).
> Both remote and on-stand de-icing is available at LGW. In both cases, the TOBT always marks the end of
the ground handling process and is not adjusted to reflect de-icing activity.
> LGW implemented the UK s first e gi es-on de-icing process in 2015 – dramatically reducing the
remote stand de-icing time.
106 | Page

London Gatwick
Operatio al Be efits
London Gatwick was the 15th
airport to fully implement Airport CDM. The key motivation for A-CDM at
LGW has been to maximise runway throughput and bolster operational resilience during adverse
conditions. It is thought that A-CDM has contributed heavily to some of the following operational
benefits, however other improvements might have contributed to these also:
> Take-off time accuracy has reduced from an average of 7 minutes to 1.5 minutes per flight in 2015. 1
> Take-off time predictability (standard deviation of take-off accuracy) has reduced from 15.9 minutes to
12.9 minutes and 7.4 minutes per flight from the T-DPI-s and A-DPI TTOT respectively.1
> The average ATFM Delay Share Index at LGW decreased from 1.05 to 0.95.2
> The peak departure rate has increased which has powered record runway throughput and enabled the
more expeditious recovery from periods of reduced capacity. On average, LGW has departed 60
aircraft 20 minutes sooner after periods of reduced departure capacity – as illustrated below.3
1 Derived from analysis of NMOC data comparing ETOT vs ATOT (pre A-CDM) and TTOT vs ATOT (post-CDM)
2 The ATFM Delay Share Index is the ratio of the proportion of total delay to the proportion of slots allocated to the airport for any one flow
restriction. A ratio of 1 indicates a fair proportion of delay for the number of slots allocated. This indicator has been generated using historical
ATFM delay from NMOC.
3 Derived from an analysis of departing flight data provided by GAL in support of the study.
107 | Page

Airport-CDM Be efits Factsheet
Lo do Heathro EGLL / LH‘
108 | Page

London Heathrow
Operatio al O er ie
London Heathrow (LHR) was Europe s busiest airport by movements in 2014, operating approximately
473,000 IFR movements (an average of 1,290 daily movements with the peak day at 1,390 movements)
and processing over 73 million passengers. LHR is the primary hub for British Airways and local tower
ATC services are provided by NATS Ltd. Other operational characteristics of LHR include:
> 2 parallel runways configured mainly in segregated mode operate at an average of 95% utilisation
between 06:00 and 23:00 (UTC). Night flights are restricted by both number and an annual noise
intensity quota.
> Departures are mainly to the west using 27L or 27R (typically 70%), and when operating in this
direction the runway used for landings is alternated at 3pm each day. There is currently only one
possible mode of Easterly operation: 09R is used for departures and 09L for arrivals.
> Sustaining high departure rates at LHR (> 50 per hour) is a real challenge given the Wake Vortex mix,
SID separation requirements and levels of congestion within the London TMA.
> Approximately 35% of passengers through LHR are connecting. Baggage transfer between codeshare
flights is supported by the consolidation of alliance partners within terminals.
> In the region of 40% of movements are by wide-body aircraft. There is a steady, gradual annual
increase in the number of A380s which make up close to 3% of LH‘ s traffic. There are currently no
turbo-prop aircraft operating from LHR, although they are permitted. LHR also has a separate business
aviation parking area.
> Aircraft de-icing is performed by a mixture of on-stand and drive through.
> Tactically Enhanced Arrival Mode (TEAM) operations allow for up to 6 aircraft in an hour to land on the
departure runway during periods of high arrival delay.
109 | Page

London Heathrow
Airport CDM Process
LHR fully implemented A-CDM in August 2013 and the de-icing module has been live since 2014. A TOBT
procedure has been in effect from late 2011 and the CDM start-up milestones were implemented after
a successful trial in February 2012. Notable elements of the A-CDM process at LHR include:
> ELDTs are generated 85 minutes or earlier from touchdown and are based on EAT from the ATC Arrival
Manager. Times include stack holding delay. Prior to this, ELDT are available from other sources (i.e.
FUM).
> Potential stand conflicts are resolved by the stand planning function using inbound flight progress times.
> Calculated Off-Block Times (COBTs) are generated by the A-CDM platform but are not used to generate
TOBTs according to a specific A-CDM task force agreement with IATA.
> LH‘ s A-CDM portal provides stakeholders with standard A-CDM alerts and airport-wide performance
information. It also includes a situational awareness map of aircraft and towing movements, stand
status information, daily runway alternation plan and scheduled SID saturations (planned for 2016).
> TSATs are published on the Stand Entry Guidance System (SEGS) at TOBT – 30 minutes. They may also
be published directly to the flight deck via datalink for carriers that have subscribed to the service.
> All flights must report to ATC that they are ready to push within the TOBT +/- 5 minutes window.
> TTOT may also be published to flight crews via the datalink service (TTIME message). Updates during
taxi-out will also be published (if requested) as the apron situation evolves.
> Within the TSAT window, Heathrow Delivery will provide flights with start-up and push clearance. Once
transferred to Heathrow Ground, the push tow must be connected within 5 minutes, or the flight risks
losing its place in the sequence.
> There is no limit set on the TOBT/ETD updates at LHR, although high runway demand means that late
TOBT updates will most often result in moving down the sequence with a later TSAT. This drives better
TOBT accuracy and therefore no need for update limits.
> LHR promotes information transparency and common situational awareness across all stakeholders.
Airlines and ground handlers are free to view schedule, TOBT and TSAT timestamps of other operators
in real time as well as integrate their operations systems directly to the A-CDM data feed.
110 | Page

London Heathrow
Qualitati e Be efits
A-CDM at LHR is great example of where operational transparency and open communication can mould
attitudes and resulting behaviours. Improved adherence to procedures both in the Control Tower and
by airline operators and ground handlers is evidence of a maturing culture in which off-block
predictability is not just a service obligation, but a necessity for ensuring runway utilisation is
maximised and performance improved.
> Prolo ged pha to start-up delay was previously a result of pre-emptive start-up requests to ensure
on-ti e departures duri g grou d delay. The call o TOBT procedure has eradicated this practice –
resulting in dramatic improvements to runway demand forecasts and performance.
> TTOTs are published to flight crews (as TTIME messages) via the datalink service. Crews can use this
information to support single engine taxi procedures.
> The publication of the TSAT has helped partners to be aware of periods of delay and promotes a sense
of equitability in resolving this situation.
> TSAT compliance requirements have continued to dissuade flights from early start-up requests and
driven ATC attention to provide pushback authorisation within the TSAT window. The result of this has
ee a tighte i g of the start-up process and significantly improved awareness of both stand
availability and asset / resource demand.
> CTOT compliance improved significantly throughout 2015 and is now consistently above 90% making
LHR one of the airports with the best compliance in Europe.
> The TSAT procedure has facilitated an optimised traffic mix at the runway which has resulted in record
peak departure rates. Since the implementation of A-CDM, LHR has also seen improved recovery rates
from periods of disruptions and can now depart 60 aircraft an average of 20 minutes sooner than prior
to implementation.
111 | Page

London Heathrow
Qua titati e Be efits
Several operational improvements have been realised at LHR since the implementation of A-CDM.
Although 100% causality cannot be confirmed, it is thought that A-CDM has contributed to the
following performance improvements at LHR:
> The proportion of flights calling ready within 5 minutes of the TOBT has increased from 25% to 90%.1
> The proportion of flights awarded start-up clearance within the TSAT window has increased from 55%
to 85%.1
> Take-off time accuracy has improved from an average of 8.7 minutes to 30 seconds per flight.2
> Take-off time predictability (standard deviation of take-off accuracy) has improved from of 12.6
minutes to 7.6 minutes from the T-DPI-s TTOT and 5.5 minutes from the A-DPI TTOT. 2
> British Airways (BA) has implemented a single engine taxi procedure that is based on the TTOT which is
delivered directly to the flight-deck via ACARS whilst the aircraft is on stand. This can save several
minutes of engine running time per flight and is estimated to have generated the following annual fuel
and emissions savings for BA alone.
1 Analysis of operational data provided by Heathrow Airport Limited.
2 Derived from the analysis of NMOC data comparing ETOT vs ATOT (pre A-CDM) and TTOT vs ATOT (post-CDM)
112 | Page

113 | Page

Airport-CDM Benefits Factsheet
Madrid-Barajas LEMD / MAD
114 | Page

Madrid-Barajas
Operational O er ie
Madrid-Barajas Airport (MAD) is currently Europe s 6th busiest airport with over 40 million passengers
annually. MAD recorded almost 350,000 movements in 2014, with a day peak of over 1000
movements. The airport is operated by AENA and is an operational and maintenance hub for Iberia
and Air Europa, serving long haul flights across the Atlantic as well as a busy European schedule. Other
dominant carriers include Easyjet, Norwegian and Ryanair. Other operational characteristics of Madrid
are as follows:
> 4 runways are operated in segregated ode, typically in a North and South configuration. The
preferential configuration is 36L/R for departures and 32L/R for arrivals.
> 32L and 36R are closed in the evenings for noise abatement purposes.
> Main aircraft types operating from MAD includes narrow body jets (A320 / B737) and 2 daily waves of
arriving and departing wide bodies (A330/A340s).
> Arrival and departure waves are non-incidental which results in manageable levels of taxiway
congestion during normal operating conditions.
> A nearby military airfield can be a source of sudden capacity limitations due to TMA sharing.
> The runway system is subject to over-demand during certain periods of the day.
> MAD provides remote de-icing bays close to the runway threshold of both departing runway
configurations.
> 4 platform control towers are in operation at MAD. Ramp controllers hand the aircraft to ground
control which is located at the main tower in the centre of the airfield.
115 | Page

Madrid-Barajas
Airport CDM Process
Airport-CDM has been locally implemented at MAD since December 2013, with the network integration
established operationally since June 2014. A-CDM provides information and procedures used in the
TWR and Airport Management Centre (AMC). Notable characteristics of the A-CDM operation at MAD
include:
> MAD has implemented an A-CDM Information Sharing (ACIS) platform that is available for all authorised
stakeholders over the public web. It is called E-CDM and this system can be used to update the TOBT.
> TSATs are calculated at TOBT minus 30 minutes and is based on the TOBT is provided by the GH or the
EOBT.
> Automatic TOBT based on the linked inbound ELDT and MTTT was not deemed beneficial for operations
given the large number of tail swaps and the demonstrated high quality of TOBT and EOBT updates.
> TSATs are not awarded if the airport slot is inconsistent with the flight plan or if the TOBT is more than
10 minutes different to the EOBT. MAD have implemented 3 levels of intervention to ensure airport /
ATC information inconsistencies are handled prior to start-up request.
> There is no limit on the number of TOBT updates before declaring ready, however TOBT instability after
confirmation will be penalised in the sequence, unless there is a gap that can be filled.
> Pilots are informed of TSAT via Visual Docking Guidance Systems (VDGS), the web portal or the ground
handler. In case of a delay, this may also be reported by controllers when providing enroute clearance.
> If the TWR has not a received start-up request before TSAT + 5 minutes, the flight is removed from the
sequence and a new TOBT is required to re-enter the departure sequence.
> De-icing is implemented in the process as an extension of the taxi out time. MAD sends 2 A-DPI during
remote de-icing operations, one at the off-block and the other when exiting the de-icing bay. Both are
detected using A-SMGCS geo-fencing.
> IBERIA is the primary de-icing contractor which manages the de-icing times for different aircraft types.
Ryanair manages the de-icing of all its own flights.
116 | Page

Madrid-Barajas
Qualitati e Benefits
A-CDM @ MAD has dramatically improved levels of communication and understanding between the
ATC, Airport and Ground Handling functions. The decomposition of functional silos has in time,
contributed to improved levels of situational awareness which have contributed to improved levels of
operational efficiency and resilience.
AENA are continually engaging with all ground handling agents to ensure that the management of the
TOBT is consistently accurate. ATC have integrated the TSAT within their own operational workflow –
with great effect especially during periods of large demand / capacity imbalance. The following
describes some of the qualitative benefits of A-CDM reported by MAD.
> Last minute stand changes have reduced owing to the improved predictability of the inbound flight.
> Stand congestion has also reduced due to the improved confidence in the outbound departure time.
> Stand planning functions now use less buffer to factor for the variability in the off-block time when
compared to the scheduled time.
> The pre-departure sequencer supports ATC in reaching the maximum departing capacity, especially in
the morning peak and when recovering from periods of adverse conditions. Prior to A-CDM, this
process was particularly RT intensive – as many flights would call simultaneously for clearance and
push. Now, the start-up clearance process is driven by a more predictable TOBT, resulting in a more
efficient allocation of slots and utilisation of apron / runway capacity.
> Fewer flights are using remote holding points due to reduced stand congestion and the absorption of
delay on stand, resulting in improved quality of service for passengers.
> Less frequent ground handling induced delays due to improved arrival time predictability and
subsequent improvements in stand allocation.
117 | Page

Madrid-Barajas
Quantitati e Benefits
Several operational improvements have been realised at Madrid since implementation of A-CDM in
December 2013. Although 100% causality cannot be confirmed, it is thought that A-CDM has
contributed to the following performance improvements since January 2014:
> Taxi-out time has reduced by an average of 30 seconds to reach 15 minutes per departure in 2015.1
> Taxi-in time has reduced by an average of 30 seconds to reach 8 minutes per arrival in 2015.1
> Off-block delay has reduced by an average of 1 minute to 9 minutes per flight in 2015.1
> ATFM slot adherence has maintained a high level of 96% despite increased traffic and regulations.2
> Take-off time accuracy has reduced from an average of 9 minutes to 0.5 minutes per flight in 2015. 3
> Take-off time predictability (standard deviation of take-off accuracy) has reduced from 14.5 minutes to
6.7 minutes and 5.8 minutes per flight from the T-DPI-s and A-DPI TTOT respectively.3
> The average ATFM Delay Share Index at MAD decreased from 0.95 to 0.85, resulting in 5,600 less ATFM
delay minutes with an estimated tactical delay saving of €0.5 million for aircraft operators in 2015.4
The performance improvements at Madrid have been estimated to generate the following annual
savings based on 2014 traffic levels.
1 Analysis of MAD Airport Data
2 Performance Review Commission Performance Review 2013 & 2014
3 Derived from analysis of NMOC data comparing ETOT vs ATOT (pre A-CDM) and TTOT vs ATOT (post-CDM)
4 The ATFM Delay Share Index is the ratio of the proportion of total delay to the proportion of slots allocated to the airport for any one flow
restriction
118 | Page

119 | Page

Airport-CDM Benefits Factsheet
Milan Malpensa LIMC / MXP
120 | Page

Milan Malpensa
Operational O er ie
In 2014, Milan Malpensa (MXP) recorded 160,600 movements and handled over 18.8 million
passengers – making it the 27th
busiest airport in Europe in terms of traffic. Since the departure of an
Alitalia hub operations in 2008, MXP has been slowly recovering passenger numbers driven largely by
the arrival of an EasyJet base. MXP is generating service rates (24 mvts/hr) well below the declared
capacity (40 mvts/hr) that the 2 parallel runways can provide. The airport is operated by SEA Group
and ATC services provided by ENAV. Operational characteristics of MXP include:
> 2 parallel runways (35 L/R and 17 L/R) are used in segregated mode. 97% of departures are in the
direction of 35. Due to noise abatement, runways are alternated (ARR/DEP) each day at 2.30 PM local
time.
> Due to noise abatement procedures, night operations require opposite runway usage (DEP 17R/ARR
35L).
> Type mix is predominantly narrow body jets. Approximately 20% of flights are serviced by wide-body
aircraft.
> EasyJet is now the dominant carrier, with a dedicated terminal from which to operate (Terminal 2).
> MXP handles over 35,000 tonnes of freight every month. MXP is an operational hub for Cargolux
Italia.
> An Agusta Westland helicopter factory is present near to the airfield, however test flights have
minimal impact on operations.
> MXP has 2 anti / de-icing bays located on either side of the airfield. MXP does not allow on stand de-
icing.
> Currently at MXP, 5 ground handler companies operate on scheduled traffic and there are 3 other
companies handling General Aviation only. SEA is the only provider of de-icing services.
> Business and general aviation has a small presence at MXP (approximately 5% of traffic).
121 | Page

Milan Malpensa
Airport CDM Process
The implementation of A-CDM processes began at MXP in early 2013. As with most CDM airports,
some of the competing priorities of airlines has made for a challenging implementation phase and a
constant commitment to post-implementation stakeholder engagement, training and problem
resolution. Notable elements of the A-CDM implementation at MXP include:
> A-CDM procedures are harmonised across all Italian CDM airports – with differences existing due to
technical limitations (i.e. VDGS and datalink availability).
> MXP have implemented flight plan and schedule consistency checks with the associated alerts in the
A-CDM portal. These alerts are also emailed to the relevant company at hourly increments before
EOBT.
> TOBTs are generated automatically based on landing time updates that are forwarded from ENAV
using the most accurate source at each phase of flight.
> TSAT are generated by ENAV systems at EOBT – 40 . At EOBT – 30 , should any discrepancies exist, the
TSAT and TOBT are cancelled and the flight is removed from the sequence. A C-DPI is sent to NMOC
and the flight is suspended.
> Flights with an ATFM slot are not required to update EOBT to align with TOBT.
> The ramp agent is responsible for declaring that the aircraft is ready (ARDT) with the Airport
Coordination Centre (APCC). The ramp agent then communicates the TSAT once the APCC has
confirmed that the flight is ready (via CCTV or on site checks) and releases the flight to the TWR.
> The current procedure for start-up clearance is that the pilot must call for start-up clearance after
being transferred to the TWR. ATC clearance is delivered at the same time as start-up approval.
> Take-off preferences, type mix and the taxiway layout results in difficulties in setting accurate
estimated taxi-out times (EXOT) based static stand and runway mappings.
122 | Page

Milan Malpensa
Qualitati e Benefits
Views were collected on the local benefits of A-CDM from the representatives of SEA (the AO), ENAV
and EasyJet. From the AO perspective, it is thought that A-CDM has led to the following operational
benefits:
> Levels of situational awareness have improved due to the consolidation of information sources and
single version of the truth that is shared between ENAV, SEA and the ground handlers.
> The A-CDM portal provides proactive alerting that results in the resolution of problems before they
result in additional delay.
> The A-CDM system ensures that no two flights receive a TSAT to depart from adjacent stands at the
same time, requiring a more accurate resources allocation in order to prevent delay and
underutilisation of push resources.
> EasyJet agreed that A-CDM was supporting a reduction in line-up
times, however they did stress that during the first wave of the day, on-
time performance was their priority given the number of sectors flown
and the susceptibility for schedule slippage over the day. Other benefits noted by EasyJet include:
> Accurate (and early) TOBT generated from the linked arrival flight enables resources to be prioritised
to flights to perform quick turnarounds and bring flights back on schedule.
> EasyJet could confirm that they have noticed that the stability of the CTOT has improved, with fewer
changes and ad slot allocations fro NMOC since MXP eca e integrated.
> ENAV reported the following benefits of the A-CDM implementation:
> In the TWR, the TSAT (and associated start up clearance procedure)
has provided apron controllers with a more precise view of future
apron and runway demand.
> The T-DPIs acts as a pseudo ‘EA essage hich can auto atically generate a slot i pro e ent for regulated flights. This has a positive workload implication for controllers, especially during times of
adverse conditions.
123 | Page

Milan Malpensa
Quantitati e Benefits
Milan Malpensa was the 14th
European airport to fully implement Airport CDM on 7th
October 2014.
Although 100% cannot be guaranteed, it is thought that A-CDM has contributed to some of the
following operational benefits:
> During a notably difficult season for ATFM regulation, in 2015 the monthly ATFM slot adherence has
remained consistently above 97%. Traffic at MXP has also been growing over this time.1
> Take-off time accuracy has reduced from an average of 7 minutes to 1.5 minutes per flight in 2015. 2
> Take-off time predictability (standard deviation of take-off accuracy) has reduced from 12.8 minutes
to 5.5 minutes and 5.7 minutes per flight from the T-DPI-s and A-DPI TTOT respectively.2
> The average ATFM Delay Share Index at MXP decreased from 1.05 to 0.85.3
> The resulting improvement in the ATFM delay distribution for MXP (see below4) has been estimated
to have generated the following savings in 2015.
1 Monthly ATFM slot adherence results provided by the Performance Review Unit (PRU)
2 Derived from analysis of NMOC data comparing ETOT vs ATOT (pre A-CDM) and TTOT vs ATOT (post-CDM)
3 The ATFM Delay Share Index is the ratio of the proportion of total delay to the proportion of slots allocated to the airport for any one flow
restriction.
4Generated from ATFM regulation data between January 2012 and December 2015
124 | Page

125 | Page

Airport-CDM Benefits Factsheet
Munich EDDM / MUC
126 | Page
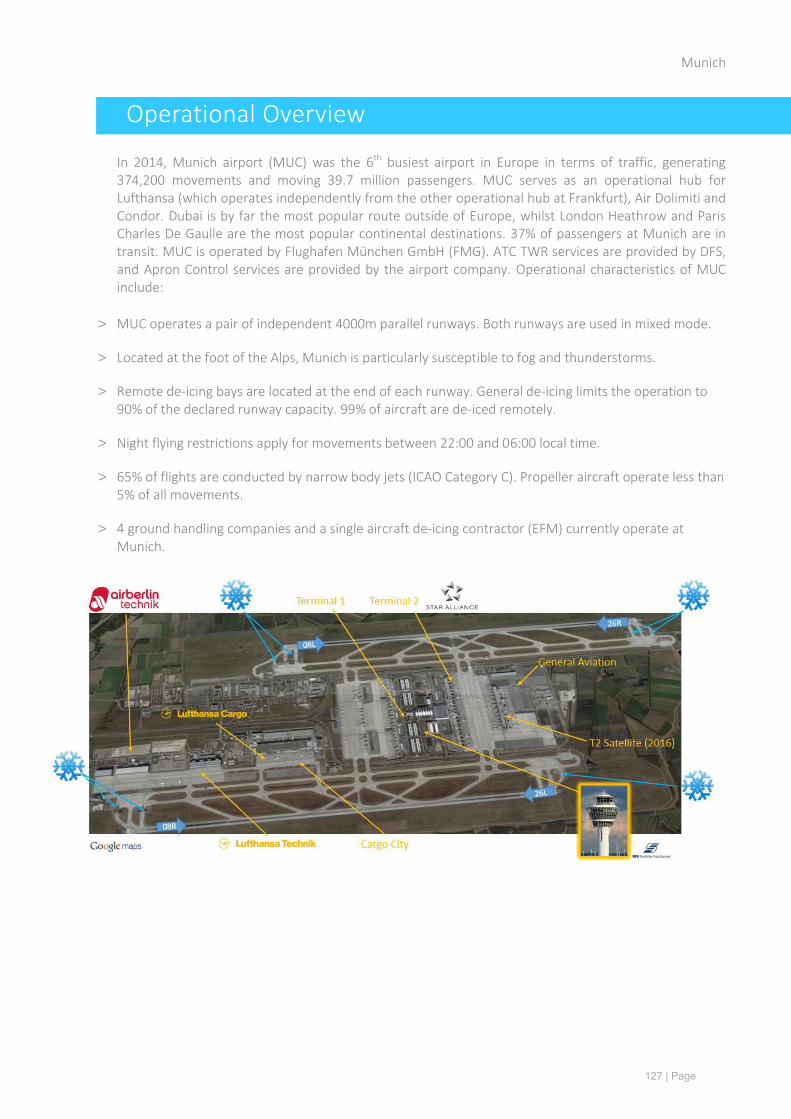
Munich
Operational O er ie
In 2014, Munich airport (MUC) was the 6th
busiest airport in Europe in terms of traffic, generating
374,200 movements and moving 39.7 million passengers. MUC serves as an operational hub for
Lufthansa (which operates independently from the other operational hub at Frankfurt), Air Dolimiti and
Condor. Dubai is by far the most popular route outside of Europe, whilst London Heathrow and Paris
Charles De Gaulle are the most popular continental destinations. 37% of passengers at Munich are in
transit. MUC is operated by Flughafen München GmbH (FMG). ATC TWR services are provided by DFS,
and Apron Control services are provided by the airport company. Operational characteristics of MUC
include:
> MUC operates a pair of independent 4000m parallel runways. Both runways are used in mixed mode.
> Located at the foot of the Alps, Munich is particularly susceptible to fog and thunderstorms.
> Remote de-icing bays are located at the end of each runway. General de-icing limits the operation to
90% of the declared runway capacity. 99% of aircraft are de-iced remotely.
> Night flying restrictions apply for movements between 22:00 and 06:00 local time.
> 65% of flights are conducted by narrow body jets (ICAO Category C). Propeller aircraft operate less than
5% of all movements.
> 4 ground handling companies and a single aircraft de-icing contractor (EFM) currently operate at
Munich.
127 | Page

Munich
Airport CDM Process
In the late 90s, DFS and FMG identified a need for improved situational awareness during winter
operations, facilitated through shared information between functional silos. The resulting project
(Confirmed Off-Block procedure) eventually evolved into the one of the first implementations of A-CDM
as a standardised procedure. Notable elements of the A-CDM implementation at MUC include:
> No flight is sequenced at Munich which does not have a flight plan which correlates to airport regulator
slot.
> At 12 minutes from landing, the sequence planner system will automatically generate a TOBT based on
the EIBT and MTTT of the linked inbound flight. It is not published before EOBT – 90 and will not
override a manually entered TOBT.
> A TOBT can be entered manually (via the Web-based CSA dialog, system interfaces or by phone to FMG
traffic ops centre) but cannot be earlier than EOBT – 10 . TOBT are isi le to cre s at gate positions
with an electronic display with a minute counter and delay notification after the TOBT has passed.
> TSATs are generated at TOBT – 40 minutes and are made available through the same channels as the
TOBT. Flight crews may also receive TSAT via datalink CLD (departure clearance uplink message).
> Where start-up is approved via datalink, crews must call apron control for push-back / taxi clearance
between TSAT +/- 5 . Flights that call for start-up clearance within the TSAT window must call back for
taxi clearance within 5 minutes after start-up approval is granted by clearance delivery. 50% of flights
currently request start-up clearance via datalink.
> Aircraft operators can swap their authorised flights in the pre-departure sequence as long as neither of
the flights has a regulation or the new TSAT is less than the TOBT.
> A-CDM timestamps are integrated into Tower Flight Data Processing System (TFDPS) from which ATC is
provided indications of when a flight is eligible for Start
Up clearance.
> 70% of off-block times are recorded from the stand
docking guidance systems. The remainder are captured
fro an action that is perfor ed on the e-strip console.
> A-DPI are published on both the off-block (except for
remote holding) and actual de-icing start milestones.
128 | Page

Munich
Qualitati e Benefits
As one of the pioneering CDM airports, Munich has led the way in demonstrating some of the potential
benefits that an A-CDM implementation can deliver. The following lists some of the qualitative benefits
reported by FMG and partners since the implementation in June 2007:
EFM, the provider of de-icing and ground towing services at Munich stated that:
> A-CDM has made it possible to use the available towing resources – particularly the push-backs –
more efficiently and to increase the productivity of the entire vehicle fleet.
> Adherence to the Airport-CDM procedure is the only way to use de-icing capacities to the full.
Mr Michael Oberauer of Apron control services (responsible for apron movements) of FMG stated that:
> Thanks to the target times (TOBT/TSAT), we were able to optimise the pushback and taxi procedures
as well as the control of landed aircraft with regard to apron capacity.
> Without Airport CDM, the increase in traffic volume between 2006 and 2007 would have had much
more a negative effect on the apron operation.
Mr Eberhard Kolbeck, Head of Central Traffic Flow Management (FMG) stated that:
> We ha e noticed that e can ostly do ithout the ad-hoc availability management of the aircraft
parking positions that as used efore Airport CDM.
> Data flo ia the NMOC supports cautious and anticipatory resource anage ent ensuring uninterrupted and custo er orientated operations.
Mr Markus Berberich, Head of Operations Control, Ground and Baggage Handling (Lufthansa MUC)
stated:
> We are no a le to o ser e the processes on the ground and after off-block up to take-off in a
transparent and tracea le anner ased on a planna le and structured procedure
> The display of the sequence in the electronic CSA tool and the possibilities it offers are very
beneficial
> Another asset is the co on ork culture created y A-CDM applying to staff of all involved
co panies
129 | Page

Munich
Quantitati e Benefits
Although 100% causality cannot be confirmed, it is thought that A-CDM has contributed to the
following performance improvements at Munich since June 2007:
> Taxi-out times have reduced by an average of 2 minutes per flight.1
> Stand changes of flights which are after the final approach fix have reduced to less than 1% of arrivals.1
> IATA punctuality has increased by 4.5%, approximating to 73,000 fewer flight delays annually.1
> ATFM slot adherence increased by 20% to reach levels which are consistently over 95% by 2015. 3
> Take-off time predictability (standard deviation of take-off accuracy) has reduced from 14 minutes to
5.3 minutes and 3.9 minutes per flight from the T-DPI-s and A-DPI TTOT respectively. 2
> The average ATFM Delay Share Index at Munich is now 0.92. Prior to DPI integration, this value is
typically between 1.05 and 1.1 (for both locally implemented and non A-CDM airports).4
> Based on 2015 ATFM regulation volumes, it is estimated that DPI integration has saved approximately
19,800 minutes of ATFM delay, with an estimated tactical delay cost saving of €1.7 illion for aircraft
operators.
The performance improvements at Munich have been estimated to generate the following annual
savings based on 2014 traffic levels.
1 Based on an FMG / DFS joint study that considered 2005 and 2009 (years with comparable traffic volume and adverse weather days)
2 Derived from analysis of NMOC data comparing ETOT vs ATOT (pre A-CDM) and TTOT vs ATOT (post-CDM)
3 Derived from PRU data analysis
4 The ATFM Delay Share Index is the ratio of the proportion of total delay to the proportion of slots allocated to the airport for any one flow
restriction. A ratio of 1 indicates a fair proportion of delay for the number of slots allocated. This indicator has been generated using historical
ATFM delay from NMOC.
130 | Page

131 | Page

Airport-CDM Benefits Factsheet
Oslo Gardermoen (ENGM / OSL)
132 | Page
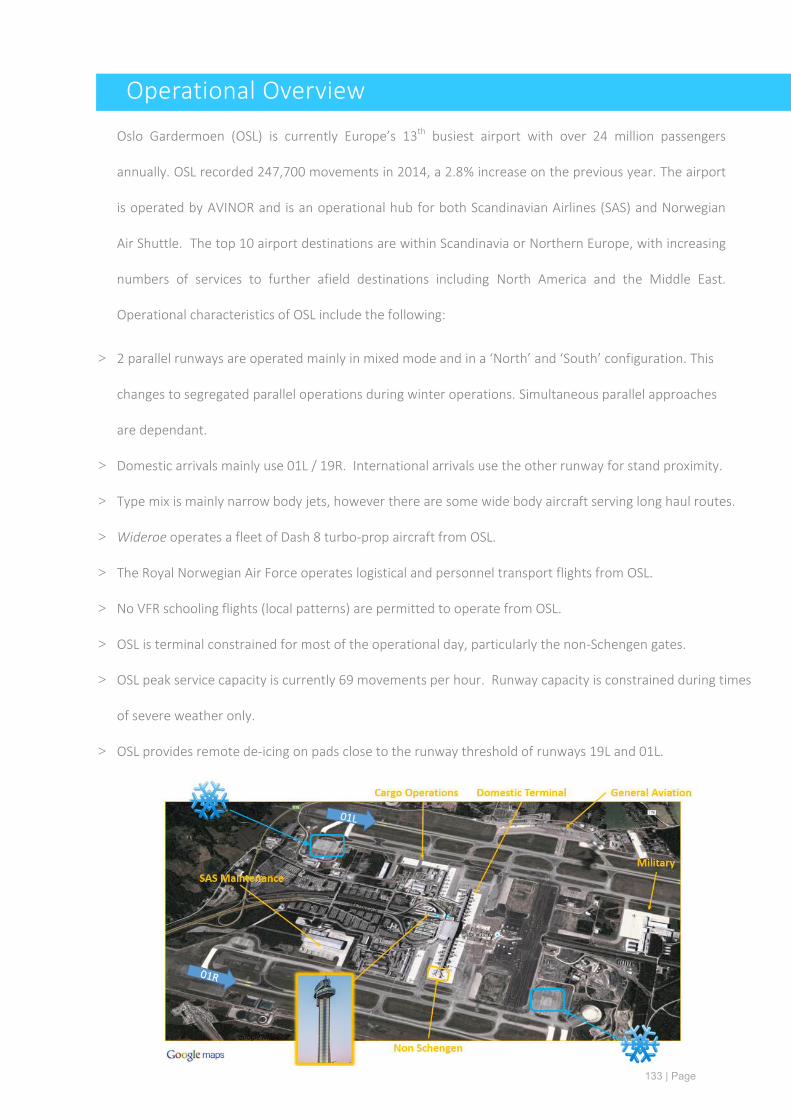
Operational Overview
Oslo Gardermoen (OSL) is currently Europe’s 13th busiest airport with over 24 million passengers
annually. OSL recorded 247,700 movements in 2014, a 2.8% increase on the previous year. The airport
is operated by AVINOR and is an operational hub for both Scandinavian Airlines (SAS) and Norwegian
Air Shuttle. The top 10 airport destinations are within Scandinavia or Northern Europe, with increasing
numbers of services to further afield destinations including North America and the Middle East.
Operational characteristics of OSL include the following:
> 2 parallel runways are operated mainly in mixed mode and in a ‘North’ and ‘South’ configuration. This
changes to segregated parallel operations during winter operations. Simultaneous parallel approaches
are dependant.
> Domestic arrivals mainly use 01L / 19R. International arrivals use the other runway for stand proximity.
> Type mix is mainly narrow body jets, however there are some wide body aircraft serving long haul routes.
> Wideroe operates a fleet of Dash 8 turbo-prop aircraft from OSL.
> The Royal Norwegian Air Force operates logistical and personnel transport flights from OSL.
> No VFR schooling flights (local patterns) are permitted to operate from OSL.
> OSL is terminal constrained for most of the operational day, particularly the non-Schengen gates.
> OSL peak service capacity is currently 69 movements per hour. Runway capacity is constrained during times
of severe weather only.
> OSL provides remote de-icing on pads close to the runway threshold of runways 19L and 01L.
133 | Page

Airport CDM Process
A-CDM @ OSL is managed within CDM Management Centre (CMC) located in the OSL operational
response centre. This unit is responsible for coordinating with respective functions to ensure the
quality of the A-CDM information, DPI performance and post-operational KPI reporting. Noteworthy
aspects of the OSL CDM implementation include:
> OSL has implemented an A-CDM Information Sharing (ACIS) platform that
integrates with local airport and ATC systems. Ground handlers can update the
TOBT of flights via their own systems and the A-CDM portal directly. An iPhone
application has also been developed to provide easy access to A-CDM
information by all ground handlers and aircrew.
> Very accurate TOBTs are generated automatically from the FUM and Arrival
Manager (AMAN) updates.
> TSATs are not generated to maximise runway capacity but provide queue support for the apron controllers.
> TSATs are provided and are available via the A-CDM portal and the airport docking system but are only
relayed to the crews over RT in case of delayed start-up.
> The A-CDM process is integrated with ATC Electronic Flight Strips workflow; this includes a «push and hold»
function for regulated flights, which ensures the possibility for a CTOT improvement even after the AOBT.
> There is no TOBT update limit, but an update must be a multiple of 5 minutes. This is manageable at OSL
since the sequencer is not so sensitive to TOBT updates.
> During adverse conditions (where TSAT is not equal to TOBT), late TOBT updates can cause problems for the
sequence stability. Fostering a culture of punctual TOBT updates is a current focus area of the A-CDM team.
> Off block timestamps are calculated as the taxi clearance time minus 3 minutes.
> De-icing process updates are provided from the integration with ATC electronic flight strips.
134 | Page

Qualitative Benefits
OSL has reported that A-CDM has provided common situational awareness and improved planning
capabilities stemming from early arrival time estimations and subsequent TOBT updates. For the
partners, this has led to the following operational benefits:
> Passengers have benefitted from fewer last minute stand changes owing to the improved predictability
of the inbound flight.
> Fewer occurrences of flights that are required to wait for occupied stands.
> Ground handler companies (including de-icing contractors) are able to manage their assets more
optimally. This has been well received given the tight turnaround times (30 minutes or less) for a large
proportion of OSL departures.
> Airlines operating shuttling flights have better visibility of schedule slippage and can proactively
mitigate reactionary delay.
AVINOR - the local TWR operator, have reported the following benefits:
> A-CDM information reduces ATC planning workload and thus avoids the
opening of an additional position during busy periods.
> During normal operations, the reduction in planning workload results in
more optimal and efficient levels of service.
> ATC / NMOC working relationship has improved which mitigates further
delay during periods of adverse conditions.
> CTOT allocations are more stable and achievable. Occasions when CTOTs
are unachievable or disruptive to other flights’ punctuality have reduced.
> AVINOR also reported a more controlled working environment – with fewer surprises and workload
spikes in managing the manoeuvring area.
> The integration of TTOTs into the AMAN (Arrival Manager) have improved RWY planning for arrivals
and departures – reducing the workload for TWR and approach sectors controllers.
> The flow of arrivals and departures is also optimized, with reduced delays at the runway holding point
and an improvements in safety.
135 | Page

Quantitative Benefits
Several operational improvements have been realised at Oslo since implementation of A-CDM in April
2012. Although 100% causality cannot be confirmed, it is thought that A-CDM has contributed to the
following performance improvements between January 2014 and January 2015:
> Arrival time accuracy has improved by 3.0 minutes to reach 2.5 minutes per arrival in 2015.1
> Taxi-out time has reduced by an average of 1.0 minute per departure during peak periods.1
> ATFM slot adherence of 98% has been maintained despite increased traffic growth and regulation.2
> Off-block delay has reduced from an average of 8.4 to 7.8 minutes per departure in 2015.2
> Take-off time accuracy has reduced from an average of 3 minutes to 0.5 minutes per flight in 2015. 3
> Take-off time predictability (standard deviation of take-off accuracy) has reduced from 12.4 minutes to 5.5
minutes and 2.9 minutes per flight from the T-DPI-s and A-DPI TTOT respectively.3
> The average ATFM Delay Share Index at OSL decreased from 1.02 to 0.85, resulting in 15,500 less ATFM
delay minutes with an estimated tactical delay saving of €1.48 million for aircraft operators in 2015. 4
The performance improvements at Oslo have been estimated to generate the following annual savings based
on 2014 traffic levels.
1 Analysis of OSL Airport Data
2 Performance Review Commission Performance Review 2013 & 2014
3 Derived from analysis of NMOC data comparing ETOT vs ATOT (pre A-CDM) and TTOT vs ATOT (post-CDM)
4 The ATFM Delay Share Index is the ratio of the proportion of total delay to the proportion of slots allocated to the airport for any one flow
restriction
136 | Page

137 | Page

Airport-CDM Benefits Factsheet
Paris Charles-De-Gaulle LFPG / CDG
138 | Page

Paris Charles-De-Gaulle
Operational O er ie
In 2014, Paris Charles-De-Gaulle (CDG) was Europe s second usiest airport, generating o er 471,000 movements and processing 63.8 million passengers. CDG is Europe s second leading cargo operation by tonnage (after Frankfurt), and hosts a hub operation for Federal Express and Air France. CDG is
operated by Aeroports de Paris (ADP) and ATC services are provided by DSNA, the French national
ANSP. Other operational characteristics of CDG include:
> 2 pairs of parallel runways operate independently in an Easterly or Westerly (preferred) configuration
depending on the wind direction. 08R/26L and 09L/27R (further from the terminals) are used for
arrivals whilst 08L/26R and 09R/27L (nearer the terminals) are used for departures.
> 100km of taxiway connects the 4 runways with the 4 terminals and satellite buildings. CDG has 4
critical taxiway hotspots that connect the north and south runway pairs (indicated below).
> CDG operates in LVP for approximately 4% of the year.
> De-conflicting SID routings from the north and south runway pairs imposes departure capacity
constraints that depends on the departure mix. A large variety of types operate from CDG – 60% are
ICAO C class.
> Arrival flow separation minima can also impose notable capacity constraints during peak times.
> De-icing at CDG is on one of the 22 remote de-icing pads. FedEx operates 2 of these and ADP
operates the remainder, along with 2 on-stand de-icing units. 6 ground handler companies currently
operate at CDG.
139 | Page

Paris Charles-De-Gaulle
Airport CDM Process
CDG has developed both collaborative procedures and tools to ensure the predictability and
transparency of the airside operation at all times. This includes 2 daily operational meetings between
the main stakeholders and a fully equipped CDM cell for an improved collaborative response to
periods of adverse conditions. Elements of A-CDM @ CDG are outlined beneath.
> TOBT is first equal to the SOBT. There is no automatic TOBT calculated from linked inbound flight
progress.
> CDG has i ple ented a First Scheduled – First Ser ed approach here the SOBT takes priority over
the TOBT in the TSAT generation algorithm. This can result in TSAT moving both forward and
backwards.
> All flights at CDG must make a radio call in the TSAT window to declare that they are ready to push. If
the flight is within the TSAT window, the clearance delivery position will activate the flight (paper flight
strip is printed) and the flight is transferred to the apron or ground frequency for start-up / taxi
clearance.
> A flight will be removed from the departure sequence at TSAT + 5 TSAT + in the case of no IFR
clearance) if the flight has not called the clearance position to declare that they are ready to push.
> The TSAT is generated by ADP (airport operator) and published to the TWR. The TWR supervisor
provides the runway capacity, runway assignment and departure pressure as inputs to this process.
> There is no limit on the number of TOBT updates at CDG.
> Off-block timestamps are captured from a mixture of ACARS (Air France), manual ATC inputs and A-
SMGCS.
> The future implementation of stand VDGS will significantly improve the accuracy of these timestamps.
> Airlines that ha e registered for the DFLEX ser ice are able to re-order and prioritise their own flights
within the departure sequence.
> CDG has implemented monthly KPI reporting of TOBT accuracy, TSAT compliance and TSAT delay as
part of the operational steering function.
140 | Page

Paris Charles-De-Gaulle
Operational Benefits
Paris CDG became fully A-CDM implemented on the 16th
November. Although 100% causality cannot
be assured, it is thought that A-CDM has contributed to the following operational benefits:
> Improved utilisation of stands and gates – resulting in less stand congestion.
> Ground handlers benefit from the improved arrival time accuracy. Handlers match resources to the
actual demand rather than the scheduled demand.
> Passenger experience has improved owing to the improved turn success that is driven from better in-
block predictability and fewer late stand changes.
> The mean take-off accuracy has improved to an average of 2 minutes per departure. The standard
deviation of take-off accuracy has improved from 13 to 8 minutes.1
> Departure metering based on the TSAT has resulted in reduced line-up times.
> Taxi-times have reduced by an average of 2 minutes since the adoption of the TSAT procedure.2
These improvements translate to the following annual savings for Paris CDG and its CDM partners,
based on IFR traffic levels between January 2014 and January 2015.
1 Derived from analysis of NMOC data comparing ETOT vs ATOT (pre A-CDM) and TTOT vs ATOT (post-CDM)
2 The result of a study conducted by Aeroports de Paris (ADP)
141 | Page

Airport-CDM Benefits Factsheet
Prague LKP‘ / P‘G
142 | Page

Prague
Operational O er ie
Prague airport (PRG) generated 125,000 movements in 2015, making it the Czech ‘epu lic s ain international airport and the 34
th busiest airport in Europe by traffic. Between 1995 and 2015,
passenger numbers at Prague have increased from 3 million to 12 million and is reflected by the
significant enhancements made to both airside and landside infrastructure over that time. PRG is a hub
for both Czech airlines (CSA) and Travel Service (TVS) and is a base for several Wizzair aircraft. PRG is
operated by Prague Airport (which is owned by Czech Aero holding) and ATC services are provided by
ANS CR (which is owned by the Ministry of Transport). Other operational characteristics include:
> 2 runways – 06/24 and 12/30 which are operated in mixed mode. RWY 24 is the most commonly used
runway direction due to prevailing westerly winds. RWY capacity is 46 movements per hour.
> A departure and arrival peak between 1000 and 1100 generates a significant runway constraint at that
time.
> ICAO Category C aircraft are the ost co on traffic type to operate from PRG (> 90% of
movements).
> 61 parking stands including 7 cargo positions. Long haul flight slots are currently limited by stand
availability.
> CSA Handling and Menzies Aviation are the 2 main ground handler companies currently operating at
PRG.
> A GA terminal (Terminal 3) generates about 10-20 movements per day from the south of the airport.
> The exact configuration of the de-icing areas depends on the operational requirements at the time, but
99% of aircraft de-icing is performed remotely.
> Cargo terminals operated by Skyport and Menzies Aviation processed over 50,000 tonnes of freight in
2014.
> Prague airport is currently planning the construction of RWY 06R/24L, which will increase operational
capacity up to 75 movements per hour.
143 | Page

Prague
Airport CDM Process
The Airport CDM project at Prague was split into 3 implementation phases that started in 2008 with
information sharing, variable taxi times and the A-CDM process milestones (except TSAT). In 2011, both
pre-departure sequencing and A-CDM in adverse conditions was implemented. NMOC integration was
achieved on the 2nd
September 2015. Notable elements of the A-CDM process at PRG include:
> The airport calculates the estimated in-block time and integrates this time-stamp into many airport
resource planning functions – include stand allocation, bus and gate planning.
> The automatic TOBT is not used directly in the A-CDM process. Only manual TOBT will generate a TSAT.
> Depending on the operational settings, the pre-departure sequencer (PDS) accounts for the arrival flow
rate to automatically set the departure capacity within the sequencing algorithm.
> Flights are sequenced only after the manual TOBT update, but not before TOBT – 40 . There are no TOBT update limits set after sequencing. Flights that are close to their TSAT are protected from
subsequent delay caused by late sequence entries or TOBT changes of other flights.
> An alert is generated at EOBT – 25 minutes if a manual TOBT not be entered into the system. This alert
is communicated via the A-CDM web portal and possibly via email.
> At TSAT + 6 minutes, the TSAT is automatically delayed by at least by another 5 minutes if no start-up
request has been received. The flight is removed from the sequence (and TOBT deleted) if the start-up
request is not received at the new TSAT + 6 minutes.
> On contact stands, the TSAT and TOBT are displayed on the Visual Docking
Guidance System (VDGS).
> The handlers enter the de-icing request into the A-CDM system. They also enter
the actual de-icing start and actual finish times into the same system.
> Actual off-block timestamps are generated from the VDGS and A-SMGCS (for
remote stands).
144 | Page

Prague
Operational Benefits
Prague was the 17th
European airport to fully implement Airport CDM on 2nd
September 2015. The aims
of the project were to support the optimisation of airport resources and the harmonisation of the
apron operation to reduce the impact of delays and demand peaks. Although 100% cannot be
guaranteed, it is thought that A-CDM has contributed to some of the following operational benefits:
> Improvements to airport resource planning due to refined in-block estimations and off-block
predictability.
> Improved levels of safety due to reduced apron congestion, particularly during operational peaks.
> Taxi-out times have reduced by an average of 20 seconds per flight between 2010 and 2011.1
> Take-off time accuracy has reduced from an average of 7 minutes to 1.5 minutes per flight in 2015. 2
> Take-off time predictability (standard deviation of take-off accuracy) has reduced from 11.8 minutes to
5.5 minutes and 4.3 minutes per flight from the T-DPI-s and A-DPI TTOT respectively.2
> The average ATFM Delay Share Index at PRG decreased from 1.0 to 0.9, resulting in 11,600 less ATFM
delay minutes with an estimated tactical delay saving of €0.8 million for aircraft operators in 2015. 3
The performance improvements at Prague have been estimated to generate the following annual
savings based on 2014 traffic levels.
1 Derived from an analysis of comparable taxi-out instances in 2010 and 2011 - conducted by Prague airport.
2 Derived from analysis of NMOC data comparing ETOT vs ATOT (pre A-CDM) and TTOT vs ATOT (post-CDM)
3 The ATFM Delay Share Index is the ratio of the proportion of total delay to the proportion of slots allocated to the airport for any one flow
restriction. A ratio of 1 indicates a fair proportion of delay for the number of slots allocated. This indicator has been generated using historical
ATFM delay from NMOC.
145 | Page

Airport-CDM Benefits Factsheet
‘o e Fiu icino LI‘F / FCO
146 | Page

Rome Fiumicino
Operational O er ie
Rome Fiumicino (FCO) was Europe s 8th
busiest airport by movements in 2014, generating 312,000 IFR
movements and processing over 38 million passengers. More than 200 airlines flew to over 200
destinations in the sa e year, affir ing FCO s position as a strong international hub. FCO is a hub
operation for Alitalia and Vueling and has become a particular focus for low-cost carriers such as
EasyJet, Wizzair and Blue Air – who all operate fro the lo cost Ter inal . ATC ser ices are provided by ENAV and the airport is operated by the ADR Group, which also operates the nearby
Ciampino airport.
> In the optimum configuration, independent parallel approaches on 16L/R and departures are on RWY
25. The most penalising configuration is the use of 16R/34L (arrivals) and 25R (departures) – due to
the intersection of these 2 runways. 16R/34L may be used during daylight hours should a longer
runway be required.
> FCO provides on-stand de-icing but is most frequently affected by LVP (5 days annually) and
thunderstorms.
> During peaks, FCO can become stand constrained which limits the use of on-stand delay absorption.
> GA flights are only permitted to operate during night time hours. VFR flights are not permitted at
FCO.
> Type mix is mainly narrow body (A320 / B737 families). FCO serves several long-haul routes with twin
aisle aircraft, but they only represent about 20% of all movements. FCO hosts 2 daily flights of the
A380.
> Each runway has 2 holding positions to provide re-sequencing flexibility to controllers. Arrivals from
1 L use a dedicated ta i ay delta .
> 5 Ground handler companies compete for custom at FCO. TOBT update behaviour is thought to be
very good.
147 | Page

Rome Fiumicino
Airport CDM Process
FCO has fully implemented A-CDM since March 2014 and became locally implemented in October
2012. ENAV has integrated relevant A-CDM timestamps (TOBT / TSAT) within the current ATC working
positions whilst the TWR supervisor has a separate function for setting runway configurations and
departure capacity within the A-CDM platform. Other features of the A-CDM implementation at Rome
Fiumicino include:
> FCO produces automatic TOBT estimations based on the estimated landing time of the linked inbound
flight. FCO consumes ETFMS Flight Data (EFD) messages for this purpose – which is a richer alternative
to Flight Update Messages (FUM). Automatically generated TOBT will never override a manually
entered value.
> In the absence of a linked inbound flight and should the TOBT not be updated, the TOBT is set to the
EOBT in the flight plan.
> FCO distributes A-CDM information via a web-based portal. They are also in the process of developing
smart-phone applications to provide the most relevant information to the ground handlers.
> TSAT are published on the web-portal at TOBT – 40 minutes. After this, only three TOBT updates are
permitted before a local suspension. Ground handlers are warned that any attempt to further update
the TOBT after this limit will result in the removal from the departure sequence.
> All flights must report to an airport frequency that they are ready to push (with the tow in place)
efore TOBT + 5 . The Flight Control Unit (FCU) uses cameras to verify that the aircraft is fully ready
before releasing the flight to ATC.
> ATC only talks to flights that are ready to push. Aircrew monitor the delivery frequency to await start-
up clearance or notification of additional delay. Pilots receive SSR code, Standard Instrumental
Departure and departure route together with the start-up clearance.
> The TWR will not receive the flight if there is a discrepancy between TOBT and the EOBT, unless the
flight is regulated. In this case, the airline is not forced to update the EOBT for fear of an extended
ATFM delay slot.
> FCO is currently implementing an ADS-B powered geo-fencing solution to provide automatic off-block
detection for remote stands.
148 | Page

Rome Fiumicino
Qualitati e Benefits
During the trial phase of A-CDM, Rome FCO recorded some significant operational benefits. Since the
spring of 2014, FCO has been subject to extensive WIP, the arrival of a new major airline customer
and severe operational disruptions due to fires - both on and off the airfield. During this challenging
period of operations, Rome FCO has noted the following benefits of A-CDM:
> ATC workload is reduced during busy periods through sequencing support, elimination of REA
messages and improved situational awareness of runway apron and runway demand. This translates
to a more optimum service for the airlines, including improved levels of safety.
> Departing RWY capacity is particularly difficult to set at FCO due to the intersecting runway
configuration, WIP and peak arrival / departure wave interaction during the day. TWR supervisors are
able to set hourly departure rates within the PDS to minimise runway holding and maximise stand
a aila ility during hu -in operations.
> The accuracy of take-off time estimates sent to NMOC has improved significantly – by as much as 60%
during normal operations and 85% during periods of adverse conditions.
> Estimated landing time updates are providing improved arrival time predictability that is supporting
the ground handlers in the allocation of resources. This is particularly important at FCO where the
aircraft must be ready with a tow in place before they can be released to ATC for clearance and push.
> FCO departures can no longer receive a regulation after pushing from stand. This a particularly
important at FCO where high amount of traffic interaction and WIP could make such cases difficult to
manage.
149 | Page

Rome Fiumicino
Quantitati e Benefits
Several operational improvements have been realised at FCO since the implementation of A-CDM in
October 2012. Although 100% causality cannot be confirmed, it is thought that A-CDM has
contributed to the following performance improvements:
> Taxi-out time has reduced by an average of 3 minutes per departure over the initial trial period.1
> Despite significant traffic increases and taxiway works, taxi-out times at FCO remained stable in
2014.2
> Despite an increases in the number of ATFM slots, ATFM adherence has increased from 88% in 2013
to 90% in 2014.2
> Take-off time accuracy has reduced from an average of 9.8 minutes to 2 minutes per flight in 2015.3
> Take-off time predictability (standard deviation of take-off accuracy) has reduced from of 14.0
minutes to 3.9 minutes per flight in 2015.3
> The average ATFM Delay Share Index at FCO decreased from 0.97 to 0.82, resulting in 13,400 less
ATFM delay minutes with an estimated tactical delay saving of €1.1 million for aircraft operators in
2015.4
The performance improvements at Rome Fiumicino have been estimated to generate the following
annual savings based on 2014 traffic levels.
1 ENAV analysis of Rome FCO airport movement data
2 Derived from an analysis of PRU data
3 Derived from analysis of NMOC data comparing ETOT vs ATOT (pre A-CDM) and TTOT vs ATOT (post-CDM)
4 The ATFM Delay Share Index is the ratio of the proportion of total delay to the proportion of slots allocated to the airport for any one flow
restriction.
150 | Page

151 | Page

Airport-CDM Benefits Factsheet
Stuttgart EDDS / ST‘
152 | Page

Stuttgart
Operational O er ie
Stuttgart airport (STR) is currently Ger any s 6th busiest airport, generating 114,000 movements and
processing 10.5 million passengers in 2015 - an 8.2% increase on the previous year. STR is a focus
airport for Air Berlin and a base for 12 Eurowings aircraft. Air Traffic services are provided by DFS and
the airport is operated by Flughafen Stuttgart GmbH (FSG). Operational characteristics of STR include:
> STR operates a single runway, which constitutes the main operational constraint, particularly during
the morning departure wave. 65% of departures are to the west from RWY 25.
> STR is restricted by a night curfew that restricts movements between 11pm and 6am local time.
> STR operates 4 terminals with a common gate infrastructure. The airport has 8 connected stands and
40 remote stands serving scheduled / charter flights from the north apron.
> A significant amount of GA and schooling flights operate from STR. A cargo operation and U.S Army
base is located on the south apron. IFR training flights are not usually permitted at peak times.
> De-icing is performed by 2 de-icing contractors on 4 remote de-icing pads south of the northern
apron.
> Depending on the weather conditions, some flights may be forced to depart on RWY 07 due to high
ground to the west of the airfield. ATC may also grant a RWY 07 departure to reduce taxi-time or
reduce the risk of a holdover exceedance after de-icing.
> ICAO code letter C are the most common aircraft types to operate scheduled flights from STR.
> 3 companies currently hold licenses to perform ground handling at Stuttgart – excluding the GA
terminal.
153 | Page

Stuttgart
Airport CDM Process
Since Stuttgart airport is currently unable to plan for the construction of a second runway, Airport-
CDM was implemented as part of a local programme designed to make best use of available airport
infrastructure. As part of the German Harmonisation Group, many of the A-CDM processes and ATC
interfaces are harmonised across all of Germany s CDM airports. Notable elements of the A-CDM
implementation at STR include:
> The TOBT is automatically generated from the linked inbound flight when this arrival leg is 12 minutes
from touchdown, but is not published until TOBT – 90 at the earliest.
> AO are alerted to discrepancies between the TOBT vs EOBT, however this alert does not block the A-
CDM process or subsequent ATC clearance.
> For stands equipped with a visual docking guidance system, the TOBT timestamp is shown from TOBT -
60 follo ed y the TSAT when the TOBT is reached.
> A specific alert (CDM41) is raised for flights that submit a de-icing request whom do not have a
contract in place with a de-icing provider. Alert CDM42 is raised if the requested provider fails to
confirm after 10 minutes. The flight will not be sequenced without a confirmed de-icing provider.
> TOBTs are entered via the Common Situational Awareness Tool or via an interface with AO / GH
systems. Only 3 updates are permitted after the flight is sequenced.
> Stuttgart has implemented an alert (CDM17) to notify that the TTOT is later than the night curfew and
that start-up clearance may not be granted as a result.
> TOBT and TSAT are integrated into the Tower Flight Data Processing System (TFDPS). The colours of
these fields change to provide a visual reference to the clearance delivery position that the flight is
eligible for start-up clearance.
> C-DPI are sent to NMOC in the response to a deleted TOBT, but only if the flight is not updated with a
new TOBT within 2 minutes of the deletion.
154 | Page

Stuttgart
Operational Benefits
Although 100% causality cannot be confirmed, it is thought that A-CDM has contributed to the
following performance improvements at Stuttgart:
> Taxi-out times have reduced by an average of 20 seconds per flight.1
> Take-off time accuracy has reduced from an average of 3.5 minutes to 30 seconds per flight in 2015.1
> Take-off time predictability (standard deviation of take-off accuracy) has reduced from of 12.6
minutes to 5.6 minutes and 4.2 minutes per flight from the T-DPI-s and A-DPI TTOT respectively.1
> Both ATC and the airport operator agreed that improved situational awareness combined with a
regulated start-up procedure and est fitting CTOTs i pro es oth the handling of and recovery
from periods of adverse conditions.
> In 2014, the average monthly ATFM slot adherence had increased by 4% to reach 97% in 2014.3
> The average ATFM Delay Share Index at STR decreased from 1.05 to 0.85, resulting in 11,900 less
ATFM delay minutes with an estimated tactical delay saving of €0.87 million for aircraft operators in
2015.4
The performance improvements at Stuttgart have been estimated to generate the following annual
savings based on 2014 traffic levels.
1 Reported by the airport operator as part of their own investigation into local A-CDM benefits.
2 Derived from the analysis of NMOC data comparing ETOT vs ATOT (pre A-CDM) and TTOT vs ATOT (post-CDM)
3 Derived from PRU data analysis.
4 The ATFM Delay Share Index is the ratio of the proportion of total delay to the proportion of slots allocated to the airport for any one flow
restriction. A ratio of 1 indicates a fair proportion of delay for the number of slots allocated. This indicator has been generated using
historical ATFM delay from NMOC.
155 | Page

Airport-CDM Benefits Factsheet
Venice Marco Polo LIP) / VCE
156 | Page

Venice Marco Polo
Operational O er ie
Venice Marco Polo (VCE) is the 5th
busiest airport in Italy with over 8 million passengers annually. VCE
recorded 77,700 movements in 2014, a 3.2% decrease on the previous year although the passenger
count had increased by 1%. The airport is operated by the SAVE Group, with aerodrome ATC services
provided by ENAV. VCE is an operational hub for Volotea, a Spanish low cost airline whilst the dominant
carrier at VCE is EasyJet - accounting for 15% of all IFR movements. As of April 2016, EasyJet will base 4
aircraft at VCE, contributing to further growth. Other operational characteristics of VCE include:
> Single runway mixed mode operations (04R/22L) generates a capacity of 30 movements per hour.
> The seasonal variation in traffic demand is significant. Average daily movements increase from 140 to
300 between the winter and summer periods.
> Type mix is 80% narrow body jets, 10% wide body (B777/B767) and 10% business jets.
> VCE has only 7 terminal connected stands, all others are remote.
> The field is susceptible to Low Visibility Procedures (LVP), reducing capacity from 30 to 12 mvts per
hour.
> Most sequencing of departures is managed at the pushback phase, which can be challenging given the
high amount of traffic interaction and variation in pushback / engine start time for different aircraft
types.
> Departures on 04 heading to the North East must turn back right and fly back over the airfield to avoid
the Treviso CTR. This is the other airport in Venice which serves mainly low cost carriers Ryanair and
Wizzair.
> De-icing of flights is commonplace for the morning wave between November and February. Most de-
icing is done on the remote pad near runway 4R and restricts departure capacity to just 6 movements
per hour.
157 | Page
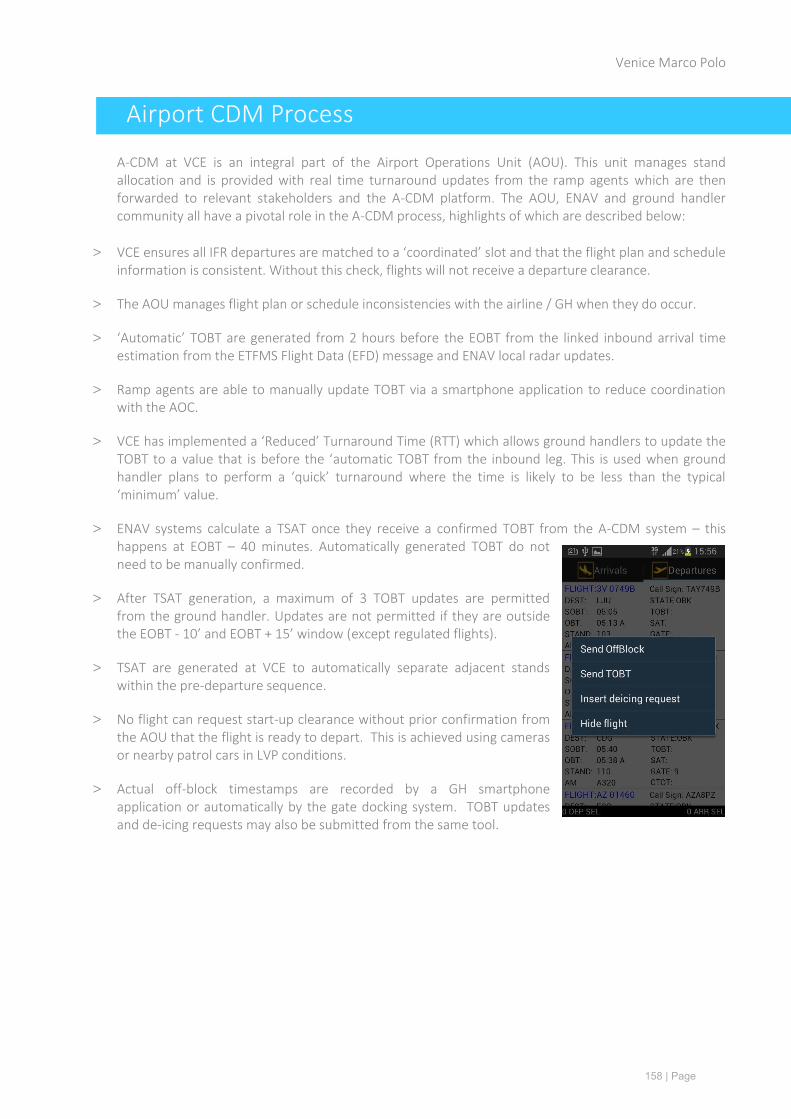
Venice Marco Polo
Airport CDM Process
A-CDM at VCE is an integral part of the Airport Operations Unit (AOU). This unit manages stand
allocation and is provided with real time turnaround updates from the ramp agents which are then
forwarded to relevant stakeholders and the A-CDM platform. The AOU, ENAV and ground handler
community all have a pivotal role in the A-CDM process, highlights of which are described below:
> VCE ensures all IF‘ departures are atched to a coordinated slot and that the flight plan and schedule information is consistent. Without this check, flights will not receive a departure clearance.
> The AOU manages flight plan or schedule inconsistencies with the airline / GH when they do occur.
> Auto atic TOBT are generated from 2 hours before the EOBT from the linked inbound arrival time
estimation from the ETFMS Flight Data (EFD) message and ENAV local radar updates.
> Ramp agents are able to manually update TOBT via a smartphone application to reduce coordination
with the AOC.
> VCE has i ple ented a ‘educed Turnaround Ti e ‘TT hich allo s ground handlers to update the
TOBT to a alue that is efore the automatic TOBT from the inbound leg. This is used when ground
handler plans to perfor a uick turnaround here the ti e is likely to e less than the typical ini u alue.
> ENAV systems calculate a TSAT once they receive a confirmed TOBT from the A-CDM system – this
happens at EOBT – 40 minutes. Automatically generated TOBT do not
need to be manually confirmed.
> After TSAT generation, a maximum of 3 TOBT updates are permitted
from the ground handler. Updates are not permitted if they are outside
the EOBT - 10 and EOBT + 15 indo except regulated flights).
> TSAT are generated at VCE to automatically separate adjacent stands
within the pre-departure sequence.
> No flight can request start-up clearance without prior confirmation from
the AOU that the flight is ready to depart. This is achieved using cameras
or nearby patrol cars in LVP conditions.
> Actual off-block timestamps are recorded by a GH smartphone
application or automatically by the gate docking system. TOBT updates
and de-icing requests may also be submitted from the same tool.
158 | Page

Venice Marco Polo
Qualitati e Benefits
VCE has been locally implemented with A-CDM since May 2013. Since then, SAVE has reported that A-
CDM has had the following impact on their operation:
> Improved arrival time predictability is a real benefit for the stand allocation unit and the ground
handlers whom are now able to assign limited resources to better ensure that all arrival flights are met.
> The accuracy of the TOBT when compared to the EOBT / SOBT has enabled a more efficient allocation
of ground resources and improved forward planning.
> Gate information is issued earlier given the improved confidence in the on-block time and push-back
time predictability. The FIDS is driven by some A-CDM information elements.
> Equipment availability and utilisation is a major operational constraint for the GH community. The A-
CDM process has supported the most efficient use of these limited resources.
> More flights are being held on stand to absorb delay – promoting both fuel burn and environmental
emissions reductions.
For ENAV, the local TWR operator, they have reported the following
benefits resulting from A-CDM:
> The TWR has an increased situational awareness of future runway demand
which can be used to avoid large departures queues during arrival peaks.
> CTOT adherence is supported via the TSAT process and improved support
channels with NMOC.
> TOBT / EOBT consistency checks are no longer performed by the TWR but
handled automatically by the system. This feature of the A-CDM system
has had a notable impact on controller workload especially during peak
periods.
> The main TWR system is a derivative of the ENAV Flight Data Processing
(FDP) system. With A-CDM, controllers are able to identify much earlier those aircraft that will never be
activated. This is particularly important during LVP when the airport capacity could reduce to 6
departures / hour and valuable slots could have been allocated to ghost flights.
159 | Page

Venice Marco Polo
Quantitati e Benefits
Several operational improvements have been realised at Venice since the implementation of A-CDM in
May 2013. Although 100% causality cannot be confirmed, it is thought that A-CDM has contributed to
the following performance improvements:
> Taxi-in time has reduced by an average of 30 seconds to reach 5.0 minutes per departure in 2015.2,1
> Taxi-out time has reduced by an average of 40 seconds to reach 10 minutes per departure in 2015.2,1
> Take-off time accuracy has reduced from an average of 4.5 minutes to 30 seconds per flight in 2015.3
> Take-off time predictability (standard deviation of take-off accuracy) has reduced from of 12.3 minutes
to 8 minutes per flight in 2015.3
> The average ATFM Delay Share Index at VCE decreased from 1.05 to 0.72 almost immediately after
connecting to the network, more than any other CDM airport after connection.4
> This has resulted in 13,100 less ATFM delay minutes with an estimated tactical delay saving of €1
million for aircraft operators in 2015.
The performance improvements at Venice have been estimated to generate the following annual
savings based on 2014 traffic levels.
1 Analysis of VCE Airport Data
2 Analysis of PRU Data
3 Derived from analysis of NMOC data comparing ETOT vs ATOT (pre A-CDM) and TTOT vs ATOT (post-CDM)
4 The ATFM Delay Share Index is the ratio of the proportion of total delay to the proportion of slots allocated to the airport for any one flow
restriction. A ratio of 1 indicates a fair proportion of delay for the number of slots allocated. This indicator has been generated using historical
ATFM delay from NMOC.
160 | Page

161 | Page

Airport-CDM Benefits Factsheet
)urich LS)H / )‘H
162 | Page

Zurich
Operational O er ie
Set at the foot of the Swiss Alps, Zurich Airport (ZRH) is the 11th
busiest airport in Europe, recording
over 257,000 IFR movements in 2014 - an increase of 0.8% on the previous year. Tower and local
approach services are provided by Skyguide. The airport is an operational hub for Swiss International,
Edelweiss Air, Helvetic Airways and Air Berlin (Belair). Most of the services operating from ZRH are to
major European cities, however there are a significant number of flights to North America and the Far
East. Operational characteristics of Zurich include:
> 3 runways which are most commonly operated in segregated mode. Most typically, runway 14 is used
for arrivals whilst 16 and 28 are for departures. Long haul departures mainly use RWY 16 due to
insufficient length of runway 28.
> Almost 88% of scheduled / charter movements are operated by narrow body aircraft, whilst wide
body aircraft representing the remaining 12%. Approximately 13% of the overall ZRH departures are
general aviation and business flights.
> ZRH is runway constrained for significant periods of the day. During winter operations, the bottleneck
can shift depending on the demand for aircraft de-icing, which can be performed either on-stand or
remotely.
> All departures from runway 16 must immediately turn left due to noise abatement procedures. This
constrains arrival capacity onto runway 14 due to a conflict with the missed approach path.
> Due to the location of the airport, ZRH is also subject to movement restrictions over German airspace.
163 | Page

Zurich
Airport CDM Process
The Airport CDM milestone process has been implemented at ZRH since May 2012, with DPI
operations since August 19th
2013. A-CDM information is stored in the AODB and made visible to all
participating stakeholders. ZRH operates an Operations Steering Centre, which comprises all the
major stakeholders at ZRH within a single operational cell. Notable elements of the A-CDM process at
ZRH include:
> ZRH has integrated A-CDM with the standard practise for managing delay. ETDs entered into the AODB
by all Ground Handlers or Aircraft Operators are used to generate a TOBT. In the absence of a delay,
TOBT = SOBT.
> Automatic TOBTs are generated from the final approach point when the ELDT + EXIT + MTTT are later
than the current SOBT / TOBT value.
> There is no update limit set on the number of TOBT updates, to ensure consistency with current
processes of updating ETD. At TOBT – 40 minutes, the TSAT is issued by the Departure Manager
(DMAN).
> The TOBT is always considered as the end of the ground handling phase and does not include the de-
icing process for on-stand de-icing.
> Pilots must call for their enroute clearance at EOBT +/- 15 minutes. If there is no call before TSAT, the
TSAT will be postponed for 10 minutes. Failure to request start-up for a second time will trigger a C-
DPI to be sent to NMOC if no new TOBT is received within 10 minutes.
> In case of a delay of 15 minutes or more, airlines will be prompted (via an alert) to file a CHG/DLA
message. Regulated flights are not subject to the same constraint.
> Apron controllers call the flight for start-up within the TSAT window – but only if enroute clearance
has been issued by clearance delivery.
> The off-block event is captured by ACARS (Swiss only) and also by Apron controller inputs into the
electronic flight strip system.
164 | Page

Zurich
Qualitati e Benefits
A-CDM at ZRH has been integrated within the current turnaround workflows to introduce only minor
changes to the current delay update procedures. This approach has fostered a quick adoption of A-
CDM and has thought to have yielded some significant benefits since implementation, some of which
are as follows:
> Last minute stand changes have reduced owing to the improved predictability of the inbound flight.
> Flight Activity Monitoring (FAM) suspensions have reduced by an order of magnitude – these
occurrences are now quite rare due to the TTOT publication to NMOC.
> The Departure Manager (DMAN) and de-icing module supports ATC in maximising the runway
capacity and optimising the utilisation of aircraft de-icing facilities and equipment.
> Tower workload has reduced in communicating with FMP or manually sending READY (REA)
messages. This is now automatically handled through the provision of T-DPI-s messages directly to
NMOC.
> The integration of the de-icing module has increased the transparency and predictability of the
overall process for all stakeholders.
> The de-icing process as once an operational lack hole with little or no feedback that could be
integrated into turnaround planning or runway capacity optimisation. The integration of accurate de-
icing time estimates and progress milestones has had a big impact on improving resource and asset
utilisation during winter operations.
> Skyguide FMP noted that the accuracy of departure times and sector load charts has been
significantly improved - especially during winter operations.
165 | Page

Zurich
Quantitati e Benefits
Several operational improvements have been realised at Zurich since the implementation of A-CDM
in May 2012. Although 100% causality cannot be confirmed, it is thought that A-CDM has contributed
to the following performance improvements at ZRH:
> Taxi-out time has reduced by an average of 40 seconds per flight.1
> ATFM slot adherence has increased from 85% in 2013 to 90% in 2014.2
> The average ATFM Delay Share Index at ZRH decreased from 1.1 to 0.85, resulting in 20,500 less
ATFM delay minutes with an estimated tactical delay saving of €1.9 million for aircraft operators in
2015.3
> Take-off time accuracy has reduced from an average of 6.0 minutes to 20 seconds per flight in 2015.4
> Take-off time predictability (standard deviation of take-off accuracy) has reduced from of 14.6
minutes to 3.9 minutes per flight in 2015.4
The performance improvements at Zurich have been estimated to generate the following annual
savings based on 2014 traffic levels. This infographic also includes the annual savings resulting from
the DARTS DMAN implementation in 2004.
1 Analysis of ZRH Airport Data
2 Performance Review Commission Performance Review 2013 & 2014
3 The ATFM Delay Share Index is the ratio of the proportion of total delay to the proportion of slots allocated to the airport for any one flow
restriction. A ratio of 1 indicates a fair proportion of delay for the number of slots allocated. This indicator has been generated using
historical ATFM delay from NMOC.
4 Derived from analysis of NMOC data comparing ETOT vs ATOT (pre A-CDM) and TTOT vs ATOT (post-CDM)
166 | Page


© March 2016 - European Organisation for the Safety of Air Navigation (EUROCONTROL)
This document is published by EUROCONTROL for information purposes. It may be copied
in whole or in part, provided that EUROCONTROL is mentioned as the source and it is not
used for commercial purposes (i.e. for financial gain). The information in this document may
not be modified without prior written permission from EUROCONTROL.
www.eurocontrol.int
EUROCONTROL
EUROCONTROL
A-CDM Impact Assessment
A-C
DM
Impact A
ssessment Fin
al Report
Final Report
March 2016
March
2016
Covers_A-CDM Assessment.indd 1 11/04/16 08:52